spatial analysis of soil fertility for site-specific crop management
TRANSCRIPT

DIVISION S-8-NUTRIENT MANAGEMENT& SOIL & PLANT ANALYSIS
Spatial Analysis of Soil Fertility for Site-Specific Crop ManagementM. D. Cahn,* J. W. Hummel, and B. H. Brouer
ABSTRACTSpatial patterns of soil properties and nutrient concentrations need
to be characterized to develop site-specific farming practices that matchagricultural inputs with regional crop needs. The spatial variation ofsoil organic C (SOC), soil water content (SWC), NO3-N, PO4-P, andK were evaluated in the 0- to 15-cm layer of a 3.3-ha field (TypicHaplaquoll and Argiaquic Argialboll) cropped with maize (Zea maysL.) and soybean [Glycine max (L.) Merr.]. The range of spatial correla-tion was determined from semivariance analyses of the data and wasfound to vary among and within fertility parameters. Nitrate had theshortest correlation range «5 m) and SOC had the longest (>180 m),whereas SWC, PO4-P, and K had intermediate spatial correlationranges. In addition, SOC was found to have small-scale spatial varia-tion nested within large-scale spatial variation. The spatial pattern ofNOj-N changed with time. Frequency distributions of SOC and SWCwere close to normal, whereas the distributions of NOj-N, K, andPO4-P data were skewed. Median polishing detrending and trimmingof outlying data were useful methods to remove the effects of nonsta-tionarity and non-normality from the semivariance analysis. The re-sults suggest that reducing sampling intervals from 50 to 1 m wouldreduce the variance of SWC, SOC, NO3-N, PO4-P, and K estimatesby 74, 95, 25, 64, and 58%, respectively. A useful sampling patternfor characterizing the spatial variation of several soil properties-nutrients and scales should be random with sample spacing as closeas 1 m and as far apart as the longest dimension of the field.
SOIL PROPERTIES AND SOIL NUTRIENTS often vary acrossa field such that uniform fertilizer applications may
result in over- and underfertilized areas. Runoff andleachate from overfertilized areas may contaminate watersupplies, while crop yield may be restricted in underfer-tilized areas. To reduce this source of application error,maps of soil productivity and variable rate applicators,interfaced with navigational and computer control sys-tems, are used to match agricultural inputs with site-specific crop needs. In addition to equipment innovations,statistical methods that can accurately summarize spatialpatterns of soil data are needed to determine site-specificapplication rates.
Geostatistics, originally used in the mining industry(Matheron, 1963), has proven useful to soil sciencefor characterizing and mapping spatial variation of soilproperties. Geostatistics consists of variography and krig-ing. Variography uses semivariograms to characterizeand model the spatial variance of data, whereas kriging
M.D. Cahn and J.W. Hummel, USDA-ARS Crop Protection ResearchUnit, 1304 W. Pennsylvania Ave., Urbana, 1L 61801; and B.H. Brouer,Institut fur Landwirtschaftliche Verfahrenstechnik, Max-Eyth Str. 6,2300Kiel, Germany. Received 26 July 1993. ""Corresponding author([email protected]).
Published in Soil Sci. Soc. Am. J. 58:1240-1248 (1994).
uses (Burgess and Webster, 1980) the modeled varianceto estimate values between samples. Details about variog-raphy and kriging are well documented (Burgess andWebster, 1980; Matheron, 1963), and specifics aboutusing kriged values to develop maps for site-specificfarming can also be found in the literature (Mulla, 1991;Mulla, 1989). However, few works have focused onusing variography for estimating parameters importantto site-specific fanning, such as the optimum dimensionsof application zones and distance between soil samples,and even fewer works have discussed using variographyfor predicting the agronomic benefits of site-specificapplications.
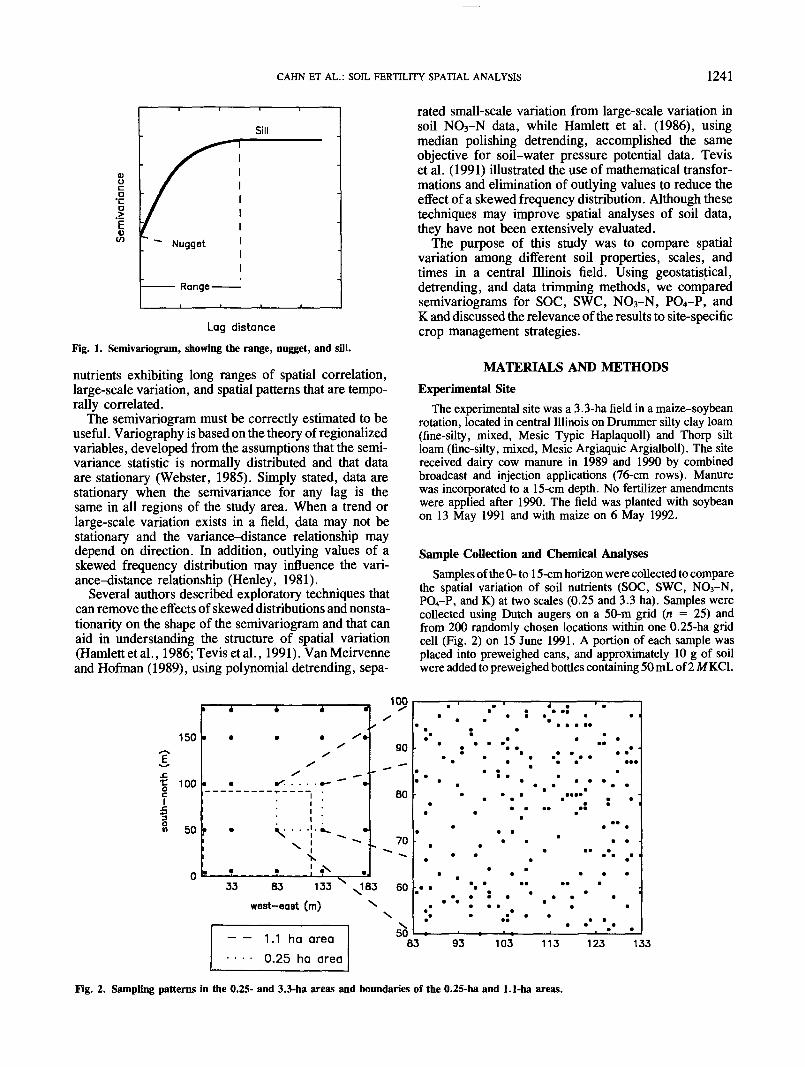
The semivariogram illustrates the relationship betweenthe sample variance and the lateral distance, known as thelag, separating samples (Fig. 1). From this relationship,a lateral distance between samples can be chosen thatoptimizes sample variance and number of samples. Thelag distance where the variance approaches an asymptoticmaximum, known as a sill (Fig. 1), is the range acrosswhich data are spatially correlated (Clark, 1979). Asthe lag distance approaches zero, the variance usuallyapproaches a finite value, called the nugget variance(Burgess and Webster, 1980). The nugget representsresidual variation, not removed by close sampling. Hanet al. (1994) presented a mathematical procedure thatuses the variance-distance relationship, summarized bythe range, nugget, and sill, to optimize the dimensionsof the application zone.
The agronomic benefits of using site-specific cropmanagement practices are presumably related to the spa-tial patterns of soil properties and soil nutrient concentra-tions. Variography has been used to compare spatialvariation of soil properties, scales, and tunes. For exam-ple, semivariograms of soil properties have shown thatthe range of spatial correlation for PO4-P and K to beMOO m (Mulla, 1989; Webster and McBratney, 1987;Yost et al., 1982), in contrast to the 1- to 30-m rangereported for NOs-N (Dahiya et al., 1985; Van Meirvenneand Hofman, 1989; White et al., 1987). Variographyalso has been used to measure the range of spatial correla-tion of small- and large-scale variation (Gajem et al.,1981; Van Meirvenne and Hofman, 1989). Finally, VanMeirvenne and Hofman (1989) used variography to showthat the range of spatial correlation for NO3-N increasedas mean NOs~ levels decreased during fall and winter.Given the present limitations on accuracy of navigationsystems and applicators and cost of sample analysis,the benefits of spatial applications may be highest forAbbreviations: SOC, soil organic C; SWC, soil water content.
1240
CAHN ET AL.: SOIL FERTILITY SPATIAL ANALYSIS 1241
IDUc
_go
Sill
Nugget
Range -
Lag distanceFig. 1. Semivariogram, showing the range, nugget, and sill.
nutrients exhibiting long ranges of spatial correlation,large-scale variation, and spatial patterns that are tempo-rally correlated.
The semivariogram must be correctly estimated to beuseful. Variography is based on the theory of regionalizedvariables, developed from the assumptions that the semi-variance statistic is normally distributed and that dataare stationary (Webster, 1985). Simply stated, data arestationary when the semivariance for any lag is thesame in all regions of the study area. When a trend orlarge-scale variation exists in a field, data may not bestationary and the variance-distance relationship maydepend on direction. In addition, outlying values of askewed frequency distribution may influence the vari-ance-distance relationship (Henley, 1981).
Several authors described exploratory techniques thatcan remove the effects of skewed distributions and nonsta-tionarity on the shape of the semivariogram and that canaid in understanding the structure of spatial variation(Hamlett et al., 1986; Tevis et al., 1991). Van Meirvenneand Hofrnan (1989), using polynomial detrending, sepa-
rated small-scale variation from large-scale variation insoil NO3-N data, while Hamlett et al. (1986), usingmedian polishing detrending, accomplished the sameobjective for soil-water pressure potential data. Teviset al. (1991) illustrated the use of mathematical transfor-mations and elimination of outlying values to reduce theeffect of a skewed frequency distribution. Although thesetechniques may improve spatial analyses of soil data,they have not been extensively evaluated.
The purpose of this study was to compare spatialvariation among different soil properties, scales, andtimes in a central Illinois field. Using geostatistical,detrending, and data trimming methods, we comparedsemivariograms for SOC, SWC, NO3-N, PO4-P, andK and discussed the relevance of the results to site-specificcrop management strategies.
MATERIALS AND METHODSExperimental Site
The experimental site was a 3.3-ha field in a maize-soybeanrotation, located in central Illinois on Drummer silty clay loam(fine-silty, mixed, Mesic Typic Haplaquoll) and Thorp siltloam (fine-silty, mixed, Mesic Argiaquic Argialboll). The sitereceived dairy cow manure in 1989 and 1990 by combinedbroadcast and injection applications (76-cm rows). Manurewas incorporated to a 15-cm depth. No fertilizer amendmentswere applied after 1990. The field was planted with soybeanon 13 May 1991 and with maize on 6 May 1992.
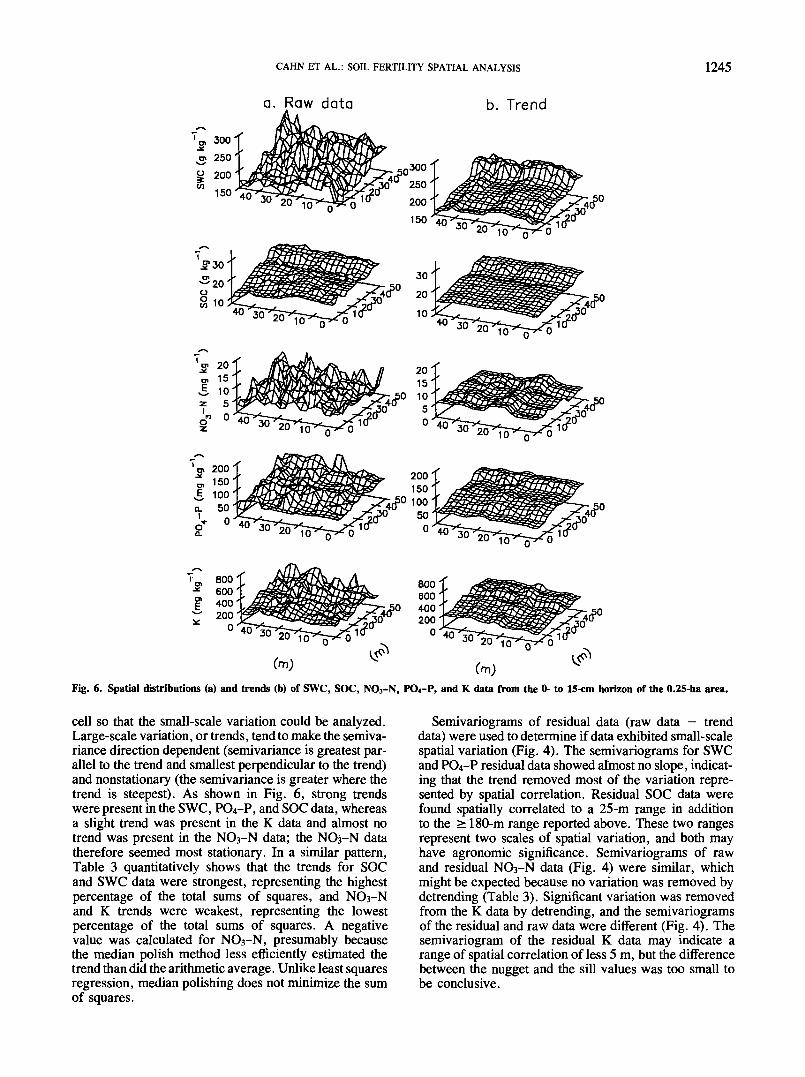
Sample Collection and Chemical AnalysesSamples of the 0- to 15-cm horizon were collected to compare
the spatial variation of soil nutrients (SOC, SWC, NO3-N,PO4-P, and K) at two scales (0.25 and 3.3 ha). Samples werecollected using Dutch augers on a 50-m grid (n = 25) andfrom 200 randomly chosen locations within one 0.25-ha gridcell (Fig. 2) on 15 June 1991. A portion of each sample wasplaced into preweighed cans, and approximately 10 g of soilwere added to preweighed bottles containing 50 mL of 2 MKC1.
150
f 100c.
50
100
90
BO
70
33 83 133 X183 60
west-east (m) ^
— — 1.1 ha area• • • • 0.25 ha area
83 93 103 113 123 133
Fig. 2. Sampling patterns in the 0.25- and 3.3-ha areas and boundaries of the 0.25-ha and 1.1-ha areas.

1242 SOIL SCI. SOC. AM. J. , VOL. 58, JULY-AUGUST 1994
The remainder of the sample was air dried for determinations ofSOC, PO4-P, and K. Soil in cans was oven dried 48 h at105°C for gravimetric determination of SWC. Soil organic Cwas measured by dry combustion in an induction furnace.Samples were extracted with Bray No. 1 (0.025 M HC1 and0.03 NrLF) at a 10:1 solution/soil ratio. The extracts wereanalyzed for K by flame emission using an atomic spectropho-tometer and analyzed for PO4-P by a Mo blue-ascorbic acidcolorimetric method using a flow injection system (Lachat QuikChem AE, Lachat Instruments, Milwaukee, WI). Potassiumchloride extracts were analyzed for NO3-N using the cop-perized Cd reduction method described by Keeney and Nelson(1982) and the Lachat flow injection system. Calculations ofsoil nutrient concentrations were adjusted for the initial watercontent of the soil.
Spatial patterns of soil NOs-N in early and late spring of1992 were also compared. Because the results of the 1991samples indicated that soil NOs-N data were noisy, the sam-pling pattern was changed. Samples of the 0- to 15-cm horizonwere collected using a hand probe from 120, 6 by 15 m cells(1.1-ha area) 13 May and 15 June 1992 (Fig. 2). Compositesof six subsamples from the central 3 by 11 m of each cellwere added to preweighed cans for gravimetric determinationof SWC, and approximately 20 g were added to bottles con-taining 100 mL of 2 M KC1. Soil extracts were analyzedcolorimetrically for NO3-N as described above.
Statistical AnalysisNormality of the data was examined by kurtosis and skew-
ness tests (Table 1). See Snedecor and Cochran (1980) fordetailed descriptions of kurtosis and skewness tests. In caseswhere distributions showed significant kurtosis and skewness(P < 0.01), data greater than four standard deviations fromthe mean (highest 1-1.5% of the data) were discarded.
Isotropic (direction independent) semivariance of data wascalculated using GS+ geostatistical software (Gamma DesignSoftware, 1993). Semivariance is defined in the followingequation:
[1]r[2m(h)]i = l
where y is the semivariance for m data pairs separated by adistance of h, known as a lag, and Z is the value at positionsXi and Xi + h (Matheron, 1963; Webster, 1985).
Lag widths and maximum lag distances were selected sothat the minimum number of data pairs per lag class was 52,112, and 38 for the 0.25-, 1.1-, and 3.3-ha areas, respectively.Many data and lags were used in the analysis so that the rangeof spatial correlation (distance to the sill) could be visuallyestimated from the semivariogram. The ranges of spatial corre-lation are summarized in Table 2.
The relationship between the sample variance and the dis-tance between samples was summarized by comparing thevariances of the minimum and maximum lags:
Ay = (Ymax ~ Ymin) X 100 [2]
where y^ is the semivariance of the minimum lag distance,Ymax is the semivariance of the maximum lag distance, and Ayexpresses the percentage reduction in the semivariance whenthe interval between samples is reduced from the maximumlag to the minimum lag distance (Table 2). The semivariancedirectly relates to the sample variance. In fact, Webster (1985)demonstrated that the semivariance is derived from the samplevariance S2:
S [Z -n- 1 [3]
where Z is the mean of n data. For a pair of data (n = 2)separated by a distance h:
S2 = [Z(x) -Z]2 + [Z(x + h)-Zf
S2 = - Z(x + h)]2
[4]
[5]
The term on the right side of Eq. [5] equals Eq. [1] wherethe number of data pairs, m, = 1. Raw data from the 0.25- and1.1-ha areas were detrended using median polishing software ofMan (1993). See Tukey (1977), Hamlett et al. (1986), andCressie et al. (1990) for detailed descriptions of median pol-ishing. The procedure blocked the 0.25-ha area into a grid of100 25-m2 cells and the 1.1-ha area into a grid of 60 183-m2
cells. Median polishing removed the median row and columnvalues from the raw data through successive iterations untilconvergence was attained. The median polishing algorithmmodeled the trend effects as:
Table 1. Statistical summary of soil data from the 0.25-, 1.1-, and 3.3-ha areas in central Illinois.Variable Average SD Max. Mta. Kurtosist Skewnesst
0.25-ha and 3.3-ha areas§
SWC1sociNO3-NPO4-PK
NO3-N MayNO3-N June
225225
225225225
120120
194.317.2
6.274.0
268.2
8.31.6
29.02.8
3.726.8
114.9
2.30.82
-S "6 ————————————291.124,6
mg kg"1 ————————29.2
226.3905.8
1.1-ha areas25.44.3
141.88,7
0.924.9
112.9
0.80.4
3.12.9
10.57.0
11.0
25.43.3
0.620.01
2.021.242.23
3.280.83
t Data showed significant kurtosis (P < 0.01) if values were >3.98 or <2.37 for the 0.25- and 3.3-ha areas and >4.24 or <2.24 for the 1.1-ha area (Snedecorand Cochran, 1980, p. 492).
t Data showed significant skewness (P < 0.01) if values were X).382 for the 0.25- and 3.3-ha areas and 0.508 for the 1.1-ha area (Snedecor and Cochran,1980, p. 492).
§ Data from the 0.25- and 3.3-ha areas were pooled.J SWC = soil water content; SOC = soil organic C.

CAHN ET AL.: SOIL FERTILITY SPATIAL ANALYSIS 1243
Table 2. Semivariance statistics of soil data from 0.25-, 1.1-, and 3.3-ha areas in central Illinois.0.25-ha area 3.3-ha area
Variable
swc#soc#
NOj-NPO4-PK
NOj-N
Yiot. . _ j
430.000.86
mg2kg"2*"6 o
7.24404.57
5265.80
Y6.T
———— mg2 kg"2
2.38
Y50mt
1682.0018.00
9.441129.0012610.0
1.1-ha area
Y93o,t
2.90
AY§
74.4494.44
23.3164.1758.24
May
AY
18.10
Ranged
ma 50>50
mg2 kg-2 ———5
2:5030-50
Range
m35
Y4S,»t
4.100.22
5.25393.47
4206.60
Y«»t
0.67
Y.«»t, _2
AY
8.71 52.931.08 79.63
6.48 18.98383.14 -2.70
4646.80 9.471.1-ha area June
2Y93n,t
mrr2 lrfr~2mg- Kg0.84
AY
20.24
Rangem135
£180
-tt
Range
m
t Semivariance of the minimum lag distance.$ Semivariance of the maximum lag distance.§ Comparison of semivariances of minimum and maximum lags: AY = [(Ymax - Ymin)/Y™x] x 100.1 Range of spatial correlation, determined from the semivariograms in Fig. 4 and 6.# SWC = soil water content; SOC = soil organic C.ft Range of spatial correlation could not be determined from the semivariograms in Fig. 4 and 6.
rk
1=1,. ...q [6]where for p rows and q columns, Z is the value of cell k, /,a is the general effect, r is the effect of row k, c is the effectof column /, and E is the residual error.
Residual data were calculated by subtracting the trend valueof each cell (the sum of a, r, and c) from the raw data. Sumsof squares of raw and residual data were calculated to estimatethe portion of variance represented by the trend (Table 3).Isotropic semivariances of the residuals were calculated todetect small-scale spatial variation.
RESULTSExploratory Analysis
Nitrate, K, and PO4-P data sets were highly skeweddue to several outlying values that greatly exceeded themean, whereas SOC and SWC data followed nearlysymmetric, normal distributions (Table 1). These highvalues may represent sites of high microbial activity orlocalized accumulations of nutrients. The shape of thesemivariogram was found biased by values greater thanfour standard deviations from the mean. The semivario-grams of the NOs-N and K data from the 0.25-ha area
Table 3. Sum of squares statistics of soil data from 0.25- and 1.1-haareas in central Illinois.
Sum of squares
Source
swctsoctNOj-NPO4-PK
NO3-N MayNOj-NJune
n
200200197J198*197t
119$120
Total
169804.61312.92015.8
119366.41861382.3
366.579.7
Pe
Trend Residual repi
0.25-ha area90885.2 78919.4
992.3 320.6- 37.9 2053.7
46809.9 72556.5690448.3 1170934.01.1-ha area
36.818.1
329.761.6
rcentage of sumof squares
resented by trend
53.575.6
-1.939.237.1
10.022.7
t SWC = soil water content; SOC = soil organic C.| Outlying data were discarded.
(Fig. 3) exhibited a quadratic shape, indicating that datawere most correlated at small and large lag distances.These variograms appeared to depart from the classicalnugget-sill model presented in Fig. 1. Removal of datathat were four standard deviations greater than the mean,(highest 1.5% of the data) eliminated the quadratic shapeof the NOs-N and K semivariograms (Fig. 4). Additionaltrimming of the data (removal of highest 3 % of the data)did not significantly change the shape of the semivario-
NO,
20
01E 15
Icf
10
«. •*..•••*• •*•*•.,
- 2 0 2 4 6Standard Deviation
<DO 0 10 20 30 40 50
Lag distance (m)
I/)20000
io>
N^ 15000
J!x.
10000
V
K I °'2
I °''•5 0.0K
v'v.-• .y• •
"•*"
k2 0 2 4 6
Standard Deviatio
•
•••
10 20 30 40Lag distance (m)
50
Fig. 3. Semivariograms and frequency distributions of NO3-N andK data from the 0- to 15-cm horizon of the 0.25-ha area beforetrimming outlying data.

1244 SOIL SCI. SOC. AM. J. , VOL. 58, JULY-AUGUST 1994
ocO
IDGO
} 1500S
"o, 1000
S 500
0*" 18's"S 10
2
if* 15S
No»
zlnd° ez 5
r^'o. 12004
J, BOOD.I
o* 400
Raw Data 600
400
200
3
2
1
015
10
10 20 30 40 50
600
400 »j
200
0
8000
6000
4000
2000
Residual Data
Residual Data
Residual Data
Residual Data
Residual Data
10 20 30 40 50
Lag distance (m)
Fig. 4. Semivariograms of raw and residual SWC, SOC, NO3-N,PO4-P, and K data from the 0- to 15-cm horizon of the 0.25-haarea (residual data = raw data — trend data).
grams presented in Fig. 4 (data not presented), demon-strating that only the extreme values needed to be trimmedto ascertain the shape of the semivariogram. Hence, thehighest 1.5% of NO3-N and K data and highest 1% ofPO4-P data were not included in the following analyses.
Comparison of Soil Fertility PropertiesExamination of the Semivariograms of the raw data
in Fig. 4 showed that the range of spatial correlationvaried among soil properties. Within the intensely sam-pled 0.25-ha cell, K was spatially correlated to a distance>30 m. Nitrate had the shortest range of spatial correla-tion (<5 m). The semivariance for SWC increased withdistance without reaching a sill in the 0.25-ha cell. Similarresults were obtained for SOC and PO4-P, suggestingthat the range of spatial influence was >50 m for thesesoil properties.
In the 3.3-ha area, the semivariance of SWC reacheda sill near 140 m (Fig. 5), whereas semivariance of SOCdata increased without approaching an asymptotic valueat the maximum lag distance (180 m). Semivariance ofPO4-P reached a maximum at 100 m and then decreased.Possibly a trend following a quadratic or second degreepolynomial function would cause data of the shortestand the longest lag distances to be most correlated.Consistent with the variograms from the 0.25-ha areas,the semivariance for NO3-N and K in the 3.3-ha fieldwas constant with lag distance, indicating that data werenot spatially correlated across distances >50 m.
The Semivariograms also illustrate that sampling at
.̂-̂ 1000
'S 800
"Is 600
S 400
200
rS
oo
ocD
'i_D
1(Din
30
20
10
10
8
a.
o*
600
400
200
8000
1C T 6000
"o. 4000
~^ 2000
40 90 140 190
Lag distance (m)Fig. 5. Semivariograms of the raw SWC, SOC, NO3-N, PO4-P, and
K data from the 0- to 15-cm horizon of the 3.3-ha area.
small intervals may improve the estimates of SOC andSWC more than estimates of other soil parameters. Forexample, sampling at 45-m intervals instead of 180-mintervals hi the 3.3-ha area would reduce the varianceof SWC and SOC estimates by 53 and 80%, respectively(Table 2, Fig. 5). Sampling at 1-m instead of 50-mintervals in the 0.25-ha area may further reduce thevariance of SWC and SOC estimates (Table 2). In con-trast, the variance of NO3-N estimates would be reducedby <24% in the 0.25-ha area and 20% in the 3.3-haarea by sampling at the minimum lag distances (Table2). The amount that the sample variance would decreasedue to reducing the lateral distance between samplesmay depend on the shape of the semivariogram. Reducingthe interval between samples from 50 to 35 m wouldreduce the variance of PO4-P estimates by 47% butwould not reduce the variance of NO3-N estimates (Fig.4).
Nested Spatial VariationMedian polish detrending was useful for removing
large-scale spatial variation from data of the 0.25-ha
CAHN ET AL.: SOIL FERTILITY SPATIAL ANALYSIS 1245
a. Raw data b. Trend
Fig. 6. Spatial distributions (a) and trends (b) of SWC, SOC, NO3-N, PO4-P, and K data from the 0- to 15-cm horizon of the 0.25-ha area.
cell so that the small-scale variation could be analyzed.Large-scale variation, or trends, tend to make the semiva-riance direction dependent (semivariance is greatest par-allel to the trend and smallest perpendicular to the trend)and nonstationary (the semivariance is greater where thetrend is steepest). As shown in Fig. 6, strong trendswere present in the SWC, PO4-P, and SOC data, whereasa slight trend was present in the K data and almost notrend was present in the NO3-N data; the NOa-N datatherefore seemed most stationary. In a similar pattern,Table 3 quantitatively shows that the trends for SOCand SWC data were strongest, representing the highestpercentage of the total sums of squares, and NOs-Nand K trends were weakest, representing the lowestpercentage of the total sums of squares. A negativevalue was calculated for NO3-N, presumably becausethe median polish method less efficiently estimated thetrend than did the arithmetic average. Unlike least squaresregression, median polishing does not minimize the sumof squares.
Semivariograms of residual data (raw data — trenddata) were used to determine if data exhibited small-scalespatial variation (Fig. 4). The semivariograms for SWCand PO4-P residual data showed almost no slope, indicat-ing that the trend removed most of the variation repre-sented by spatial correlation. Residual SOC data werefound spatially correlated to a 25-m range in additionto the > 180-m range reported above. These two rangesrepresent two scales of spatial variation, and both mayhave agronomic significance. Semivariograms of rawand residual NOs-N data (Fig. 4) were similar, whichmight be expected because no variation was removed bydetrending (Table 3). Significant variation was removedfrom the K data by detrending, and the semivariogramsof the residual and raw data were different (Fig. 4). Thesemivariogram of the residual K data may indicate arange of spatial correlation of less 5 m, but the differencebetween the nugget and the sill values was too small tobe conclusive.

1246 SOIL SCI. SOC. AM. J., VOL. 58, JULY-AUGUST 1994
• raw dataO residual data
raw dataO residual data
20 40 60 80 100
Lag distance (m)
120
Fig. 7. Spatial distributions and semivariograms of raw and residual NO3-N data (0-15 cm) from the 1.1-ha area in May and June 1992.
Time Effects on Spatial Variation of Soil NitrateSpatial variation of soil NOs-N changed significantly
during the spring of 1992. Soil concentrations of NOs-N in the 0- to 15-cm depth decreased from an averageof 8.3 to 1.6 mg kg"1 between 13 May and 15 June1992 (Fig. 7, Table 1). A significant portion of the NO3-N may have been leached to lower depths, denitrified,or absorbed by the maize crop before the June sampling.The NOs-N levels of May and June were weakly corre-lated (/? = 0.24). The shape of the semivariograms forNO3-N (Fig. 7) also changed between May and June.The semivariogram for NOa-N reached a sill at <30 min May, whereas in June, the semivariance was constantwith increasing lag distance until 60 m where the varianceincreased to a maximum value at 90 m. This increasein variance was presumably due to large-scale variation,because detrending produced a flat residual semivario-gram, known as a pure nugget effect, (Fig. 7, Table 3),which indicates an absence of spatial correlation. Incontrast, detrending of the May data removed little varia-tion (Table 3) and did not significantly change the semiva-
riogram shape (Fig. 7), suggesting that most of the spatialvariation was small scale. These results indicate thattuning of soil sampling could influence maps of soilNOs-N, used to estimate site-specific application ratesof N fertilizer.
DISCUSSIONAlthough the data are a limited representation of the
spatial variation of soil fertility hi central Illinois, theyillustrate several points relevant to spatial analysis ofsoil data and site-specific crop management.
Proper estimation of the semivariogram is essentialfor characterizing the spatial patterns of soil nutrients.The semivariogram is based on the assumptions that thesemivariances are normally distributed and that the dataare stationary. Although the data of this study did notalways satisfy these assumptions, the combination ofmedian polish detrending and trimming of outlying valuesreduced nonstationarity and increased normality of theraw data. Logarithmic or 4th root transformation of thedata may remove much of the effects of skewness and

CAHN ET AL.: SOIL FERTILITY SPATIAL ANALYSIS 1247
kurtosis (Cressie and Hawkins, 1980), but residual outli-ers would still bias the estimates of the mean semivariancecalculated with Eq. [1]. Hamlett et al. (1986) noted thatsome researchers advocate detrending data with polyno-mials, but this method assumes that nonstationarity isdeterministic when in fact, it may also have a stochasticcomponent (Davidoff et al., 1986). Median polishingcan remove both deterministic and stochastic componentsof nonstationarity, and therefore, may be more flexiblethan polynomials. However, median polishing is a non-parametric method without a statistical procedure fortesting the significance of fitted trends.
Nonstationary and outlying data may also reduce theaccuracy of maps of soil properties. Han et al. (1993)suggested that a good approach for mapping soil proper-ties where data exhibit large-scale variation would be(i) detrend the data by median polishing, (ii) model thevariance-distance relationship of the residual data, (iii)develop kriged estimates of the residual values at unsam-pled locations from the modeled variance, and (iv) addthese estimated values back to the trend. In addition tothis procedure, our results would suggest that removingoutlying data may aid in modeling the variance-distancerelationship. Other methods, such as universal kriging,also have been proposed to account for nonstationarity.Webster and Burgess (1980) discussed some limitationsof using universal kriging for estimating soil properties.
These results showed Siat soil fertility parameters haddifferent ranges of spatial correlation within the samefield. The different ranges of spatial correlation for nutri-ents may be related to the mobilities of the ions. Nitrate,the most mobile of the three ions of this study, had theshortest range of spatial correlation, whereas PO4-P,presumably the least mobile, was spatially correlatedacross the longest distance. In addition, spatial distribu-tion of PO4-P appeared to be correlated with SOC.Semivariograms of PO4-P and SOC from the 0.25-hacell were similar in shape (Fig. 4), the raw data exhibitedsimilar trends (Fig. 6), and the PO4-P and SOC datawere correlated (r = 0.56).
The results also indicated that some soil parameterswill be more difficult to use for site-specific soil manage-ment than others. Specifically, soil NO3-N may havelimited applications for site-specific crop management.First, because the spatial patterns of soil NO3-N maynot be correlated across long time intervals, the intervalbetween sampling and application may need to be short.A short range of spatial correlation imposes additionalapplication and sample limitations. With a 5-m rangeof spatial correlation (data from the 0.25-ha area), anapplicator traveling at 8 km h"1 would need to modulatefertilizer rates every 2.25 s to match N fertilizer ratesto soil NOs-N levels. Also, sampling at this correlationrange would require 400 samples ha"1 to develop anaccurate soil NO3-N map. Thus, modulating N fertilizerrates to match soil NO3-N levels may not be economicalwithout using an automated system for real-time measure-ment of soil NO3-N. Several researchers are developingautomated systems that can conduct real-time measure-ments of NO3-N levels in the plow layer (Adsett andZoerb, 1991; Birrell and Hummel, 1992). Even if thesesystems could reduce measurement intervals from 50 to
1 m, the results of this study show that the variance ofsoil NO3-N data may not decrease by more than 25%.
In contrast, SWC, SOC, PO4-P, and K showed prom-ise as variables for site-specific crop management. Soilmoisture information may be used for varying seed plant-ing depth, SOC data for regulating soil-applied herbiciderates or estimating N mineralization potential, and PO4-P and K tests for estimating P and K fertilizer rates.Currently, sensors are being developed for automatedmeasurement of moisture (Christensen and Hummel,1985; Price et al., 1990), SOC (Sudduth et al., 1991),and K (Cardwell et al., 1988; Tsukada et al., 1990) sothat data collection might be economical at a small scale.These results indicate that reducing measurements froma 50- to a 1-m scale would reduce variation of SWC,SOC, PO4-P, and K data by 74, 94, 64, and 58%,respectively. Even sampling intervals of larger distances,such as 10 m, would still reduce the variance associatedwith these variables. Timing soil sampling for analysisof SOC, PO4-P, and K may not be as critical as for NO3-N because these variables presumably change slower withtime than does NO3-N.
The correlation between soil parameters and the fertil-izer requirements of a crop also needs to be consideredwhen discussing the agronomic benefits of site-specificsoil applications. Varying N fertilizer rates as a functionof soil NO3-N concentrations would be agronomicallybeneficial only if soil NO3-N is an indicator of plantavailable N. Studies in several locations in the USA haveshown that pre-sidedress levels of NO3-N in the plowlayer are correlated with maize grain yield (Blackmeret al., 1989; Binford et al., 1992; Brown et al., 1992;Meisinger et al., 1992). Very little information is avail-able to compare variable rate and conventional technolog-ies for applying fertilizers. Side-by-side comparisonshave shown that less fertilizer could be applied withvariable rate than with conventional applications withoutyield loss (Mulla et al., 1992), but these studies do notpreclude the possibility that the fertilizer rates employedmay have exceeded the needs of the crop. In such studies,fertilizer efficiency could also be increased by reducingconventional application rates.
Additionally, these results demonstrate that samplingpatterns used for manual collection of soil samples need toaccommodate the variety of ranges of spatial correlationassociated with different soil properties. Perhaps the mostflexible pattern would be random locations with samplesas close as 1 m and as far apart as the longest dimensionof the field. Grid patterns are easiest to set up butrequire more samples than do random patterns to measurevariances of small lag distances. Alternatively, intenselysampling one or several grid cells to measure the vari-ances of small lag distances, as was done in this study,biased results to particular regions of the field. Withimproved and less expensive geographical positioningsystems becoming available, sampling on random pat-terns in large areas may become feasible.
CONCLUSIONSThe results of this study demonstrate that within the
same field, spatial patterns may vary among several soil

1248 SOIL SCI. SOC. AM. J., VOL. 58, JULY-AUGUST 1994
fertility parameters, scales, and times. Although thisstudy characterized the spatial patterns of soil fertilityat a single location in central Illinois, the results illustratesome useful concepts relevant to site-specific crop man-agement: (i) Variography can be a useful tool for design-ing effective soil sampling strategies, for establishingthe dimensions of application zones, and for screeningsoil fertility variables for use in site-specific applications,(ii) Median polish detrending and data trimming tech-niques, used together with variography and kriging, mayimprove characterizations of spatial variation and accu-racy of soil productivity maps, (iii) Soil sampling patternsneed to be flexible to accurately characterize the spatialpatterns of several soil properties.
ACKNOWLEDGMENTSThe authors thank Teresa Holman for conducting the organic
carbon analyses.