spatial analysis and modeling
TRANSCRIPT
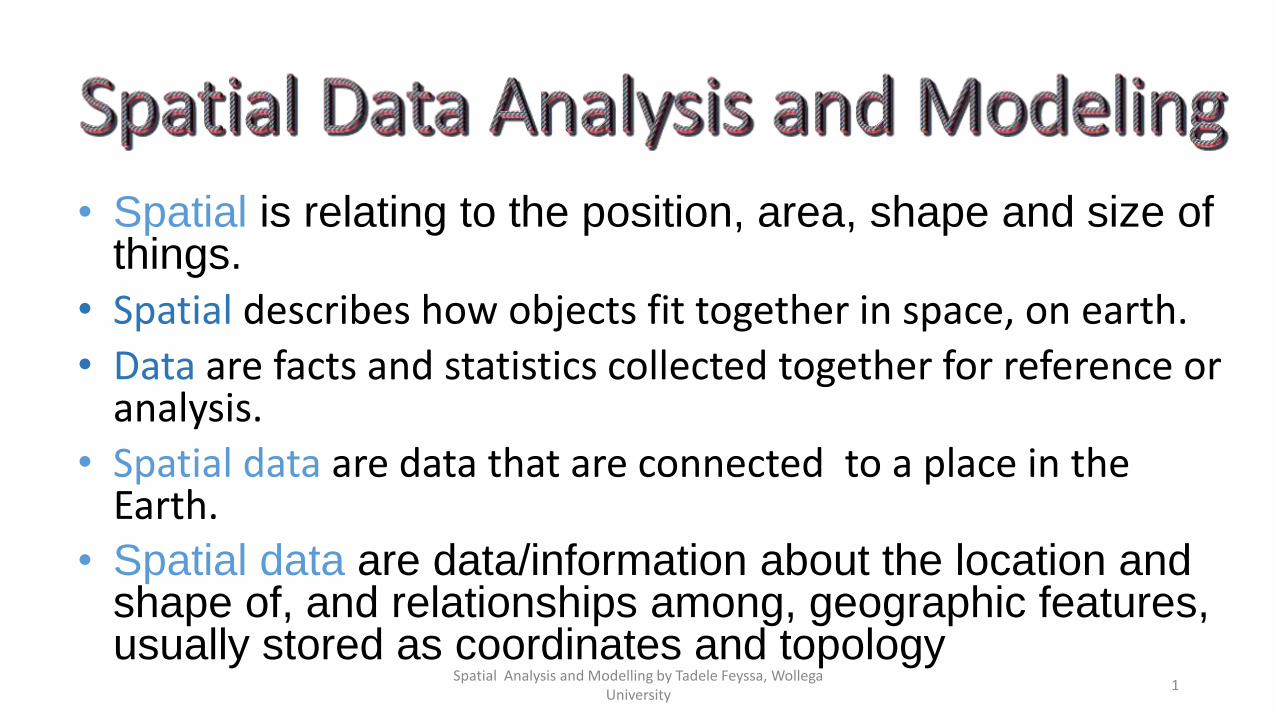
• Spatial is relating to the position, area, shape and size of things.
• Spatial describes how objects fit together in space, on earth.
• Data are facts and statistics collected together for reference or analysis.
• Spatial data are data that are connected to a place in the Earth.
• Spatial data are data/information about the location and shape of, and relationships among, geographic features, usually stored as coordinates and topology
1Spatial Analysis and Modelling by Tadele Feyssa, Wollega
University

• Principally, there are three spatial data components that need to be stored for GIS data:
geometric data,
thematic data, and
a link identification (ID) for the geometric and the thematic component.
2Spatial Analysis and Modelling by Tadele Feyssa, Wollega
University
Spatial data link between the geometric component
(which deals with the location of the data by means, for
example, of a reference coordinate system) and the
thematic component (it provides the attribute values of
the data, e.g. names, and other identifiers (IDs) of the
data).
Object or feature needs to be geometrically and
thematically described 3Spatial Analysis and Modelling by Tadele Feyssa, Wollega
University

• Components of Spatial Data
Spatial data
4Spatial Analysis and Modelling by Tadele Feyssa, Wollega
University

• All GIS software has been designed to handle spatial data.
• Spatial data are characterized by information about position connections with other features and details of non-spatial characteristics
5Spatial Analysis and Modelling by Tadele Feyssa, Wollega
University

SPATIAL DATA
SPATIAL NON-SPATIAL
Wolega University
ADDRESS NAME
Block 41
MAP DATABASE
Block 32
6Spatial Analysis and Modelling by Tadele Feyssa, Wollega
University
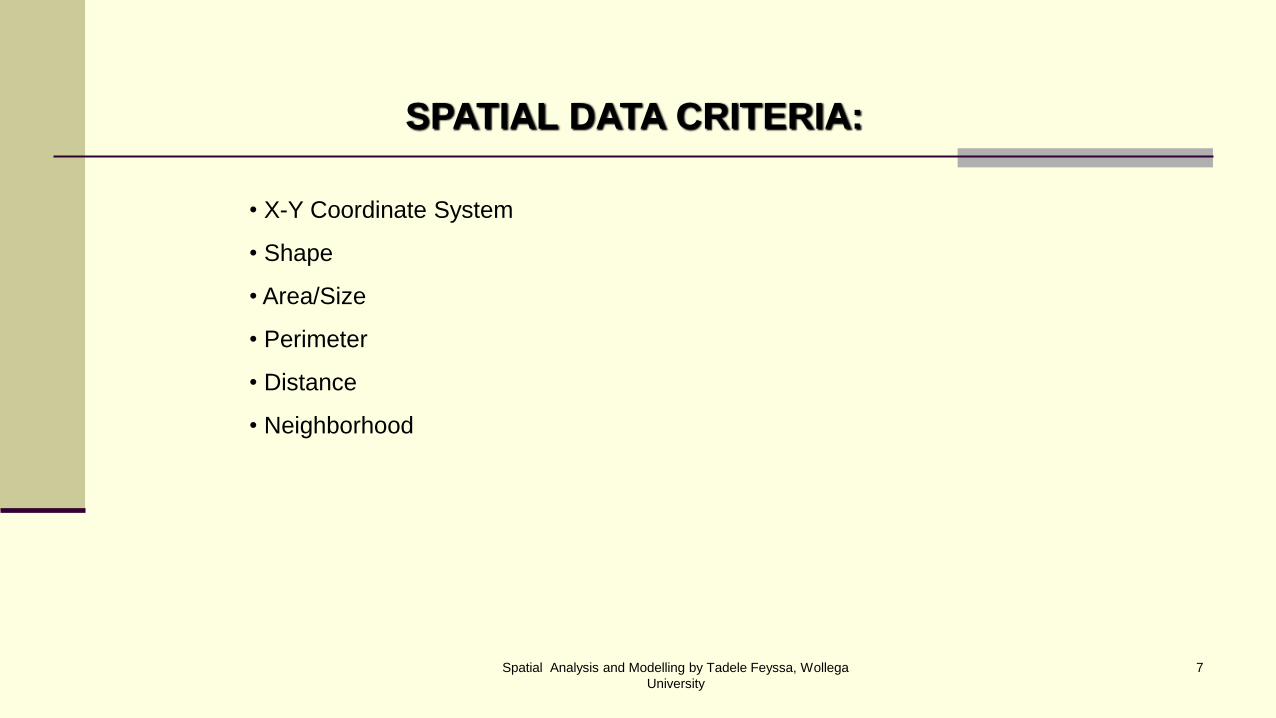
SPATIAL DATA CRITERIA:
• X-Y Coordinate System
• Shape
• Area/Size
• Perimeter
• Distance
• Neighborhood
7Spatial Analysis and Modelling by Tadele Feyssa, Wollega
University
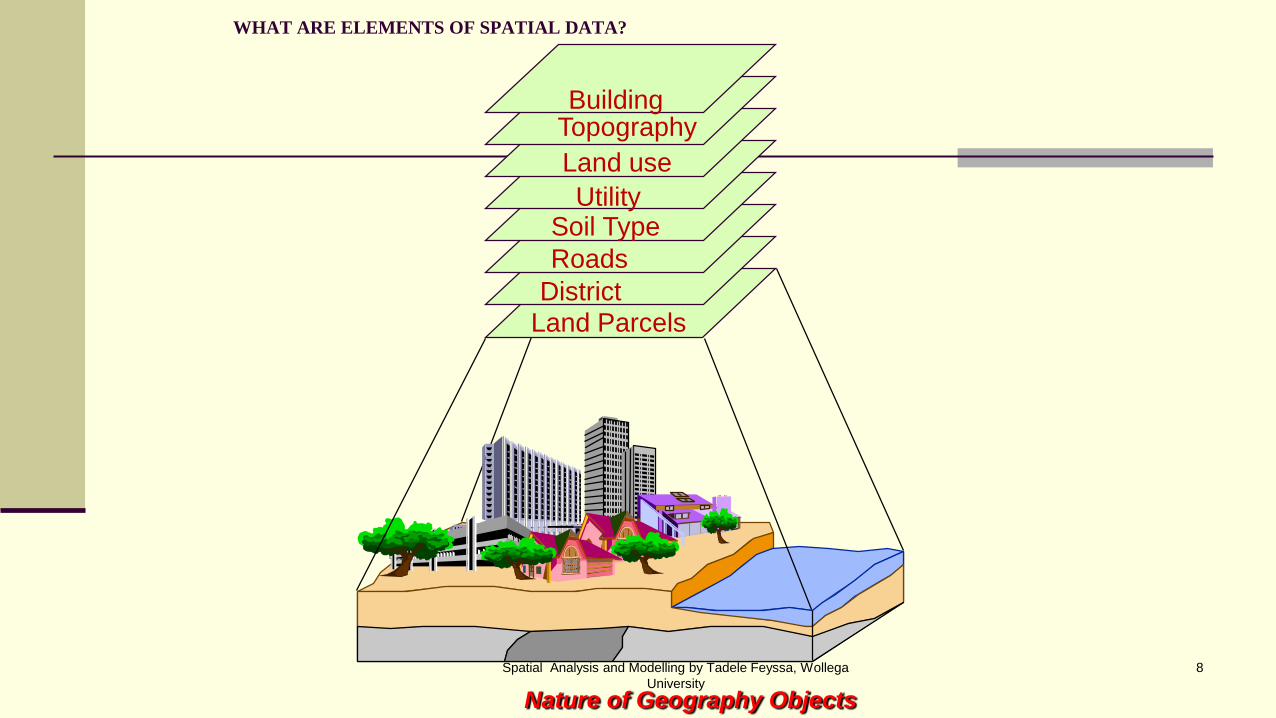
WHAT ARE ELEMENTS OF SPATIAL DATA?
BuildingTopography
Land use
UtilitySoil Type
Roads
District
Land Parcels
Nature of Geography Objects
8Spatial Analysis and Modelling by Tadele Feyssa, Wollega
University

ATTRIBUTES:
• Explains about spatial data
• Relevant non-spatial data
• Words or Numbers
• Qualitative methods
• Quantitative methods
9Spatial Analysis and Modelling by Tadele Feyssa, Wollega
University

NATURE OF SPATIAL DATA
(GEOGRAPHIC OBJECTS)
• spatial component
– relative position between objects
– coordinate system
• attribute component
– explains spatial objects characteristics
• spatial relationship
– relationship between objects
• time component
– temporal element
10Spatial Analysis and Modelling by Tadele Feyssa, Wollega
University
11
Analysis
Analysis is the process of inferring meaning from data.
Analysis is carried visually in a GIS
Analysis in a GIS can also be carried out by
measurements, statistical computations, fitting models to
data values other operation
Spatial Analysis and Modelling by Tadele Feyssa, Wollega
University

12
Spatial analysis concept
Spatial analysis is the process by which we turn
raw data into useful information
Spatial analysis is the crux of GIS because it
includes all of the transformations, manipulations,
and methods that can be applied to geographic
data to add value to them, to support decisions,
and to reveal patterns and anomalies that are not
immediately obviousSpatial Analysis and Modelling by Tadele Feyssa, Wollega
University

In a narrow sense, spatial analysis has been described as
a method for analyzing spatial data, while in a broad sense
it includes revealing and clarifying processes, structures,
etc., of spatial phenomena that occur on the Earth’s
surface.
Ultimately, it is designed to support spatial decision-
making, and to serve as a tool for assisting with regional
planning and the formulation of government policies,
among other things.13Spatial Analysis and Modelling by Tadele Feyssa, Wollega
University

Spatial Analysis
14Spatial Analysis and Modelling by Tadele Feyssa, Wollega
University

The data analysis domain of a GIS, includes a variety
of data processing functions that aim at deriving
spatial relationships, patterns and trends, that are
implicit in the source data.
The results of data analysis may be used immediately
for spatial problem solving and decision making or as
input for further spatial analysis and modeling.
Spatial data analysis is computing from existing,
stored spatial data new information that provides new
insight15Spatial Analysis and Modelling by Tadele Feyssa, Wollega
University

Spatial analysis could be either for prescriptive or
predictive applications.
Prescriptive model:
Used for planning & site selection.
This involve the use of criteria & parameters to
quantify environmental, economic & social factors.
The model enumerates a number of conditions to be
met.16Spatial Analysis and Modelling by Tadele Feyssa, Wollega
University

Predictive model:
A forecast is made of the likelihood of future events.
Various spatial data layers used (raster or vector).
Analytical questions, such as why or what if.
It is intended to construct models and perform
predictions.
E.g. Pollution, erosion, landslides.
17Spatial Analysis and Modelling by Tadele Feyssa, Wollega
University
Application
Road construction
Construction in mountainous areas is complex
engineering task, Cost factors, such as the number of
tunnels & bridges to be constructed,
Volume of rock & soil to be removed.
GIS can help to compute such costs on the basis of an
up-to-date DEM and soil map.
18Spatial Analysis and Modelling by Tadele Feyssa, Wollega
University

Modeling
Models are used in many different ways, from simulations
of how the world works, to evaluations of planning
scenarios, to the creation of indicators of suitability or
vulnerability
Model is a simplification of reality in be viewed as a
model.
19Spatial Analysis and Modelling by Tadele Feyssa, Wollega
University
Modeling
In the field of GIS, modelling provide understanding of the
way the world works with sufficient precision and
accuracy to allow prediction and confident decision-
making.
Modeling concern the way in which analyses are carried
out using standard functionality
20Spatial Analysis and Modelling by Tadele Feyssa, Wollega
University

2 GIS Analysis Functions
This chapter is organized to take you from data to
information and ultimately to decision-making.
It covers some of the options in GIS for data analysis.
Data analysis is the most interesting part of a GIS project.
B/c it is where one can start to find answers to some of
his/her questions, and use GIS to help develop new
questions for research.
21Spatial Analysis and Modelling by Tadele Feyssa, Wollega
University
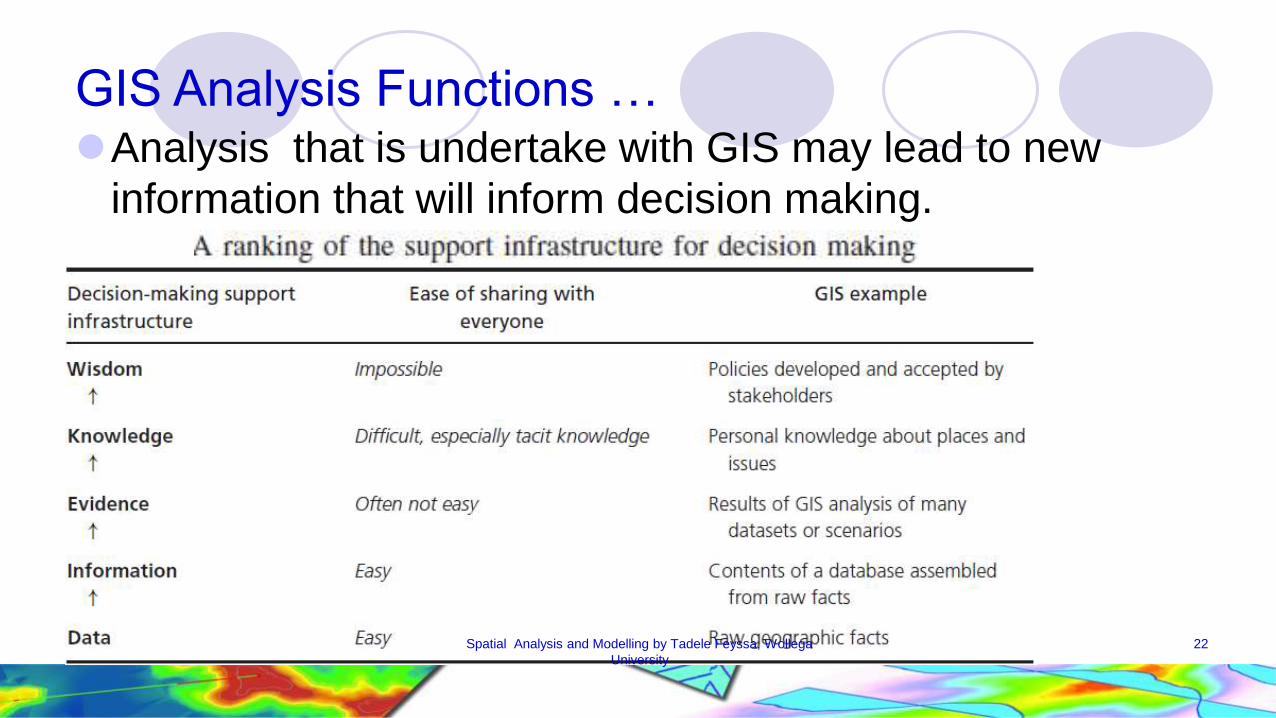
GIS Analysis Functions …Analysis that is undertake with GIS may lead to new
information that will inform decision making.
22Spatial Analysis and Modelling by Tadele Feyssa, Wollega
University

Once the data input process is complete and your GIS layers
are preprocessed, you can begin the analysis stage.
GIS analysis functions use the spatial and non-spatial
attribute data to answer questions about real-world
Analyzing geographic data requires critical thinking and
reasoning.
When use GIS to address real-world problems, you will come
up against the question that which analysis function you want
to use and to solve the problems 23Spatial Analysis and Modelling by Tadele Feyssa, Wollega
University
You look for patterns, associations, connections,
interactions, and evidence of change through time and
over space.
GIS helps you analyze the data sets and test for spatial
relationships, but it does not replace the necessity for you
to think spatially.
24Spatial Analysis and Modelling by Tadele Feyssa, Wollega
University

GIS Analysis Functions…
What makes GIS unique is the ability to:
link data to spatial locations and
query and summarize these data based on specific analysis
requirements.
Functionally, GIS provides a sophisticated tool for
reporting the results of a database.
These reports may be for an entire dataset (or table) or
for a portion of the dataset (e.g., based on the results of a
query or data summary)25Spatial Analysis and Modelling by Tadele Feyssa, Wollega
University

Analysis FUNCTIONS of GIS Includes:
Measurements
Query
Extraction
Proximity
Classification
Topology
Network analysis …
26Spatial Analysis and Modelling by Tadele Feyssa, Wollega
University
MEASUREMENT
Measurements are simple numerical values that describe
aspects of geographic data.
Measurement functions in GIS includes
Distance,
Perimeter and
Area
27Spatial Analysis and Modelling by Tadele Feyssa, Wollega
University
Many types of interrogation ask for measurements
we might want to know the total area of a parcel of land, or the
distance between two points, or the length of a stretch of road
and in principle all of these measurements are obtainable by
simple calculations inside GIS.
Comparable measurements by hand from maps can be very tedious
and error-prone.
28
Tadele F Spatial Analysis and Modelling
Spatial Analysis and Modelling by Tadele Feyssa, Wollega
University

Measuring Distance
There are many ways to measure distance.
Most GIS programs have a ruler button that allows you to
measure distances across a map.
After clicking the button, you point on the map where you
want to begin your distance measurement and then click
at the ending point (or intervening points that define the
path you want to measure).
29Spatial Analysis and Modelling by Tadele Feyssa, Wollega
University
Many vector-based systems measure distances along
existing vector line networks, like streets, sewers, and
railroads
Example: shortest distance from Wollega University to
Nekemte bas station
This type of distance measurement relies on topological
network relationships
30Spatial Analysis and Modelling by Tadele Feyssa, Wollega
University
Measuring Area/Perimeter
Many vector systems automatically generate area and
perimeter measurements for polygon features and store
these values in prescribed attribute fields.
The systems that do not have this automatic function do
provide a way for you to generate area and perimeter and
store the results in user-defined fields.
Once calculated and stored, you can select multiple
polygon features and sum their area and perimeter
31Spatial Analysis and Modelling by Tadele Feyssa, Wollega
University

MEASUREMENT
DISTANCE
Perimeter
AREA/SIZE
A
B
C
D
X Y5 KM
A- B = 20 = 40%
B- C = 20 = 40%
C - D= 10 = 20%
2
10 km32Spatial Analysis and Modelling by Tadele Feyssa, Wollega
University

QUERY
Queries are the most basic of analysis operations, in
which the GIS is used to answer simple questions posed
by the user.
No changes occur in the database, and no new data are
produced with these type of selection
33Spatial Analysis and Modelling by Tadele Feyssa, Wollega
University

Cont…
The operations vary from simple and well-defined queries
like ‘how many houses are found within 1 km of this point’,
to vaguer questions like ‘which is the closest city to Los
Angeles going north’, where the response may depend on
the system’s ability to understand what the user means by
‘going north’
34Spatial Analysis and Modelling by Tadele Feyssa, Wollega
University
Attribute Query (Boolean Selection)
It involves picking features based on query
expressions, which use Boolean algebra (and, or, not),
set algebra (>, <, =, >=, <=),
arithmetic operators (=, -, *, /), and
user-defined values.
Simply put, the GIS compares the values in an attribute field with
a query expression that you define
35Spatial Analysis and Modelling by Tadele Feyssa, Wollega
University

Cont…
For example, if you want to select every restaurant
whose price is considered inexpensive, you would
use a query expression like “PRICE = $”
where “PRICE” is the attribute field under
investigation,
“=” is the set algebra operator, and “$” is the value
36Spatial Analysis and Modelling by Tadele Feyssa, Wollega
University
Spatial Selection (Spatial Searches/query)
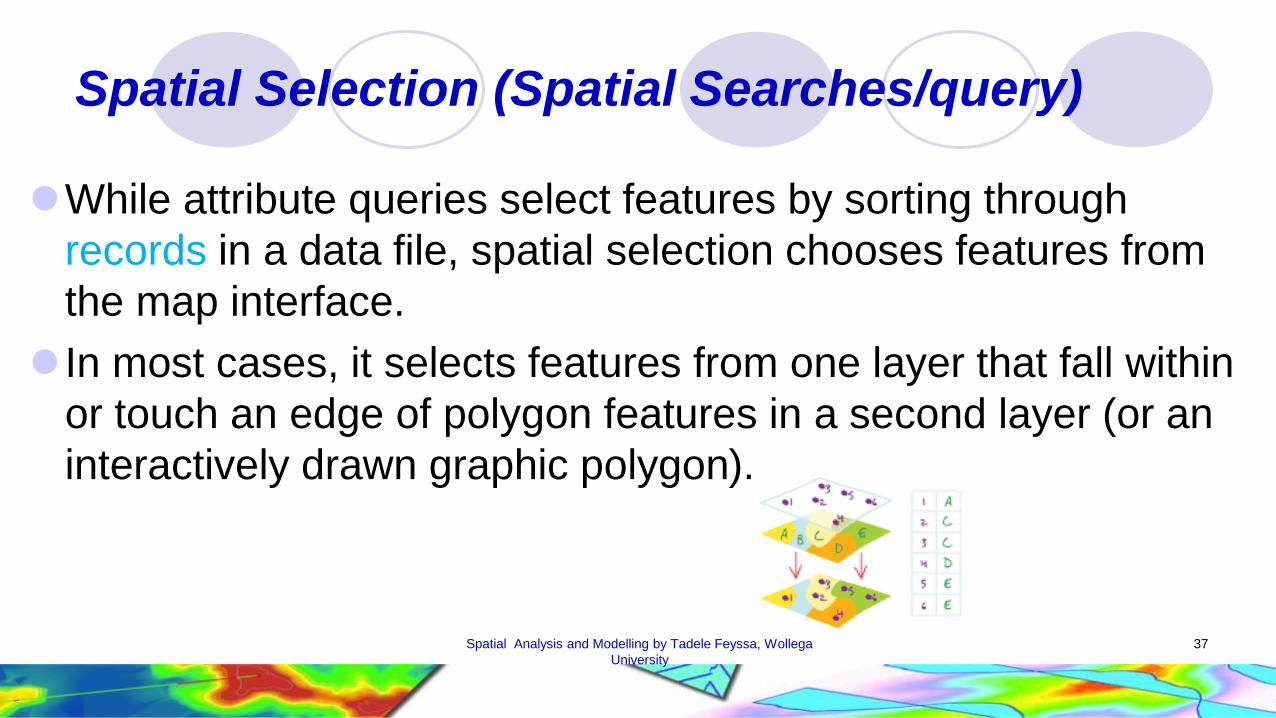
While attribute queries select features by sorting through
records in a data file, spatial selection chooses features from
the map interface.
In most cases, it selects features from one layer that fall within
or touch an edge of polygon features in a second layer (or an
interactively drawn graphic polygon).
37Spatial Analysis and Modelling by Tadele Feyssa, Wollega
University

Cont….
There are many types of spatial selection like point
in polygon, it is a spatial operation in which points
from one feature dataset are overlaid on the
polygons of another to determine which points are
contained within the polygons.
38
Tadele F Spatial Analysis and Modelling
Spatial Analysis and Modelling by Tadele Feyssa, Wollega
University

Cont….
There are many types of spatial selection like point
in polygon, it is a spatial operation in which points
from one feature dataset are overlaid on the
polygons of another to determine which points are
contained within the polygons.
39
Tadele F Spatial Analysis and Modelling
Spatial Analysis and Modelling by Tadele Feyssa, Wollega
University

Extracting portions of data helps to isolate specific areas for
further processing or data analysis.
Similar to queries and selection sets, extraction functions can
reduce the size of datasets and/or facilitate more complex
interpretation.
Queries and selection sets also allow to isolate portions of a
dataset
Extraction techniques differ in that these portions of data are
isolated in a permanent way - through the creation of new
data layers 40Spatial Analysis and Modelling by Tadele Feyssa, Wollega
University

Cont…
GIS software packages provide a suite of tools to extract
data, the most useful being, clip,select, and split
Extracts input features that overlay the clip features.
Working much like a cookie-cutter.
This is particularly useful for creating a new feature class—
also referred to as study area or area of interest (AOI)—that
contains a geographic subset of the features in another,
larger feature class41Spatial Analysis and Modelling by Tadele Feyssa, Wollega
University
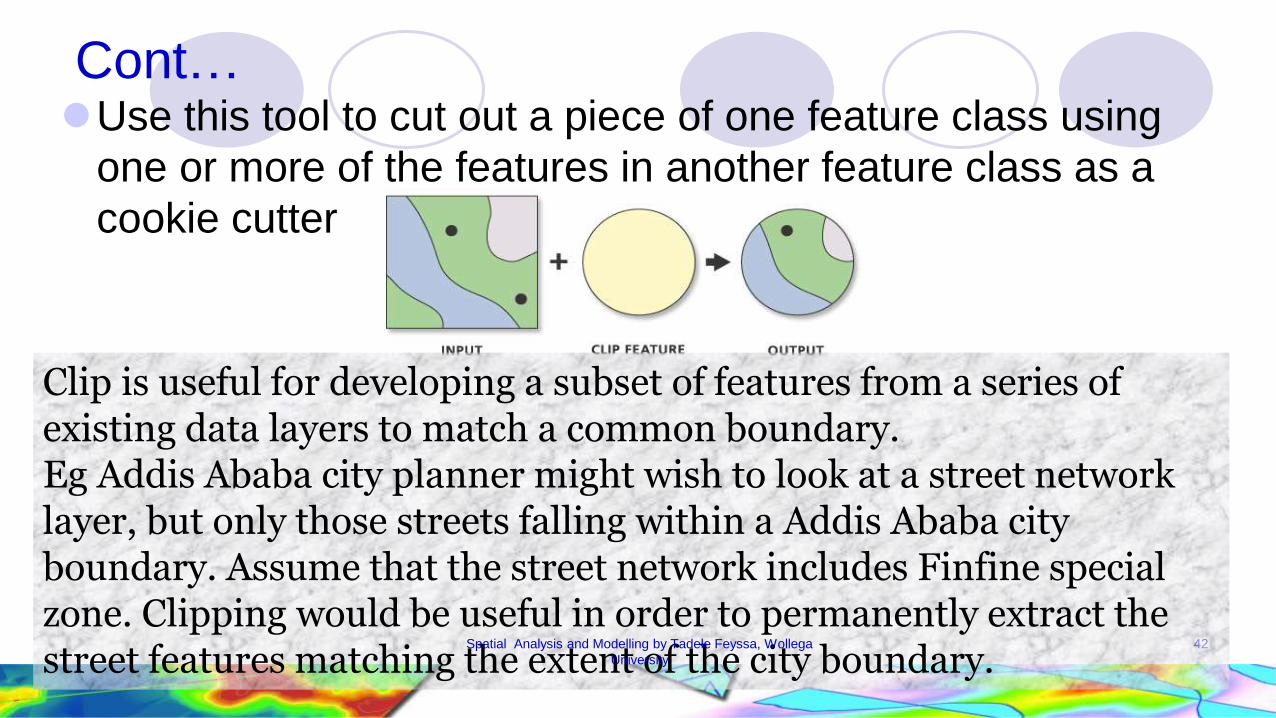
Cont…Use this tool to cut out a piece of one feature class using
one or more of the features in another feature class as a
cookie cutter
42
Clip is useful for developing a subset of features from a series of existing data layers to match a common boundary. Eg Addis Ababa city planner might wish to look at a street network layer, but only those streets falling within a Addis Ababa city boundary. Assume that the street network includes Finfine special zone. Clipping would be useful in order to permanently extract the street features matching the extent of the city boundary.
Spatial Analysis and Modelling by Tadele Feyssa, Wollega
University

Split is used to divide an input layer into two or more
independent layers:
based on geographically corresponding features in a split layer
Input output layer
The Split Features dataset must be polygons. 43Spatial Analysis and Modelling by Tadele Feyssa, Wollega
University

Extracts features from an input feature class or input
feature layer, typically using a select or Structured Query
Language (SQL) expression and stores them in an output
feature class.
44
Eg. Urban planner might wish to look
at only double-line streets in the
particular municipality of interest.
In this case, he or she would execute
a selection query to extract only those
desired features to a new layer
Spatial Analysis and Modelling by Tadele Feyssa, Wollega
University

CLASSIFICATION
Classification is the procedure of identifying a set of
features as belonging to a group and defining patterns.
Some form of classification function is provided in every
GIS.
Classification is important because it defines patterns.
One of the important functions of a GIS is to assist in
recognizing new patterns.
Classification is done using single data layers, as well as
with multiple data layers as part of an overlay operation. 45Spatial Analysis and Modelling by Tadele Feyssa, Wollega
University

When you perform a classification, you group similar
features into classes by assigning the same symbol to each
member of the class.
Aggregating features into classes allows you to spot
patterns in the data more easily.
The definition of a class range determines which features
fall into that class and affect the appearance of the map.
46Spatial Analysis and Modelling by Tadele Feyssa, Wollega
University

By altering the class breaks (the boundary between
classes), you can create very different-looking maps.
Classes can be created manually, or you can use a
standard classification scheme.
47Spatial Analysis and Modelling by Tadele Feyssa, Wollega
University

TOPOLOGY
In geodatabases, topology is the arrangement
that defines how point, line, and polygon features share
coincident geometry.
For example, street centerlines and census blocks share
common geometry, and adjacent soil polygons share their
common boundaries.
Topology is the science and mathematics of relationships used
to validate the geometry of vector entities, and for operations
such as network tracing and tests of polygon adjacency48Spatial Analysis and Modelling by Tadele Feyssa, Wollega
University
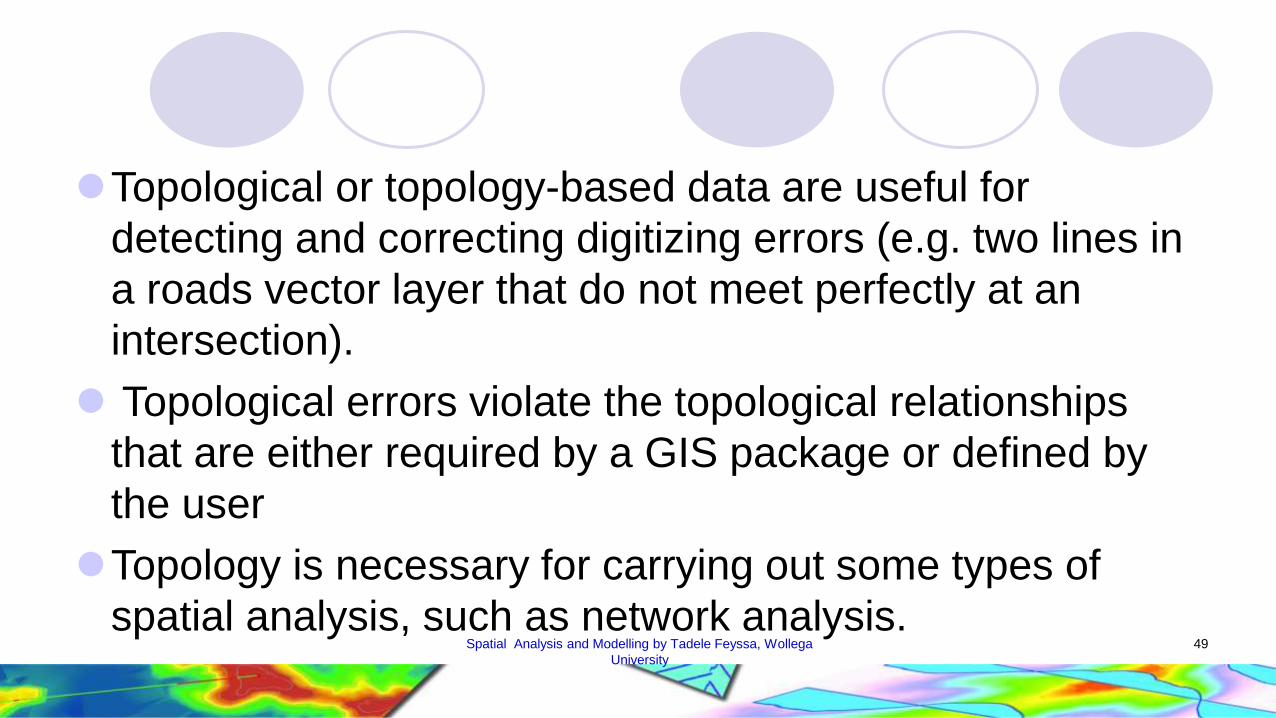
Topological or topology-based data are useful for
detecting and correcting digitizing errors (e.g. two lines in
a roads vector layer that do not meet perfectly at an
intersection).
Topological errors violate the topological relationships
that are either required by a GIS package or defined by
the user
Topology is necessary for carrying out some types of
spatial analysis, such as network analysis.49Spatial Analysis and Modelling by Tadele Feyssa, Wollega
University

Topological Errors
There are different types of topological errors and they can
be grouped according to whether the vector feature types
are polygons or polylines.
Topological errors with polygon features can include
unclosed polygons, gaps between polygon borders or
overlapping polygon borders.
50Spatial Analysis and Modelling by Tadele Feyssa, Wollega
University
Topological Errors
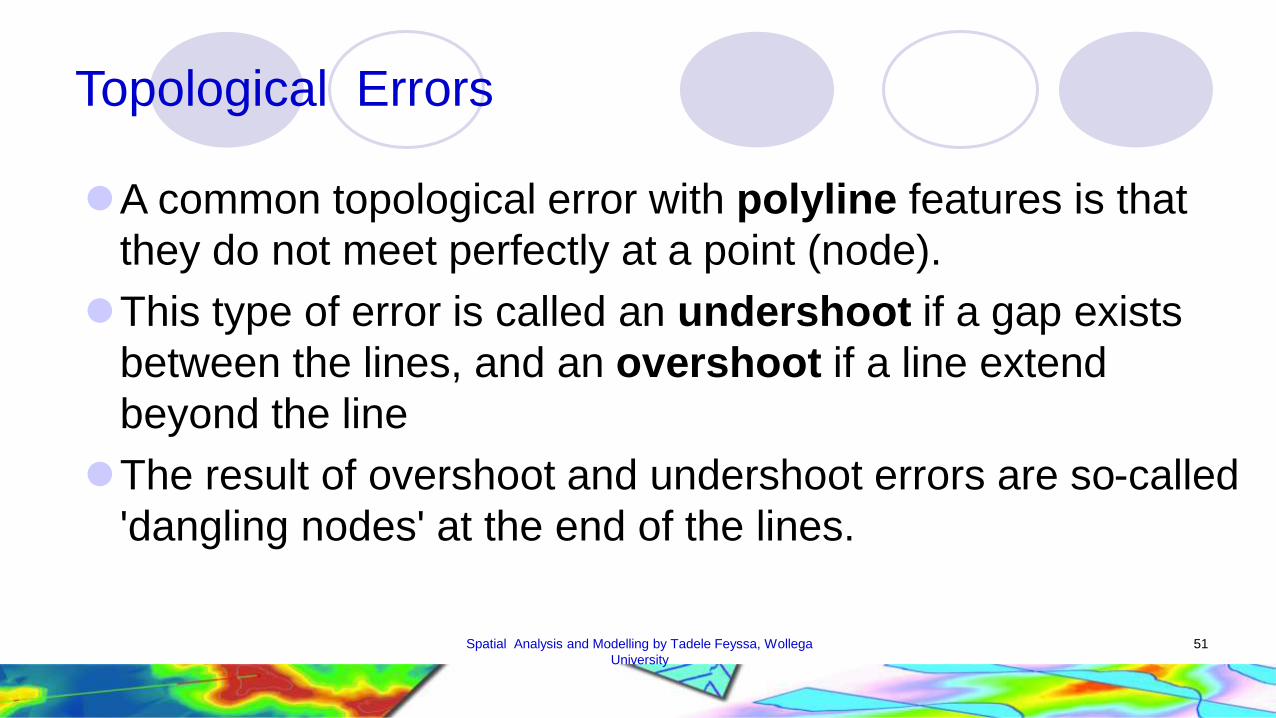
A common topological error with polyline features is that
they do not meet perfectly at a point (node).
This type of error is called an undershoot if a gap exists
between the lines, and an overshoot if a line extend
beyond the line
The result of overshoot and undershoot errors are so-called
'dangling nodes' at the end of the lines.
51Spatial Analysis and Modelling by Tadele Feyssa, Wollega
University

Dangling nodes are acceptable in special cases, for
example if they are attached to dead-end streets
Arc-node data model
Arc: a series of points that start and end at a node
Node: an intersection point where two or more arcs meet
Nodes that are close together are snapped.
Slivers due to double digitizing and overlay are
eliminated.52Spatial Analysis and Modelling by Tadele Feyssa, Wollega
University
Topological errors
53
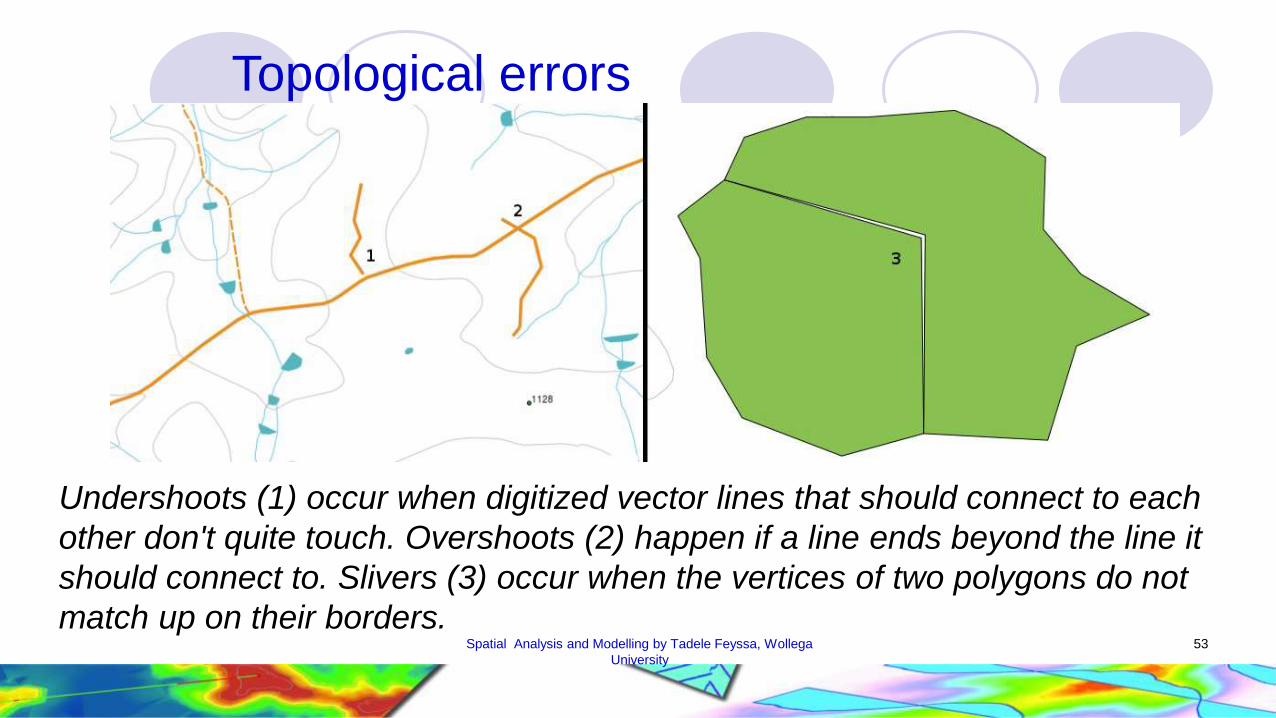
Undershoots (1) occur when digitized vector lines that should connect to each
other don't quite touch. Overshoots (2) happen if a line ends beyond the line it
should connect to. Slivers (3) occur when the vertices of two polygons do not
match up on their borders.Spatial Analysis and Modelling by Tadele Feyssa, Wollega
University

Slivers
Sliver
A common error in overlaying
polygon layers is Silvers
Silvers are very small polygons along
correlated or shared boundary lines
54Spatial Analysis and Modelling by Tadele Feyssa, Wollega
University
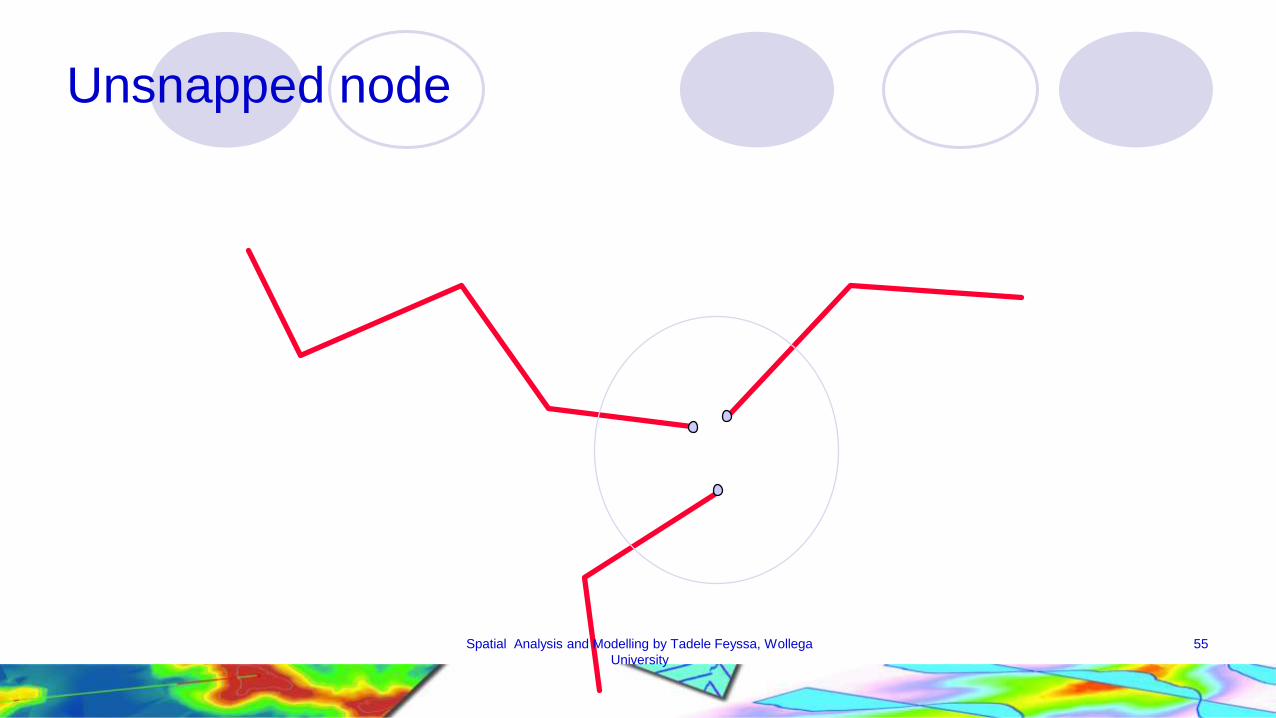
Unsnapped node
55Spatial Analysis and Modelling by Tadele Feyssa, Wollega
University
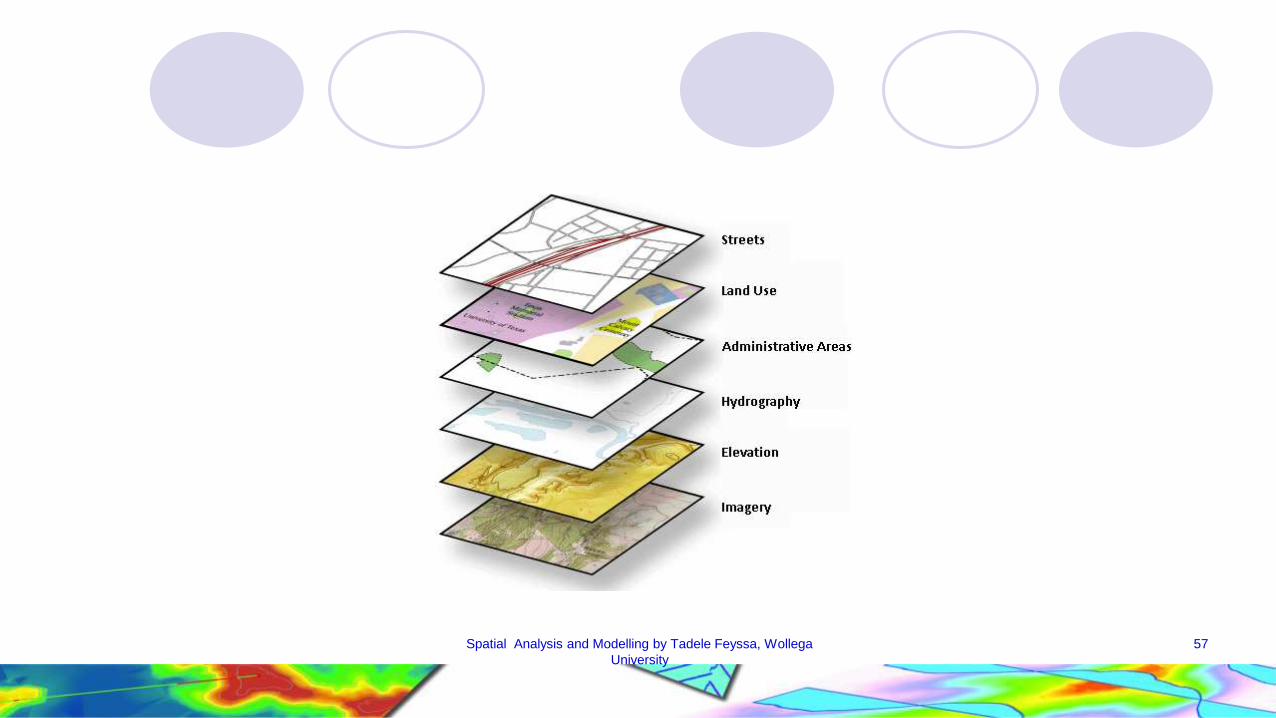
OVERLAY ANALYSIS
Overlay is one of the most common and powerful GIS
functions.
It investigates the spatial association of features by “vertically
stacking” feature layers to investigate geographic patterns
and determine locations that meet specific criteria.
An overlay operation combines the geometries and attributes
of two feature layers to create the output
Feature layers to be overlaid must be spatially registered and
based on the same coordinate systems56Spatial Analysis and Modelling by Tadele Feyssa, Wollega
University
57Spatial Analysis and Modelling by Tadele Feyssa, Wollega
University

Feature type and overlay
There are two group of overlay operations
The first group uses two polygon layers as input
The second group uses one polygon layer and other layer
which may contain points or lines
58Spatial Analysis and Modelling by Tadele Feyssa, Wollega
University

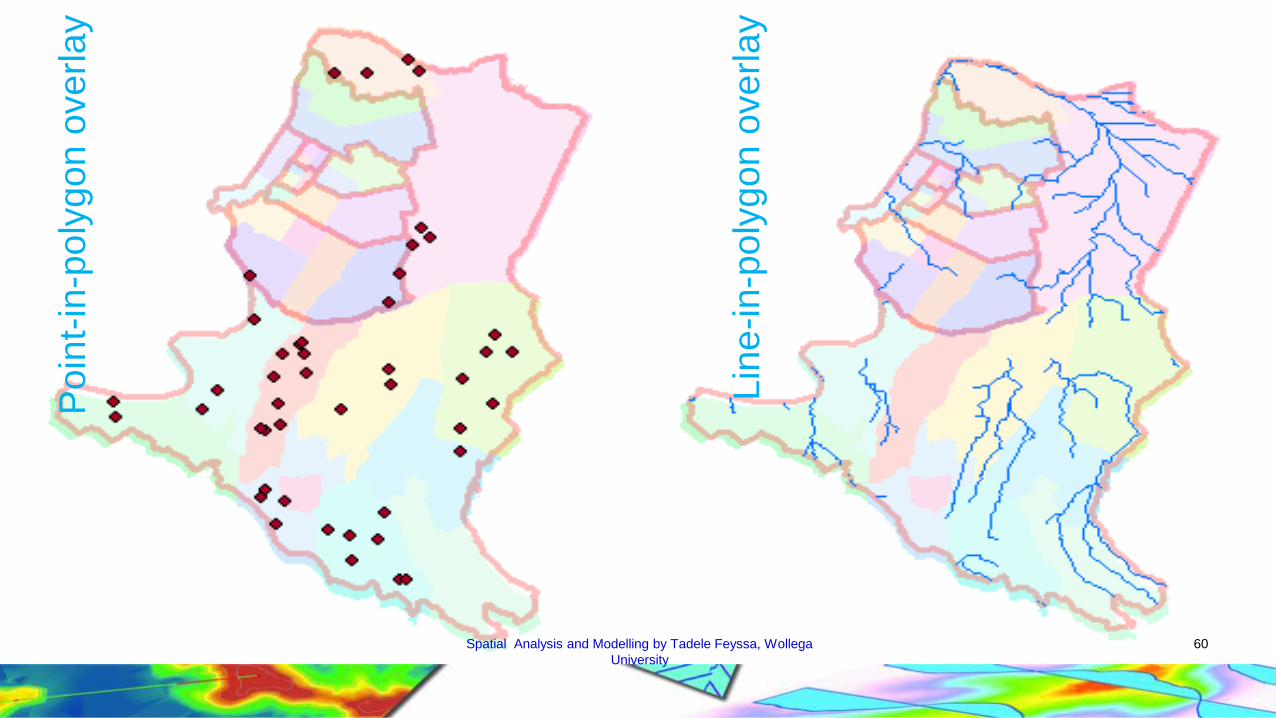
Overlay operation can be classified as:
Point-in-polygon overlay
Line-in-polygon overlay
Polygon-on-polygon overlay
59Spatial Analysis and Modelling by Tadele Feyssa, Wollega
University
Poin
t-in
-po
lygo
n o
verl
ay
Lin
e-i
n-p
oly
go
n o
verl
ay
60Spatial Analysis and Modelling by Tadele Feyssa, Wollega
University
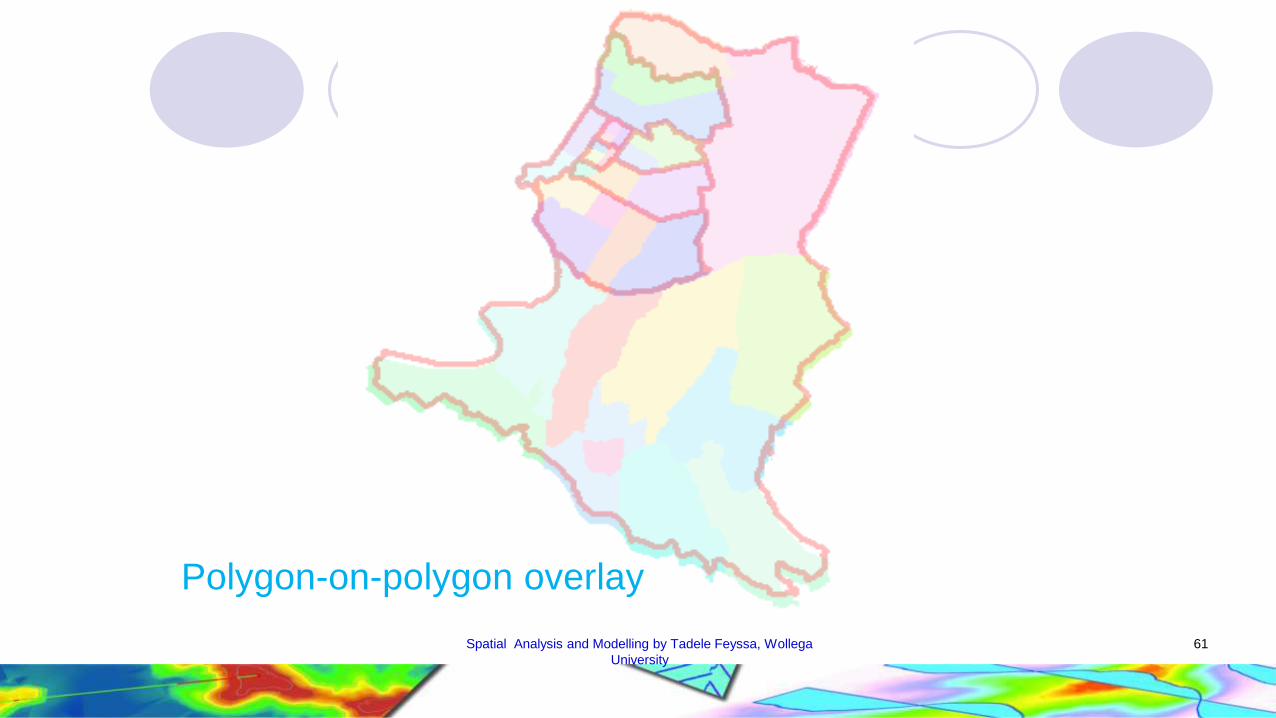
Polygon-on-polygon overlay
61Spatial Analysis and Modelling by Tadele Feyssa, Wollega
University

Overlay Methods
Overlay methods are based on the Boolean connectors
AND, OR and XOR
Intersect uses the AND connector
Union uses the OR connector.
Differences uses XOR connector
Union preserves all features from the inputs
The area extent of the output combines the area extents
of both input layers62Spatial Analysis and Modelling by Tadele Feyssa, Wollega
University

AND
63Spatial Analysis and Modelling by Tadele Feyssa, Wollega
University
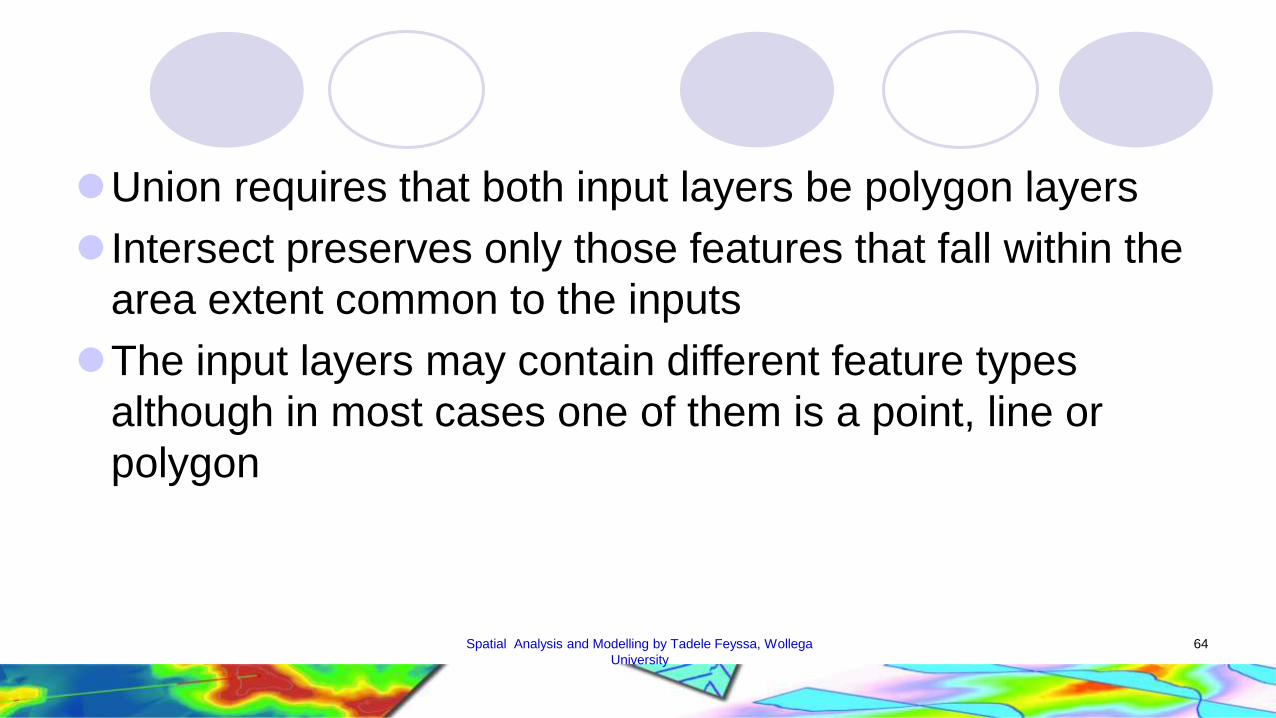
Union requires that both input layers be polygon layers
Intersect preserves only those features that fall within the
area extent common to the inputs
The input layers may contain different feature types
although in most cases one of them is a point, line or
polygon
64Spatial Analysis and Modelling by Tadele Feyssa, Wollega
University
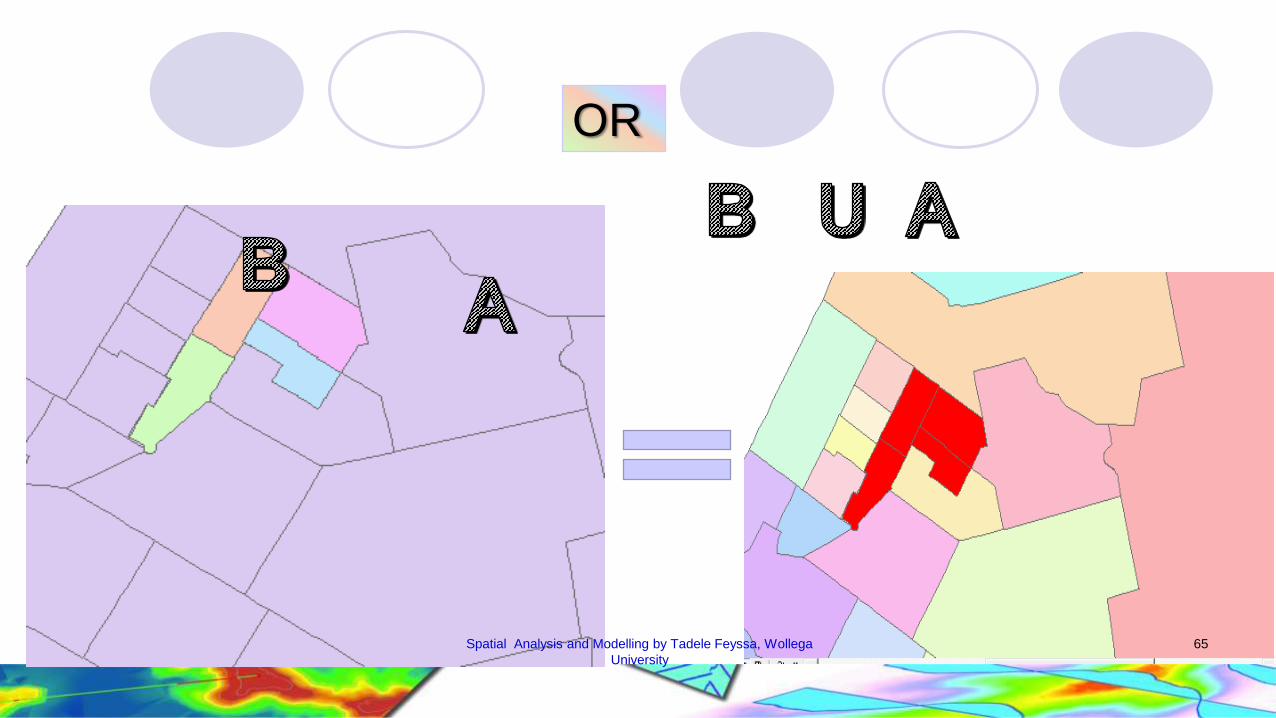
OR
65Spatial Analysis and Modelling by Tadele Feyssa, Wollega
University
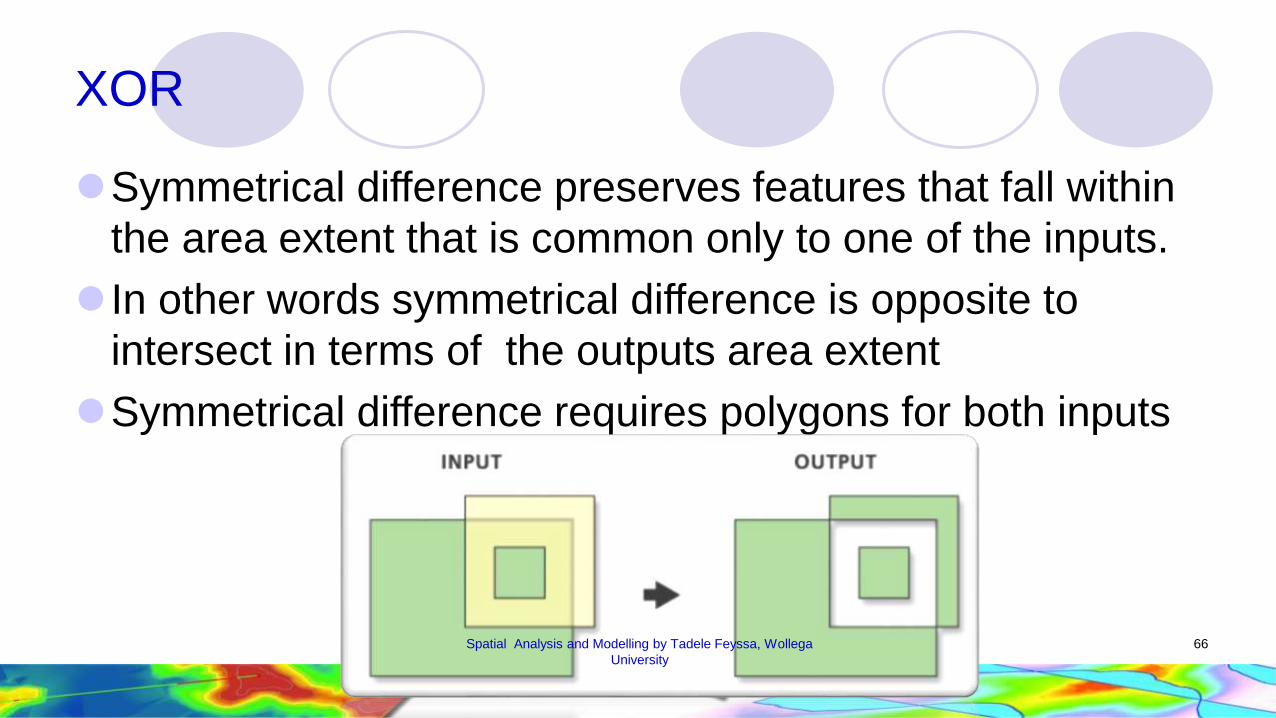
XOR
Symmetrical difference preserves features that fall within
the area extent that is common only to one of the inputs.
In other words symmetrical difference is opposite to
intersect in terms of the outputs area extent
Symmetrical difference requires polygons for both inputs
66Spatial Analysis and Modelling by Tadele Feyssa, Wollega
University
Identity preserves only features that fall within the area
extent of the layer defined as the input layer the other
layer is call the identity of layer
The input layer may contain points, lines or polygon and
the identity layer is a polygon layer
67Spatial Analysis and Modelling by Tadele Feyssa, Wollega
University

Application of Overlay
An overlay operation combines features and attributes
from the input layers
The overlay output is useful for query and modelling
purposes.
For example a company who is looking a parcel that is
zoned a commercial area, not subject for flooding and not
more than a mile from heavy duty road may use overlay
method to identify the area
68Spatial Analysis and Modelling by Tadele Feyssa, Wollega
University
NEIGHBORHOOD FUNCTIONS
Neighborhood operations consider the characteristics of
neighboring areas around a specific location.
The principle here is to find out the characteristics of the
vicinity, here called neighborhood, of a location.
After all, many suitability questions, for instance, depend
not only on what is at the location, but also on what is near
the location.
Thus, the GIS must allow us ‘to look around locally’.69Spatial Analysis and Modelling by Tadele Feyssa, Wollega
University
To perform neighbourhood analysis, we must
1. state which target locations are of interest to us, and
what is their spatial extent,
2. define how to determine the neighbourhood for each
target,
3. define which characteristic(s) must be computed for
each neighbourhood.
These functions either modify existing features or create
new feature layers, which are influenced, to some degree,
by the distance from existing features
70Spatial Analysis and Modelling by Tadele Feyssa, Wollega
University
For example, our target is Nekemte Hospital. Its
neighborhood can be defined as
• an area within 2 km distance, as the crow flies, or
• an area within 2 km travel distance, or
• all roads within 500 m travel distance, or
• all other clinics within 15 minutes travel time, or
• all residential areas, for which the clinic is the closest
clinic71Spatial Analysis and Modelling by Tadele Feyssa, Wollega
University
Proximity computation
In proximity computations, we use geometric distance to
define the neighborhood of one or more target locations.
All GIS programs provide some neighborhood analyses,
which include buffering, interpolation, Theissen polygons,
and various topographic functions.
The most common and useful technique is buffer zone
generation.
Another technique based on geometric distance that is
Thiessen polygon generation.72Spatial Analysis and Modelling by Tadele Feyssa, Wollega
University

Buffering
Buffering works based on proximity concept
Feature for buffering may be points, lines or polygons
Buffering around point create a circle
Around lines a series of elongated buffer zones around
each line segment
A buffer around a polygon creates an extended area from
the polygon boundaries
73Spatial Analysis and Modelling by Tadele Feyssa, Wollega
University
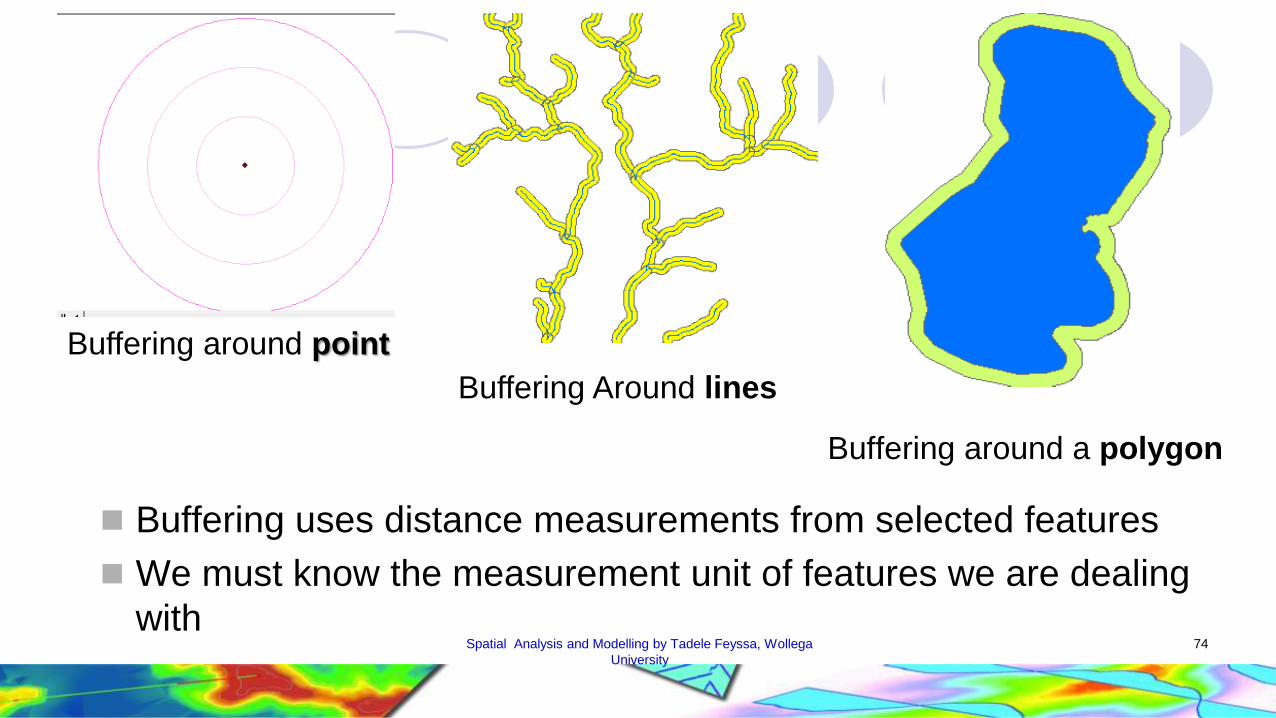
Buffering around point
Buffering Around lines
Buffering around a polygon
Buffering uses distance measurements from selected features
We must know the measurement unit of features we are dealing
with74Spatial Analysis and Modelling by Tadele Feyssa, Wollega
University
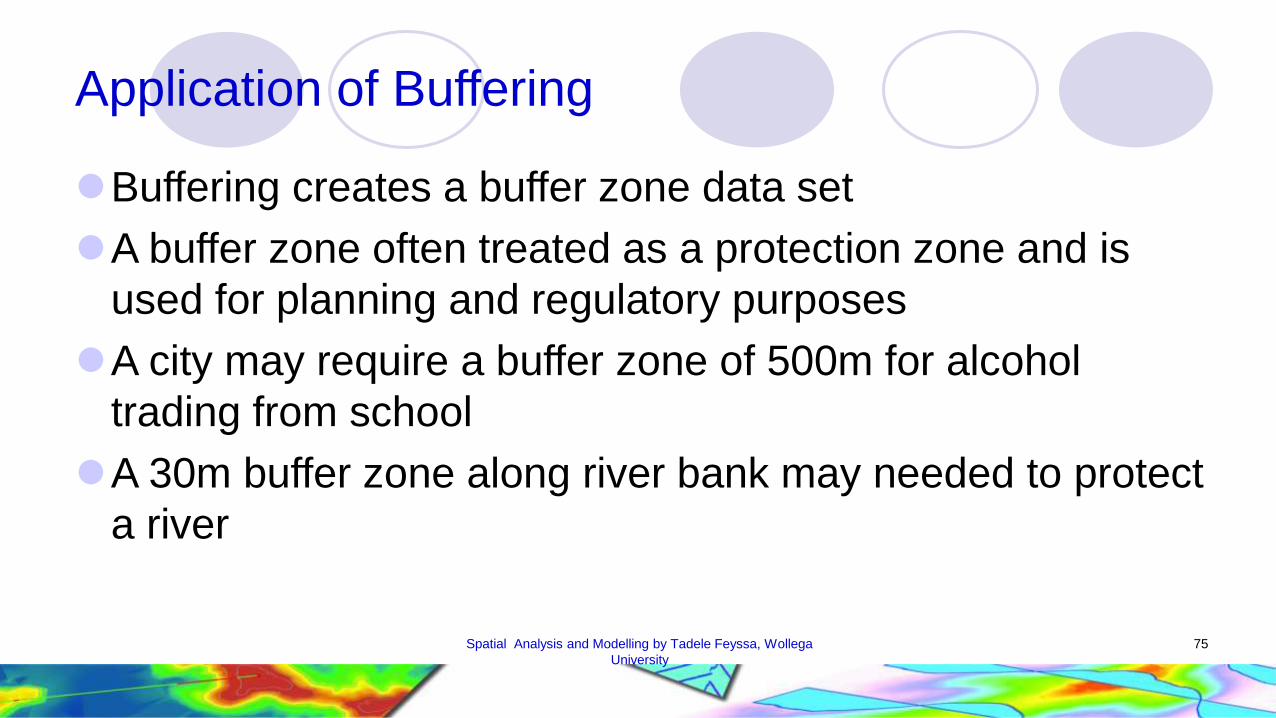
Application of Buffering
Buffering creates a buffer zone data set
A buffer zone often treated as a protection zone and is
used for planning and regulatory purposes
A city may require a buffer zone of 500m for alcohol
trading from school
A 30m buffer zone along river bank may needed to protect
a river
75Spatial Analysis and Modelling by Tadele Feyssa, Wollega
University

A buffer zone may be treated as a neutral zone and as a
tool for conflict resolution
Buffering zone also used for identifying suitable sites for
different purposes
Buffering also can be applied for sampling methods.
EG A stream network can be buffered at regular distances
to analyse vegetation variations as one moves away from
the stream
76Spatial Analysis and Modelling by Tadele Feyssa, Wollega
University

Thiessen Polygons (Analysis)
It Creates Thiessen polygons from point input features.
Each Thiessen polygon contains only a single point input
feature. Any location within a Thiessen polygon is closer
to its associated point than to any other point input
feature.
77
This tool is used to divide the area covered by the point input features into
Thiessen or proximal zones. These zones represent full areas where any
location within the zone is closer to its associated input point than to any other
input pointSpatial Analysis and Modelling by Tadele Feyssa, Wollega
University
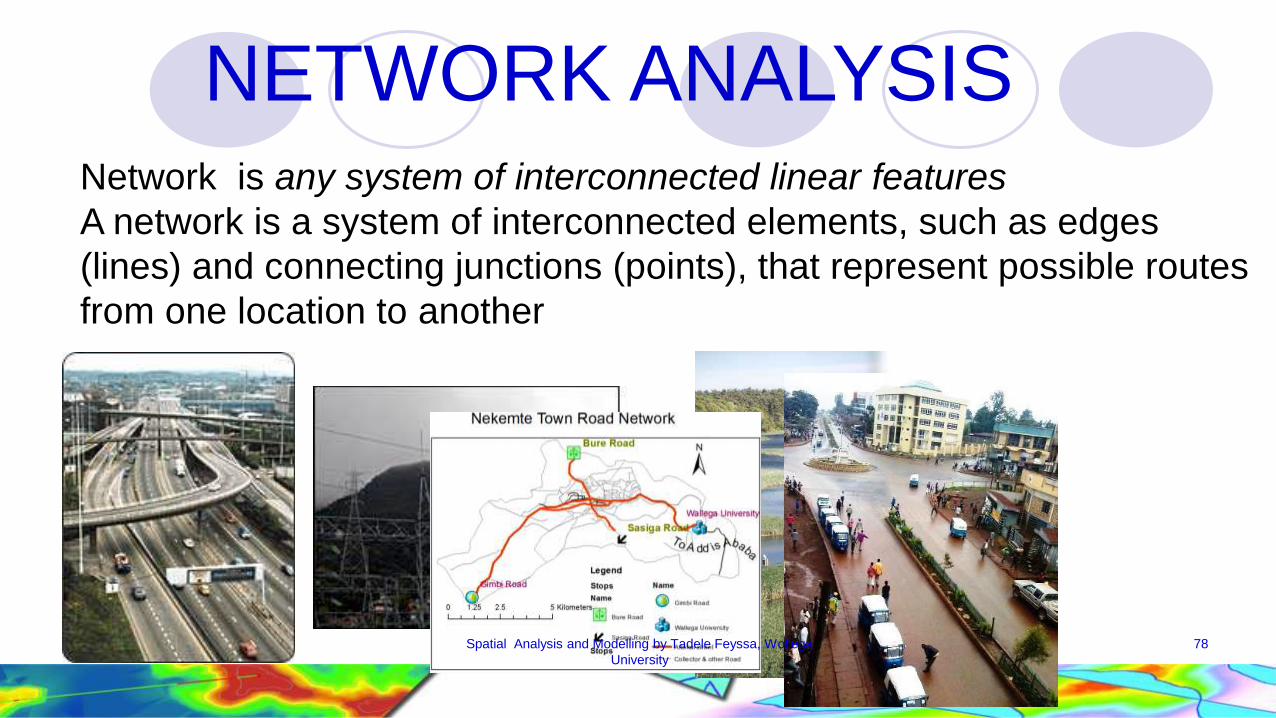
NETWORK ANALYSIS Network is any system of interconnected linear features
A network is a system of interconnected elements, such as edges
(lines) and connecting junctions (points), that represent possible routes
from one location to another
78Spatial Analysis and Modelling by Tadele Feyssa, Wollega
University
What is network analysis?Solving problems involving networks
Its goal is efficiency – Saving time and money.
Tools like
• Network data (connectivity is needed)
• Network analysis software – A GIS is also required to
network analysis 79Spatial Analysis and Modelling by Tadele Feyssa, Wollega
University
Network Analysis
Network analyses involve analyzing the flow of networks—
a connected set of lines and point nodes.
These linear networks most often represent features such
as rivers, transportation corridors (roads, railroads, and
even flight paths), and utilities (electric, telephone,
television, sewer, water, gas).
Point nodes usually represent pickup or destination sites,
clients, transformers, valves, and intersections. People,
water, consumer packages, kilowatts, and many other
resources flow to and from nodes along linear features.
Each linear feature affects the resource flow.80Spatial Analysis and Modelling by Tadele Feyssa, Wollega
University
For example, a street segment might only provide flow in
one direction (a one-way street) and at a certain speed.
Network analysis tools help you analyze the “cost” of
moving through the network.
“cost” can be money, time, distance, or effort.
The three major types of network analyses include route
selection (optimal path or shortest path), resource
allocation, and network modeling.
81Spatial Analysis and Modelling by Tadele Feyssa, Wollega
University

• Route Selection attempts to identify the least “cost” route.
• You might want to find the shortest path between your
home and a weekend destination
• In any route selection routine, two or more nodes,
including an origin and a destination point, must be
identified and be able to be visited on the network.
• Sometimes there are a large number of possible routes.
• It is the job of the network analysis algorithm to determine
the least cost route. 82Spatial Analysis and Modelling by Tadele Feyssa, Wollega
University
•
• Resource Allocation, the second major type of network
analysis, involves the distribution of a network to nodes.
• To do this, you define one or more allocation nodes on
the network.
• Territories of linear features, like streets, are defined
around each of these allocation nodes.
• The linear features are usually assigned to the nearest
node, where distance is measured in time, length, money,
or effort.
83Spatial Analysis and Modelling by Tadele Feyssa, Wollega
University
What do the tools do?
GIS allows you to solve common network problems, such as finding the
best route across a city, finding the closest emergency vehicle or
facility, identifying a service area around a location, servicing a set of
orders with a fleet of vehicles, or choosing the best facilities to open or
close

What do the tools do?
Direct path analysis – eg finding the shortest path between your office
and home
Optimum routing - helping a pizza deliveryman visit numerous houses
in the most time – efficient manner, that include
length of the lines, their capacity, maximum travel
rate and time
Closest facility analysis – eg finding the closest hospital to an
automobile accident
Drive time analysis- Helping a store to determine how many customers are within 5 driving miles
Driving directions- the systems of computation also allow deriving directions

ArcGIS Network Analyst ExtensionSolving transportation problems
Route Closest Facility Service Area
Vehicle Routing
ProblemLocation-Allocation
Origin-Destination
Cost Matrix
Route
Network Analyst can find the best way to get from one location to
another or to visit several locations
What's the best route?
Whether finding a simple route between two locations or one that
visits several locations, people usually try to take the best route. But
"best route" can mean different things in different situations.
The best route can be the quickest, shortest, or most scenic route,
depending on the impedance chosen. If the impedance is time, then
the best route is the quickest route. Hence, the best route can be
defined as the route that has the lowest impedance, where the
impedance is chosen by the user. 87
Spatial Analysis and Modelling by Tadele Feyssa, Wollega University
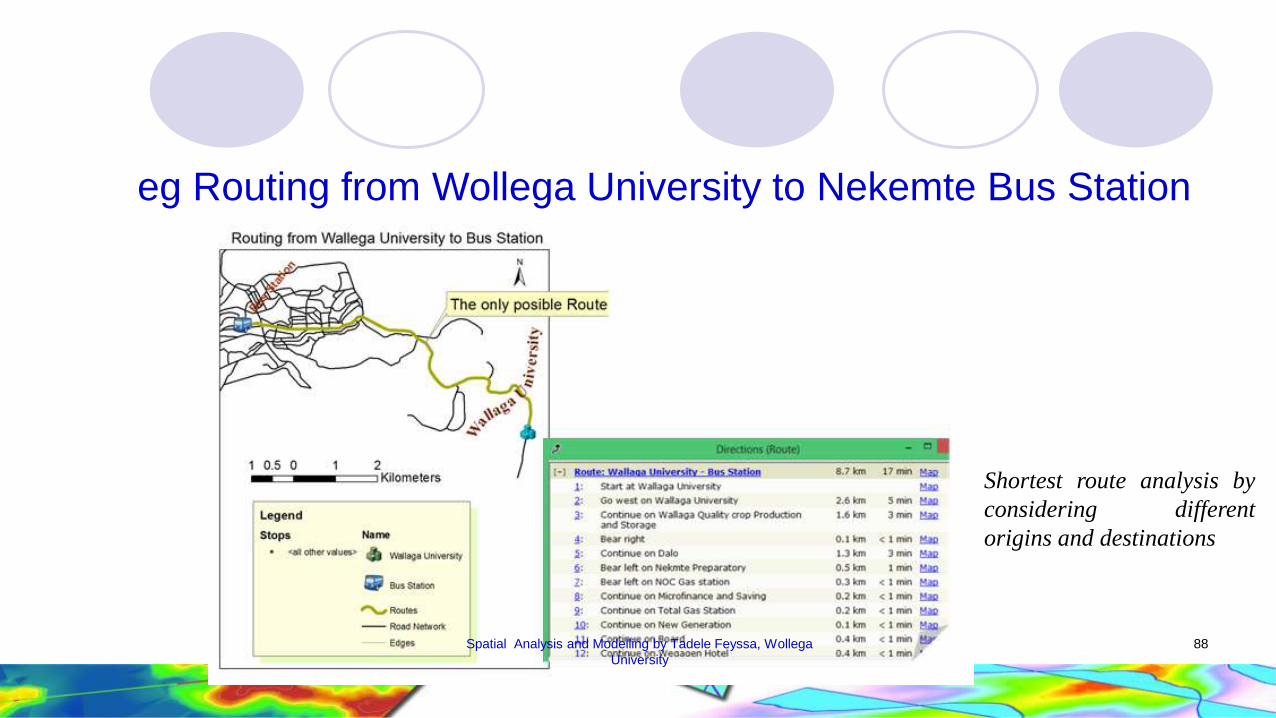
eg Routing from Wollega University to Nekemte Bus Station
88
Shortest route analysis by
considering different
origins and destinations
Spatial Analysis and Modelling by Tadele Feyssa, Wollega
University
Closest facility
The closest facility solver finds the cost of travelling
between incidents (i.e. specified points/ locations) and
facilities and determines which are nearest to the other
Finding the closest hospital to an accident, the closest
police cars to a crime scene, and the closest store to a
customer's address are all examples of closest facility
problems
89Spatial Analysis and Modelling by Tadele Feyssa, Wollega
University

The closest facility problem to search for 5 schools within a
10 minute drive from Nekemte First Square and Chalalaki.
Any schools that take longer than 10 minutes to reach are not
included in the results. This can be visualized in the following
figure
90
School closest facility mapping
Spatial Analysis and Modelling by Tadele Feyssa, Wollega
University

Service Area Analysis
The service area solver generates polygons or lines that cover all edges within a given distance, travel time or other impedance unit from the predefined facility/facilities
With the ArcGIS Network Analyst extension, you can find service areas around any location on a network.
A network service area is a region that encompasses all accessible streets
For instance, the 5-minute service area for a point on a network includes all the streets that can be reached within five minutes from that point.
Service areas created by Network Analyst also help evaluate accessibility. Concentric service areas show how accessibility varies with impedance. Once service areas are created, you can use them to identify how much land, how many people, or how much of anything else is within the neighborhood or
91Spatial Analysis and Modelling by Tadele Feyssa, Wollega
University

92Spatial Analysis and Modelling by Tadele Feyssa, Wollega
University
93Spatial Analysis and Modelling by Tadele Feyssa, Wollega
University
One of many uses of GIS analysis tools is to build models.
What is a model?
A model is a simplified representation of a phenomena or a
system.
A map is a model.
So are the vector and raster data models for representing
spatial features.
94Spatial Analysis and Modelling by Tadele Feyssa, Wollega
University
A model helps us better understand a phenomenon or a
system by retaining the significant features and
relationships of reality.
Often used to identify locations that meet specific criteria
Can be used to infer an unknown quality or quantity using
relationships with known or measurable quantities or
qualities
Can be used to generate new data
95Spatial Analysis and Modelling by Tadele Feyssa, Wollega
University
Classification of GIS Models
Descriptive or Prescriptive
Deterministic or Stochastic
Static or Dynamic
Deductive or Inductive
96Spatial Analysis and Modelling by Tadele Feyssa, Wollega
University

A model may be descriptive or prescriptive.
Descriptive model describes the existing conditions of
spatial data
Prescriptive model offers a prediction of what the
conditions could be or should be.
Eg If we use maps as analogies, a vegetation map would
represent a descriptive model and a potential natural
vegetation map, a prescriptive model.
97Spatial Analysis and Modelling by Tadele Feyssa, Wollega
University

The vegetation map shows existing vegetation, whereas the
potential natural vegetation map predicts the vegetation that
could occupy a site without disturbance or climate change
98Spatial Analysis and Modelling by Tadele Feyssa, Wollega
University
Both deterministic and stochastic models are mathematical
models represented by equations with parameters and
variables.
A stochastic model considers the presence of some
randomness in one or more of its parameters or variables,
but a deterministic model does not
99Spatial Analysis and Modelling by Tadele Feyssa, Wollega
University
A dynamic model emphasizes:
the changes of spatial data and the interactions between variables,
Whereas a static model deals with the state of spatial data
at a given time
Many environmental models such as groundwater pollution
and soil water distribution are best studied as dynamic
models
100Spatial Analysis and Modelling by Tadele Feyssa, Wollega
University

A deductive model represents the conclusion derived from a
set of premises.
These premises are often based on scientific theories or
physical laws
An inductive model represents the conclusion derived from
empirical data and observations.
Eg To assess the potential for a landslide one can use a
deductive model based on laws in physics or use an
inductive model based on recorded data from past
landslides101Spatial Analysis and Modelling by Tadele Feyssa, Wollega
University

The development of a model follows a series of steps.
1st step is to define the goals of the model
This is similar to defining a research problem
What is the phenomenon to be modeled?
Why is the model necessary?
What spatial and time scales are appropriate for the model?
One can use a conceptual or schematic model to show the essential
structure of the model
102Spatial Analysis and Modelling by Tadele Feyssa, Wollega
University

2nd step is to break down the model into elements and to
define the properties of each element and the interactions
between the elements
A flowchart may used as a useful tool for linking the
elements
Also at this step, one will gather mathematical equations
of the model and use tools in a GIS to carry out the
computation
103Spatial Analysis and Modelling by Tadele Feyssa, Wollega
University

3rd step is the implementation and calibration of the model
Data are needed for running and calibrating the model
4th Validate the model
104Spatial Analysis and Modelling by Tadele Feyssa, Wollega
University

GIS can assist the modeling process in several ways.
First, a GIS can be used a tool that can process, display,
and integrate different data sources including maps, digital
elevation models (DEMs), GPS (global positioning system)
data, images, and tables
These data are needed for the implementation, calibration,
and validation of a model.
105Spatial Analysis and Modelling by Tadele Feyssa, Wollega
University
A GIS can function as a database management tool and,
at the same time, is useful for modeling-related tasks such
as exploratory data analysis and data visualization.
Second, models built with a GIS can be vector-based or
raster-based
The choice depends on the nature of the model, data
sources, and the computing algorithm
106Spatial Analysis and Modelling by Tadele Feyssa, Wollega
University
Third, the distinction between raster-based and vector-
based models does not preclude GIS users from integrating
both types of data in the modeling process.
Fourth, the process of modeling may take place in a GIS or
require the linking of a GIS to other computer programs.
107Spatial Analysis and Modelling by Tadele Feyssa, Wollega
University

There are three scenarios for linking a GIS to other computer
programs
A loose coupling involves transfer of data files between the
GIS and other programs through import and export
A tight coupling gives the GIS and other programs a
common user interface. eg, the GIS can have a menu
selection to run a simulation program on soil erosion.
An embedded system packages the GIS and other
programs with shared memory and a common interface108Spatial Analysis and Modelling by Tadele Feyssa, Wollega
University
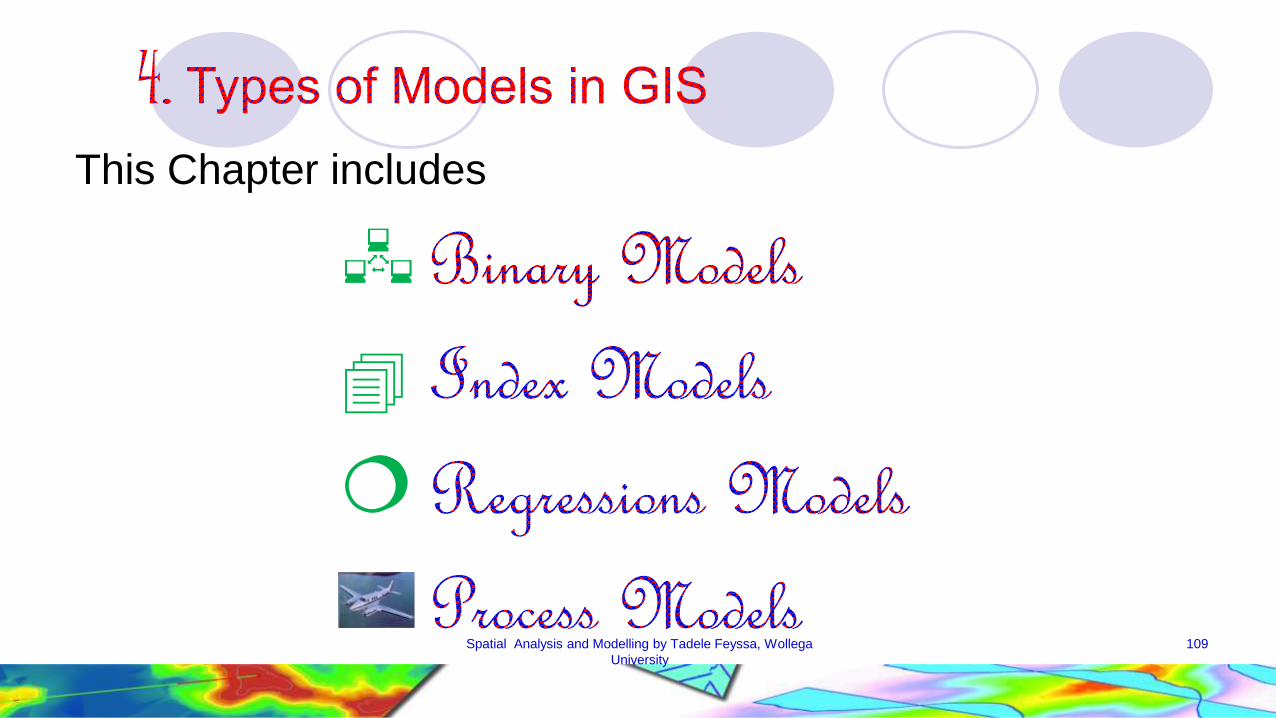
This Chapter includes
109Spatial Analysis and Modelling by Tadele Feyssa, Wollega
University
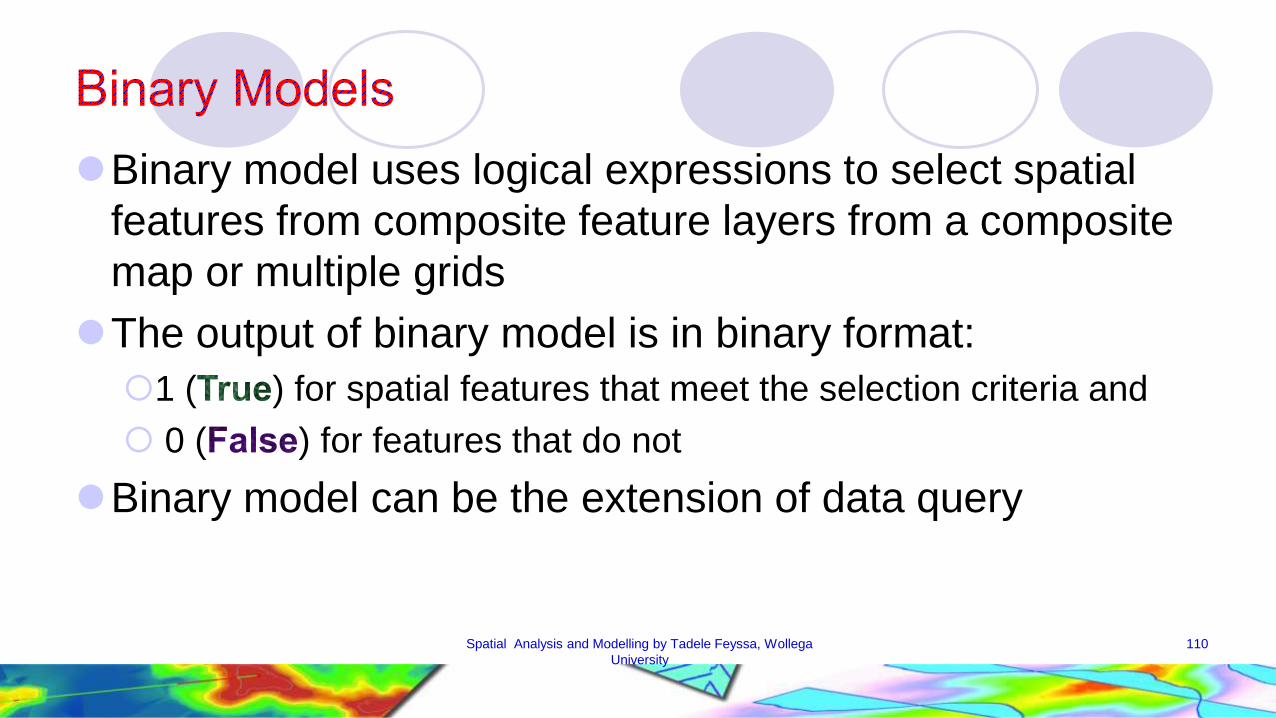
Binary model uses logical expressions to select spatial
features from composite feature layers from a composite
map or multiple grids
The output of binary model is in binary format:
1 ( ) for spatial features that meet the selection criteria and
0 ( ) for features that do not
Binary model can be the extension of data query
110Spatial Analysis and Modelling by Tadele Feyssa, Wollega
University

Site selection is the most common application of the
binary model
A siting analysis determines if a unit area meets a set of
selection criteria for locating a certain activities
Two approaches may be used to run a siting analysis
One is to evaluate the preselected sites
The second is to evaluate all potential areas
111Spatial Analysis and Modelling by Tadele Feyssa, Wollega
University

For example a municipality wants to select potential industrial sites that meets the following criteria
At least 5 acres in size
Commercial zone
Not subject to flooding
Not more than 1 mile from a heavy-duty road
Less than 10 percent slope
Operationally the task involves the following
112Spatial Analysis and Modelling by Tadele Feyssa, Wollega
University

Operationally, the task involves the following from steps
Gather all layers (land use, flood potential, road and
slope) relevant to the selection criteria
Select heavy duty roads from the road layer and create a
1 mile buffer zone around them
Intersect the road buffer zone layer and other layers
Select sites which are equal to or larger than 5 acres
113Spatial Analysis and Modelling by Tadele Feyssa, Wollega
University

Application of Binary models
Change detection is a simple application of the binary mode
By overlaying two maps representing land covers at two
different points in time, one can query the attribute data
of the composite map to find, for example, where forested
land has been converted to housing development
114Spatial Analysis and Modelling by Tadele Feyssa, Wollega
University

Application of Binary models
Siting analysis is probably the most common application of
the binary model
A siting analysis determines if a unit area (a polygon or a
cell) meets a set of selection criteria for locating for example
a landfill
There are at least two approaches to conducting a siting
analysis.
115Spatial Analysis and Modelling by Tadele Feyssa, Wollega
University
On evaluates a set of nominated or preselected sites
And the other evaluates all potential sites
Although the two approaches may use different sets of
selection criteria, they follow the same approach for
evaluation
116Spatial Analysis and Modelling by Tadele Feyssa, Wollega
University

12
3
12
3
4
ID Suit
1
2
3
3
1
2
ID Type
1
2
3
21
18
6
12
34
5 67
Suit = 2 AND Type = 18
ID
1
2
3
5
6
7
Suit Type
3
3
1
2
2
1
21
18
18
21
6
6
4 2 18
++
An illustration of a vector-based binary model. The two maps at the top are
overlaid so that their spatial features and their attributes of Suit and Type are
combined. A logical expression, Suit = 2 AND Type = 18, results in the selection
of polygon 4 in the output.
117Spatial Analysis and Modelling by Tadele Feyssa,
Wollega University

1 1 1 4
3 2 4 4
3 3 3 4
4 4 4 4
1 1 1 3
3 2 2 3
3 3 4 4
3 3 4 4
Grid 1 Grid 2
([Grid1] = 3)
AND
([Grid2] = 3)=
An illustration of a raster-based binary model. A query statement, ([Grid1] = 3)
AND ([Grid2] = 3), results in the selection of 3 cells in the output.
118Spatial Analysis and Modelling by Tadele Feyssa,
Wollega University

An index model calculates the index value for each unit
area and produces a ranked map based on the index
values.
An index model is similar to a binary model in that both
involve multi-criteria evaluation and both depend on overlay
operations for data processing
But an index model produces for each unit area an index
value rather than a simple yes or no
119Spatial Analysis and Modelling by Tadele Feyssa, Wollega
University

The primary consideration in developing an index model,
either vector-based or raster, is the method for computing
the index value
The weighted linear combination method is probably the
most common method for computing the index value
120Spatial Analysis and Modelling by Tadele Feyssa, Wollega
University
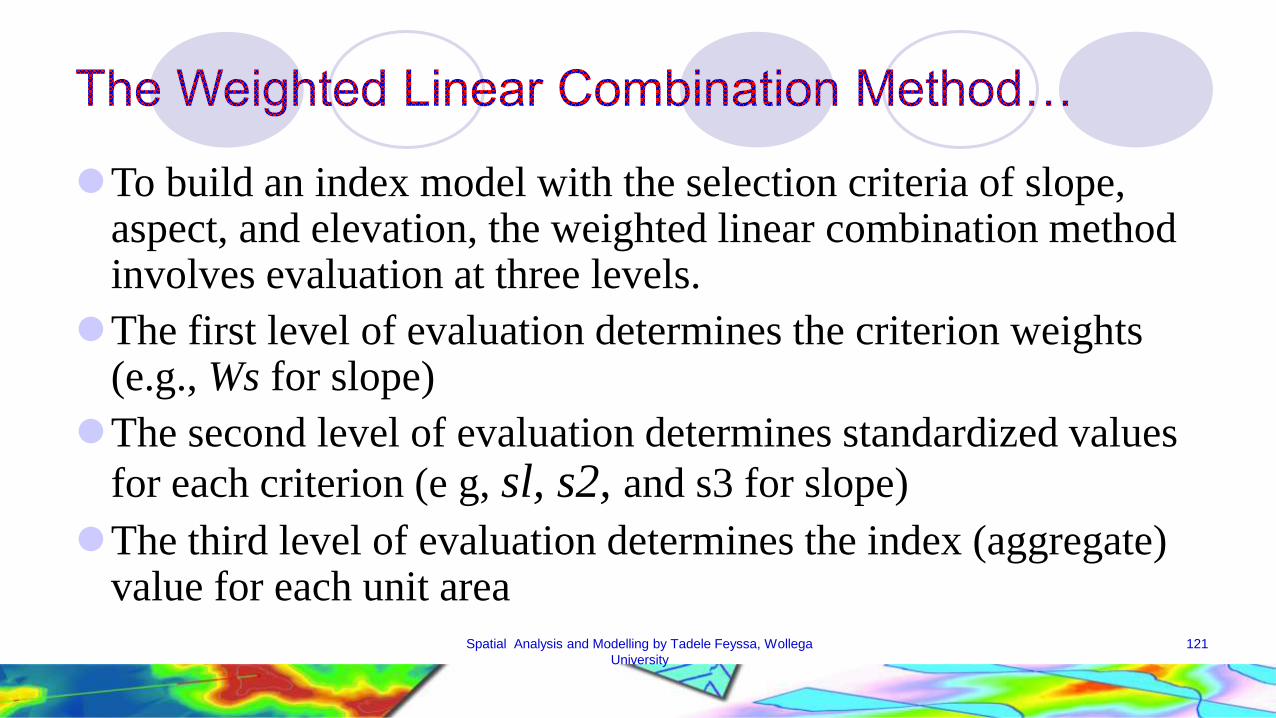
To build an index model with the selection criteria of slope, aspect, and elevation, the weighted linear combination method involves evaluation at three levels.
The first level of evaluation determines the criterion weights (e.g., Ws for slope)
The second level of evaluation determines standardized values
for each criterion (e g, sl, s2, and s3 for slope)
The third level of evaluation determines the index (aggregate) value for each unit area
121Spatial Analysis and Modelling by Tadele Feyssa, Wollega
University

Weighted linear combination is a common method for
computing the index value
For example combination of slope aspect and elevation
Weighted linear combination involves evaluation at three
levels
122Spatial Analysis and Modelling by Tadele Feyssa, Wollega
University

To build an index model with the selection criteria of slope, aspect, and elevation, the
weighted linear combination method involves evaluation at three levels. The first level of
evaluation determines the criterion weights (e.g., Ws for slope). The second level of
evaluation determines standardized values for each criterion (e.g., s1, s2, and s3 for slope).
The third level of evaluation determines the index (aggregate) value for each unit area. 123Spatial Analysis and Modelling by Tadele Feyssa,
Wollega University
12
3
1
2
3
0.640.46
0.14
0.26
0.440.68
0.56
12
3
4
56
7
(S_V * 0.4) + (T_V * 0.6)
+
+
ID Suit
1
2
3
3
1
2
S_V
1.0
0.2
0.52
ID Type
1
2
3
21
18
6
T_V
0.4
0.1
0.83
ID
1
2
3
4
5
6
7
S_V
0.2
1.0
1.0
0.2
0.5
0.5
0.5
T_V
0.4
0.1
0.1
0.1
0.4
0.8
0.8
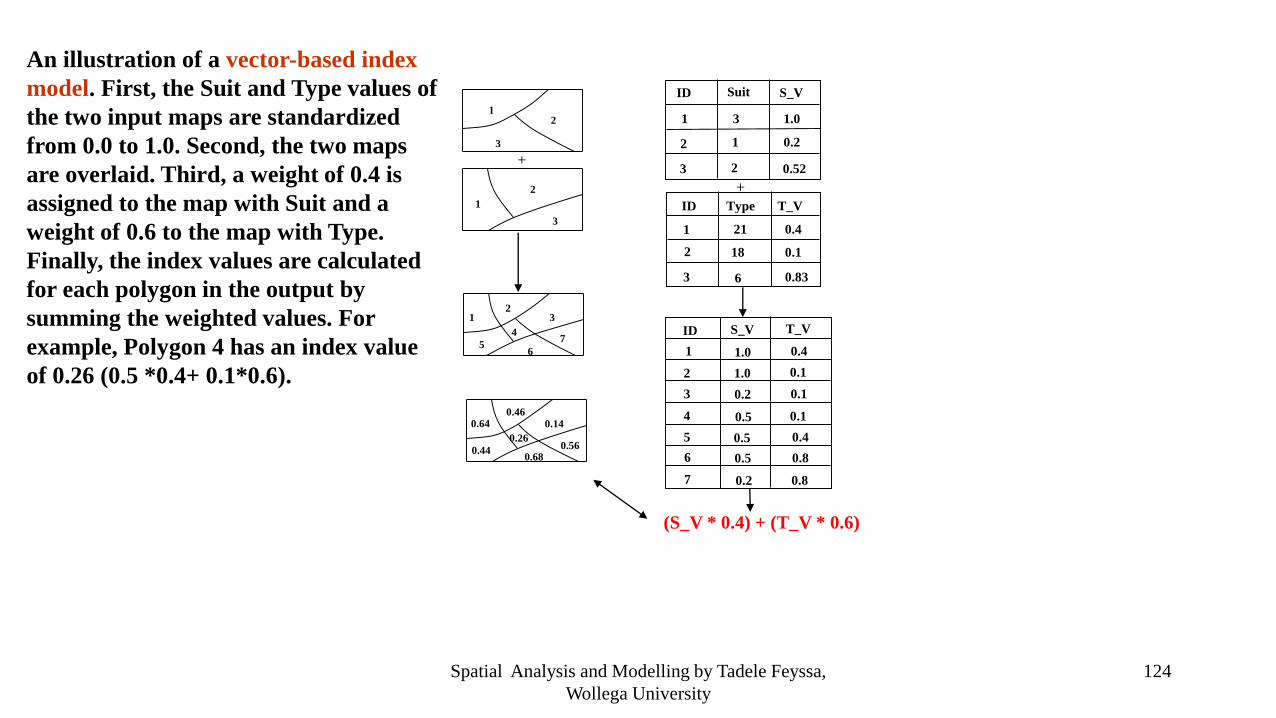
An illustration of a vector-based index
model. First, the Suit and Type values of
the two input maps are standardized
from 0.0 to 1.0. Second, the two maps
are overlaid. Third, a weight of 0.4 is
assigned to the map with Suit and a
weight of 0.6 to the map with Type.
Finally, the index values are calculated
for each polygon in the output by
summing the weighted values. For
example, Polygon 4 has an index value
of 0.26 (0.5 *0.4+ 0.1*0.6).
124Spatial Analysis and Modelling by Tadele Feyssa,
Wollega University

7 21
32 49
1 3
5 2
45 57
63 31
0.2 0.6
0.8 1.0
0.2 0.6
1.0 0.4
0.6 0.8
1.0 0.4
0.12 0.36
0.48 0.60
0.04 0.12
0.20 0.08
0.12 0.16
0.20 0.08
0.28 0.64
0.88 0.76
x 0.6 x 0.2 x 0.2
Input
grids
Standardize cell values
into 0.0-1.0 scale
Multiply by
criterion weights
Calculate index values by summing
weighted criterion values
An illustration of a raster-based index model. First, the cell values of each input grid
are converted into the standardized scale of 0.0 to 1.0. Second, the index values in
the output grid are calculated by summing the products of each grid multiplied by its
assigned weight. For example, the index value of 0.28 is calculated from: 0.2*0.6 +
0.2*0.2 + 0.6*0.2, or 0.12 + 0.04 + 0.12. 125Spatial Analysis and Modelling by Tadele Feyssa,
Wollega University
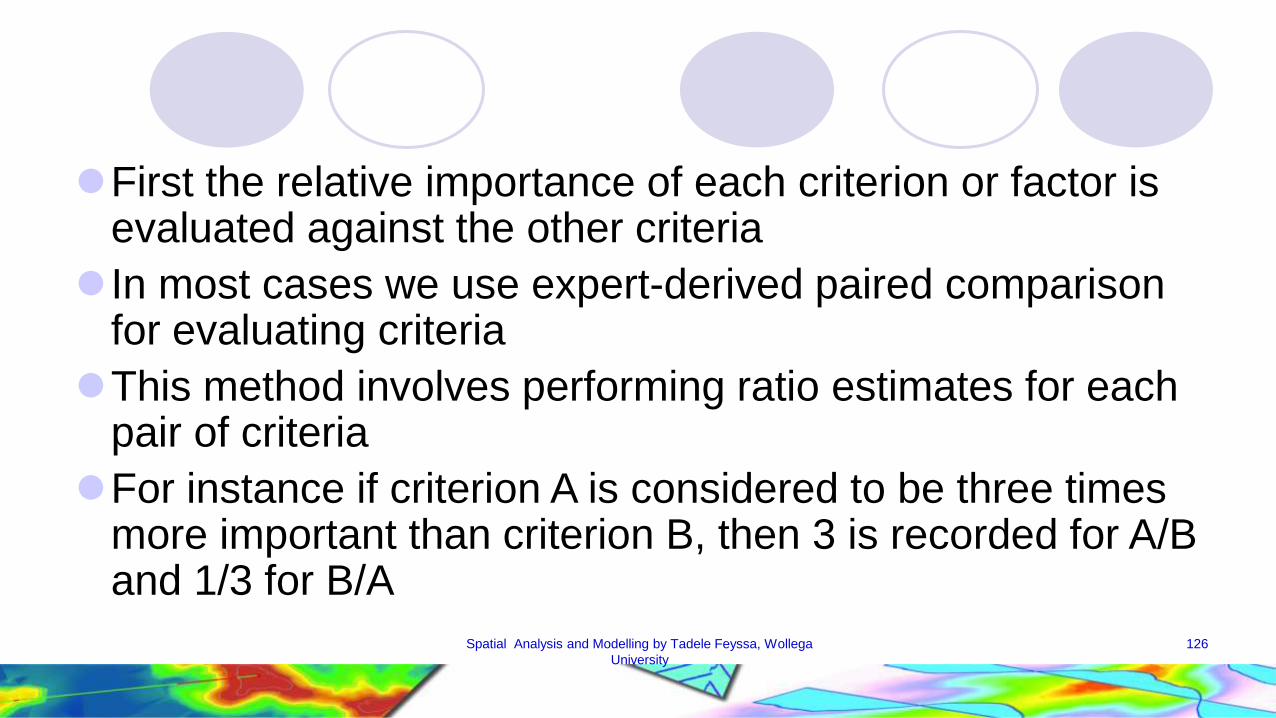
First the relative importance of each criterion or factor is evaluated against the other criteria
In most cases we use expert-derived paired comparison for evaluating criteria
This method involves performing ratio estimates for each pair of criteria
For instance if criterion A is considered to be three times more important than criterion B, then 3 is recorded for A/B and 1/3 for B/A
126Spatial Analysis and Modelling by Tadele Feyssa, Wollega
University
Application of the Index model
Index model are commonly used for suitability analysis
and vulnerability analysis
A suitability analysis ranks areas for their appropriateness
for a particular use
A vulnerability analysis assess areas for their
susceptibility to a hazard or a disaster
Both analysis requires careful consideration of criteria and
criterion weights
127Spatial Analysis and Modelling by Tadele Feyssa, Wollega
University

128Spatial Analysis and Modelling by Tadele Feyssa, Wollega
University
3. Regression Model
Regression model relates a dependent variable to a
number of independent (explanatory) variables in an
equation which can then be used for prediction or
estimation
Regression model can use an overlay operation in GIS to
combine variables needed for the analysis
There are two types of regression model; linear and
logistic regression
129Spatial Analysis and Modelling by Tadele Feyssa, Wollega
University

Regression Model…
Some GIS packages are capable of performing linear or
logistic regression analysis
Both Arclnfo Workstation and IDRISI have commands to
build raster-based linear or logistic models
In fact it is not powerful like statistical analysis packages
130Spatial Analysis and Modelling by Tadele Feyssa, Wollega
University

Linear Regression Model
A multiple linear regression model is defined by
Y= a+b1Xi +b2x2+……bnxnWhere y is the dependent variable, Xi is the
independent variable I and b1,….. bn are the regression
coefficients a is the intercept
The primary purpose of linear regression is to predict
values of y from values of Xi
131Spatial Analysis and Modelling by Tadele Feyssa, Wollega
University
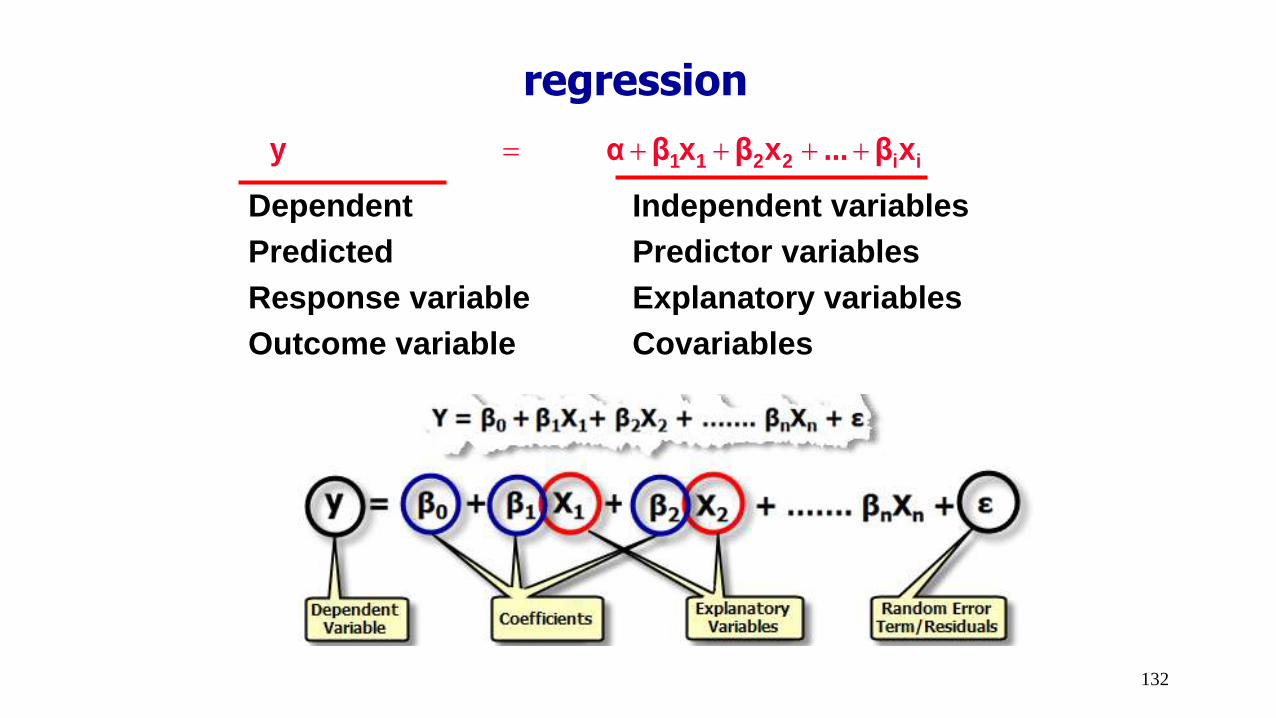
regression
Dependent Independent variables
Predicted Predictor variables
Response variable Explanatory variables
Outcome variable Covariables
xβ ... xβ xβα y ii2211
132
Logistic Regression Model
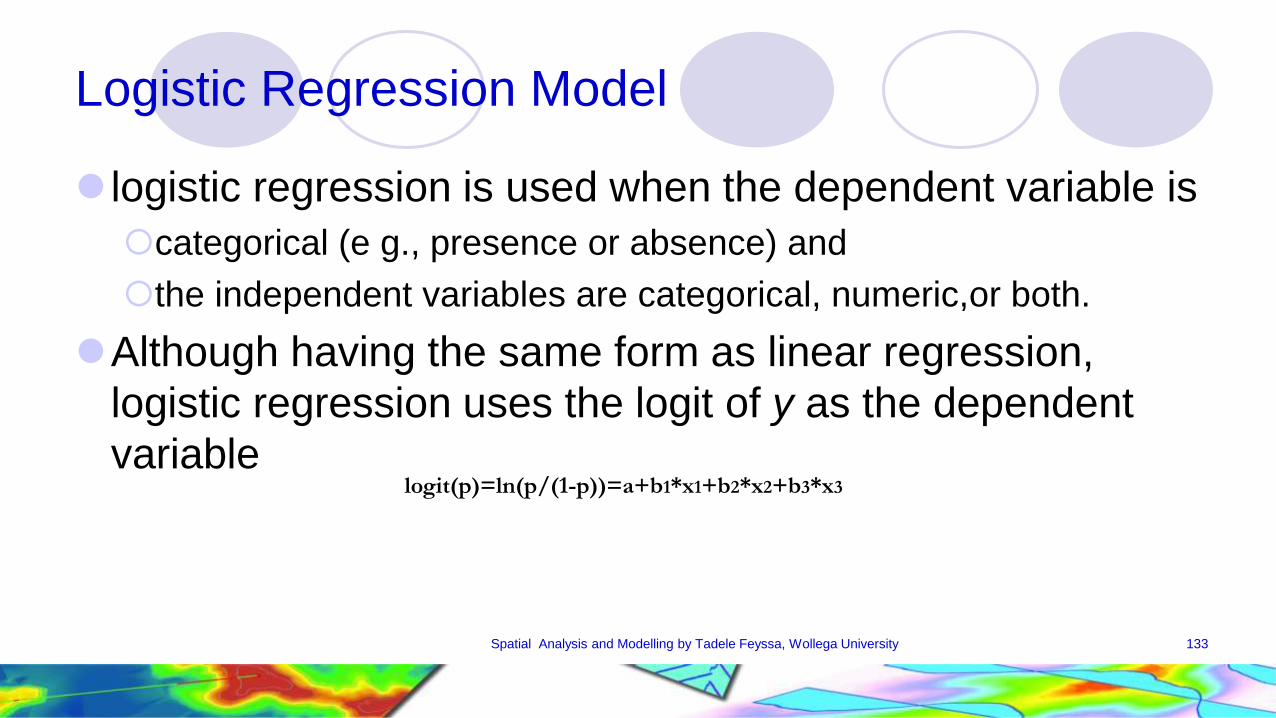
logistic regression is used when the dependent variable is
categorical (e g., presence or absence) and
the independent variables are categorical, numeric,or both.
Although having the same form as linear regression,
logistic regression uses the logit of y as the dependent
variable
133Spatial Analysis and Modelling by Tadele Feyssa, Wollega University
logit(p)=ln(p/(1-p))=a+b1*x1+b2*x2+b3*x3

Regression analysis applications
Regression analysis can be used for a large variety of
applications:
Modeling traffic accidents as a function of speed, road
conditions, weather, and so forth, to inform policy aimed
at decreasing accidents.
Modeling property loss from fire as a function of variables
such as degree of fire department involvement, response
time, or property values.
134Spatial Analysis and Modelling by Tadele Feyssa, Wollega
University

There are three primary reasons you might want
to use regression analysis:
To model some phenomenon to better understand it.
The basic objective is to measure the extent that changes
in one or more variables jointly affect changes in another.
Example: Understand the key characteristics of the
habitat for some particular endangered species of bird
(perhaps precipitation, food sources, vegetation,
predators) to assist in designing legislation aimed at
protecting that species.
135Spatial Analysis and Modelling by Tadele Feyssa, Wollega
University
It is mainly applied for bird habitat identification, rainfall-
triggered land slide model, predicting grass land bird
habitat attitude towards national park designation
136Spatial Analysis and Modelling by Tadele Feyssa, Wollega
University
4. Process ModelsA process model integrates existing knowledge about the
environment process in the real world into:
a set of relationships and equations for quantifying the processes
A process model offers both a predictive capability and an
explanation that is inherent in the proposed processes
Therefore process models are by definition predictive and
dynamic models
137Spatial Analysis and Modelling by Tadele Feyssa, Wollega University

Environmental models are very complex and data
intensive
Environmental models are typically process models
because they must deal with the interaction of many
variables including physical variables such as climate,
topography, vegetation, and soils as well as cultural
variables such as land management
138Spatial Analysis and Modelling by Tadele Feyssa, Wollega
University

Revised Universal Soil Loss Equation (RUSLE)
RUSLE is a model that is widely used to estimate average annual nonchannelized soil loss.
Soil erosion is an environmental Process that involves climate, soil properties, topography, soil surface conditions and human activities
A well known model of soil erosion is the Revisited Universal Soil Loss Equation (RUSLE)
RUSLE predicts the average soil loss carried by runoff from specific field slopes in specified cropping and management systems from range land
139Spatial Analysis and Modelling by Tadele Feyssa, Wollega
University

RUSLE is a multiplicative model with six factors
A= R*K*L*S*C*P
Where A is average soil loss
R- is the rainfall fun off erosivity factor
K is the soil erodibility factor
L is the slope length factor
S is the slope steepness factor
C is crop management factor(land cover) and
P = Support practice factor (conservation)
140Spatial Analysis and Modelling by Tadele Feyssa, Wollega
University

L and S can be combined into single topographic factor LS
Slope length is defined as the horizontal distance from the
point of origin of overland flow to the point where either the
lope gradient decreases enough that deposition begins or
the flow is concentrated in a defined channel
RUSLE permits the estimation of long-term soil loss in a wide
range of environmental settings.
RUSLE is the primary means for estimating soil loss on farm fields
and rangelands141
Spatial Analysis and Modelling by Tadele Feyssa, Wollega University

The RUSLE module not only allows the user to estimate average
annual soil loss for existing conditions, it permits one to simulate
how landuse change (C factor), climate change (R factor), and/or
changes in conservation/management practices (P factor), will
affect soil loss.
Spatial Analysis and Modelling by Tadele Feyssa, Wollega
University
142

Critical Rainfall Model
Land slide is defined as a down slope movement of a
mass of soil and a rock material
A landslide hazard model measures the potential of
landslide occurrence within the given area
GIS has been employed in the past decades for
development of landslide models
143Spatial Analysis and Modelling by Tadele Feyssa, Wollega University

There are two types of landslide models; Physically based
and statistical based models
Regression model is an example of statistical based land
slide model
Critical Rainfall model is an example of physically based
landslide model
The infinite slope model defines slope stability as the ratio of
the available shear strength (Stabilizing forces) including soil
and root cohesion to the shear of stress (destabilizing forces). 144Spatial Analysis and Modelling by Tadele Feyssa, Wollega
University

The Critical Rainfall model combines the infinite slope model with a steady hydrologic model to predict the critical rainfall Qcr that can cause landslide Qcr can be calculated
Qcr = T sinѲ (a/b) (ps/pw)(1- sinѲ-C/cosѲtanØ)
T is saturated soil transmissivity
Ѳ is local slope angel
a is the upslope contributing drainage area
b is the unit contour length (the raster resolution)
Ps is wet soli density
Ø is the internal friction angle of the soil
Pw is the density of water
C is combined cohesion
145Spatial Analysis and Modelling by Tadele Feyssa, Wollega
University
Critical rainfall model is regularly used for predicting
shallow landslides triggered by rainfall events
146Spatial Analysis and Modelling by Tadele Feyssa, Wollega
University
Digital Elevation Model (DEM)
The land surface has been the object of mapping,
modelling and analysis for several years
Map makers devised many techniques for terrain
mapping; such as contouring, hill shading, 3D-view
perspectives, etc.
Geomorphologists have developed measures of the land
surface which include slope, aspect and surface curvature
147Spatial Analysis and Modelling by Tadele Feyssa, Wollega
University
Terrain mapping is no more a subject of specialists.
GIS has made it relatively easy to incorporate them in
many application areas
Slope and aspect play a regular role in hydrological
modelling, snow cover evaluation, soil mapping land slide
area delineation and soil erosion modelling
148Spatial Analysis and Modelling by Tadele Feyssa, Wollega
University

Most GIS packages treat elevation data (Z values) as
attribute data at point or cell location
However, in 3-D model an additional coordinate to x and y
In raster data modelling the z value corresponds to the
cell value
In vector data modelling the z value will be stored as
attribute data
149Spatial Analysis and Modelling by Tadele Feyssa, Wollega
University
Digital elevation model and TIN
Digital elevation model is a data input for terrain mapping
The two most common data input for terrain mapping and analysis are DEM and TIN
Digital elevation model (DEM) is based on raster data analysis
Triangulated irregular network (TIN) is based on vector based data analysis
We can’t use TIN and DEM together but we can change TIN to DEM or DEM to TIN
150Spatial Analysis and Modelling by Tadele Feyssa, Wollega
University

DEM
A DEM represents a regular array of elevation points
A point based DEM must be converted before using this
data for terrain mapping
This conversion simply places each point in the DEM at
the centre of a cell in elevation raster
Therefore DEM and elevation raster can be used
interchangeably
151Spatial Analysis and Modelling by Tadele Feyssa, Wollega
University

152Spatial Analysis and Modelling by Tadele Feyssa, Wollega
University

2301m
153Spatial Analysis and Modelling by Tadele Feyssa, Wollega
University

154Spatial Analysis and Modelling by Tadele Feyssa, Wollega
University
155Spatial Analysis and Modelling by Tadele Feyssa, Wollega
University

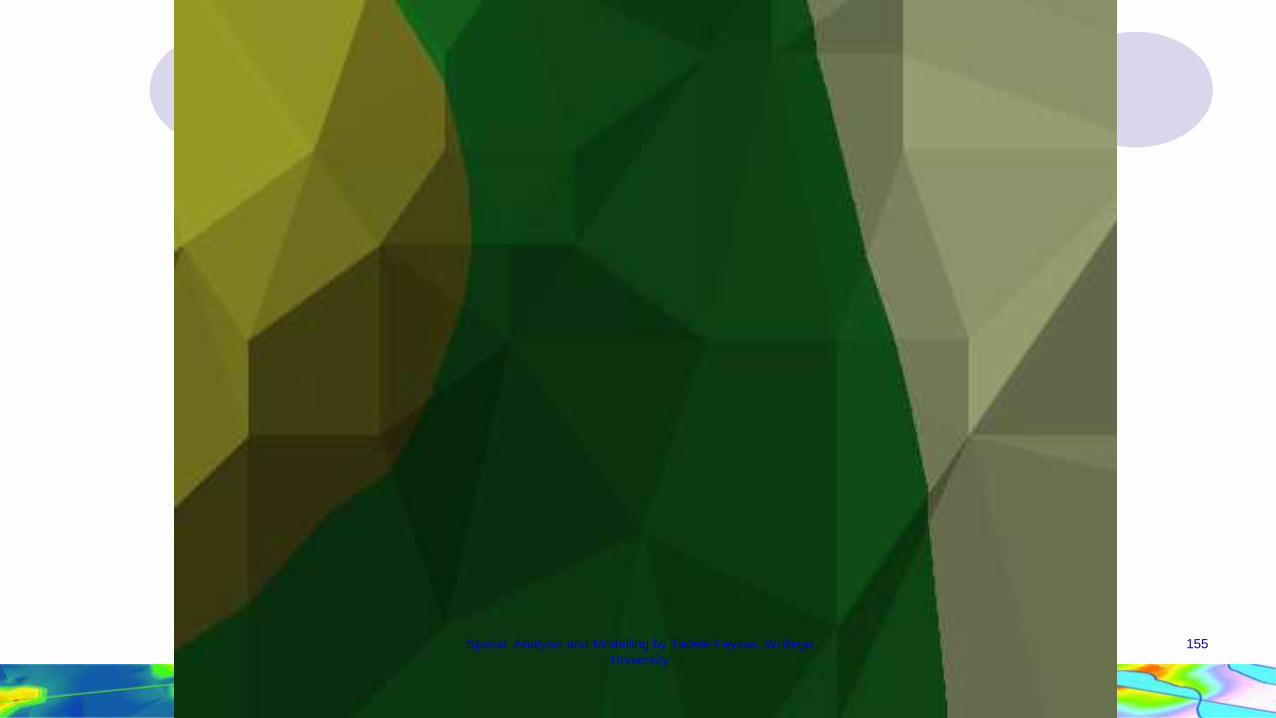
TIN
A TIN approximates the land surface with a series of non-
overlapping triangles
Elevation values (Z values) along x, y, coordinates are
stored at nodes that make up the triangles
Unlike the DEM the TIN is based on an irregular
distribution of elevation points
156Spatial Analysis and Modelling by Tadele Feyssa, Wollega
University

Terrain Mapping
There are different kinds of terrain mapping
Contouring is the most common for the terrain mapping it
has contour interval and base contour
The arrangement and pattern of contour lines reflect the
topography
Contour lines don’t intersect one an other and will not stop
in the middle of the map
157Spatial Analysis and Modelling by Tadele Feyssa, Wollega
University

158Spatial Analysis and Modelling by Tadele Feyssa, Wollega
University

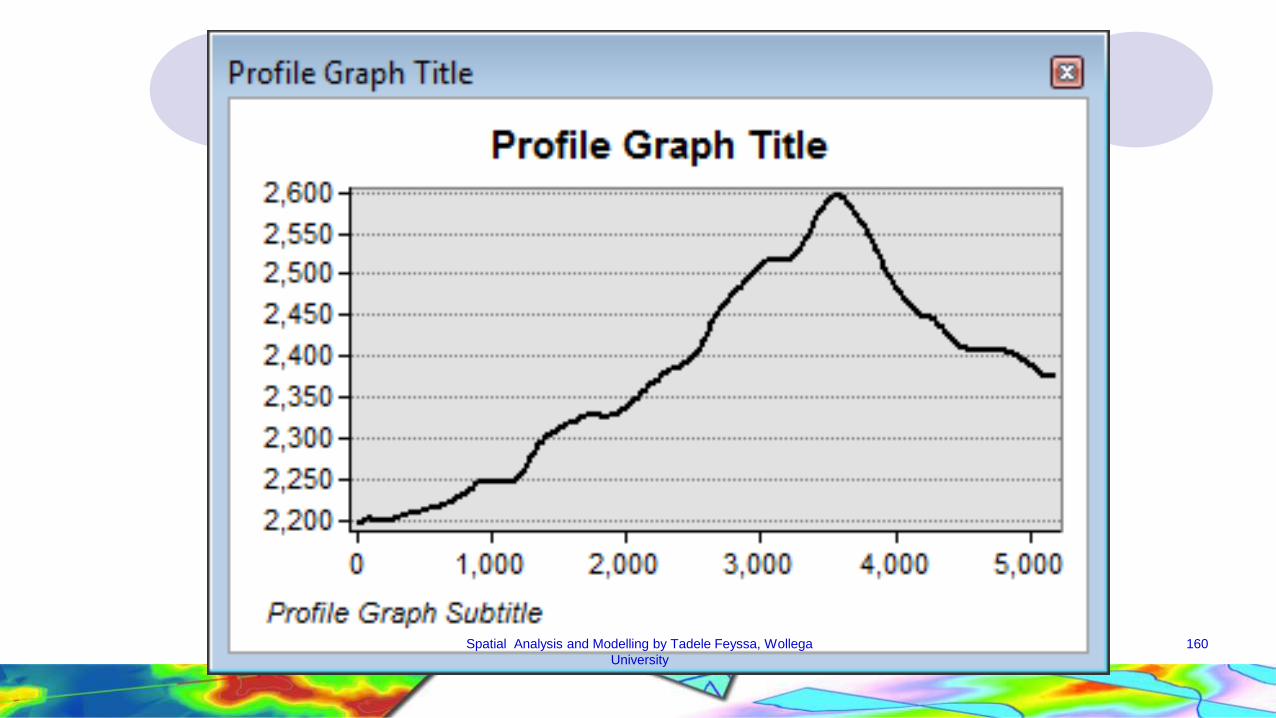
Vertical Profiling
A vertical profile shows changes in elevation along a line
such as a road or a stream
159Spatial Analysis and Modelling by Tadele Feyssa, Wollega
University
160Spatial Analysis and Modelling by Tadele Feyssa, Wollega
University
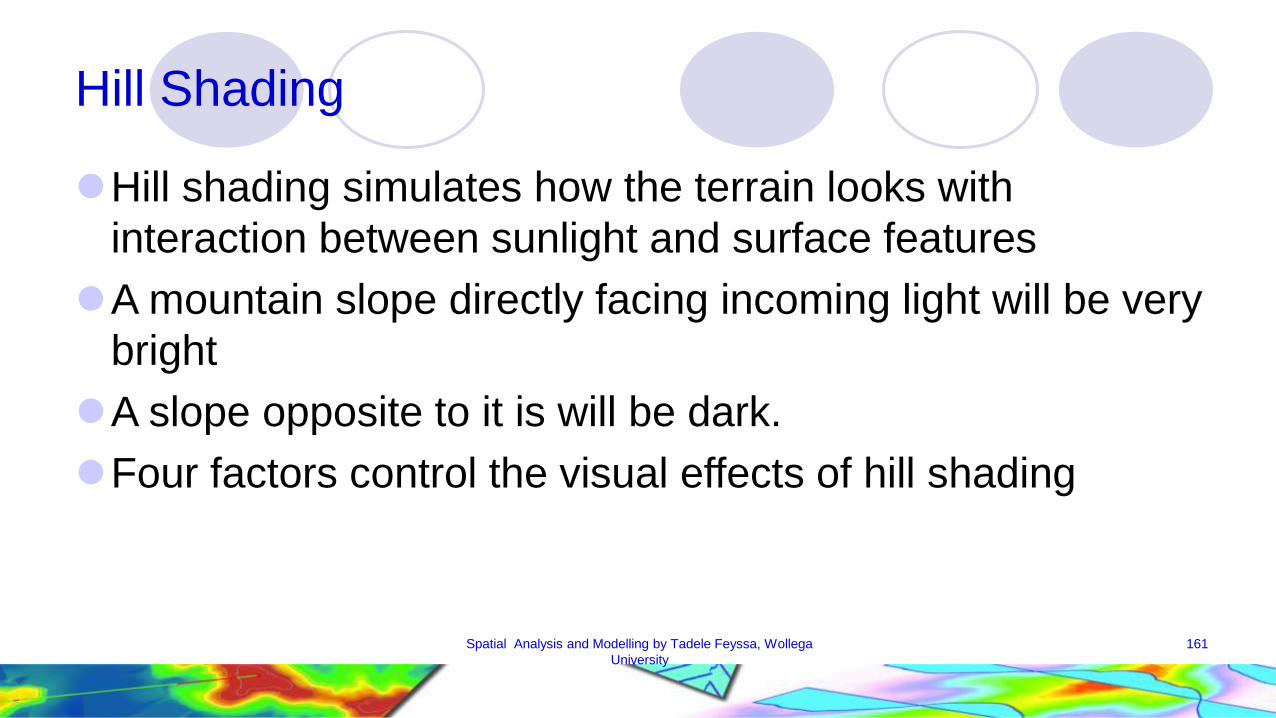
Hill Shading
Hill shading simulates how the terrain looks with
interaction between sunlight and surface features
A mountain slope directly facing incoming light will be very
bright
A slope opposite to it is will be dark.
Four factors control the visual effects of hill shading
161Spatial Analysis and Modelling by Tadele Feyssa, Wollega
University
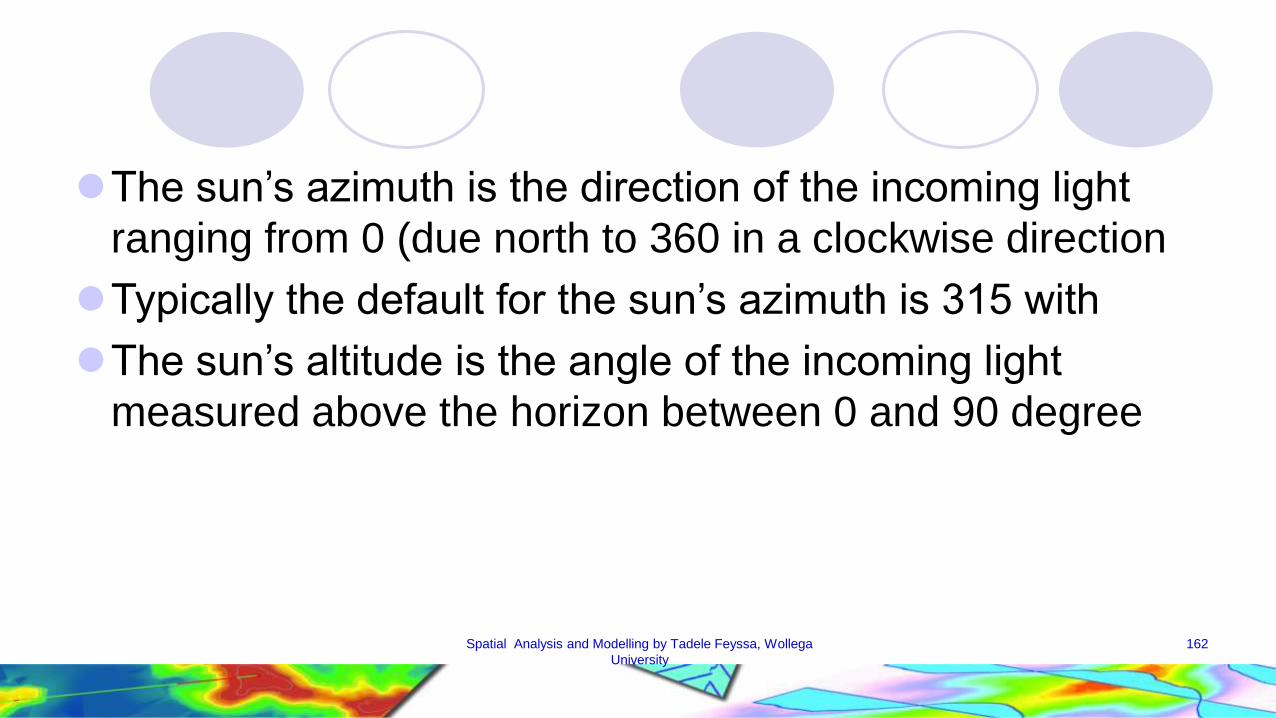
The sun’s azimuth is the direction of the incoming light
ranging from 0 (due north to 360 in a clockwise direction
Typically the default for the sun’s azimuth is 315 with
The sun’s altitude is the angle of the incoming light
measured above the horizon between 0 and 90 degree
162Spatial Analysis and Modelling by Tadele Feyssa, Wollega
University

The other two factors are slope and aspect
Slope ranges between 0 and 90 degrees
Aspect ranges between 0 and 360 degrees
Slope measures the rate of change of elevation at a
surface location
It can be expressed in percent or degree
Aspect is the directional measures slope
163Spatial Analysis and Modelling by Tadele Feyssa, Wollega
University
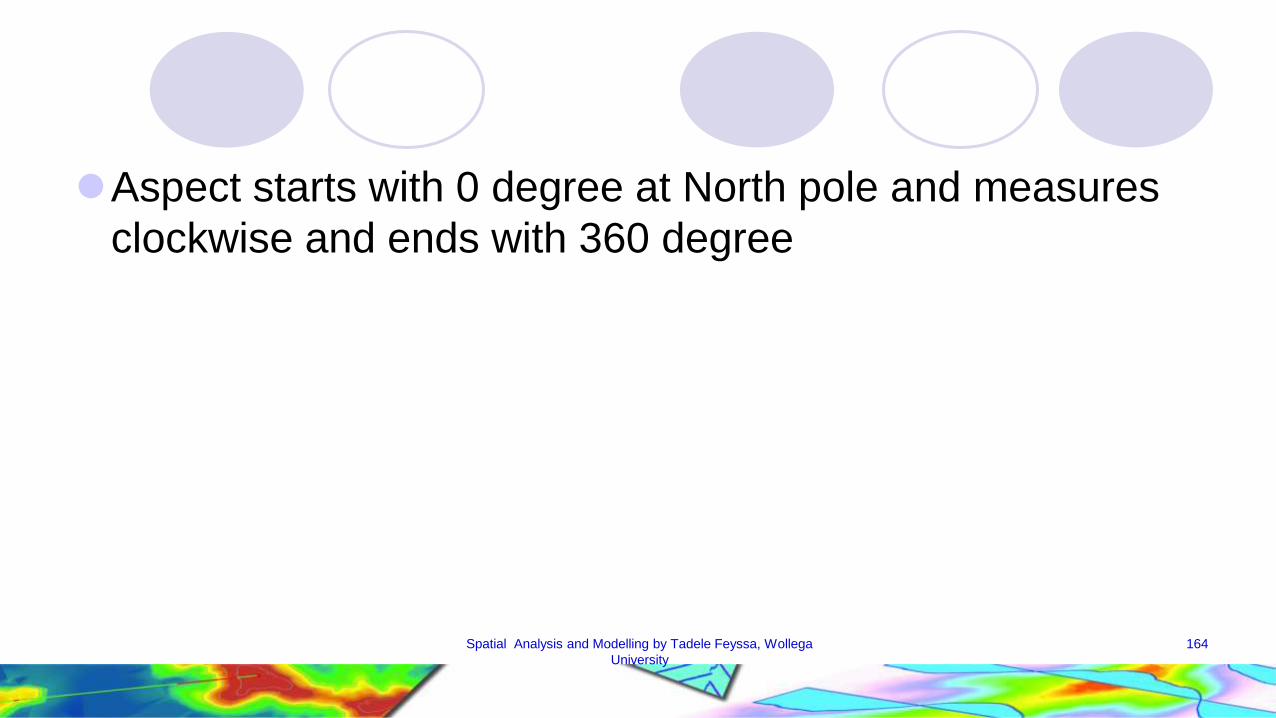
Aspect starts with 0 degree at North pole and measures
clockwise and ends with 360 degree
164Spatial Analysis and Modelling by Tadele Feyssa, Wollega
University
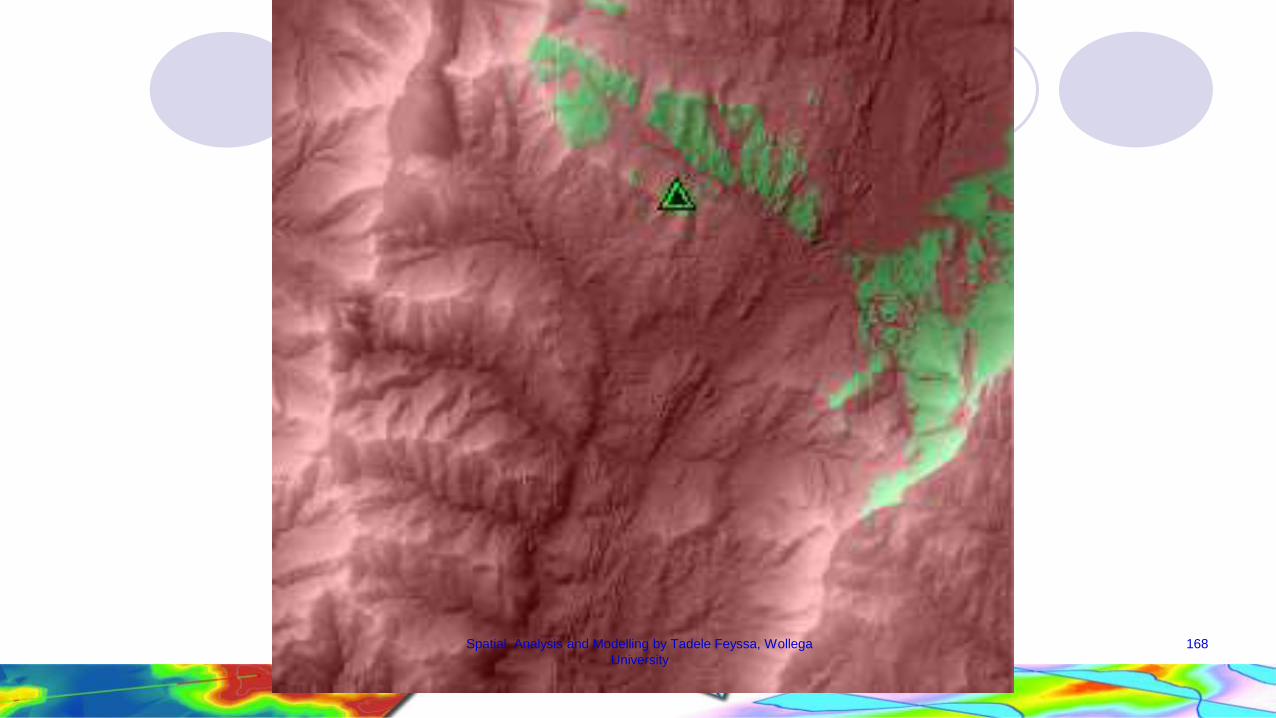
Viewshed Analysis
Viewshed refers to the portion of the land surface that is visible from one or more viewpoints
The process for deriving viesheds is called viewshed or visibility analysis
A veiwshed analysis requires two input datasets
The first is usually point layer containing one or more view points such as a layer containing communication tower
The second input is DEM (an elevation raster or a TIN which represents the land surface
165Spatial Analysis and Modelling by Tadele Feyssa, Wollega
University
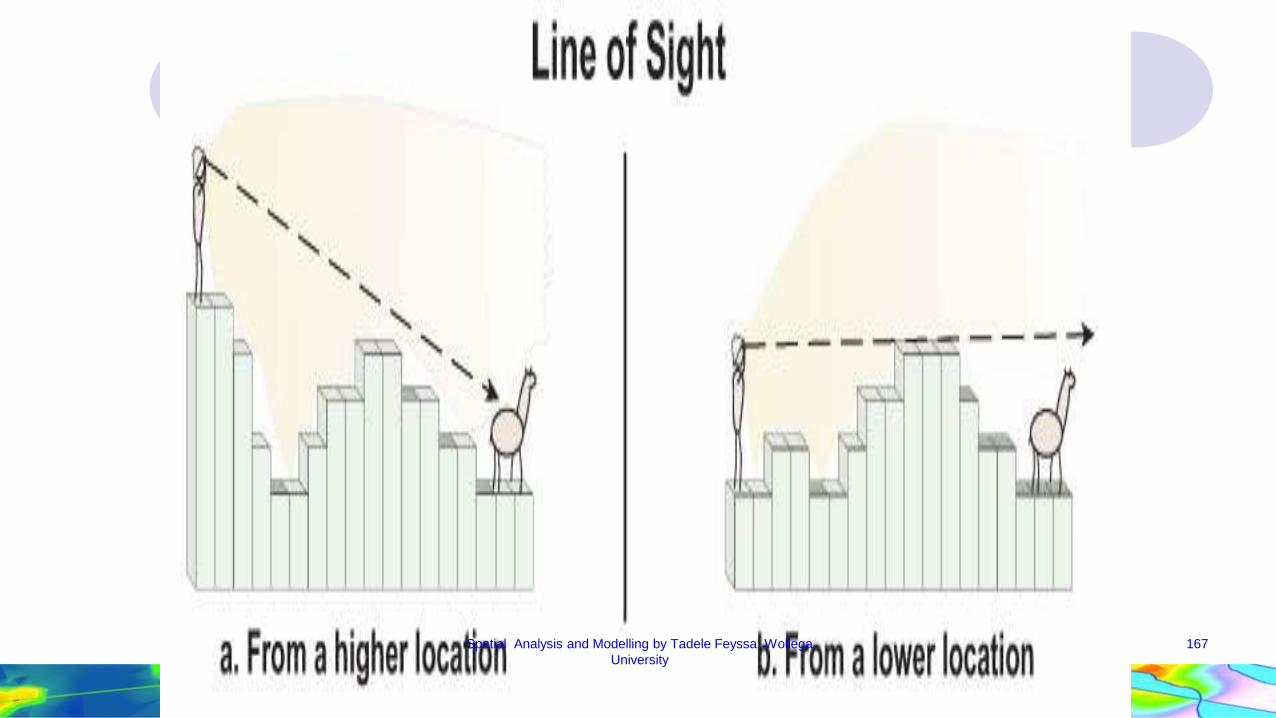
The line-of-sight operation is the basis for veiwshed
analysis
The line of sight also called sight-line, connects the
viewpoint and the target
GIS can display a sightline with symbols for the visible
and invisible portions a long the sightline
166Spatial Analysis and Modelling by Tadele Feyssa, Wollega
University
167Spatial Analysis and Modelling by Tadele Feyssa, Wollega
University
168Spatial Analysis and Modelling by Tadele Feyssa, Wollega
University

Parameters of Viewshed Analysis
A number of parameters can influence the result of a viewshed analysis
The first parameter is the viewpoint
After the view point is determined its elevation should be increased by the height of a physical structure
Fore example a forest lookout station is usually 15 to 20 meters high.
The height of the observation station can be added as an offset value to the elevation at the station
169Spatial Analysis and Modelling by Tadele Feyssa, Wollega
University

The second parameter is the viewing azimuth which sets
horizontal angle limits of the view
Azimuth system for measuring direction is based on the
360 degrees found in a full circle.
Viewing radius is the third parameter which sets the
search distance for deriving visible areas.
Other parameters include vertical viewing angle limits, the
earth’s curvature, tree height and building height
170Spatial Analysis and Modelling by Tadele Feyssa, Wollega
University

Application areas of viewshed
•Urban Planning
•Cell phone tower placement
•Location for wind turbines
•Conservation projects
Military purpose
•Many more!
171Spatial Analysis and Modelling by Tadele Feyssa, Wollega
University
Watershed Analysis
A watershed refers to an area defined by topographic
divides that drains surface water to a common outlet
A watershed is often used as a unit area for the
management and planning of water and other resources
Watershed analysis refers to the process of using DEMs
and following water flow to delineate stream networks and
watersheds
172Spatial Analysis and Modelling by Tadele Feyssa, Wollega
University

Traditionally watershed boundary can be drawn manually onto a topographic map
The person who draws the boundaries uses topographic features on the map to determine where a divide is located
Today computer based watershed analysis can do this job in a fraction of time
Delineation of watershed can tale place at different spatial scales
173Spatial Analysis and Modelling by Tadele Feyssa, Wollega
University

174Spatial Analysis and Modelling by Tadele Feyssa, Wollega
University
Delineation of watershed can be area based on point based
An area based method divides a study area into a series of
watershed one for each stream section
A point based method on the other hand derives a watershed
for each select point
The select point may be an outlet a gauge station or a dam
Both methods follow a series of steps, starting with a filled
DEM
175Spatial Analysis and Modelling by Tadele Feyssa, Wollega
University
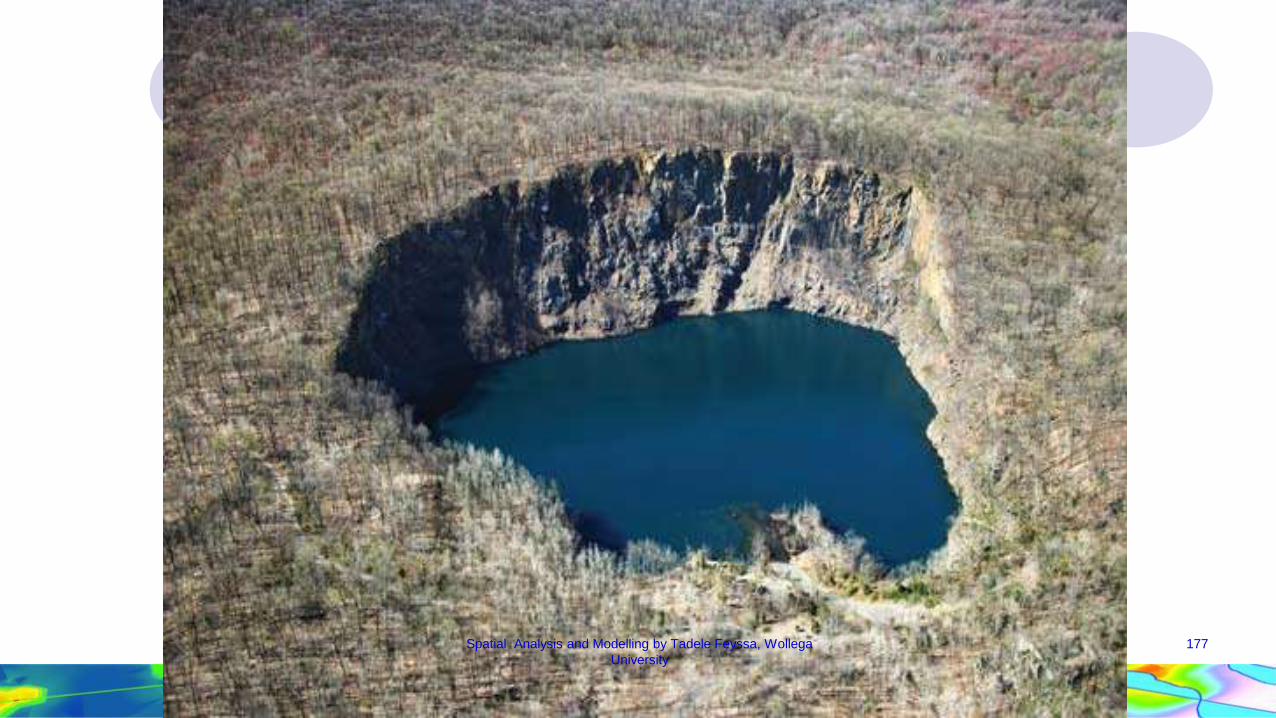
A filled DEM is void of depressions or sinks
A depression is a cell or cells surrounded by higher elevation values thus represent an area of internal drainage
Although some depressions are real most of them are the outcome of DEM imperfection
Therefore the Depression must be removed from a elevation raster
A common method fro removing a depression is to increase the cell value to the lowest overflow point out of the sink
176Spatial Analysis and Modelling by Tadele Feyssa, Wollega
University
177Spatial Analysis and Modelling by Tadele Feyssa, Wollega
University

178Spatial Analysis and Modelling by Tadele Feyssa, Wollega
University

179Spatial Analysis and Modelling by Tadele Feyssa, Wollega
University

180Spatial Analysis and Modelling by Tadele Feyssa, Wollega
University

Treating depressions
routing through false depressions:
filling
fill-in
181Spatial Analysis and Modelling by Tadele Feyssa, Wollega
University
Flow Direction
A flow direction raster shows the direction water will flow
out of each cell of a filled elevation raster
Flow directions are commonly determined using single
using single or multiple flow direction methods
D8 is a popular single flow direction method
The D8 assigns a cell’s flow direction to the one of its 8
surrounding cells that has the steepest distance-weighted
gradient
182Spatial Analysis and Modelling by Tadele Feyssa, Wollega
University
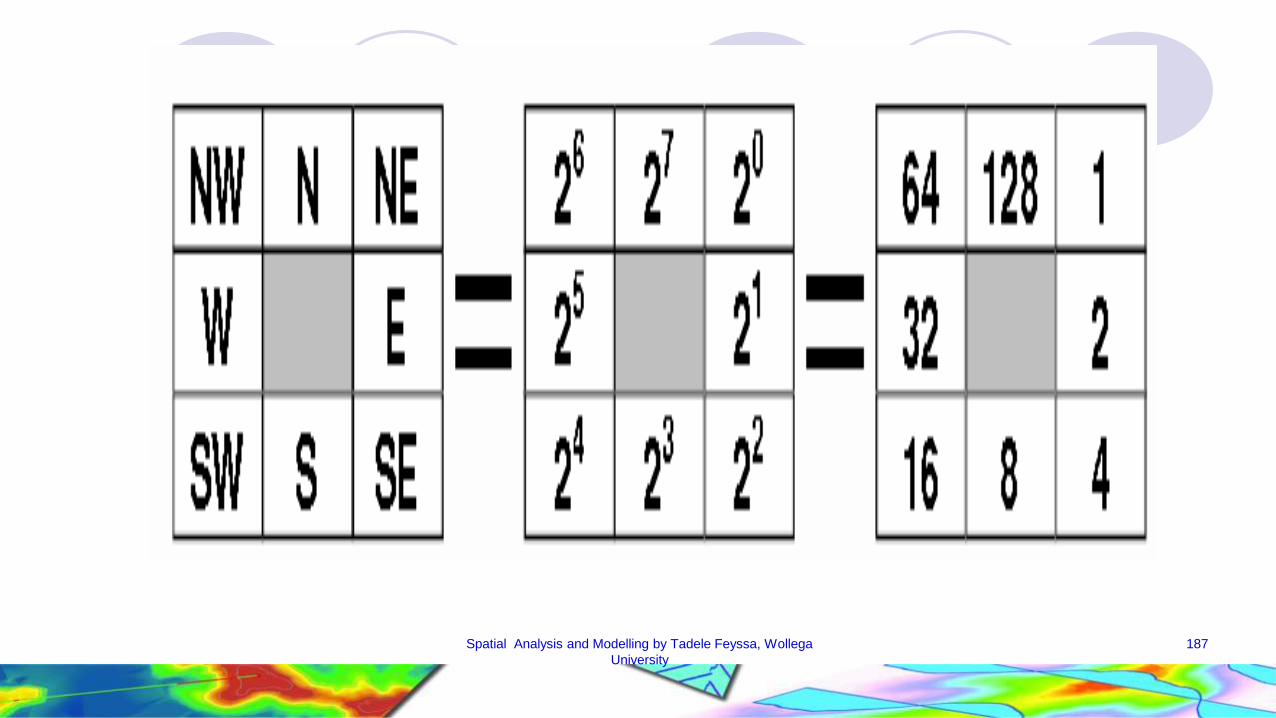
D8’ (8 direction) method , sets the flow direction towardthe lowest of the eight neighboring cells, in relation to thecentre cell.
Therefore, flow is allowed in one of eight possible directions, assuming that water will travel along the steepest down slope path
Based on the 3 x 3 cell neighborhood , flow would be directed from the centre cell (elevation of 8) to the southwest cell (elevation of 4).
183Spatial Analysis and Modelling by Tadele Feyssa, Wollega
University

184Spatial Analysis and Modelling by Tadele Feyssa, Wollega
University
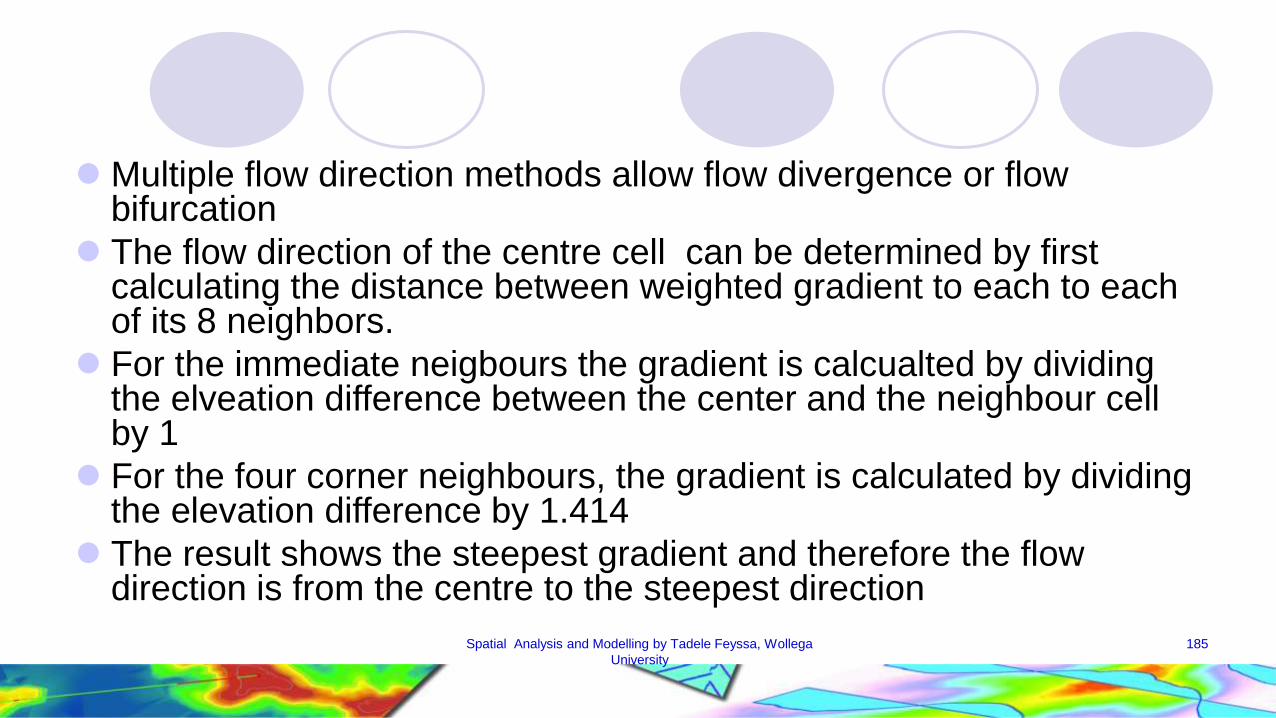
Multiple flow direction methods allow flow divergence or flow bifurcation
The flow direction of the centre cell can be determined by first calculating the distance between weighted gradient to each to each of its 8 neighbors.
For the immediate neigbours the gradient is calcualted by dividing the elveation difference between the center and the neighbour cell by 1
For the four corner neighbours, the gradient is calculated by dividing the elevation difference by 1.414
The result shows the steepest gradient and therefore the flow direction is from the centre to the steepest direction
185Spatial Analysis and Modelling by Tadele Feyssa, Wollega
University
Flow Direction for cell
1014 1011 1004
1019 1015 1007
1025 1021 1012
+1 +4 +11
-4 +8
-10 -6 +3
+0.71 +4 +7.78
-4 +8
-7.07 -6 +2.12
1
11.414
Cell Elevation Elevation difference Distance weight
Distance weight Gradient Flow direction
32 64 128
16 1
8 4 2
Flow direction
Number186Spatial Analysis and Modelling by Tadele Feyssa, Wollega
University
187Spatial Analysis and Modelling by Tadele Feyssa, Wollega
University

Flow accumulation
A flow accumulation raster tabulates for each cell number
of cells that will flow to it.
The tabulation is based on the flow direction raster
With the appearance of spanning tree a flow accumulation
raster records how many upstream cells will contribute
drainage to each cell
A flow accumulation raster can be interpreted in two ways.
188Spatial Analysis and Modelling by Tadele Feyssa, Wollega
University

First, Cells having high accumulation values generally
correspond to stream channels
Whereas cell having an accumulation value of zero
generally correspond to ridge lines
Second if multiplied by the cell size, the accumulation
value equals the drainage area
189Spatial Analysis and Modelling by Tadele Feyssa, Wollega
University
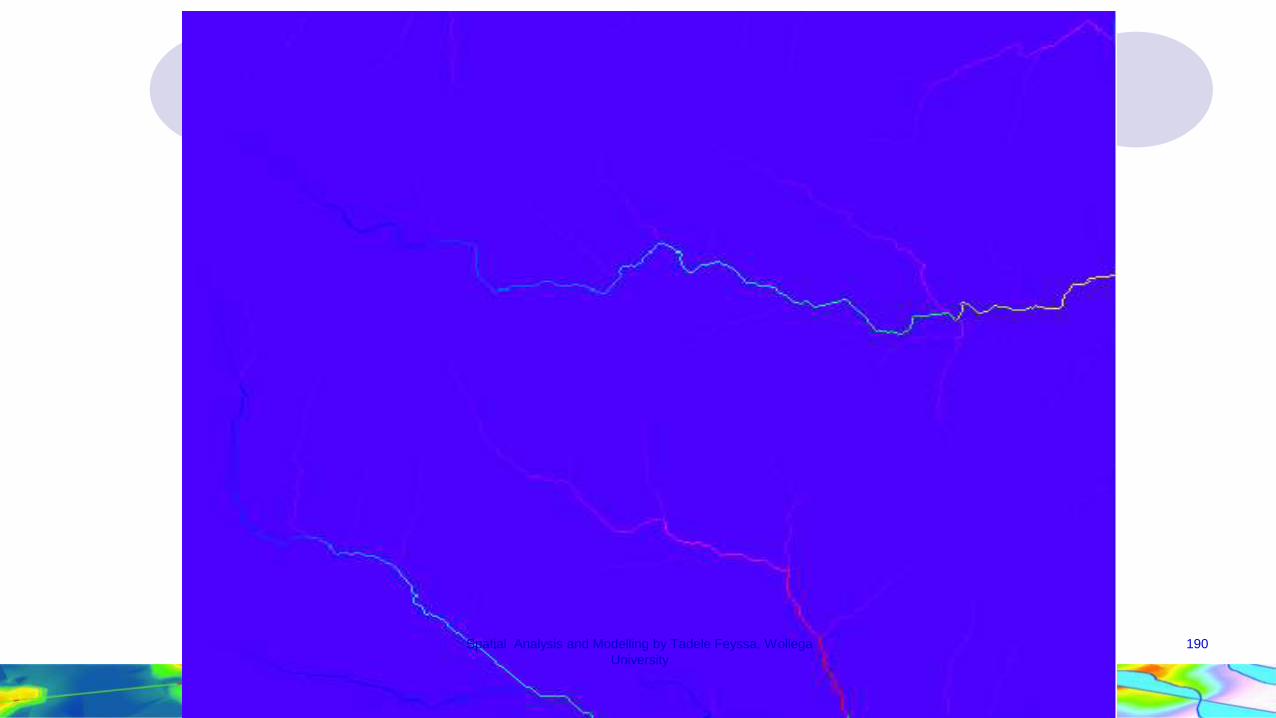
190Spatial Analysis and Modelling by Tadele Feyssa, Wollega
University
Stream network
A stream network can be derived from a flow accumulation raster
The derivation is based on the channel initiation threshold which represents the amount of discharge needed to maintain a channel head with contributing cells serving as a surrogate for discharge
A threshold value of 500 for example means that each cell of the drainage network has a minimum of 500 contributing cells
191Spatial Analysis and Modelling by Tadele Feyssa, Wollega
University

Stream links
After a stream network is derived from a flow
accumulation raster, each section of the stream raster line
is assigned a unique value and is associated with a flow
direction
A stream link raster therefore resembles a topology based
stream layer
The intersections or junctions are like nodes and the
stream sections between junctions are like arcs reaches
192Spatial Analysis and Modelling by Tadele Feyssa, Wollega
University
Area wide watershed
The final step is to delineate a watershed for each stream
section
This operation uses the flow direction raster and the
stream link raster as the inputs
A denser stream network (based on a smaller threshold
value) will have more but smaller watersheds
193Spatial Analysis and Modelling by Tadele Feyssa, Wollega
University

194Spatial Analysis and Modelling by Tadele Feyssa, Wollega
University

Point Based watershed
Sometimes we use point based for watershed analyis.
The points are called pour points or outlets
Delineation of water sheds based on individual pour
points follow the same procedure for delineating area
wide water sheds delineation
The only difference to substitute a point raster for a
stream link raster
195Spatial Analysis and Modelling by Tadele Feyssa, Wollega
University
In a point raster a cell representing a pour point must be
located over a cell that is part of the stream link
If a pour point is not located directly over a stream link, it
will result in a small incomplete watershed for the outlet
The relative location of the pour point to a stream network
determines the size of a point based watershed
196Spatial Analysis and Modelling by Tadele Feyssa, Wollega
University
We use the snap pour point command to snap pour point
to the cell the highest flow accumulation within a used
defined search distance
The snap pour point operation should be considered part
of the data processing for delineating point based
watersheds
197Spatial Analysis and Modelling by Tadele Feyssa, Wollega
University

Application of water shed analysis
Water shed analysis is mainly used for natural resource
management
• Floodplain Management
• Land Use Planning
• Invasive Species
• River Function
• Water Supply
198Spatial Analysis and Modelling by Tadele Feyssa, Wollega
University