spain an integrated modelling system has been developed by
TRANSCRIPT
An integrated modelling system for real-time
control of atmospheric pollution (SICEG)
J.I. Ibarra,* E. Piernagorda,^ J. Perena^
Spain
Abstract
An integrated modelling system has been developed by IBERDROLA andIBERSAIC for the real-time control of routine releases of passive pollutantsinto the atmosphere. The system has been called SICEG and it has beeninstalled at the Guardo power station in September 1995. SICEG has beendesigned to provide guidance to normal and especially planned operations atany industrial facility, in the control and minimization of the environmentalimpact. The system integrates a communication module, a meteorologicalpreprocessor, a modelling module and a display module. All these processeshave been implemented in a PC Pentium based computer under a 16 bitsWINDOWS environment.
1. Introduction
In April 1990, IBERDROLA received the approval to carry out an R + Dresearch project under the generic reference PIE- 134. 036. The aim of thisproject was the assessment of meteorological and atmospheric dispersionmodels by the use of tracer techniques, in particular SF*. In November 1990,an intensive field tracer campaign took place in the surroundings of the GuardoPower Station (GPS), north of Spain. The power plant is located within a deepcanyon, 300m depth, with a large plateau extending at the outlet of the valley.A total of 14 tracer experiments were carried out, combining surface andelevated releases of SF* through a 165m stack. A number of Spanish andinternational institutions participated in the experiments. In 1993 the projectended with the calibration and testing of a set of atmospheric models rangingfrom classical gaussian models to 3D non-hydrostatic models. In 1994 thePower Division of IBERDROLA takes the decision to support the
Transactions on Ecology and the Environment vol 10, © 1996 WIT Press, www.witpress.com, ISSN 1743-3541
626 Computer Techniques in Environmental Studies
implementation of an integrated modelling system for the real-time control ofgaseous emissions from the GPS. In 1995 the new system, SICEG, isdeveloped taking advantage of the lessons learned during the R+D project andinstalled at Guardo by the end of September 1995. Since then, the system isrunning normally and producing the expected advise to the staff operating thepower plant.
2. SICEG's structure
SICEG is integrated by four main modules: (1) a communication module calledMIR, (2) a meteorological preprocessor called METPRO, (3) a modellingmodule called MODAR and (4) a GUI display module. The modelling moduleis integrated by a 3D mass-consistent meteorological model (MATHEW) anda 3D particle-in-cell dispersion model (ADPIC). A description of thesemodules is presented in the paragraphs to come.
• MIR. The communication module performs remote and periodiccalls via modem to monitors and sensors located at the GPSstack, the on site meteorological station and to a localenvironmental network. MIR collects the SOj release rate, SC^concentrations around the power station and meteorological datameasured at 10m. All the data gathered are subjected to aquality control process and stored in a historical data basemanaged by EXCEL 5.0.
• METPRO. The meteorological preprocessor implements aregression model which is the result of applying a statisticalstep wise regression approach over each of the horizontalcomponents of vector wind. The regression technique wasapplied during the intensive tracer campaign to 9 meteorologicalstations deployed over a domain of 40x40km. Then, theresulting regression model has the capacity to estimate windspeed and wind direction at 9 different positions based on theinformation collected at a reference station (the GPSmeteorological station). It is also feasible, the extrapolation ofa vertical profile drawn from experimental information collectedby an accoustic system installed during the experimentalcampaign. METPRO also provides turbulence information,variable mixing height values and characteristics of the releases(temperature and exit velocity of gases).
• MATHEW. It is a well-known diagnostic, mass-consistentmeteorological model. MATHEW adjusts a non-divergent 3Dwind field based on a variational technique. MATHEW was themodel which provided the best approach during the calibration
Transactions on Ecology and the Environment vol 10, © 1996 WIT Press, www.witpress.com, ISSN 1743-3541
Computer Techniques in Environmental Studies 627
exercise of different numerical platforms. This model isparticularly suited to work in complex terrain and a version forPC has been developed as a result of the project. At the GPS,MATHEW has been configured to work with a horizontalresolution of 500x500m and 14 vertical levels, 50m in deptheach. The domain at work is 40x40km.
• ADPIC. It is a 3D atmospheric dispersion model based on theparticle-in-cell technique. ADPIC has been modified to work ona PC based platform and a new turbulence scheme has beenimplemented in the model. The new turbulence scheme wasdeveloped during the R-f D project and it is particularly suitedto characterize the atmospheric turbulence features at the GPSsite. ADPIC provides 3D concentrations at each cell and alsosurface concentrations at specific points of interest (i.e. urbanareas, local monitors, etc.).
• The GUI has been designed to facilitate an interactive dialogbetween a user and the different modules implemented inSICEG. It is based on a set of small windows where windfields, isocontours of surface concentrations, plume trajectorypaths and point specific concentrations are shown (Fig.l). Aquick exploration of what has happened in the last 48 hours isalso available since this information is permanently stored inmemory and updated every operational cycle. It is also possibleto explore all the data stored in the historical data base alongwith the printing of monthly reports of releases, based on thespecifications of the Spanish legislation.
3. Functions
SICEG VI.0 implements the following calculational and managementconfiguration:
Remote calls and capture of meteorological data, data of releases froma stack and surface concentration data collected at a local automaticnetwork.Calculation of 3D wind fields and map of concentrations in near real-time.Display of alarms in case of overpassing maximum release levels ormaximum aceptable surface concentrations.Checking of historical data bases and results for the last 48 hours.Manager of errors and quality control of input data.Manager of monthly reports for releases.Interactive configuration of File and Directory systems, updating of
Transactions on Ecology and the Environment vol 10, © 1996 WIT Press, www.witpress.com, ISSN 1743-3541

628 Computer Techniques in Environmental Studies
geographical coordinates and point of interest, layout of local networkmonitors, updating of the communication protocol and the setting up ofsecurity passwords (Fig.3).
4, Cycle of operation
The standard cycle of operation implemented in SICEG has been divided intofour sequential phases, as shown below:
Phase of remote capture of dataPhase of calculation (data preprocessing 4- modelling)Phase of graphical displayPhase of user navigation
Under normal circumstances, the first phase of remote calls takes about 5minutes whereas the calculation and representation periods extend over «15minutes. Thus, the standard cycle of operation takes about 20 minutes undernormal conditions up to a maximum stated in approximately 30 minutes.SICEG has been programed to produce outputs (wind fields and maps ofsurface concentrations) every hour, leaving =30 minutes for user operations,such as data base browse or report printing.
In case of problems in the communication phase, SICEG retries those failedcommunications, to capture lacking data, for no more than 15 minutes. Whenthe programed time period of communication is over, it resolves the situationby deciding if prime information, to go ahead with the modelling module, hasbeen collected or not. If negative, SICEG gives free hands to the user andwaits for the following hourly based operational cycle. By prime informationis intended a set of critical data necessary to perform calculations with aminimum of reliability, such as wind conditions and/or information about theemissions through the GPS chimney.
5. Consultations
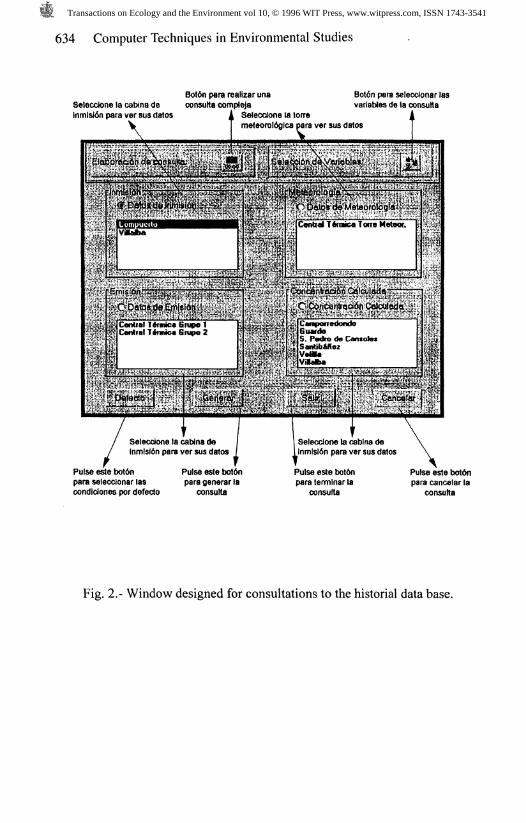
In the Menu bar of the Application, a bottom has been designed to allow theuser a set of consultations or checkings. Version 1.0 of SICEG has the capacityto explore the historical data base, where observed and predicted informationis hourly stored; the on-line 48 hours of predicted wind fields and map ofsurface concentrations; the configuration of the entire system and the printingof emissions' reports (Fig.2).
By using this bottom, the user can check observed meteorological data andsurface concentrations, along with the monitored releases at the stack. It is alsopossible to see the observed surface concentrations at the selected points ofinterest. To do so, the user must identify the desired time interval, the station
Transactions on Ecology and the Environment vol 10, © 1996 WIT Press, www.witpress.com, ISSN 1743-3541

Computer Techniques in Environmental Studies 629
and the parameter or parameters which must be shown on the screen.
Consultations to the on-line 48 hours data base provide sequential plots ofpredicted wind fields, contours of surface concentrations, X-Y view of thecloud of released particles and predicted surface concentrations at selectedpoints of interest.
6. Utilities
The main utilities implemented in version 1.0 of SICEG can be summarizedin the following points:
Hard-copy of screen plots,Configuration of the system (Fig.3).Automatic safety copies of data bases into a backup hard disk.Data exports in EXCEL format over a magnetic device (i.e. a 3^"disk).Manager of security passwords.Input data quality control.Errors' manager.
A manager to handle security passwords has been implemented. The controlof passwords is applied to the normal operation options in the system, alongwith to the configuration of the system. Every time the user gets into thedifferent options programed in the Menu bar, the system requires a passwordto accept or denied access to the interior of the Application.
A quality control of data is applied during and at the end of the communicationphase looking for consistency in the meteorological, emission and surfaceconcentrations data. The process is focused on controling validity of theoperational range of the data and the analysis of time series for therepetitivity/replication of generic data.
The errors' manager is primarily based on a pre-set codification scheme anda separate typification of the potential errors. The typification schemediscriminates among different type of errors, such as file errors, memoryerrors, overflow and mathematical errors, comunication errors and I/O errors.Every time an error occurs, it is stored in a .log file to ease the analysis andfurther diagnostic, and a message is also displayed on the screen. If the errorlevel is not critical, SICEG goes ahead with the operational cycle, but if itbecomes a fatal error, the Application stops and advise the user to analyze andresolve the error before continuation.
Transactions on Ecology and the Environment vol 10, © 1996 WIT Press, www.witpress.com, ISSN 1743-3541
630 Computer Techniques in Environmental Studies
7. Potential of the design
The current design of version 1.0 of SICEG includes a module for theassimilation of the topography at a given site. Version installed at the GPS hasbeen programed to handle a domain of 40x40km, although it can be easilychanged and updated to a different domain by using the topo module. The mainfeature to be retained is the desired spatial resolution for a given domain. Thisis an aspect to be carefully analyzed case by case since any standardization onthis respect might have strong influence on the final predicted wind field andon the map of surface concentrations.
SICEG can simulate up to a maximum of three release points within the studydomain and up to 5 different species. The version installed at the GPS onlysimulates one single release point and one single pollutant, the SC^ case.
SICEG has been designed to assimilate a maximum of 7 meteorologicalvariables at the station of reference, and it has capacity to simulate up to 9additional meteorological points distributed all over the study domain. It is alsofeasible to handle a local network integrated by up to 14 monitoring stationsfully instrumented (i.e. SO], NOx, O%, etc.).
The current version installed at the GPS includes a channel to monitor theoperational output of the plant in MW as an alternative to the temperature ofgases, not monitored at GPS. A regression model, calibrated with emissiondata from the GPS and also from a second power station owned byIBERDROLA, estimates the temperature of exit gases based on the readingsof the megawatts produced by the power plant.
8. Computer requirements
SICEG requires the following minimum hardware:
A personal computer, IBM AT compatible.CPU i-Pentium 90 MHz8 MB RAM (16 MB recommended)SVGA graphic card/monitor20 MB free in diskMicrosoft compatible mouseA second hard-disk for backups (optional)
The required software is as follows:
MS-DOS, v.5.0MS-Windows, v.3.1MS-Excel, V.5.0MS-Visual C+ + , v.l.5MS-Fortran Power Station
Transactions on Ecology and the Environment vol 10, © 1996 WIT Press, www.witpress.com, ISSN 1743-3541
Computer Techniques in Environmental Studies 631
The Application is delivered with a Technical Manual, a User's Guide and theinstallation disks.
9. On-coming new features
Version 1.0 of SICEG has been designed to deal with releases of low-reactivepollutants, such as SO2 and NOx. During 1996 new features are going to beimplemented. The main added features will be the following:
A meteorological prognostic module.The capacity to simulate photochemical processes by using simplifiedschemes compatible with Pentium based microprocessors.A separate module for radiological calculations (for nuclearapplications).A manager to provide direct guidance during planned and unplannedplant operations.Migration into a graphical environment compatible with WINDOWS 95or WINDOWS NT.
The meteorological prognostic module would help to identify the expectedaverage life-time of the current meteorological situation and the probability ofchange into a set of different meteorological scenarios in the short-term (4-8hours).
The implementation of photochemical and radiological modules is intended toextend the application of SICEG to other set of scenarios within theenvironmental impact context and to become a support tool in emergencysituations.
The operational manager is intended to become a kind of an interactive optionwhich would provide guidance and advise important for the decision makingin both operational strategies and especial operations. The entire set ofguidance will be oriented to minimize the environmental impact and to reachthe operational objectives in terms of control and environmental managementat a power station.
Migration into WINDOWS'95 or/and WINDOWS NT is the natural evolutionof SICEG towards 32-bits based computer platforms. These operating systemswould allow the implementation of a multiprocess design of the Application.In doing so, the time of the standard operational cycle will be reduced makingit possible a user-machine interaction free from limitations in the handling andcontrol of the different processes involved in the actual version of SICEG.
Transactions on Ecology and the Environment vol 10, © 1996 WIT Press, www.witpress.com, ISSN 1743-3541

632 Computer Techniques in Environmental Studies
References
1. Ibarra, J.I., 1991: "Atmospheric dispersion experiments over complexterrain in a Spanish valley site (Guardo-9QV, Proceedings of the Specialist'sMeeting on Advanced Modeling and Computer Codes for Calculating LocalScale and Meso-Scale Atmospheric Dispersion of Radionuclides and theirApplications, OECD/NEA Data Bank, Saclay, 6-8 March 1991.
2. Ibarra, J.I., (1992): "The SF* tracer during the Guardo-90 atmosphericdispersion study". Revista Energfa, XVIII, May-June 1992, pp. 73-81 (inSpanish).
3. Ibarra, J.I., (1992): "Turbulence and boundary layer parameterisationduring valley wind flows". Fourth International Conference ENVIROSOFT92,7-9 September 1992, Portsmouth, UK.
4. Ibarra, J.I., (1992): "Valley winds observations at the Guardo valley site".Sixth Conference on Mountain Meteorology, September 29 - October 2, 1992,Portland, Oregon (USA).
5. Lyons, W.A. and. J.I.Ibarra, (1993): "Evaluation of complex terraindispersion predictions using a Fine mesh prognostic mesoscale model", 86thAnnual Meeting & Exhibition Air and Waste Management Association,Denver, 14-18 June, CO.
6. Ibarra, J.I., (1993): "Evaluation of Atmospheric Dispersion Models duringthe Guardo Experiment", 20th International Technical Meeting on Air Pollutionand its Applications, November 29-December 3, Valencia (Spain).
7. Ibarra, J.I. and Encarnacion R. Hurtado, (1995): "An E-e turbulence closurescheme for modelling nighttime shallow drainage flows", l(f World Clean AirCongress, May 28 - June 2, 1995, Helsinki,
Transactions on Ecology and the Environment vol 10, © 1996 WIT Press, www.witpress.com, ISSN 1743-3541

Computer Techniques in Environmental Studies 633
is. o
O
18
<L> O1C JCVI-§ "5
I
g
oa
O <L>a o
si
W)
Transactions on Ecology and the Environment vol 10, © 1996 WIT Press, www.witpress.com, ISSN 1743-3541
634 Computer Techniques in Environmental Studies
Selecctone la cabins deinmis&n para ver BUS datos
Bot6n para realizar unaconsulta compleja
Bot6n para selecclonar lasvariables de la consuha
Seteccione la torreme(eoroJ6gica para ver sus datos
CaraponeoonooGumdoS Podro do Console*SantibAffez
Centia! T*nmc* Grupo 1Central Ttnnke Grapo 2
Selecdone la cabins deinmisidn para ver sus datos
Seleccione la cablna deInmlsi6n para ver sus datos
Pulse este boton Pulse este botonpara seleccionar las para generar lacondlclones por defecto consutta
Pulse este botonpara terminar ta
consutta
Pulse este botofipara cancelar la
consutta
Fig. 2.- Window designed for consultations to the historial data base.
Transactions on Ecology and the Environment vol 10, © 1996 WIT Press, www.witpress.com, ISSN 1743-3541

Computer Techniques in Environmental Studies 635
C/Dao
o'&)o"s
O
O
8<4HO
I
1
i
mbb
Transactions on Ecology and the Environment vol 10, © 1996 WIT Press, www.witpress.com, ISSN 1743-3541