s&p industry surveys: insurance - life & health
TRANSCRIPT

September 13, 2007
Industry SurveysInsurance: Life & Health
THIS ISSUE REPLACES THE ONE DATED DECEMBER 7 , 2006 .THE NEXT UPDATE OF THIS SURVEY IS SCHEDULED FOR MARCH 2008 .
CCoonnttaaccttss::
Inquiries &Client [email protected]
MediaMichael [email protected]
Replacement copies800.852.1641
Tanjila ShafiLife & Health Insurance Analyst
CURRENT ENVIRONMENT..................................................................1Earnings gain in 2006
Annuities: variable products still dominate Equity-indexed annuities hit a bump Variable universal life sales pick up A challenging interest rate environment Industry consolidation focuses on scale and scope An evolving regulatory environment S&P Ratings Services View:
Credit quality will depend more on risk management Life settlement segment draws scrutiny
INDUSTRY PROFILE...............................................................................9Large, well-known companies dominate a mature industry
INDUSTRY TRENDS .................................................................................9Changing demographics create new opportunities Distribution channels have been shifting M&A activity focuses on scale and scope The demutualization trend takes a pause Capital market activity may slow Legislative changes impact wealth products Federal regulation for life products appears unlikely
HOW THE INDUSTRY OPERATES .............................................................15Ownership structures differ Types of assets Finding funds for investment Two accounting methods Types of products Distribution Regulating the industry
KEY INDUSTRY RATIOS AND STATISTICS ...................................................23HOW TO ANALYZE A LIFE INSURER ........................................................23
Macroeconomic indicators Profitability S&P Ratings Services View:
Evaluating a life insurance company’s creditworthinessLiquidity Leverage Operating and GAAP earnings
GLOSSARY .............................................................................................29INDUSTRY REFERENCES.....................................................................33COMPARATIVE COMPANY ANALYSIS ..............................................36

Executive Editor: Eileen M. Bossong-MartinesAssociate Editor: Joseph M. CodaCopy Editor: Brandon WilkersonProduction: GraphMediaStatistician: Sally Kathryn NuttallJunior Designer: Paulette Dixon
Client Support: 1-800-523-4534Copyright © 2007 by Standard & Poor’sAll rights reserved.ISSN 0196-4666USPS No. 517-780Visit the Standard & Poor’s Web site:http://www.standardandpoors.com
STANDARD & POOR’S INDUSTRY SURVEYS is published weekly. Annualsubscription: $10,500. Please call for special pricing: 1-800-523-4534,option 2. Reproduction in whole or in part (including inputting into acomputer) prohibited except by permission of Standard & Poor’s.Executive and Editorial Office: Standard & Poor’s, 55 Water Street, NewYork, NY 10041. Standard & Poor’s is a division of The McGraw-HillCompanies. Officers of The McGraw-Hill Companies, Inc.: Harold McGrawIII, Chairman, President, and Chief Executive Officer; Kenneth M. Vittor,Executive Vice President and General Counsel; Robert J. Bahash,Executive Vice President and Chief Financial Officer; John Weisenseel,Senior Vice President, Treasury Operations. Periodicals postage paid atNew York, NY 10004 and additional mailing offices. POSTMASTER: Sendaddress changes to Standard & Poor’s, INDUSTRY SURVEYS, Attn: MailPrep, 55 Water Street, New York, NY 10041. Information has beenobtained by Standard & Poor’s INDUSTRY SURVEYS from sourcesbelieved to be reliable. However, because of the possibility of human ormechanical error by our sources, INDUSTRY SURVEYS, or others,INDUSTRY SURVEYS does not guarantee the accuracy, adequacy, orcompleteness of any information and is not responsible for any errors oromissions or for the results obtained from the use of such information.
VOLUME 175, NO. 37, SECTION 2 THIS ISSUE OF INDUSTRY SURVEYS INCLUDES 3 SECTIONS.
Standard & Poor’s Industry Surveys
Earnings growth was solid for many of themajor industry players in 2006, building ona stable performance in 2005. The larger lifeinsurers generally cited an increase in net in-vestment income, strong growth in interna-tional businesses, and benefits from a diverseportfolio of insurance and retirement prod-ucts as the main drivers for earnings gainsin 2006. In addition, many companies stat-ed that earnings in 2006 benefited frombetter expense management as they stream-lined operations, trimming businesses thatwere not strategically aligned with long-term objectives.
The more geographically diverse compa-nies benefited from strong internationalgrowth, particularly from Latin America andthe Asia-Pacific region. Share repurchasesalso contributed to earnings per share (EPS)growth in 2006. In addition, earnings werehelped by higher investment income, with theyield on the 10-year Treasury note risingfrom 4.37% to 4.71% in 2006, and by astrong equity market performance, with theS&P 500 increasing 13.6% that year.
These results build on the industry’s finan-cial performance in 2005. According to datafrom industry group the National Associa-
tion of Insurance Commissioners, via High-line Data LLC, the life and health insuranceindustry’s premiums and annuity considera-tions rose 10% in 2006. Furthermore, net in-vestment income rose 2.3%, and total capitaland surplus increased 3.9%.
Standards & Poor’s expects earnings mo-mentum to continue into 2007. We believeearnings for the major industry players willbenefit from higher investment income,growth in international operations and solidshare repurchase activity. We believe that sol-id equity market performance should boostearnings for equity-sensitive products, andwe believe that spread compression shouldbe somewhat alleviated if the recent steepen-ing of the yield curve continues. Further-more, we expect earnings for companies witha diverse geographic base will benefit be-cause of our view that the international mar-ket offers higher growth opportunities thanthe domestic market.
Annuities: variable products stilldominate
Annuity sales continue to bolster lifeand health insurance revenues, with salesof variable annuities leading the way. Ac-cording to LIMRA International, Inc., anindustry trade group, total annuity sales in-creased 9.1% to $236.2 billion in 2006.Variable annuity sales were up almost 17%over the same period. The strength in vari-able annuity sales was partially due tostrong equity market performance. Equitymarket performance as measured by theS&P 500 index rose 13.6% in 2006. In ad-dition, the popularity of guaranteed livingbenefits riders on newer products boostedsales. These riders offer minimum guaran-tees plus the possibility of gains.
New sales of variable annuities for 2006rose more than 17% to $154.9 billion from$131.4 billion, according to data from indus-try tracker VARDS. Variable annuities assets
CURRENT ENVIRONMENT
Earnings gain in 2006
SEP
TEM
BER
13,
200
7 /
INS
UR
AN
CE:
LIF
E &
HEA
LTH
IN
DU
STR
Y S
UR
VEY
1
LIFE INSURANCE INDEX OUTPERFORMS(Index: January 2, 2003=100)
Source: Standard & Poor’s.
Life/Health Insurance Index
250
225
200
175
150
125
1002004 2005 2006 2007
Financial Index
S&P 500
SEP
TEM
BER
13,
200
7 /
INS
UR
AN
CE:
LIF
E &
HEA
LTH
IN
DU
STR
Y S
UR
VEY
2
climbed 14.3% to $1.36 trillion as of De-cember 31, 2006, according to VARDS.
According to LIMRA, sales of fixed annu-ities declined 4.2% to $75.6 billion in 2006.Part of the decline was due to the rise of short-term interest rates, which led to increased com-petition from bank certificates of deposit.
Equity-indexed annuities hit a bump
Sales of equity-indexed annuities (EIAs) de-clined 7.2% to $25.3 billion in 2006, accord-ing to data from industry tracker AdvantageCompendium. Sales of EIAs were hurt by high-er bank interest rates and negative attentionsurrounding the National Association of Secu-rities Dealers’ Notice to Members 05-50, whichaddresses the responsibility of broker-dealerfirms to supervise the sale of EIAs, whichcurrently are not registered under the federalsecurities laws. (This issue is discussed fur-ther under “Annuities remain under scruti-ny” toward the end of this section.)
Equity-indexed annuities have beenamong the industry’s more popular products:sales rose 18% in 2005, and EIAs accountedfor 40% of all fixed deferred annuity sales.EIAs are linked to a stock market index,such as the S&P 500 Composite Stock index.
Investors get a guaranteed return, tax-deferred, as they would through a fixed an-nuity, but the return rises if the underlyingequity index performs well.
Sales of equity-indexed annuitiesreached $27 billion in 2005, according toAdvantage Compendium, up from $23 bil-lion in 2004 and $14 billion in 2003. Afterincreasing for 11 consecutive years, sales ofEIAs declined in 2006.
The growth in equity-indexed annuitieshelped to boost profits at a number of life in-surers. EIAs are lucrative for the industry:commissions average 8.5% to 9%, but theygo as high as 10%, compared with a com-mission rate of 2% to 3% on traditional mu-tual funds. Allianz Life Insurance Co. ofNorth America, a unit of German financialservices giant Allianz SE, is the US leader inindex annuity sales. Solid sales growth andhigh commission rates have made the marketmore competitive as other life insurers enterand chip away at Allianz’s dominant 19.6%market share position.
Variable universal life sales pick up
According to LIMRA, individual life in-surance sales increased 7% in 2006, thelargest increase since 2000. The total faceamount increased by 4%, but the number ofnew policies sold decreased by 1%. Further-more, variable universal life sales increasedby 9% in 2006, the first increase in six years.The increase in variable universal life salesmay be attributable to innovative productfeatures such as death benefit guarantees, aswell as to marketing efforts from broker gen-eral agents and wirehouses, distributors whotraditionally have not been major marketersof the product.
A challenging interest rateenvironment
Investment income saw improvement in2006 as interest rates increased. At the be-ginning of 2006, the 10-year Treasury noteyielded 4.37% and peaked in June 28th,reaching 5.24%. By year-end, the yield haddeclined to 4.71%. Overall, the 10-yearTreasury note rose 34 basis points in 2006,which boosted investment income, an impor-tant source of revenues for life insurers. In-terest rates continued to rise in 2007. In the
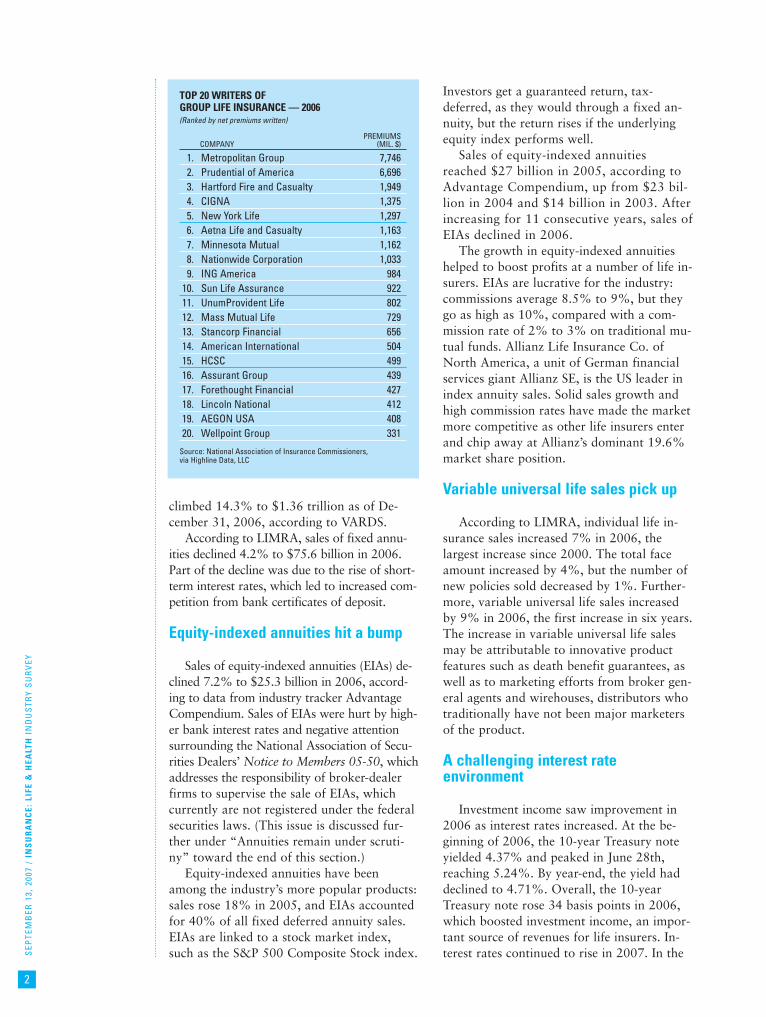
TOP 20 WRITERS OF GROUP LIFE INSURANCE — 2006(Ranked by net premiums written)
PREMIUMSCOMPANY (MIL. $)
1. Metropolitan Group 7,746 2. Prudential of America 6,696 3. Hartford Fire and Casualty 1,949 4. CIGNA 1,375 5. New York Life 1,297 6. Aetna Life and Casualty 1,163 7. Minnesota Mutual 1,162 8. Nationwide Corporation 1,033 9. ING America 984
10. Sun Life Assurance 92211. UnumProvident Life 802 12. Mass Mutual Life 729 13. Stancorp Financial 656 14. American International 504 15. HCSC 499 16. Assurant Group 439 17. Forethought Financial 427 18. Lincoln National 412 19. AEGON USA 408 20. Wellpoint Group 331
Source: National Association of Insurance Commissioners,via Highline Data, LLC
SEP
TEM
BER
13,
200
7 /
INS
UR
AN
CE:
LIF
E &
HEA
LTH
IN
DU
STR
Y S
UR
VEY
3
first half of 2007, the 10-year Treasury noteincreased 34 basis points to yield 5.03%. Al-though still at relatively low levels, the high-er yield provided a boost to investmentincome and, thus, operating income.
However, despite 17 increases in the tar-get for the federal funds rate between June2004 and June 2006 — for a total increaseof 425 basis points — the yield on the 10-year Treasury note has actually fallen sincemid-2006. As of July, 16th, 2007, the 10-year Treasury yielded approximately 5.04%.Improving bond default experience compli-cated matters further for life insurers byleading to tighter yield spreads betweenTreasury and investment-grade corporatebonds, which make up a large part of lifeinsurers’ investments.
As a result, new money inflows and pro-ceeds from maturing or liquidated portfolioassets have generally been invested by life in-surers at rates of return near or lower thanexisting investments, putting pressure onportfolio yields. With portfolio yields declin-ing, spreads on deposit-type funds and con-tracts have narrowed, as many policies havebeen reaching their minimum crediting rates.Moreover, rising short-term interest ratesmay keep life insurers from aggressively
lowering minimum crediting rates (i.e., theinterest rate offered) on new policies andcould encourage higher surrender activityon existing policies already at minimumcrediting rates.
This spread compression could lead tomore problems as multiyear guarantee an-nuities begin to mature. These products,which offered three- to 10-year guarantees,sold heavily between 2001 and 2003. Asthey mature, money could be withdrawn,unless the industry has adequate alterna-tives to offer. The tight interest ratespreads make it more difficult to offer at-tractive alternatives. However, the yieldcurve has recently begun to steepen, whichwill help alleviate spread compression,boosting investment income.
Earnings outlook becomes less certainThe current interest rate environment, rel-
atively flat yield curve, and increasing salescompetition may make it more difficult forthe life insurance industry to continue topost the kind of strong earnings growth itenjoyed during 2006.
Those life insurers with more pronouncedexposure to spread-based products (includingfixed annuities and universal life insurance)might be hurt more by the challenging inter-est rate environment. Standard & Poor’s be-lieves that sales of fixed annuity policies havesuffered, as low crediting rates have madethe products less attractive relative to otherinvestment choices.
Net investment income is also likely to behurt by the relatively low yields seen in2006. As mentioned earlier, new money in-flows and proceeds from maturing or liqui-dated portfolio assets have generally beeninvested by life insurers at rates of returnnear or lower than existing investments,putting pressure on portfolio yields.
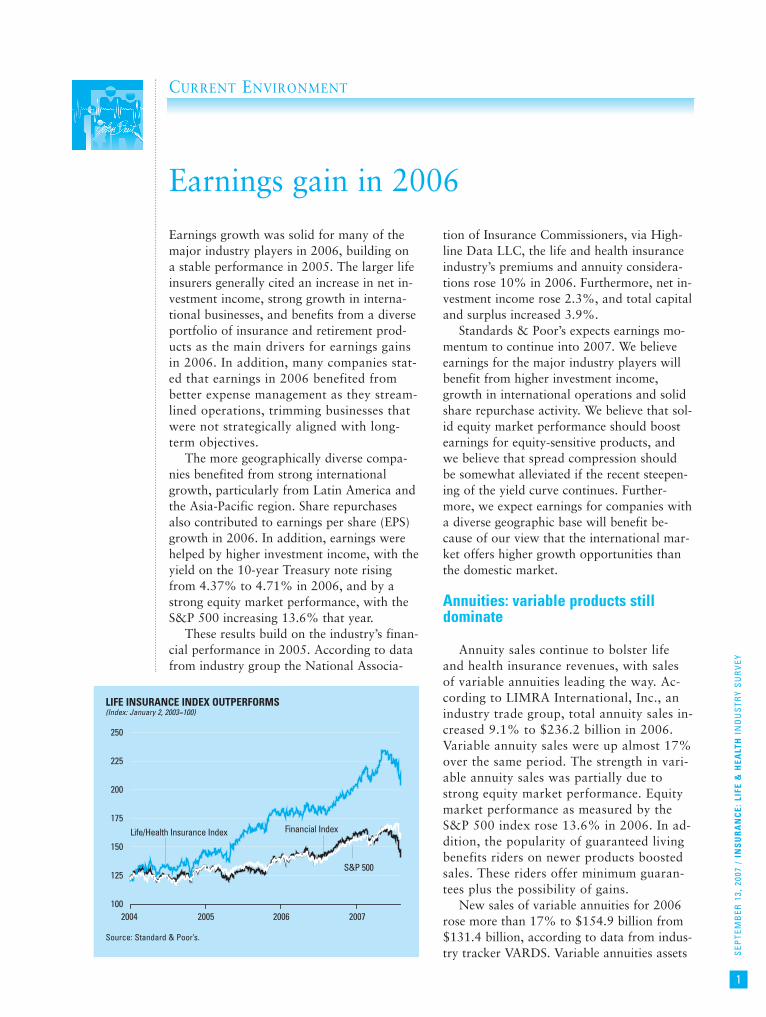
Stocks hit by subprime concernsAfter seeing stock market returns of 20%
or more in each of the past three years, theS&P US Life and Health Insurance indexrecorded a 15.0% gain in 2006. The gain inthe index compares with a 16.2% gain for thebroader S&P Financials index and a 13.6%gain for the S&P 500 during that year. Inour view, the life and health insurancegroup’s outperformance versus the S&P 500index in 2006 resulted from favorable com-
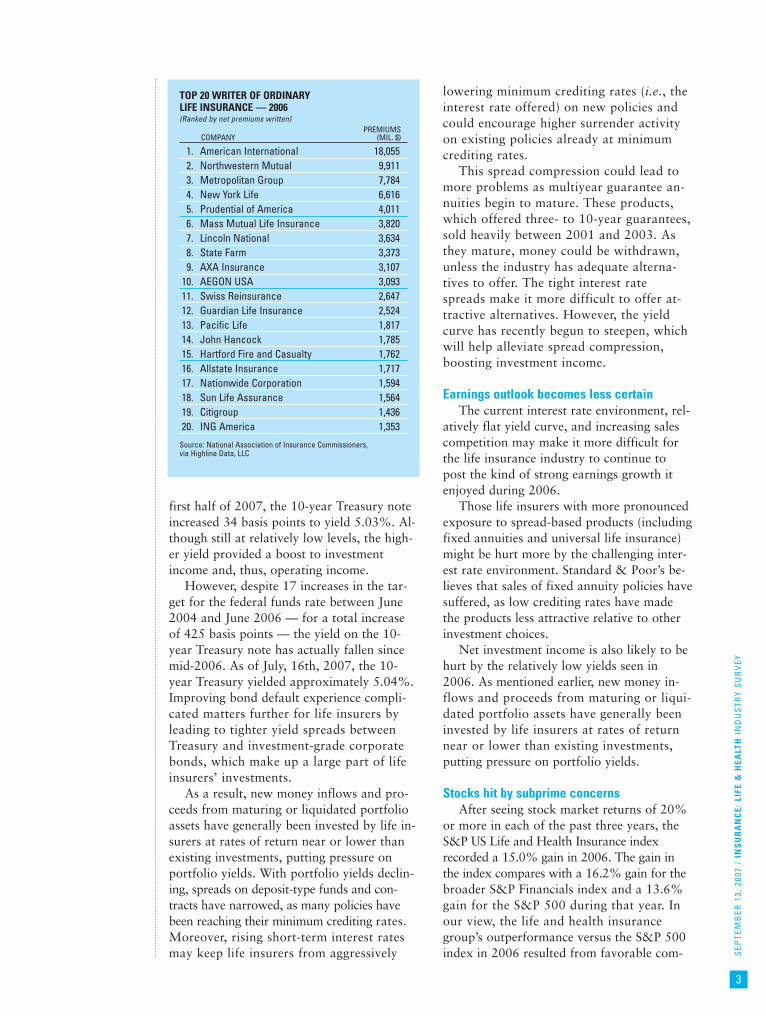
TOP 20 WRITER OF ORDINARY LIFE INSURANCE — 2006(Ranked by net premiums written)
PREMIUMSCOMPANY (MIL. $)
1. American International 18,055 2. Northwestern Mutual 9,911 3. Metropolitan Group 7,784 4. New York Life 6,616 5. Prudential of America 4,011 6. Mass Mutual Life Insurance 3,820 7. Lincoln National 3,634 8. State Farm 3,373 9. AXA Insurance 3,107
10. AEGON USA 3,093 11. Swiss Reinsurance 2,647 12. Guardian Life Insurance 2,524 13. Pacific Life 1,817 14. John Hancock 1,785 15. Hartford Fire and Casualty 1,762 16. Allstate Insurance 1,717 17. Nationwide Corporation 1,594 18. Sun Life Assurance 1,564 19. Citigroup 1,436 20. ING America 1,353
Source: National Association of Insurance Commissioners,via Highline Data, LLC

SEP
TEM
BER
13,
200
7 /
INS
UR
AN
CE:
LIF
E &
HEA
LTH
IN
DU
STR
Y S
UR
VEY
4
pany-specific M&A developments, businessrestructurings, and turnaround stories.
However, whether the share price gainsfor the Life and Health Insurance indexcan continue in 2007 remains uncertain. Aweakening housing market, credit qualityconcerns, and especially subprime issueshave plagued life and health insurancestocks recently. Through August 17, 2007,the S&P Life and Health Insurance indexrose 5.7%, year to date, versus a 6.9% de-cline in the broader S&P Financial indexand 1.9% increase in the S&P 500 index.However, looking at just the first twoquarters of 2007, the S&P Life and HealthInsurance index had risen 9.9%, comparedwith a 2.0% decline for the S&P Financialindex and a 6.0% gain for the S&P 500during that same period. The decline inshare performance for the Life and HealthInsurance index is attributable to the mar-ket’s concern regarding the credit qualityof the life and health insurance companies’subprime holdings, in our view.
We are concerned that the market’s fo-cus on subprime exposure specifically andthe housing market and credit quality ingeneral will cause headline risk which willlead to excess volatility in share price per-formance for the life and health insurancecompanies. Our greater concern is that theweakening housing market will spread tothe overall economy. A downturn in theeconomy could result in a deterioration ofcorporate credit. Insurance companies tendto hold the bulk of the investment portfo-lio in corporate bonds, so an accelerationof corporate bond default rates, in ourview, could erode the value of their invest-ment portfolios significantly.
Industry consolidation focuses onscale and scope
Consolidation has been a continuing themein the life insurance industry. Over the past fewyears, a handful of large insurers merged,putting pressure on mid-tier players to seek outpartners in order to build additional economiesof scale, to better compete with their biggerand more heavily capitalized rivals.
In June 2006, AXA announced plans to ac-quire Winterthur Swiss Insurance Co. fromCredit Suisse Group for approximately 12.3billion Swiss francs. The deal, which closed in
December 2006, should add some diversifica-tion in Switzerland, and in Central and EasternEurope, where Winterthur has a strong pres-ence. Standard & Poor’s expects cost savingsto come from overlapping operations. Wethink AXA will benefit from Winterthur’snetwork of agents and access to Credit SuisseGroup’s retail network.
On July 3, 2006, Protective Life and Annu-ity Insurance Co. acquired Chase InsuranceGroup, the insurance and annuity operationsunit of JPMorgan Chase & Co., in a deal val-ued at $1.2 billion. Through a series of reinsur-ance agreements entered into immediately afterthe acquisition, approximately 42% of thebusiness of the Chase Insurance Group, exclud-ing the variable annuity business, has beenreinsured to insurance subsidiaries of WiltonRe Holdings Ltd. All of the variable annuitybusiness has been reinsured to Allmerica Finan-cial Life Insurance and Annuity Co., a sub-sidiary of The Goldman Sachs Group, Inc.
In order to better compete with larger rivals(such as MetLife, Inc., Manulife FinancialCorp., and Prudential Financial, Inc.), LincolnNational Corp. and Jefferson-Pilot Corp.struck a merger deal in October 2005 worth$7.6 billion. The deal, completed on April 3,2006, created the fourth largest US life insurer,with $151.3 billion in assets.
In January 2005, Citigroup Inc. exitedthe insurance business, agreeing to sell itslife insurance and annuities business, Trav-elers Life and Annuity Co., to MetLife for$11.5 billion. That deal followed Man-ulife’s $10.8 billion purchase of John Han-cock Life Insurance Co. in 2003.
These deals have created more formidablecompetitors in the life insurance industry andhave ushered in another wave of consolidation.During 2005, there were 28 mergers in the lifeand health insurance sector, with a total valueof $21.8 billion, according to data from finan-cial services analyst SNL Financial. This com-pares with 31 merger deals ($3.5 billion) in2004 and 35 mergers ($14.5 billion) in 2003.
While generating economies of scale tomatch their rivals’ larger geographical foot-prints and product offerings is one rationalefor industry mergers, the current interestrate environment provides another. With arelatively flat yield curve, insurers have notbeen able to profit much on the interest ratespread between what they can earn in thebond market and the interest rates that they

SEP
TEM
BER
13,
200
7 /
INS
UR
AN
CE:
LIF
E &
HEA
LTH
IN
DU
STR
Y S
UR
VEY
5
pay to buyers of their life insurance and an-nuity products. As higher yielding securitiesmature, insurers have been unable to re-place them with anything other than lower-yielding bonds. The cost synergies thatcome from increased size will enable thecompanies to better weather this challengingoperating environment.
M&A trend set to continueConsolidation is likely to remain a theme in
the life and health insurance industry, as manylife insurers are awash with excess capital. Ac-cording to industry trade group, the AmericanCouncil of Life Insurers (ACLI), the industry’srisk-based capital ratio improved to 409% atyear-end 2005 from 390% at year-end 2004,which has left some companies with billionsof dollars that could be put to use in corpo-rate expansions.
The mergers between larger industryplayers since 2003, and the more recentcombination of Jefferson-Pilot and LincolnNational, may force a number of other lifeinsurance firms to use this excess capital toseek out partners as a way to expand theirgeographical coverage and product offer-ings, in order to compete more effectively.
Standard & Poor’s also believes that somebroader financial services companies withrelatively small life insurance operationscould decide to exit these businesses and turntheir attention to their core businesses, lead-ing to more M&A activity as these business-es are divested.
An evolving regulatory environment
Regulation is a major part of the insur-ance industry, and the group faces a numberof ongoing issues. A spate of investigationsat the state level into company practices —including market timing, brokerage commis-sions, and accounting irregularities — con-tinues to hang over the industry. Additionally,states are cracking down on annuity salespractices that they feel are improper.
Ongoing regulatory investigationsThe insurance industry came under fire
from a host of regulatory agencies starting in2002. Although many of those investigationsand lawsuits finally have been settled or arewinding down, there could be more scrutiny instore for the industry over the coming months.
The market-timing scandals that hit themutual fund industry in 2004 resulted inincreased scrutiny of the variable life andannuity products sold by many life insurancecompanies. So far, the fines for market-timing activities have been imposed ononly a few companies. Still, other insurershave increased their reserves to cover po-tential fines and penalties as these investi-gations continue. Companies that haveseen their fair share of scrutiny — includ-ing Conseco Inc., UnumProvident Corp.,Marsh & McLennan Cos. Inc., and Ameri-can International Group Inc. — are hopingthat the worst of the scandals are over.
In August 2006, Prudential Equity Groupreached a settlement with several regulatoryagencies in connection with their investiga-tions into market timing activities involvingthe broker-dealer business at Prudential Secu-rities. Many companies within the insuranceindustry have changed their policies andpractices to avoid any hint of wrongdoing:many of the large insurance brokers haveeliminated contingent commissions, equity-indexed annuity providers are improvingsuitability procedures, and many health in-surers are correcting claims practices.
Annuities remain under scrutinyState and federal regulators are investigating
the annuity market, with the government tak-ing a hard look at the marketing of both vari-able annuities and equity-indexed annuities.
◆ Variable annuities. A number of stateattorneys general have the marketing of vari-able annuities in their crosshairs, as they goafter firms for marketing abuses. Attorneysgeneral Eliot L. Spitzer of New York andRichard Blumenthal of Connecticut began in-vestigating The Hartford Financial ServicesGroup in June 2005. In May 2006, Hartfordagreed to pay $20 million to settle chargesthat it secretly paid brokers to steer pensionfunds to the insurer’s annuities even thoughthey may not have been the best choice. Cali-fornia, Kansas, Missouri, and New York alsoare investigating the industry and looking atnew marketing and suitability rules.
Ultimately, the federal government couldget involved. In late 2004, the NASD (thenknown as the National Association of Se-curities Dealers), a private-sector providerof financial regulatory services, asked the
SEP
TEM
BER
13,
200
7 /
INS
UR
AN
CE:
LIF
E &
HEA
LTH
IN
DU
STR
Y S
UR
VEY
6
Securities and Exchange Commission (SEC)to approve a proposed regulation layingdown suitability standards. The life insur-ance industry opposes such a plan, sayingthat it is unfair to apply suitability stan-dards to variable products only.
◆ Equity-indexed annuities. Regulatorsalso are probing suitability issues in rela-tion to EIAs, which may eventually be la-beled as securities. In August 2005, theSEC asked a number of insurance compa-nies for information on their top-selling
EIAs and any unregistered products thatmay return less than 90% of total premi-ums.
The SEC is scrutinizing the evolvingcharacteristics of these products and mayeventually move to have them registeredwith the SEC in the same manner as othersecurities, such as stocks. In August 2005,the NASD issued a Notice to Members 05-50, which recommended that broker-dealers adopt special procedures in han-dling equity-indexed annuities, due to un-certainty over their classification.
Credit quality will depend more onrisk management
The next 12 months present some sizable chal-lenges for the US life insurance sector. Among the is-sues the industry faces are the likelihood ofcontinued flatness in the yield curve, more mergersand acquisitions, and a weak environment for salesof individual life insurance products. In addition, risklevels are rising in the credit markets, which have be-gun to show some weakening, and will make thecoming year even more difficult for insurers.
Still, as of mid-August 2007, Standard & Poor’sRating Services’ outlook for the US life insurancesector remained stable; that is, we expected pos-itive and negative rating movements to be aboutequal for the next six to 12 months. Our outlookreflects company-specific circumstances rather thanmacroeconomic or sector-wide factors.
Over the next three years, we expect revenuegrowth in the ultra-competitive market for traditionallife insurance products (including whole, term, anduniversal life) to be about 2% to 4%, in line with pro-jected increases in US gross domestic product (GDP).Furthermore, if the yield curve remains flat, higherprofits will be harder to achieve.
To offset these pressures, companies have beenseeking growth in dicey ways, mostly on the liabilityside: creating higher-risk products; making acquisi-tions that could strain operations, financially and/ormanagerially; and engaging in more aggressive prac-tices, such as underwriting with narrower built-inprofit margins.
We believe the default rate cycle for speculative-grade bonds (those rated ‘BB+’ and below) hastroughed and that defaults will start increasing. Inaddition, the life insurance industry continues to feel
the ripples of the potential deterioration of sub-prime mortgage-related assets (primarily residen-tial mortgage-backed securities). Although insurersmay experience some credit losses in the comingyear, Standard & Poor’s believes that in general, theindustry can absorb the impact through the improve-ments it has made since the last credit cycle down-turn, including better risk management and higherrelative capitalization.
Flat interest rates could cap incomeIf long-term interest rates continue to stagnate at
current levels, life insurers’ 2007 income could beconstrained. The 10-year Treasury note has been rel-atively flat since January 2007, with rates now about4.6%, down from more than 5% in 2006. We expecta low, relatively stable interest rate environment thisyear, with 10-year Treasuries projected to yield 4.8%by year-end. We are beginning to observe creditspreads widening as a result of the subprime mort-gage spillover effect, and we expect the yield curve’sshape to stay relatively flat.
To compensate for these flat interest rates, largeinsurers have been chasing yield, using alternativeinstruments, especially private equity, for their in-vestment strategies. For these insurers, strong divi-dend distributions from private equity securities haveenhanced profitability. The overall rate of earningsgrowth for life insurers this year will be less thanin 2006, however, due to the low interest rate en-vironment and the likely decline in the level of pri-vate equity distributions.
Is sales growth sustainable? We expect a return to more historical growth
rates (in the low single digits) for individual life in-surance in 2007. The 7% uptick seen in 2006 individ-
S&P Ratings Services View:

SEP
TEM
BER
13,
200
7 /
INS
UR
AN
CE:
LIF
E &
HEA
LTH
IN
DU
STR
Y S
UR
VEY
7
In much the same way that it is going af-ter the marketing of variable annuities, theNASD is cracking down on EIA marketingabuses. The NASD is looking at the indus-try’s aggressive efforts to move customersinto these instruments, even in cases whereEIAs may be unsuitable for them. Specifical-ly, the NASD is concerned about firms thathave engaged in “switching” campaigns,where customers were moved from variableannuity-type instruments into EIAs, whichhave higher commission rates and higher sur-render fees.
TRIA extension passes without group lifeA reauthorization and two-year extension of
the Terrorism Risk Insurance Act of 2002(TRIA) was passed by Congress in December2005, just before the original law was set toexpire. The original TRIA was passed after theterrorist attacks of September 11, 2001, andprovided federal property-casualty reinsurancefor future terrorist events. Some proposedversions of the December extension includedfederal reinsurance for group life; this, how-ever, was not in the original law and waseventually excluded from the final version.
ual life sales may not be sustainable, as much of itcame from large sales of investor-owned life insur-ance (IOLI), which is a new twist on life settlements.
Variable annuity growth, driven by living benefitguarantees, has more than offset the impact of theflat yield curve, which has plagued sales of fixed de-ferred annuities compared with the certificates ofdeposit with which they compete. Net flows in fixedannuities have been negative because of higher sur-renders resulting from the expiration of surrendercharges on multiyear guarantee annuities.
Is M&A the answer? Some US life insurers are turning to mergers and
international expansion to satisfy shareholders’ de-sire for greater financial returns. Historically, M&Ahas been a high-risk strategy that often destroyedshareholder value due to exorbitant purchase prices,culture clashes between acquirer and acquiree, andpoor operational execution of the merger.
Recent transactions, however, have fared better. Forone thing, recent acquisition prices are more rationalthan they were in the late 1990s. That’s partially be-cause the marketplace is more transparent and due dili-gence has improved, and partially because enterpriserisk management (ERM) is becoming more effective asit increases in importance. Finally, more reasonable pur-chase prices mean recent deals have involved less debtfinancing than in the past.
Because the US life insurance sector remainsfragmented, Standard & Poor’s expects the pace ofconsolidation to continue, with most M&A through2007 and into 2008 coming from sales of large booksof business and divestiture of noncore books.
Enterprise risk management: the ratingdifferentiator
Standard & Poor’s continues to expand the num-ber of enterprise risk management evaluations for
life insurance companies. We see solid ERM disci-pline as key to profitable growth with lower volatili-ty, and we believe it will continue to be an importantrating differentiator for life insurers, especially as itrelates to product risk.
Improved ERM means most insurers are now bet-ter prepared for the expected reversal in the creditcycle. For instance, many have repositioned theirportfolios by taking advantage of the relative value ofcorporate credit securities and by increasing theirholdings of higher-grade issues in anticipation of theexpected downgrade in corporate credit.
Factors that will determine ratings trendsShort-term trends in the US life insurance sec-
tor are relatively benign, so it is long-term trendsthat are shaping the ratings environment. For theremainder of 2007 and into 2008, upgrades anddowngrades are likely to be balanced. The deter-mining factors in rating trends over the long termwill be the strength and sustainability of a compa-ny’s competitive position and its operating perfor-mance, especially with regard to using ERMcapabilities to manage emerging product risk andthe impending negative credit cycle.
Life insurers that can optimize advantages in dis-tribution, product innovation, and risk managementwill see their fortunes increase. Those that lackthese key strengths will see their competitive andcapitalization positions increasingly compromised. Insuch a challenging environment, prudent ERM will beall the more important to assuring long-term stabili-ty and financial strength in the face of another diffi-cult business cycle. ■
— Kevin Ahern Credit Ratings Analyst, Life Insurance
SEP
TEM
BER
13,
200
7 /
INS
UR
AN
CE:
LIF
E &
HEA
LTH
IN
DU
STR
Y S
UR
VEY
8
The TRIA extension raised the property-casualty industry’s retention level from 15% to17.5% in 2006 and to 20% in 2007. The newlaw also raised the program trigger from $5million in insured losses to $50 million in in-sured losses in 2006 and $100 million in 2007.
The Bush administration, along withsome prominent members of Congress, hadopposed the reauthorization of TRIA un-less it was significantly scaled back. Somein Congress argued that private industry —not the US government — ultimately bearsthe burden of insuring terrorist risks. Someindustry groups remain skeptical thatenough private capital could be raised tocover terrorism risk, while others believethat, in the wake of Hurricane Katrina inSeptember 2005, the reinsurance industryhas become much more risk-averse andwill not step up to provide protection with-out some form of federal guarantees.
Life settlement segment drawsscrutiny
On March 8, 2006, National FinancialPartners Corp. stated in its 10-K that it re-ceived a subpoena from the office of NewYork Attorney General Eliot Spitzer, “seek-ing information regarding life settlementtransactions.” It was unclear, from the in-formation given, the exact nature of thesubpoena. Although no direct action hasbeen taken on National Financial Partnersto date, on October 26, 2006, Spitzer fileda civil complaint in State Supreme Court inManhattan alleging that Coventry FirstLLC, a provider of life settlements based inPhiladelphia, Pennsylvania, made secretpayments, dubbed “co-brokering fees,” tolife settlement brokers. The suit allegesthat, in exchange for these payments, thebrokers suppressed competitive bids fromother life settlement companies.
Life settlements, also known as viaticalsettlements in some instances, have been aslowly growing and evolving segment of theUS life insurance industry since the mid-1980s. At that time, the spread of acquiredimmunodeficiency syndrome (AIDS) helpedto create a market of terminally ill individu-als with short life expectancies looking toliquidate their life insurance policies beforedeath. This practice got a bad name in the1990s, when a number of firms were accused
of taking unfair advantage of the infirm.While the initial focus of the life settlementsegment was the terminally ill, the practicehas expanded and now includes purchases oflife insurance policies held by older individu-als with longer life expectancies.
As the segment has evolved, new intermedi-aries have developed as well. Viatical settle-ment brokers negotiate among competingsettlement companies on behalf of the insured.State regulation of the life settlement segmenthas slowly evolved in parallel, following nu-merous reports of unethical and fraudulentpractices within the segment. Many viatical set-tlement providers also have been hurt by drugtreatment breakthroughs that have extendedthe lifetimes of some terminally ill patients be-yond initial assumptions. ■
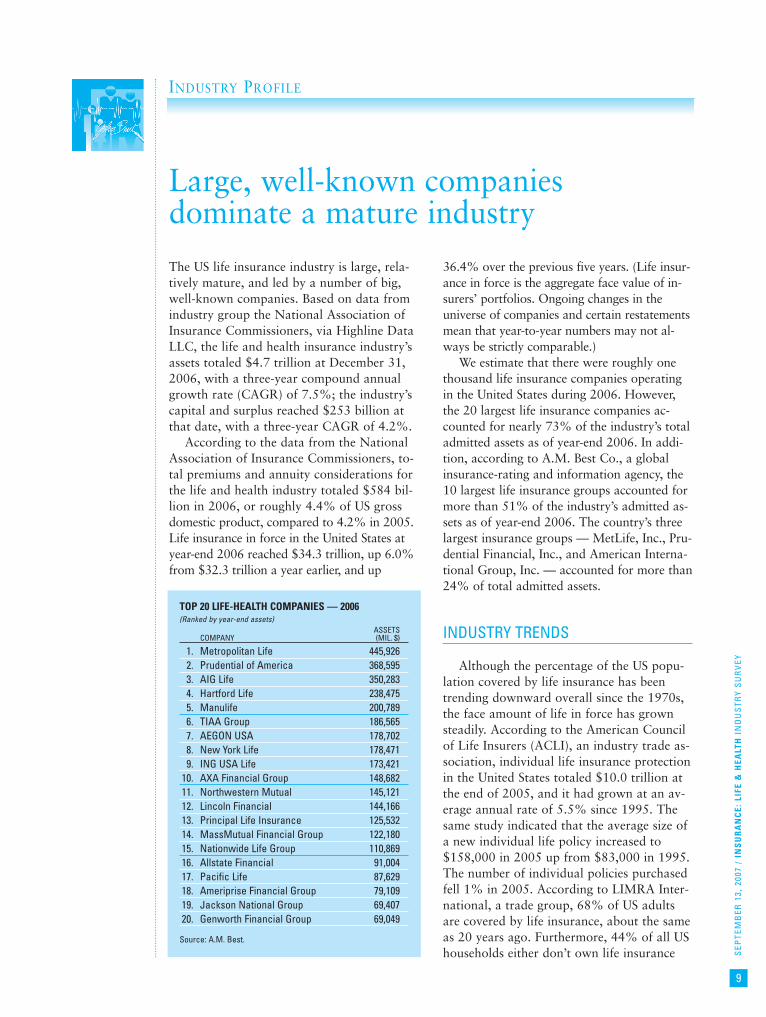
The US life insurance industry is large, rela-tively mature, and led by a number of big,well-known companies. Based on data fromindustry group the National Association ofInsurance Commissioners, via Highline DataLLC, the life and health insurance industry’sassets totaled $4.7 trillion at December 31,2006, with a three-year compound annualgrowth rate (CAGR) of 7.5%; the industry’scapital and surplus reached $253 billion atthat date, with a three-year CAGR of 4.2%.
According to the data from the NationalAssociation of Insurance Commissioners, to-tal premiums and annuity considerations forthe life and health industry totaled $584 bil-lion in 2006, or roughly 4.4% of US grossdomestic product, compared to 4.2% in 2005.Life insurance in force in the United States atyear-end 2006 reached $34.3 trillion, up 6.0%from $32.3 trillion a year earlier, and up
36.4% over the previous five years. (Life insur-ance in force is the aggregate face value of in-surers’ portfolios. Ongoing changes in theuniverse of companies and certain restatementsmean that year-to-year numbers may not al-ways be strictly comparable.)
We estimate that there were roughly onethousand life insurance companies operatingin the United States during 2006. However,the 20 largest life insurance companies ac-counted for nearly 73% of the industry’s totaladmitted assets as of year-end 2006. In addi-tion, according to A.M. Best Co., a globalinsurance-rating and information agency, the10 largest life insurance groups accounted formore than 51% of the industry’s admitted as-sets as of year-end 2006. The country’s threelargest insurance groups — MetLife, Inc., Pru-dential Financial, Inc., and American Interna-tional Group, Inc. — accounted for more than24% of total admitted assets.
INDUSTRY TRENDS
Although the percentage of the US popu-lation covered by life insurance has beentrending downward overall since the 1970s,the face amount of life in force has grownsteadily. According to the American Councilof Life Insurers (ACLI), an industry trade as-sociation, individual life insurance protectionin the United States totaled $10.0 trillion atthe end of 2005, and it had grown at an av-erage annual rate of 5.5% since 1995. Thesame study indicated that the average size ofa new individual life policy increased to$158,000 in 2005 up from $83,000 in 1995.The number of individual policies purchasedfell 1% in 2005. According to LIMRA Inter-national, a trade group, 68% of US adultsare covered by life insurance, about the sameas 20 years ago. Furthermore, 44% of all UShouseholds either don’t own life insurance
INDUSTRY PROFILE
Large, well-known companiesdominate a mature industry
SEP
TEM
BER
13,
200
7 /
INS
UR
AN
CE:
LIF
E &
HEA
LTH
IN
DU
STR
Y S
UR
VEY
9
TOP 20 LIFE-HEALTH COMPANIES — 2006(Ranked by year-end assets)
ASSETSCOMPANY (MIL. $)
1. Metropolitan Life 445,926 2. Prudential of America 368,595 3. AIG Life 350,283 4. Hartford Life 238,475 5. Manulife 200,789 6. TIAA Group 186,565 7. AEGON USA 178,702 8. New York Life 178,471 9. ING USA Life 173,421
10. AXA Financial Group 148,682 11. Northwestern Mutual 145,121 12. Lincoln Financial 144,166 13. Principal Life Insurance 125,532 14. MassMutual Financial Group 122,180 15. Nationwide Life Group 110,869 16. Allstate Financial 91,004 17. Pacific Life 87,629 18. Ameriprise Financial Group 79,109 19. Jackson National Group 69,407 20. Genworth Financial Group 69,049
Source: A.M. Best.
SEP
TEM
BER
13,
200
7 /
INS
UR
AN
CE:
LIF
E &
HEA
LTH
IN
DU
STR
Y S
UR
VEY
10
and believe they should, or do own life insur-ance and believe they need more. Amongthose that already own some life insurance,40% believe they do not have enough.
Changing demographics create newopportunities
The forces shaping the life insurance in-dustry today stem from a number of demo-graphic changes, as well as from structuralchanges within the financial services market-place. According to the US Census Bureau,the segment of the general population of re-tirement age (aged 65 or older) is expected toincrease from 12.4% in 2000 to 13.0% in2010, 16.3% in 2020, and 19.6% in 2030.Conversely, while the segment of working-aged people (ages 20 to 64) in the generalpopulation is expected to increase from59.0% in 2000 to 60.0% in 2010, the per-centage is then projected to decrease sharplyto 57.2% in 2020 and 54.2% in 2030.
The overall aging of the population isturning insurers’ attention gradually awayfrom income-protection financial productstowards retirement-oriented financial prod-ucts. In addition, increasing longevity is alsohaving an influence on insurers, as longer
lives will bolster the need for greater retire-ment wealth. For more traditional life insur-ance products, rising longevity has helped toreduce mortality rates, which can aid insurerprofitability in these product lines.
Mortality tables revisedIn 2004, a new set of mortality tables,
CSO 2001, was adopted by a majority ofstates and became the prevailing mortalitytables used by the Internal Revenue Serviceand the life insurance industry, replacing thedecades-old CSO 1980 set of tables. Mortali-ty rates under the new tables are expected toimprove for most population classes, general-ly leading to lower reserving requirements. Inaddition, the maximum age under the tableswill extend from 100 years to 120 years.
Through 2009, the National Associationof Insurance Commissioners (NAIC), an or-ganization of insurance regulators, is allow-ing insurance companies to implement thetables in states where it has been adopted.The new mortality tables, which are used forproduct reserving, apply only to new sales oflife insurance products. Given the lower re-serve requirements and changes in actuarialassumptions, the revisions could affect pre-mium levels, product guarantees, cash values,and the need for reinsurance.
Baby boomers generate new demands...Longer life expectancies and concerns
about the financial safety net of Social Secu-rity have given baby boomers a heightenedawareness of the need to save for retirement.(Baby boomers are the approximately 77million Americans born between 1946 and1964.) Moreover, a shift in pension trends —from defined benefit plans to defined contri-bution plans, such as 401(k) plans — hasgiven many Americans a greater sense of fi-nancial empowerment. Standard & Poor’sbelieves variable annuities will also play animportant role in meeting the retirementneeds of baby boomers.
Many people now use technology, such asthe Internet, to filter the vast array of infor-mation available to them as they plan theirfinancial futures. Furthermore, the break-down of the barriers that once separated thevarious sectors of the financial services in-dustry is having an effect on consumer be-havior. Banks and brokerage houses now sellmore annuities than do life insurance agents.
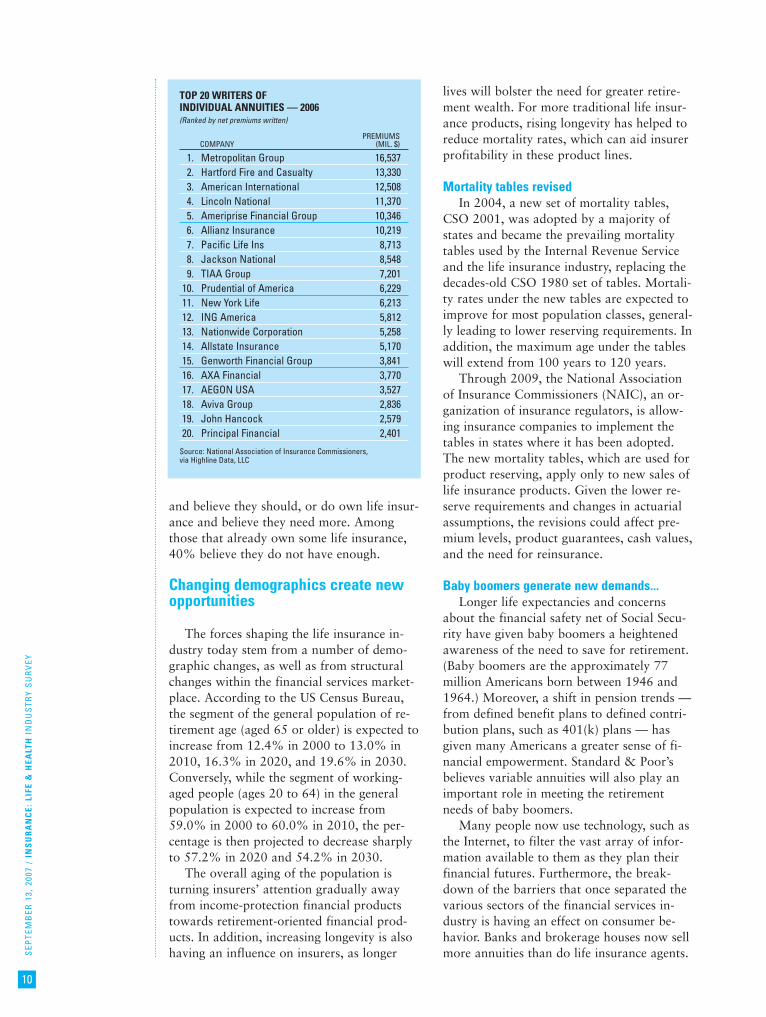
TOP 20 WRITERS OF INDIVIDUAL ANNUITIES — 2006(Ranked by net premiums written)
PREMIUMSCOMPANY (MIL. $)
1. Metropolitan Group 16,537 2. Hartford Fire and Casualty 13,330 3. American International 12,508 4. Lincoln National 11,370 5. Ameriprise Financial Group 10,346 6. Allianz Insurance 10,219 7. Pacific Life Ins 8,713 8. Jackson National 8,548 9. TIAA Group 7,201
10. Prudential of America 6,229 11. New York Life 6,213 12. ING America 5,812 13. Nationwide Corporation 5,258 14. Allstate Insurance 5,170 15. Genworth Financial Group 3,841 16. AXA Financial 3,770 17. AEGON USA 3,527 18. Aviva Group 2,836 19. John Hancock 2,579 20. Principal Financial 2,401
Source: National Association of Insurance Commissioners,via Highline Data, LLC
SEP
TEM
BER
13,
200
7 /
INS
UR
AN
CE:
LIF
E &
HEA
LTH
IN
DU
STR
Y S
UR
VEY
11
Life insurance agents, in turn, now sellinvestment-oriented products, includingmutual funds. These factors have greatlychanged the selling process and probably willcontinue to chip away at the old maxim that“life insurance is sold, not bought.”
...and the industry respondsAlthough life insurance remains a mature,
relatively slow-growth business, new challengeshave sparked some dynamic changes in the in-dustry. Many insurers have undertaken majorrestructuring programs in an attempt to re-shape their market image. A number of insur-ers have launched aggressive variable annuitysales programs and new wealth product guar-antees in an effort to ramp up growth; this fol-lows several years of declining equity markets(following the technology bubble), whichdampened enthusiasm for equity-linked prod-ucts, such as variable annuities and variablelife. Insurers also are refining their risk man-agement, borrowing techniques that have beenpopular in the banking industry for spread-based products, such as fixed annuities.
While consumer acceptance for new prod-uct guarantees, such as guaranteed minimumwithdrawal and income benefits, has beenencouraging, the new features are not with-out their downsides. Most insurers use com-plex market-hedging strategies for theguarantees that can be difficult and expen-sive to implement. Since the guarantees arerelatively new, most insurers do not havemuch historical data on which to rely whenpricing these features. Furthermore, the lackof historical data and an incomplete under-standing of the risks associated with theguarantees have resulted in a scarcity of rein-surance for these new product features. In-surers also must contend with recent andpending accounting changes that require in-surers to post reserves for new componentsof their wealth products. Accordingly, Stan-dard & Poor’s believes that insurers likelywill continue to reassess and reengineer theirwealth products to meet consumer needs andnew regulatory challenges.
Distribution channels have beenshifting
Faced with growing competition from otherfinancial services firms and the imperative toboost revenue growth and profit margins,
many insurers have reevaluated their distribu-tion channels and are revamping the way theydeliver products to consumers. In particular,banks and other financial services firms havegenerated an increasing share of insuranceproduct sales, especially for annuities.
Historically, life insurers were essentiallythe sole source of life insurance products andprospered by selling policies through anagency system. Establishing an agency net-work was costly, but necessary; the conven-tional wisdom was that life insurance wassold, not bought; and consumers had to beeducated on products and convinced thatthey needed life insurance. Today, the repealof the Glass-Steagall Act has allowed otherfinancial services firms, such as banks andbrokerages, to offer insurance products.Many have widespread and efficient distribu-tion networks through their branch systemsor broker networks. Moreover, these distrib-utors have recognized that most life insur-ance is a commodity, and, as such, it must bemarketed primarily on price. Therefore,those companies that deliver these productsto consumers in the most cost-effective man-ner will thrive in the long term.
Work site marketing gaining importanceWork site marketing is the process where-
by an insurer offers its products or servicesto employees at their place of work. Typical-ly, these solicitations are made via the clientcompany’s Web site and/or through directmailings sent to employees, either at theirhome or office. Direct, face-to-face solicita-tion of employees is not typical in this kindof situation; however, follow-up contacts —either to administer a policy or conduct pre-screening tests — are possible.
A broad array of products is offered, includ-ing homeowners’ and auto insurance, dentalcoverage, long-term care, and supplemental lifeinsurance. Savings and retirement products alsomay be offered. According to a MetLife surveycommissioned in 2005, 40% of all employeespurchase more financial products (e.g., insur-ance, mortgages, long-term care insurance, 529plans, and securities) through the workplacethan outside of work.
For the client company, this kind of mar-keting enables it to “offer” these choices toits employees. There is an appearance of anenhanced benefit package without addedbenefit costs for the employer. By offering

SEP
TEM
BER
13,
200
7 /
INS
UR
AN
CE:
LIF
E &
HEA
LTH
IN
DU
STR
Y S
UR
VEY
12
these services, the employer also is able tohelp its employees to juggle work/life issues.For the employee, there is an element of con-venience with being able to purchase theseproducts and services at work, often withoutsitting through a presentation by an insur-ance sales representative. Moreover, there isan implied endorsement being provided bythe client company that may give the em-ployee an added sense of comfort. In essence,some of the screening has already been done.
For insurance companies, this kind ofmarketing is a very productive use of re-sources. Marketing through this channel of-fers an insurer the potential to achieve quickeconomies of scale and, in some cases, a fa-vorable mix of underwriting risk by insuring(presumably) younger, healthier workers.
M&A activity focuses on scale andscope
The US life insurance industry has beenin a period of consolidation since the1990s. According to the ACLI, the numberof US life insurers operating in the UnitedStates peaked at 2,343 in 1988. At year-end 2005, there were only 1,119 US life in-surers, down from 1,650 at the end of1995 — a 10-year compound annual de-cline of 3.8%. Standard & Poor’s believesthat, in the long term, consolidation in thelife insurance industry will continue to bedriven by the need to offset slowing rev-enue growth, compete in a converging fi-nancial services marketplace, cut costs, andachieve economies of scale.
During 2005, a stable economic environ-ment, stronger balance sheets, and an increasedappetite for growth helped fuel further mergerand acquisition (M&A) activity in the life in-surance sector. According to data obtainedfrom SNL Securities, a financial services orga-nization, 28 deals — valued at a total of $21.8billion — were announced in the life insurancesector in 2005. This contrasted sharply withthe M&A environment that existed in 2004,when 31 deals valued at $3.5 billion wereannounced. Results in 2005 were affectedby several large transactions, includingMetLife’s acquisition (in January 2005) ofTravelers Life & Annuity, valued at $11.5billion, and Lincoln National Corp.’s ac-quisition (in October 2005) of Jefferson-Pilot, valued at $7.6 billion. In 2003, the
overall level of M&A activity included 35deals valued at $14.5 billion. (For more infor-mation on current M&A trends, see the “Cur-rent Environment” section of this Survey.)
Standard & Poor’s expects this pace oftransactions to continue. The significant num-ber of smaller life insurance companies pro-vides numerous M&A candidates for the largerinsurance companies. Furthermore, many in-surers are reassessing their current businessmix, with some choosing to sell off smallerlines or underperforming books of business inan effort to improve profits and focus on theircore competencies. Indeed, a fair amount ofM&A activity going forward may be in theform of restructurings: companies selling offparts of their operations that no longer fit withtheir long-term strategic initiatives.
Standard & Poor’s believes that many lifeinsurance companies will acquire smallercompanies or blocks of businesses to im-prove their scale and scope. Some firms aregrowing almost entirely through acquisitions,figuring that it is more cost-efficient to ac-quire blocks of existing in-force policies thanto build critical mass through a start-up ef-fort. Other buyers are looking to offset slow-er growth in their core business with newlines, such as retirement savings, to expanddistribution or gain a presence in the USmarketplace, or simply to acquire a franchiseor brand that increases their overall presencein the marketplace.
The demutualization trend takes apause
Today, most of the major life insurancecarriers that were mutually owned have al-ready demutualized (converted to stockhold-er ownership). The few notable exceptionsinclude Massachusetts Mutual Life InsuranceCo., New York Life Insurance Co., and theNorthwestern Mutual Life Insurance Co.Mutual insurance companies are owned bytheir policyholders, so their main focus is toprovide low-cost policies and high-qualityservice to their policyholder owners. In con-trast, stockholder-owned insurance compa-nies must juggle the often-conflictinginterests of their policyholder clients andshareholder owners.
According to the ACLI, there were only135 mutual life insurers doing business in theUnited States during 2005, down from 228
SEP
TEM
BER
13,
200
7 /
INS
UR
AN
CE:
LIF
E &
HEA
LTH
IN
DU
STR
Y S
UR
VEY
13
in 1995. Furthermore, according to A.M.Best’s Aggregates & Averages, mutual com-panies accounted for only 16% of the lifeinsurance industry’s admitted assets in 2005,down from 39% in 1995. Previously, two ofthe largest life insurers in the United States —Prudential Financial Inc. and MetLife — wereboth mutual life insurers. MetLife demutual-ized in April 2000, and Prudential completedits demutualization in late December 2001.Other notable demutualizations occurringaround the same time included John Han-cock, Principal Financial Group Inc., and thePhoenix Companies Inc.
Insurers involved in the last round of de-mutualizations benefited from a rising stockmarket that permitted companies to raisecapital at a favorable price, while also pro-viding management with a publicly tradedstock that could be used for currency in fu-ture acquisitions. Both prospects were partic-ularly appealing to mutual insurers, whofaced new competitive threats and opportu-nities following repeal of the Glass-SteagallAct and believed that stock ownership wouldallow them the flexibility to adapt and profitin this new environment.
Of course, transformation to stockholder-owned status does not happen overnight.Prudential’s demutualization process took al-most four years from the time the companyfirst announced its intention to convert tothe completion of its initial public stock of-fering. Central to the process are regulatoryapprovals and the arduous task of estimatingwhat the policyholders’ shares are worth.Typically, policyholders are offered the op-tion of exchanging their interest for cash,stock in the new company, or an increasedlevel of insurance benefits.
M&A could spur sponsored demutualizationsMany of the remaining mutual insurers
are currently generating healthy levels of cap-ital through their internal operations. Withthe passage of the Sarbanes-Oxley Act of2002, which requires additional and costlyoverhead expenses for those mutual compa-nies choosing to demutualize and issue apublic stock, Standard & Poor’s believes thatthe next wave of demutualization could bedifferent and may take the form of spon-sored demutualizations.
A sponsored demutualization is a processof demutualization under which a mutual in-
surer converts to a stock company ownershipstructure in order to be acquired by anotherstockholder-owned company. For example,in September 2002, shareholders of Nation-wide Financial Services Inc., a diversified in-surer and financial services firm based inColumbus, Ohio, approved a plan underwhich Nationwide would acquire ProvidentMutual Life Insurance Co., of Berwyn, Penn-sylvania, for about $1.5 billion. As part ofthe transaction, Provident simultaneouslyconverted to a stockholder-owned company.Nationwide completed its sponsored demutu-alization of Provident on October 1, 2002.
Despite its attractions, demutualizing isnot a panacea. While it affords the insureraccess to capital markets, demutualizationcan lead to complications. After operating ina mutual environment, where the goals ofthe insurer are to serve only the needs of pol-icyholders, many mutual insurance execu-tives may be ill prepared for the heightenedscrutiny and proactive ownership base of astockholder-based company. In addition, thestock market constantly grades the financialperformance of publicly owned insurers andexacts a heavy toll from stock prices of com-panies that do not perform up to par.
Capital market activity may slow
Life insurers have extremely large invest-ment portfolios that can be affected by large-scale bankruptcy or credit downgrades.Despite the credit issues experienced by FordMotor Co. and General Motors Corp. in2005 and 2006, most life insurers were re-porting favorable bond credit trends andrenewed balance sheet strength. Moreover,80% of all life companies rated by Stan-dard & Poor’s had a stable outlook as ofMay 2007. Standard & Poor’s believes thatmost publicly traded life insurance compa-nies will have little need to raise additionalfunds in the capital markets in order tomaintain their financial strength ratings. Infact, many life insurance companies havebeen building excess capital. The averagerisk-based capital (RBC) ratio increased to409% in 2005, compared to 290% in 1997.As calculated by the National Association ofInsurance Commissioners model law, theRBC ratio measures the minimum amount ofcapital an insurance company needs to pre-vent triggering regulatory action.
SEP
TEM
BER
13,
200
7 /
INS
UR
AN
CE:
LIF
E &
HEA
LTH
IN
DU
STR
Y S
UR
VEY
14
Standard & Poor’s expects many pub-licly traded life insurance companies tocontinue raising dividends and buying backstock. Excess capital may also be used topay for strategic acquisitions. These com-panies’ strong internal cash flow will alsosupport a prudent, measured approach togrowing the business internally. However,as guarantee features for wealth productscontinue to evolve, some life insurers maydecide to access the capital markets andraise reserves for these guarantees, espe-cially given the lack of adequate reinsur-ance for many of these features.
Legislative changes impact wealthproducts
On August 17, 2006, President Bushsigned the Pension Protection Act of 2006.One of the key provisions of the new law isthat new employees are automatically en-rolled in the company’s 401(k) plan, whichwill help young employees get an early starton saving for retirement. Standard & Poor’sbelieves that the bill’s automatic provisionwill increase 401(k) participation rates andact as a boon to companies that provide re-tirement benefits. In addition, the new lawallows annuities to be an investment optionin a company’s 401(k) plan. The bill also al-lows investment providers to offer profes-
sional investment advice to plan participants.The bill further codifies the tax-free treat-ment of death benefits and codifies insuranceindustry “best practices” relating to the useof company-owned life insurance (COLI).COLI is an insurance product used by em-ployers both to protect against the financialcost of losing a key employee and to providemeans to fund employee and retiree benefits.
Life insurers often have sold survivor-ship or “second-to-die” life insurance poli-cies to be used in estate planning purposesfor the payment of estate taxes. In 2001,President Bush signed into law the Eco-nomic Growth and Tax Relief Reconcilia-tion Act (EGTRRA), which, among otherthings, increased federal tax deductions formany retirement savings plans, includingindividual retirement accounts (IRAs) and401(k) plans, and reduced or repealed fed-eral estate taxes from 2001 to 2010. As aresult of this new legislation, the demandfor survivorship policies may have de-creased, and IRA and 401(k) accountscould accept additional funds that other-wise might be invested in tax-advantagedwealth products offered by life insurers,such as annuities.
In 2003, President Bush signed into law theJobs and Growth Tax Relief Reconciliation Act(JGTRRA), which, among other things, cut thefederal income tax rate on stock dividends andcapital gains. This increased the attractivenessof common stock for income-oriented in-vestors, providing additional competition forlife insurance wealth products.
Federal regulation for life productsappears unlikely
For years, life insurance companies havebeen lobbying Congress to give insurers theoption to be regulated at the federal levelrather than the current state regulatoryregime, whereby insurers must work withregulators in each individual state wherethey conduct business. Life insurers claimthat the state regulatory system is morecostly and time-consuming than a proposedfederal system, and that insurers often havedifficulty creating products that can be eas-ily altered to meet the differing require-ments of individual state regulators.Furthermore, they say that banks, whichcan be federally chartered and regulated,
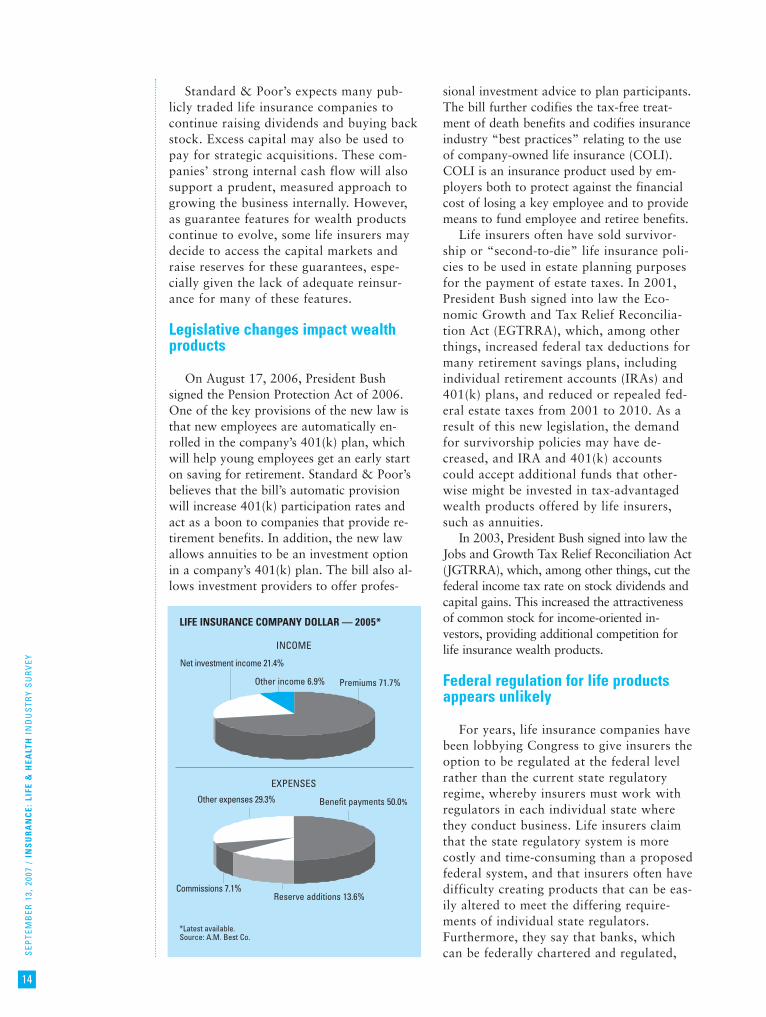
LIFE INSURANCE COMPANY DOLLAR — 2005*
*Latest available.Source: A.M. Best Co.
Reserve additions 13.6%
Net investment income 21.4%
Premiums 71.7% Other income 6.9%
Benefit payments 50.0%Other expenses 29.3%
INCOME
EXPENSES
Commissions 7.1%

SEP
TEM
BER
13,
200
7 /
INS
UR
AN
CE:
LIF
E &
HEA
LTH
IN
DU
STR
Y S
UR
VEY
15
do not have to deal with individual stateregulators — and thus have an unfair com-petitive advantage. According to a studyconducted in 2004 by the ACLI and con-sulting firm Computer Sciences Corp., asingle federal regulatory regime would re-duce the cost of regulation by more than$2.5 billion annually.
Standard & Poor’s believes that federal reg-ulation for life insurers is unlikely in the nearfuture. One problem is that many property-casualty insurance associations are lobbyingnot for federal regulation, but for better stateregulation. These insurance associations con-tend that, because property-casualty coverageneeds can vary from state to state, the currentregulatory system is more appropriate.
The National Association of Mutual In-surance Companies, the National Associationof Professional Insurance Agents, and the In-dependent Insurance Agents and Brokers ofAmerica are among the associations thatoppose the plan. State regulators and con-sumer groups also do not support a federalregulatory framework.
HOW THE INDUSTRY OPERATES
The life insurance industry is being trans-formed by ongoing competitive pressure frombanks and other financial intermediaries, aswell as by regulation changes. In the past, lifeinsurers provided only one thing: financial re-muneration in the event of a policyholder’sdeath. Today, they provide an array of financialproducts and play an integral role in manypeople’s financial planning, including servicesin such complex areas as tax, retirement, andestate planning.
In its simplest form, however, life insur-ance is still a business of shared risk. Insurerscollect premiums from policyholders, investthose premiums, and share some of that in-come with policyholders (in the form of apolicy dividend or income from an annuity,or through a policy’s cash value). Eventually,insurers give policyholders some sort of fi-nancial reimbursement, either upon the poli-cyholder’s death or when a policy or anannuity matures.
In the following section, we discuss variouskinds of ownership structures, assets, account-ing methods, products, and other key informa-tion pertinent to how the industry operates.
Ownership structures differ
Generally, a life insurance company’s own-ership can take one of two basic forms: that ofa stock insurance company, or that of a mutualinsurance company. In addition, a companycan be structured as a hybrid, known as a mu-tual holding company (MHC).
Stock insurance companiesStock insurance companies, as their name
implies, are owned by shareholders. Theownership capital of a stock insurance com-pany is called shareholders’ equity. Stock in-surance companies that are publicly held arerequired to file quarterly financial reportswith the Securities and Exchange Commis-sion (SEC). As a result, obtaining timely fi-nancial information about these companies isrelatively easy.
Mutual insurance companiesA mutual insurance company is owned by
its policyholders, and its ownership capital iscalled policyholders’ surplus. Because thesecompanies are not publicly held, they are notrequired to disclose financial information tothe SEC. Although mutual insurers provide in-formation to state regulators, and some distrib-ute financial information to policyholders,obtaining timely financial information aboutmutual life insurers can be difficult for analystsand other interested parties.
This used to create problems for those an-alyzing the industry when mutual companiesdominated the upper echelons of the life in-surance industry. However, in the wake ofnumerous high-profile demutualizations —including those by Metropolitan Life Insur-ance Co., Nationwide Financial Services Inc.,and Prudential Financial Inc. — the numberof large mutual companies has declined.Only two of the top 10 US life insurers by ad-mitted assets — TIAA Group and New YorkLife Group — were mutual companies at theend of 2005, according to the latest figuresfrom A.M. Best Co., a global insurance-ratingand information agency.
Mutual holding companiesIn some instances, life insurers have
formed Mutual holding companies (MHCs)to combine the benefits of a mutual owner-ship with those of stock ownership. In thiscase, the insurance operations are conducted
SEP
TEM
BER
13,
200
7 /
INS
UR
AN
CE:
LIF
E &
HEA
LTH
IN
DU
STR
Y S
UR
VEY
16
by a stock company formally owned by theholding company, which in turn remains incontrol of the policyholders.
A benefit to this ownership structure is thatshares in the life insurance subsidiary can besold to the public to raise capital for expansionor for use as currency for acquisitions. Howev-er, such an arrangement may lead to conflictingpriorities as management seeks to please poli-cyholders, who prefer that the company remainfiscally sound and able to pay benefits, whilealso trying to satisfy outside shareholders, whoprefer growth and dividends. As a result, manyinsurers looking to demutualize have opted forfull demutualization, which is a more stream-lined process than a partial demutualization.
Types of assets
There are three main ways of classifyingthe assets owned by life insurance compa-nies: admitted assets, separate account assets,and troublesome assets.
Admitted assetsAdmitted assets are those assets that state
insurance regulators include when determin-ing an insurer’s financial condition or abilityto pay policyholders’ claims. Accordingly,they are usually those with a high degree ofliquidity or that can be easily converted intocash. Items such as office equipment andpast-due accounts receivable are examples ofassets that would be excluded from an insur-er’s tally of admitted assets.
In order to maintain an adequate financialcondition, life insurers keep the vast majorityof their assets in higher-quality investments
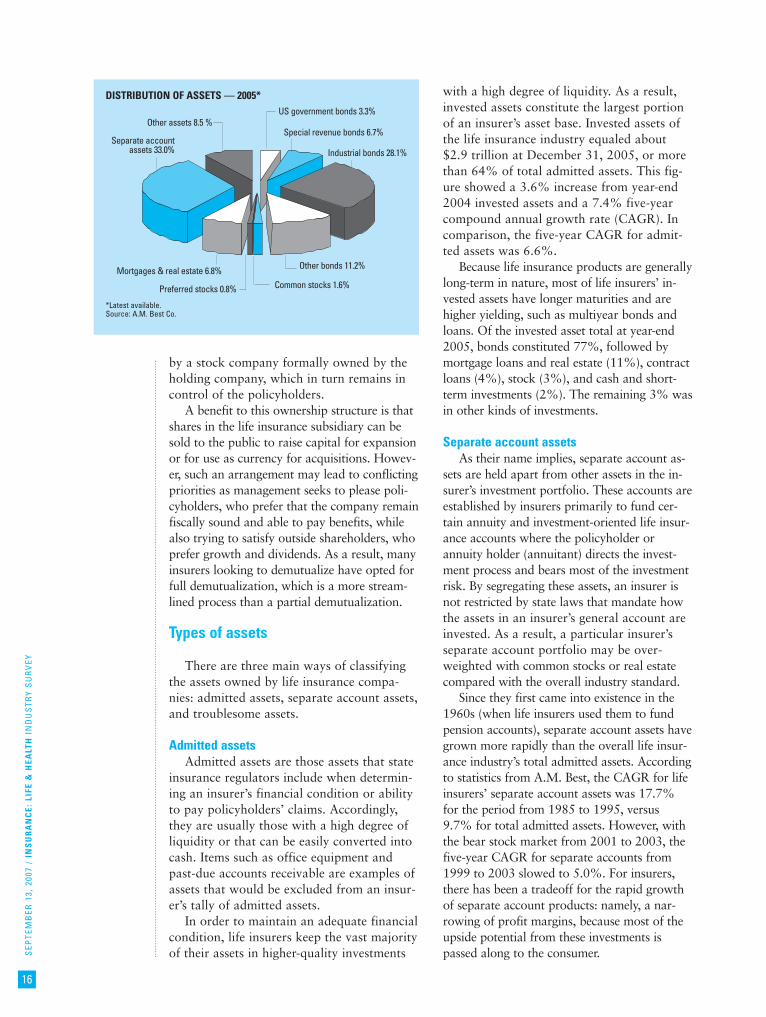
with a high degree of liquidity. As a result,invested assets constitute the largest portionof an insurer’s asset base. Invested assets ofthe life insurance industry equaled about$2.9 trillion at December 31, 2005, or morethan 64% of total admitted assets. This fig-ure showed a 3.6% increase from year-end2004 invested assets and a 7.4% five-yearcompound annual growth rate (CAGR). Incomparison, the five-year CAGR for admit-ted assets was 6.6%.
Because life insurance products are generallylong-term in nature, most of life insurers’ in-vested assets have longer maturities and arehigher yielding, such as multiyear bonds andloans. Of the invested asset total at year-end2005, bonds constituted 77%, followed bymortgage loans and real estate (11%), contractloans (4%), stock (3%), and cash and short-term investments (2%). The remaining 3% wasin other kinds of investments.
Separate account assetsAs their name implies, separate account as-
sets are held apart from other assets in the in-surer’s investment portfolio. These accounts areestablished by insurers primarily to fund cer-tain annuity and investment-oriented life insur-ance accounts where the policyholder orannuity holder (annuitant) directs the invest-ment process and bears most of the investmentrisk. By segregating these assets, an insurer isnot restricted by state laws that mandate howthe assets in an insurer’s general account areinvested. As a result, a particular insurer’sseparate account portfolio may be over-weighted with common stocks or real estatecompared with the overall industry standard.
Since they first came into existence in the1960s (when life insurers used them to fundpension accounts), separate account assets havegrown more rapidly than the overall life insur-ance industry’s total admitted assets. Accordingto statistics from A.M. Best, the CAGR for lifeinsurers’ separate account assets was 17.7%for the period from 1985 to 1995, versus9.7% for total admitted assets. However, withthe bear stock market from 2001 to 2003, thefive-year CAGR for separate accounts from1999 to 2003 slowed to 5.0%. For insurers,there has been a tradeoff for the rapid growthof separate account products: namely, a nar-rowing of profit margins, because most of theupside potential from these investments ispassed along to the consumer.
DISTRIBUTION OF ASSETS — 2005*
*Latest available.Source: A.M. Best Co.
US government bonds 3.3%
Special revenue bonds 6.7%
Other bonds 11.2%
Common stocks 1.6%Preferred stocks 0.8%
Mortgages & real estate 6.8%
Other assets 8.5 %
Industrial bonds 28.1%Separate account
assets 33.0%
SEP
TEM
BER
13,
200
7 /
INS
UR
AN
CE:
LIF
E &
HEA
LTH
IN
DU
STR
Y S
UR
VEY
17
At December 31, 2005, separate accountassets for the life insurers in the A.M. Beststudy totaled $1.5 trillion, or 33% of admit-ted assets. The five-year CAGR for separateaccount assets was 5.2% through 2005. Sep-arate account assets grew at a three-yearCAGR of 15.3% through year-end 2005. Atyear-end 2005, common stocks represented81% of separate account assets.
Troublesome assetsTroublesome assets are defined as invested
assets that decline in value while in the own-ership of an insurance company. For exam-ple, in the wake of the credit downgrades inthe auto industry, there was a rise in fixed-income troublesome assets. An increase introublesome assets leads to an increase inwrite-downs of investment portfolios.
Mortgage loans and other real estateholdings have been among the most trouble-some asset classes for life insurers in the past.In the early and mid-1980s, many life insur-ance companies increased their real estateholdings, spurred by the need to improvetheir investment returns in a declining inter-est rate environment. When the commercialreal estate market imploded in the late1980s, however, many insurance companieswere stuck holding nonperforming assets.
After reaching a peak of more than 27% ofinvested assets at year-end 1986, real estate andmortgage holdings trended downward as a per-centage of invested assets, as insurers sought toreduce their holdings of this once-troubled as-set class. More favorable real estate marketconditions, which gained traction when theFederal Reserve started cutting interest rates in2001, induced a number of companies to in-crease their real estate holdings. However, the
recent rise of interest rates and the threat of adifficult real estate environment have led com-panies to again reduce their exposure. As ofyear-end 2005, real estate and mortgage hold-ings totaled 10.6% of total invested assets.
Mortgage and real estate portfolios canvary widely among insurers; many life insur-ers hold little or no real estate, while othersare laden with it. Typically, the firms withthe largest holdings (on an absolute basisand in relation to their capital bases) havetended to be those with sizable pension- orannuity-related books of business.
Finding funds for investment
Insurers derive funds for investment fromfour primary sources: policy reserves, the lia-bility for unearned premiums and depositedfunds, separate account liabilities, and capi-tal and surplus. Policy reserves, which arethe funds set aside to pay future claims, areby far the largest liability on an insurer’sbooks; for the companies in the A.M. Bestsurvey, these reserves totaled slightly morethan $2.0 trillion at December 31, 2005, orabout 49% of the industry’s total liabilitiesof roughly $4.2 trillion.
At year-end 2005, the liability for sepa-rate account funds totaled $1.5 trillion, orabout 35% of total liabilities. The liabilityfor deposit-type contracts (such as annuities)equaled $325 billion, or 7.7% of life insur-ers’ total liabilities. Capital and surplus atyear-end 2005 totaled $250 billion.
Loss reserves and profitabilityLoss reserves have a significant impact
on an insurer’s financial results. A life in-surer’s prosperity depends largely on itsability to quantify the ultimate cost ofclaims from the risks that it assumes. If aninsurer’s reserve levels are too high — thatis, if it sets aside too much money to payfuture claims — profits will appear lowerthan they actually are. In response, an in-surer may raise its premium rates unneces-sarily if it believes current levels are not highenough to cover losses. However, an insurerthat initially sets its reserves too high cangenerally “release” these extra reserves toprofits when it becomes certain that the levelof reserves should be lowered.
Conversely, if reserves are too low, profitswill appear inflated, and an insurer may be
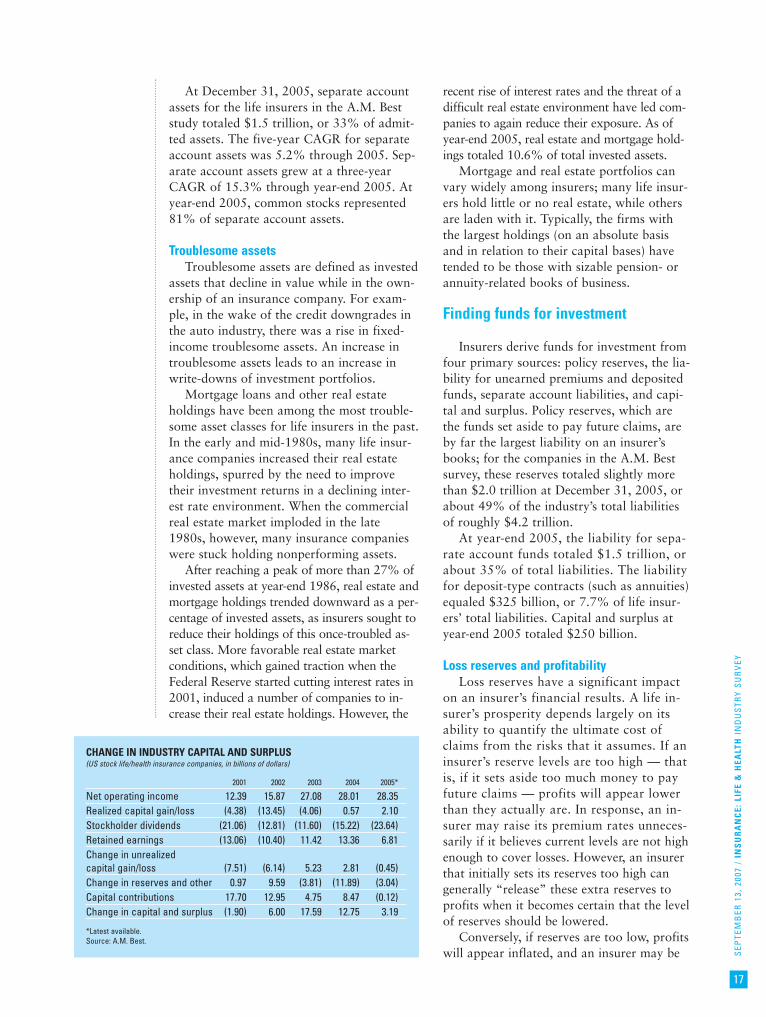
CHANGE IN INDUSTRY CAPITAL AND SURPLUS(US stock life/health insurance companies, in billions of dollars)
2001 2002 2003 2004 2005*
Net operating income 12.39 15.87 27.08 28.01 28.35 Realized capital gain/loss (4.38) (13.45) (4.06) 0.57 2.10 Stockholder dividends (21.06) (12.81) (11.60) (15.22) (23.64)Retained earnings (13.06) (10.40) 11.42 13.36 6.81 Change in unrealized capital gain/loss (7.51) (6.14) 5.23 2.81 (0.45)Change in reserves and other 0.97 9.59 (3.81) (11.89) (3.04)Capital contributions 17.70 12.95 4.75 8.47 (0.12)Change in capital and surplus (1.90) 6.00 17.59 12.75 3.19
*Latest available.Source: A.M. Best.
SEP
TEM
BER
13,
200
7 /
INS
UR
AN
CE:
LIF
E &
HEA
LTH
IN
DU
STR
Y S
UR
VEY
18
inclined to lower its rates. Moreover, inaccu-rate reserve levels ultimately will have to beadjusted once losses develop. These account-ing adjustments may make the insurer’s fi-nancial position seem erratic and unstable.Reserving for losses and setting premium lev-els involve estimating the ultimate value offuture claims. This actuarial process, howev-er, is extremely difficult. Forecasts of futurelosses are subject to a number of variables,including but not limited to mortality rates,real economic growth, inflation, interestrates, lapse rates, and sociopolitical events,including judicial rulings.
Two accounting methods
Many insurers report their financial re-sults using two kinds of accounting princi-ples. For results submitted to regulators,insurers use statutory accounting principles(SAP). For results given to investors, they usegenerally accepted accounting principles(GAAP). However, many financial analystsalso use SAP financial statements when eval-uating an insurer.
The primary difference between the twoaccounting systems lies in a concept knownas the matching principle. Under GAAP, ex-penses are charged (matched) to the periodin which they were used to generate revenuesand provide services, also known as accrual-based accounting. Under SAP, expenses arerecognized as incurred, also known as cash-based accounting.
This means that, under SAP, expenses as-sociated with writing an insurance policy —such as commissions and other underwritingexpenses — are immediately expensed anddeducted from income. Under GAAP, thesesame costs are treated as assets (referred toas a policy’s deferred acquisition costs, orDAC) and are amortized as expenses overthe insurance policy’s life, which is the periodover which the insurer provides its servicesto the policyholder. Since a policyholder canchoose to terminate a policy at a future date,the insurer must estimate (for DAC amorti-zation purposes) lapse rates and the lifetimeof a policy. Changes in these estimates cancause an insurer to accelerate or decelerateDAC amortization over time.
Hence, under the more conservative SAPmethod, which emphasizes a company’s solven-cy, income and surplus tend to be lower than
under the GAAP method, which emphasizes afirm’s ongoing profitability. Because regulatorsare primarily concerned with an insurer’s sol-vency and its concurrent ability to meet policy-holder obligations, they choose to scrutinize acompany’s financial statements using SAP. In-vestors, however, are usually more interested inan insurer’s ability to earn a profit and tend toput more emphasis on an insurer’s financialsusing GAAP figures.
Types of products
Available with a variety of coverage op-tions and terms, life insurance products arebecoming increasingly complex. Still, thegeneral kinds of products that follow consti-tute the bulk of life insurance sales.
Term insuranceAs its name implies, term life insurance
is life insurance that remains in effect for aset period, or term, such as five or 10years. If the policyholder survives duringthat period, the policy coverage ceases.Term life insurance does not build up anycash or forfeiture values. Consequently, itis usually the least expensive kind of lifeinsurance coverage available.
According to A.M. Best, term life insur-ance accounted for approximately 43% of alllife insurance issued in 2005, or about $1.3trillion of the more than $3.0 trillion of poli-cies issued that year. That represented a3.0% decrease from the level in 2004 and afive-year CAGR of 3.7%. Of the $33 trillionof insurance in force at the end of 2005,term life insurance accounted for 48%.
Whole lifeWhole life insurance policies combine a
death benefit with a savings plan. For tradi-tional whole life insurance, premium levels re-main constant over the policy lifetime. As aresult, a policyholder effectively overpays dur-ing the early years of his or her coverage, whenthe risk of death is relatively low. The interestearned on that overpayment goes to build thepolicy’s cash value, against which money maybe borrowed. Most whole life insurance poli-cies can be surrendered before maturity or thepayment of the death benefit for a lump sumknown as the surrender value.
A variant of whole life insurance, calledendowment insurance, provides a death ben-
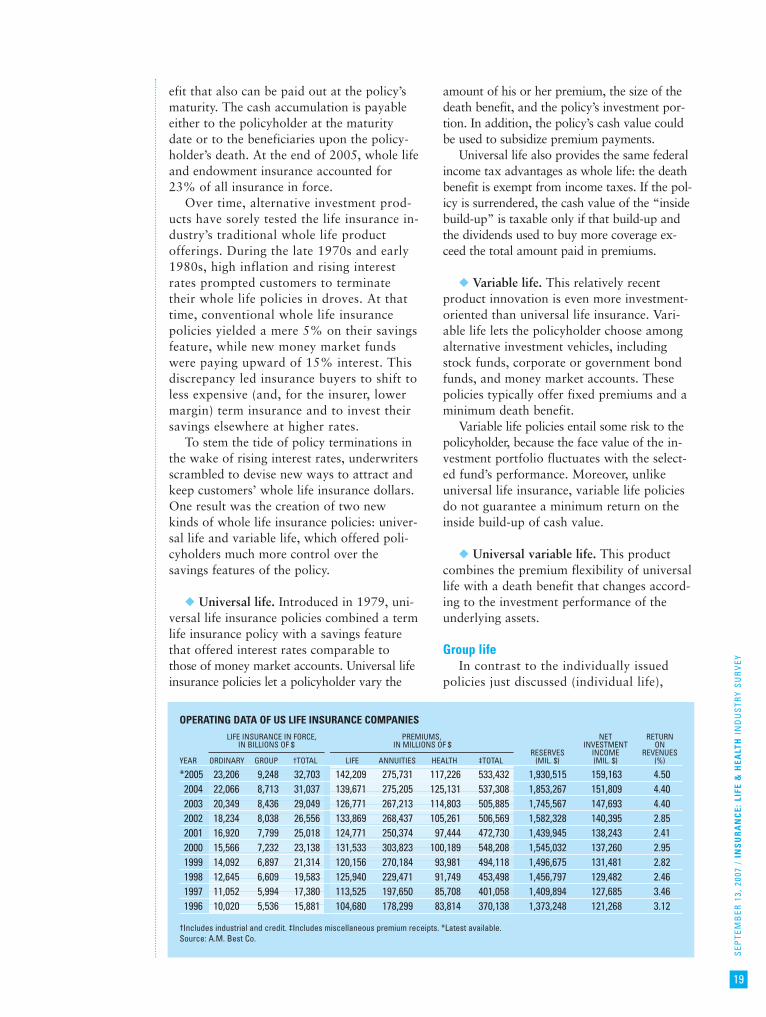
SEP
TEM
BER
13,
200
7 /
INS
UR
AN
CE:
LIF
E &
HEA
LTH
IN
DU
STR
Y S
UR
VEY
19
efit that also can be paid out at the policy’smaturity. The cash accumulation is payableeither to the policyholder at the maturitydate or to the beneficiaries upon the policy-holder’s death. At the end of 2005, whole lifeand endowment insurance accounted for23% of all insurance in force.
Over time, alternative investment prod-ucts have sorely tested the life insurance in-dustry’s traditional whole life productofferings. During the late 1970s and early1980s, high inflation and rising interestrates prompted customers to terminatetheir whole life policies in droves. At thattime, conventional whole life insurancepolicies yielded a mere 5% on their savingsfeature, while new money market fundswere paying upward of 15% interest. Thisdiscrepancy led insurance buyers to shift toless expensive (and, for the insurer, lowermargin) term insurance and to invest theirsavings elsewhere at higher rates.
To stem the tide of policy terminations inthe wake of rising interest rates, underwritersscrambled to devise new ways to attract andkeep customers’ whole life insurance dollars.One result was the creation of two newkinds of whole life insurance policies: univer-sal life and variable life, which offered poli-cyholders much more control over thesavings features of the policy.
◆ Universal life. Introduced in 1979, uni-versal life insurance policies combined a termlife insurance policy with a savings featurethat offered interest rates comparable tothose of money market accounts. Universal lifeinsurance policies let a policyholder vary the
amount of his or her premium, the size of thedeath benefit, and the policy’s investment por-tion. In addition, the policy’s cash value couldbe used to subsidize premium payments.
Universal life also provides the same federalincome tax advantages as whole life: the deathbenefit is exempt from income taxes. If the pol-icy is surrendered, the cash value of the “insidebuild-up” is taxable only if that build-up andthe dividends used to buy more coverage ex-ceed the total amount paid in premiums.
◆ Variable life. This relatively recentproduct innovation is even more investment-oriented than universal life insurance. Vari-able life lets the policyholder choose amongalternative investment vehicles, includingstock funds, corporate or government bondfunds, and money market accounts. Thesepolicies typically offer fixed premiums and aminimum death benefit.
Variable life policies entail some risk to thepolicyholder, because the face value of the in-vestment portfolio fluctuates with the select-ed fund’s performance. Moreover, unlikeuniversal life insurance, variable life policiesdo not guarantee a minimum return on theinside build-up of cash value.
◆ Universal variable life. This productcombines the premium flexibility of universallife with a death benefit that changes accord-ing to the investment performance of theunderlying assets.
Group lifeIn contrast to the individually issued
policies just discussed (individual life),
OPERATING DATA OF US LIFE INSURANCE COMPANIESLIFE INSURANCE IN FORCE, PREMIUMS, NET RETURN
IN BILLIONS OF $ IN MILLIONS OF $ INVESTMENT ONRESERVES INCOME REVENUES
YEAR ORDINARY GROUP †TOTAL LIFE ANNUITIES HEALTH ‡TOTAL (MIL. $) (MIL. $) (%)
*2005 23,206 9,248 32,703 142,209 275,731 117,226 533,432 1,930,515 159,163 4.50 2004 22,066 8,713 31,037 139,671 275,205 125,131 537,308 1,853,267 151,809 4.40 2003 20,349 8,436 29,049 126,771 267,213 114,803 505,885 1,745,567 147,693 4.40 2002 18,234 8,038 26,556 133,869 268,437 105,261 506,569 1,582,328 140,395 2.85 2001 16,920 7,799 25,018 124,771 250,374 97,444 472,730 1,439,945 138,243 2.41 2000 15,566 7,232 23,138 131,533 303,823 100,189 548,208 1,545,032 137,260 2.95 1999 14,092 6,897 21,314 120,156 270,184 93,981 494,118 1,496,675 131,481 2.82 1998 12,645 6,609 19,583 125,940 229,471 91,749 453,498 1,456,797 129,482 2.46 1997 11,052 5,994 17,380 113,525 197,650 85,708 401,058 1,409,894 127,685 3.46 1996 10,020 5,536 15,881 104,680 178,299 83,814 370,138 1,373,248 121,268 3.12
†Includes industrial and credit. ‡Includes miscellaneous premium receipts. *Latest available.Source: A.M. Best Co.
SEP
TEM
BER
13,
200
7 /
INS
UR
AN
CE:
LIF
E &
HEA
LTH
IN
DU
STR
Y S
UR
VEY
20
group life insurance coverage is providedunder a group or association program thatprovides each plan participant with life in-surance by issuing a certificate to a masterplan contract. Corporations provide mostof these plans to their employees, but spon-sors can also include associations, fraterni-ties, and other such organizations. Grouplife policies usually consist of annual re-newable term policies.
According to A.M. Best, issuances ofgroup life insurance sales equaled roughly$1.0 trillion in 2005, or approximately 35%of all new life insurance issued that year.This represented a 5.6% decrease from 2004and a five-year CAGR of 2.4%.
Other policiesThis category comprises credit life insur-
ance and industrial life insurance. Creditlife insurance is term life insurance de-signed to cover the repayment of a loan,installment purchase, or other financialobligation. Industrial life insurance is a rel-atively low-value form of life insurancewhereby the premium is collected by thesalesperson at the home of the insured on aweekly or monthly basis. This kind of lifeinsurance is also known as home servicelife insurance.
Together, issuances of credit life insuranceand industrial life insurance totaled approxi-mately $133 billion in 2005, or roughly4.5% of all issuances that year, and account-ed for roughly 1% of insurance in force atyear-end 2005. This was down from a levelof slightly under 2% of all in-force policiesat year-end 1998, according to A.M. Best.
AnnuitiesAn annuity is an insurance contract that
provides for a series of payments to the an-nuitant. These payments may begin at once(as is the case with an immediate annuity) orat some future date (with a deferred annu-ity). During the time before the commence-ment of benefit payments (referred to as theaccumulation period), money deposited in anannuity earns income on a tax-deferred basis.
Flexible-premium deferred annuities givethe contract holder the option of making pe-riodic (usually monthly) premium paymentsduring the accumulation period. This is incontrast to single-premium annuities, inwhich premiums are paid in one lump sum at
the outset. Single-premium annuities areavailable with either an immediate or a de-ferred payout option. After withdrawals be-gin, the remaining balance continues to betax-deferred; money that is paid out — orannuitized — is taxed.
In exchange for tax deferment features ofannuities, investors give up liquidity, or easyaccess to their money. Surrender charges, ex-penses, and certain tax penalties ensue if in-vestors withdraw funds before an annuitymatures. Nevertheless, the tax-deferredbuild-up of assets has been a primary attrac-tion for investors. In addition, while in-vestors can contribute only limited amountsto tax-deferred individual retirement ac-counts such as 401(k) plans and the like,they can put as much as they want into an-nuities. For insurers, selling annuities hasbeen a profitable undertaking in recent years.
Annuities can be structured in a variety ofways. Fixed annuities offer a guaranteed in-terest rate that will be paid on the principalamount deposited in the annuity. Under avariable annuity, in contrast, the level of in-vestment income is not guaranteed; it canfluctuate depending on the investment resultsand income earned on assets that are held ina separate account for the annuitants’ bene-fit. A hybrid product, known as an equity-indexed annuity (EIA), provides a minimumguaranteed rate of return plus a rate linkedto a market index, combining the positivefeatures of both fixed and variable annuities.
Due to their investment nature, annuitiesmust compete against other financial prod-ucts for consumer savings dollars. In thefixed annuity marketplace, insurers primarilycompete based on credited interest rates,which is the rate they are willing to pay onthe principal deposited in an annuity. Duringperiods of recession with declining interestrates, fixed annuities can allow investors to“lock in” a set interest rate. For example,during the early 1990s, declining interestrates helped to propel sales of fixed annu-ities, creating a boon for insurers.
However, when the economy begins to re-cover from a recession and interest rates stabi-lize, investor interest often turns to variableannuities, which permit underlying stock mar-ket investments. For example, individual vari-able annuity premiums jumped to almost $17billion in 1992, from just less than $9 billion in1991, according to data obtained from A.M.
SEP
TEM
BER
13,
200
7 /
INS
UR
AN
CE:
LIF
E &
HEA
LTH
IN
DU
STR
Y S
UR
VEY
21
Best. After peaking at $31 billion in 1993, vari-able annuity premiums began to slip as uncer-tain equity market conditions forced investorsback into safer investment havens.
According to the National Association forVariable Annuities (NAVA), an insurance re-search and statistical gathering firm, totalsales of variable annuities rose more than17% in 2006, to $154.9 billion, driven by amodest stock market growth and guaranteedminimum benefit features, such as guaran-teed minimum income benefits (GMIB) andguaranteed minimum withdrawal benefits(GMWB). Conversely, sales of fixed annu-ities, including EIAs, declined in 2005, dueprimarily to the interest rate environmentthat prevailed during 2005, especially inthe fourth quarter. According to NationalUnderwriter, an industry publication, in-dexed annuity sales increased to $27.3 bil-lion in 2005.
Stable value productsStable value investments are fixed income
investments that guarantee to maintain the val-ue of principal and all accumulated interest. Anumber of insurance companies provide groupannuity contracts, also called guaranteed in-vestment contracts (GICs), to managers of sta-ble value funds, which in turn are often offeredas investment choices for 401(k) and other re-tirement plan participants who wish to earn anacceptable return on their investments withoutaccepting market risk.
According to data from the Stable ValueInvestment Association, a leading authorityon retirement investing, stable value invest-ment options have been offered in two-thirdsof employee-directed 401(k) plans. Further-more, for plans offering a stable valuechoice, stable value assets represented $397billion (roughly 33%) of defined contribu-tion assets, as of December 31, 2005.
Long-term care and disability insuranceLong-term care (LTC) insurance pays for
services and support for policyholders whorequire assistance to perform certain dailyliving activities due to illness, injury, or oldage. Insurers offer LTC insurance on both in-dividual and group bases. The cost for suchcare is becoming increasingly expensive. Ac-cording to a study by MetLife, the averageannual cost of a private room in a nursinghome was $75,190 in 2006, and the Ameri-
can Council of Life Insurers (ACLI) predictsthis cost will escalate to more than $200,000by 2030.
Disability income insurance helps an em-ployee who is unable to work, due to acci-dent or illness, to maintain a level of income.Policies often can replace 50% to 70% of theemployee’s pre-disability income. Insurersalso offer disability insurance on both indi-vidual and group bases. According to theNational Compensation Survey, March 2006from the Bureau of Labor Statistics, 37% ofemployees in private industry participated inshort-term disability benefits and 29% par-ticipated in long-term benefits.
Distribution
Life insurers use a variety of distributionchannels, including the agency system, homeservice, and direct response. Following therapid growth in annuity markets in the1990s, a major proportion of life insuranceindustry sales came to be conducted bybanks and brokerage firms. In addition, theInternet represents a promising and growingdistribution outlet.
◆ The agency system. An agent acts as theinsurer’s representative in negotiating, selling,and servicing life insurance policies. Agentsmay be either independent (acting as contrac-tors and offering products from many insurers)or captive (employees of a particular insurer).Some insurers use managing general agents(MGAs), who have broader powers than regu-lar agents. In addition to selling policies, theMGA may be involved in marketing, under-writing policies, and supervising other agents.
◆ Home service life insurance. Also calledindustrial life insurance, home service repre-sents only a small portion of the industry’sbusiness. Home service involves actually col-lecting premiums for policies, either on aweekly or monthly basis, at the home of theinsured. This kind of service is costly and notvery efficient.
◆ Direct response. Of the various chan-nels, the direct-response method is the mostcost-effective. Under such a system, employ-ees of the insurance company deal directlywith potential clients through telephone so-licitations, mass mailings, or television adver-
SEP
TEM
BER
13,
200
7 /
INS
UR
AN
CE:
LIF
E &
HEA
LTH
IN
DU
STR
Y S
UR
VEY
22
tisements. Some insurers have turned to di-rect-response distribution channels to maketheir distribution systems more cost-effective.
◆ Internet sales. Numerous insurers haveturned to the Internet to market their prod-ucts. Virtually every insurer has a Web site,from which a consumer may access productinformation, learn how to file a claim, orfind the name of an agent. So far, alternativedistribution channels such as direct responseand the Internet have been used mostly forthe sale of term life insurance. They have hadsome degree of success with that product be-cause term life insurance is fairly simple tounderstand and the most commodity-like.
The pros and consWhile each sales channel has advantages
and disadvantages, the tradeoff for an in-surance company is cost versus control. Adirect-selling system may be expensive toestablish and operate, but it gives the in-surer control over the distribution process.Conversely, the independent agency systemcan reduce the amount of control an insur-er has over every aspect of the distributionsystem, but it usually offers an insurer anestablished network through which it candistribute its products. Many factors deter-mine which kind of distribution method isbest to use.
In addition to the resources an insurermust devote to distribution, its product mixlikely will have a major influence on the kindof distribution it employs. For example, a lifeinsurer that sells simple, low-value term in-surance could easily offer its productsthrough various direct-response channels.In contrast, a company with investment-oriented products may need to use a full-service agency sales force.
Regulating the industry
Regulation of the life insurance industry isdone on a state-by-state basis. Each of the 50states and the District of Columbia has anelected insurance commissioner. Each stategrants operating licenses to insurers, givingthem permission (or “admitting” them) to con-duct business within its borders. State regula-tors serve three primary functions. First, theymonitor the financial condition and claims-paying ability of companies operating in their
state. Second, they serve as consumer watch-dogs, ensuring that policyholders are not over-charged, mistreated, or discriminated against.Finally, regulators try to ensure that essentialcoverage is readily available.
States also approve insurance productsand license qualified agents to sell them.Insurance agents, including individualswho work for banks or brokerage firms,must pass a comprehensive state test to belicensed to sell insurance. In most states,agents must pursue continuing education inorder to maintain their licenses.
The activities of the insurance commission-ers are coordinated under a national organiza-tion, the National Association of InsuranceCommissioners (NAIC), which was founded in1871 as the National Convention of InsuranceCommissioners. One of the organization’s firstactions was to formulate uniform accountingprocedures. Today, one of the NAIC’s mainfunctions is to develop and improve insurancereporting and accounting standards and prac-tices in an attempt to enhance state regulators’knowledge of the financial condition of the in-surers in their state.
Every year, insurance companies are re-quired to file a set of financial statementswith the regulators in each state in whichthey operate. These records, called annualstatements, outline (in statutory accountingterms) a company’s profit-and-loss positionand its overall financial condition. More-over, all 50 states have laws requiring sol-vent life insurance companies to payassessments to state guaranty associations.These guaranty associations, or guarantyfunds, are established to ensure that policy-holder claims are paid in the event an in-surer becomes insolvent.
To comply with the Financial ServicesModernization Act of 1999, which calledfor a reform of the inefficient state-by-statesystem, the NAIC has approved a uniformproduct filing form and is working on a na-tional agent-licensing plan. Although anational regulatory body ultimately may beestablished — many have been calling forjust such a group for most of the lastdecade — nothing has happened yet.
Other forms of regulation and controlgovern the insurance industry. For example,publicly held companies (i.e., those that issueshares of stock) are also subject to regulationby the SEC.
SEP
TEM
BER
13,
200
7 /
INS
UR
AN
CE:
LIF
E &
HEA
LTH
IN
DU
STR
Y S
UR
VEY
23
KEY INDUSTRY RATIOSAND STATISTICS
With the exception of the risk-basedcapital (RBC) ratio, the following ratiosare derived from the statistics available ininsurance research firm A.M. Best Co.’s an-nual publication, Aggregates and Averages.For purposes of formulating industrywidebenchmarks, Standard & Poor’s defines theindustry as the universe of companies thatreport financial results to A.M. Best. In2005, the latest full year for which com-prehensive statistics are available, therewere 1,119 such stock and mutual life in-surance companies in the United States.
� Net investment yield. This ratio mea-sures performance of the investment port-folio. It is typically calculated as pretax netinvestment income divided by average in-vested assets, including cash. Realized andunrealized capital gains are excluded fromthe calculation. Typically, investment yieldsrange from less than 4% to almost 10%,depending on the credit quality, maturity,and mix of invested assets in an insurer’sportfolio. For the industry as a whole, thenet investment yield was 5.78% in 2005,versus 5.82% in 2004 and 6.12% in 2003.
� Return on assets (ROA). Calculatedby dividing net income by average total as-sets, ROA is a measure of profitability overall sources of funds. The ROA for most lifeinsurers typically ranges from 0.4% to0.9%. In 2005, the industrywide average,calculated as statutory net operating in-come over the average of the prior twoyears’ admitted assets, was 0.76%, downfrom 0.83% in the prior year.
� Return on equity (ROE). Anothermeasure of profitability, ROE comparesearnings to the level of equity capital sup-porting those earnings. The ROE (capitaland surplus) for most life insurers typicallyaverages between 10% and 15%; the ROEof a stock life insurer is usually in therange of 12% to 15%, while that of a mu-tual life insurer tends to be lower, averag-ing between 9% and 12%.
Life insurers often face a trade-off be-tween ROE and financial strength. Compa-nies seeking additional equity capital — in
order to increase their financial strength orclaims-paying ability, which is important toconsumers — often have lower ROEs, sincethe additional capital is largely invested inhigh-quality bonds that generally have anafter-tax return in the single-digit range.
To calculate the ROE for the entire lifeinsurance industry (which includes mutuallife insurance companies), net operating in-come is divided by the average of the priortwo years’ capital and surplus. In 2005, theROE for the total industry was 13.5%,down from 14.4% in 2004.
� Return on revenue (ROR). Designed tomeasure earnings performance relative to thesize of an insurer’s book of business, ROR iscalculated as net income divided by total rev-enue (premium income plus net investmentincome). The ROR for most life insurers typ-ically ranges from 2% to 5%. In 2004, theindustrywide average, calculated as statutorynet operating gain over total statutory rev-enue, was 4.5%, up from 4.4% in 2003.
� Risk-based capital (RBC) ratio. Thisratio compares the amount of capital sup-porting an insurer with the theoreticalamount of capital needed to act as a bufferin order to maintain the insurer’s claims-paying ability. The insurer’s capital is oftendetermined under statutory accounting; thetheoretical amount of capital is model-specific and accounts for numerous risksfacing an insurer, such as investment, un-derwriting, and operational risks, as wellas the covariance among these risks.
The National Association of InsuranceCommissioners (NAIC), an organization ofUS insurance regulators, and ratings firmsdevelop and use their own RBC models tohelp in assessing an insurer’s financialstrength. Under the NAIC model, the in-dustry average generally varies between250% and 350%; at the end of 2005, itwas in excess of 400%, the highest levelseen since life insurers began reportingrisk-based capital.
HOW TO ANALYZE A LIFE INSURER
Three primary factors are important toconsider when analyzing a life insurer: prof-itability (its ability to make money), liquidity
SEP
TEM
BER
13,
200
7 /
INS
UR
AN
CE:
LIF
E &
HEA
LTH
IN
DU
STR
Y S
UR
VEY
24
(its ability to convert assets into cash to paypolicyholder obligations), and leverage (theextent to which the insurer uses its capital toproduce business).
These three points should be consideredagainst a backdrop of two important macro-economic indicators that affect life insurancesales: interest rates and demographics. Wediscuss those two indicators first.
Macroeconomic indicators
◆ Interest rates. Changes in the direc-tion of interest rates affect life insurers ona number of fronts. First, in a period of de-clining interest rates, growth in net invest-ment income — an important revenuesource for a life insurer — will slow, asyields on insurers’ bond portfolios slide.However, falling interest rates also increasethe value of the underlying assets (usuallyfixed-income securities) that produce theinvestment income.
In addition, as the life insurance industryhas evolved into a more investment-orientedbusiness, life insurers must compete with otherfinancial institutions (such as banks and bro-kerage houses) for consumers’ savings dollars.One primary way that they compete is on theyield offered on their respective products. Forexample, an insurer selling a whole life or vari-able life policy may have to compete withbanks and the interest rates that they pay onmoney market funds or certificates of deposit.
Finally, changes in interest rates affect in-surers differently, depending on their busi-ness mix. There is a difference between thecash flows from a company’s interest-earningassets and the cash flows related to its liabili-ties that mature or are repriced within a spe-cific time frame. Consequently, many lifeinsurers employ a variety of hedging tech-niques, such as matching asset and liabilitydurations, to help insulate themselves fromchanges in interest rates.
◆ Demographics. The well-publicized agingof the US baby boom generation (those bornbetween 1946 and 1964) is affecting demandfor life insurance products. According to theUS Census Bureau, there will be about 81 mil-lion baby boomers in 2010, compared with 62million people aged 45 to 64 in 2000 — a pro-jected increase of approximately 30% in thepopulation in that age range.
As the baby boomers — who are now intheir forties and fifties, prime earning andsaving years — plan for their retirement,they do so with a much lower level of faithin the Social Security system, coupled withan outlook for increasing life expectanciesand higher healthcare costs. As a result,many are turning to life insurers to providenot only traditional death-benefit types oflife insurance, but also savings-oriented lifeinsurance products and annuities to helpfatten their coffers for retirement.
Conversely, the Census Bureau predictsthat there will be virtually no populationgrowth in the 20-to-44 age bracket between2000 and 2010, with only a modest 3%growth for those under the age of 20. Thelow growth for these age groups will likelytemper demand for more traditional deathbenefit products, where policy benefits areoften intended to protect families from theloss of a working spouse or parent.
Profitability
Life insurers’ profits consist of two compo-nents: underwriting income and investment in-come. For purposes of this discussion, weanalyze both of these as components of aninsurer’s operating income, which is net in-come excluding after-tax realized invest-ment gains or losses.
The profitability of underwritingWhen analyzing underwriting results,
consider the company’s rate of premiumgrowth, its fee income, and whether it usesreinsurance. The company’s expenses, in-cluding policyholder benefits, and its sell-ing costs are then examined. Thesemeasures then can be compared with ag-gregate industry data to see how a compa-ny stacks up against its peers.
Some companies report fee income sepa-rately from premium income; others com-bine the two and call them “premiums andequivalents.” Either way, both of these rev-enue components must be considered whenanalyzing underwriting results.
◆ Rate of premium growth. Pay carefulattention to the circumstances surroundingthe rate of premium growth. For example,if a company increases its premium base10% while the overall industry is growing

SEP
TEM
BER
13,
200
7 /
INS
UR
AN
CE:
LIF
E &
HEA
LTH
IN
DU
STR
Y S
UR
VEY
25
by 5% a year, that company would appearto be outperforming its peer group. Pre-sumably, the stock market would awardthat firm a higher valuation than would begiven to some of its slower-growth peers.
However, if the insurer is achieving premi-um growth by adopting risky practices —such as offering unusually high rates of re-turn on certain investment-oriented life in-surance products — that insurer’s valuationwould be adjusted downward accordingly.
A company expanding its premium baseat a rate slower than that of the overall in-dustry could be doing so because it is limit-ing its exposure to certain types of lessattractive business or trying to manage itsasset-liability mix. Often, insurers that arevery prudent in their underwriting practicesshow lower-than-average premium growthbut above-average profit growth.
◆ Fee income. As the life insurance in-dustry’s product mix shifts from one thatgenerates only premium revenues (from so-called traditional life insurance products)to one with a growing level of fee income(from fee-based products like annuities),the level of overall revenue growth may bemasked by declining or flat premiumgrowth. In many cases, this is offset byrather robust growth in fee income.
◆ Reinsurance. Another factor that affectsthe rate of premium growth is the extent towhich an insurer uses reinsurance. This is thepractice of transferring some risk — and pre-mium income — to reinsurance companies.To offset slowing premium growth, some in-surers have reduced the level of premiumsthat they cede (or transfer) to reinsurers.
Because using less reinsurance lets an in-surer keep more of each premium dollar, areduced level of reinsurance may enhanceyear-to-year premium growth comparisons.However, using less reinsurance removes asafety net of protection and leaves a primaryinsurer more exposed to large claims.
◆ Benefits and other expenses. The largestexpense facing most life insurers is policy-holder benefits. These include: death benefitsto life insurance policyholders; accident,health, and disability benefits to health insur-ance policyholders; and annuity benefits.Benefits also include surrender benefits,
which arise when policyholders and annui-tants terminate their policies or annuities.
Clearly, a sharp rise in any of those bene-fits should trigger a further investigation intothe causes behind the rise. Again, an insurer’sbusiness mix will greatly influence its level ofbenefit expenses and the growth rates there-in. For example, an insurer that writes alarge amount of fixed-rate annuities — insur-ance contracts that guarantee a set interestrate that will be paid on the principalamount deposited in the annuity — may seeits surrender rates increase if investors canobtain higher rates of return on their invest-ment dollars elsewhere.
However, one should closely examine aninsurer whose surrender rates rise sharplyduring a period of stable surrenders for theindustry. This could indicate that policyhold-ers and annuitants have lost faith in the com-pany’s ability to meet its obligations andhave pulled out their money in a move simi-lar to a “run” on a bank.
Two factors that influence the level of poli-cyholder benefits are trends in mortality andmorbidity. Mortality is the ratio of deaths to aspecific population. Morbidity is the frequencyof the incidence of disease, illness, or sickness.Insurers use various mortality and morbidityassumptions in pricing their policies; these as-sumptions usually are not disclosed. However,in the annual report, a section called “manage-ment’s discussion and analysis of financial con-dition” often includes the insurer’s discussionof general mortality and morbidity trends. It isimportant to note whether actual mortality andmorbidity trends were in line with the insurer’sassumptions.
◆ Selling costs. Aside from assorted policy-holder benefits, costs to produce new businessor acquire policies — including agent commis-sions and other related selling expenses — alsotake a big bite out of insurers’ budgets.
To measure an insurer’s effectiveness atmarketing its products, a “lapse ratio” isused. This is the number of life insurancecontracts that have lapsed (or terminated dueto nonpayment) within a specific period, di-vided by the number of policies in force dur-ing that period. A lower lapse ratio is usuallybetter for an insurer’s profitability, due to thehigh level of expenses (primarily agent com-missions) that insurers incur to produce newbusiness. Conversely, one would also look
SEP
TEM
BER
13,
200
7 /
INS
UR
AN
CE:
LIF
E &
HEA
LTH
IN
DU
STR
Y S
UR
VEY
26
for a high level of persistency — the percent-age of life insurance policies remaining inforce or that have not been canceled for pre-mium nonpayment — during the term.
Investment profitabilityInvestment income is an important rev-
enue source for life insurers; in some cases, itprovides almost half of an insurer’s total rev-enues. One should review the insurer’s assetallocation strategy, then calculate such mea-sures as yield and total return. Two standardfinancial ratios — return on assets and re-turn on equity — also help the analyst to as-sess a company’s profitability.
◆ Asset allocation strategies. When evalu-ating an insurer’s investment portfolio, re-
view its asset allocation strategy to seewhether the mix of invested assets is appro-priate for the kind of business that it writes.For most insurers, the investment process isfairly straightforward. Most life insurerskeep the bulk of their invested assets in rela-tively liquid fixed-income or equity securitiesthat can be easily converted into cash to paypolicy or annuity obligations.
For each asset class, such as stocks orbonds, a review of asset quality and diversifi-cation is prudent. To help in the analysis ofasset quality, insurers usually provide thedebt rating of bonds in their portfolio or anaverage debt rating for their entire portfolio.
Life insurers’ obligations tend to be rela-tively long-term in nature: the amount oftime from a policy’s inception to the payment
Evaluating a life insurancecompany’s creditworthiness
When assigning corporate credit ratings, Stan-dard & Poor’s Rating Services assesses companies’management and execution of corporate strategy, aswell as their business risk and financial risk profiles.
Standard & Poor’s believes that the followingsuccess factors are critical for companies in thelife insurance sector. Companies that displaythese characteristics often receive stabilized orupgraded credit ratings within two years. Con-versely, those that lack these traits may see theirratings fall. The status of interest rates and equi-ty markets relative to these factors also plays arole in our ratings.
Business risk Standard & Poor’s believes successful life insur-
ance companies are distinguished by competitive ad-vantages that are sustainable over the long term.These advantages help drive the growth of revenueand earnings.
◆ Scale and efficiency. Companies that con-trol costs, through either scale or operational effi-ciency, are likely to enjoy pricing flexibility. Scaleprovides the potential for more cost efficiency by en-abling a company to spread fixed costs over a largerblock of policies in force. It also provides insurerswith the ability to ride out difficult market conditionsand minimize revenue and earnings volatility.
While scale is important, Standard & Poor’s be-lieves that effective management, with respect tocontrolling costs and making use of technology, alsodifferentiates companies on competitive position andoperating performance. Managing distribution costsis especially critical. Many so-called “captive sys-tems” (in which a company maintains an extensiveforce of its own sales people) have been downsizedto better align the expenses and revenues of this crit-ical but costly channel.
◆ Customer service and product innovation.These two areas are key. The growing commoditizationof life insurance and variable annuity products in recentyears has heightened the importance of service. Theblurring of product distinctions has also meant that com-panies that are able to innovate have a competitive ad-vantage. Excelling in these two areas may allowcompanies to break away from the competition.
◆ Distribution effectiveness and efficiency.Standard & Poor’s believes that an effective and effi-cient distribution platform is a competitive advan-tage over the long term. Aside from brand strength,the breadth of a company’s distribution network isparticularly important.
With the shift away from captive reps, indepen-dent brokers are becoming the primary distributionmode as insurers increasingly target the upscalemarket. Accordingly, a company’s ability to managethe wholesaling and distribution of its products hasalso become critical.
S&P Ratings Services View:

SEP
TEM
BER
13,
200
7 /
INS
UR
AN
CE:
LIF
E &
HEA
LTH
IN
DU
STR
Y S
UR
VEY
27
of a benefit or claim is often lengthy. For thisreason, some life insurers invest a portion oftheir invested assets in relatively illiquid (buttheoretically higher-yielding) mortgage loansand real estate. A review of this asset classshould include an analysis of the reserve lev-els, the level of delinquencies (in the case ofmortgage loans), and the diversification ofthe real estate portfolio (both by propertytype and by geographic location).
◆ Measures of investment success. Twoindustry-specific ratios that help the ana-lyst to measure a company’s investmentsuccess are yield and total return. Yield isusually calculated as the net investment in-come during a certain period, divided bythe portfolio’s average value during the
same period. Total return is usually calcu-lated as net investment income plus or mi-nus realized and unrealized gains, dividedby the portfolio’s beginning market valueplus or minus the weighted average of ad-ditions or dispositions.
◆ Measures of profitability. Two broadermeasures of profitability that are applicableto life insurers are return on assets (ROA)and return on equity (ROE).
ROA is equal to net income divided byaverage total assets. A typical range of ROAsfor the life insurance industry is between0.6% and 0.9%, with the average some-where around 0.75%. This may appear lowrelative to other industries, but is due to thecapital-intensive nature of insurers’ business.
The productivity of “wholesalers” (internal sales-people who work with external distributors) is a differ-entiating metric. Recruitment and retention of highlyproductive wholesalers is important in sustaining astrong competitive position, but has become more diffi-cult recently as competition for wholesaler services hasintensified. Some companies have addressed thisthrough acquisitions, though history shows that differ-ences in corporate cultures can make integrating distri-bution channels a challenge.
◆ Risk management. Standard & Poor’s viewsstrong risk management capabilities as a necessityto address the ever-increasing product risk that isemerging in the sector. Furthermore, managementteams that deploy risk management techniques ef-fectively to measure risk across a spectrum of met-rics (primarily risk-adjusted return on capital) andtime horizons are more likely to introduce productsthat are profitable.
This is because insurance liabilities reflect expo-sure to interest rates and equity markets, both ofwhich are volatile. Standard & Poor’s believes thatthe more sophisticated risk managers will deploystochastic modeling techniques to better identify andmanage so-called “tail risks” — events, such as astock market crash that, while highly unlikely, couldbe devastating to life insurers.
While the organizational structure of a company’srisk management function is important, Standard &Poor’s believes successful risk management dependsmore on the people — that is, risk managers execut-ing the strategy. Similar to corporate governance andcontrols on asset/liability management, effective risk
management requires a tone that is set from the topof the organization.
Financial riskWhen assessing financial risk, we look at a com-
pany’s earnings stability and financial discipline.
◆ Earnings stability. The stability of a compa-ny’s earnings on a GAAP basis will continue to becritical for credit ratings. In particular, life insurersthat depend too heavily on the performance of equi-ty markets for earnings face the possibility of a rat-ings downgrade.
Companies that diversify their earnings streamswisely and rely less on a core line of business can avoidearnings volatility. Other things being equal, we look fa-vorably on companies with a healthy balance among un-derwriting, investment income, and fees, since diversesources of earnings help mitigate volatility.
◆ Financial discipline. Financial disciplinecontinues to be a key factor in our credit ratings oflife insurers, and one indicator of it is profitablegrowth. Focusing on market share is normally ashort-term strategy and contributes heavily to the in-stability of long-term operating performance.
Consistent capital management and the appropri-ate use of leverage also contribute to favorable creditratings. Making appropriate use of financial leverageby acquiring companies or distribution channels canbe a key differentiator, provided the company also in-tegrates the acquisition adequately. ■
— Kevin Ahern Credit Ratings Analyst, Life Insurance
SEP
TEM
BER
13,
200
7 /
INS
UR
AN
CE:
LIF
E &
HEA
LTH
IN
DU
STR
Y S
UR
VEY
28
Return on equity is calculated by dividingnet income by average shareholders’ equity.For the life insurance industry, ROE typicallyranges from 9% to 15%, with the averagesomewhere around 12% or 13%.
Liquidity
Liquidity is another necessary perfor-mance benchmark to consider when analyz-ing a life insurer, because the insurer must beable to pay policyholder claims promptly. Aninsurer’s sources of liquidity arise from un-derwriting cash flow, investment cash flow,and asset liquidation cash flow.
For the most part, underwriting cash flowtends to be positive for life insurers. Combin-ing this with the cash flow from investmentactivities, most insurers usually produce asubstantial, positive cash flow.
Another measure of liquidity is thequick ratio. This is calculated by dividingassets that can be quickly liquidated at rea-sonable cost (i.e., cash, trade receivables,and marketable securities), by current lia-bilities. Sometimes referred to as the acid-test ratio, the quick ratio is designed tomeasure an organization’s ability to pay allits current liabilities promptly without re-sorting to the more costly and potentiallyill-timed sales of long-term investments orassets. This ratio typically ranges from 9%to 11%. An insurer with a business mixthat contains mostly shorter-term obliga-tions would need to maintain a higherquick ratio — that is, greater liquidity —than one whose business mix is predomi-nantly longer-term obligations.
Leverage
For life insurers, leverage usually measuresthe extent to which a firm uses its capitalbase (policyholders’ surplus or shareholders’equity) to produce business. The ratio of pre-miums to surplus is a good gauge of lever-age. However, for an accurate picture ofleverage, premium equivalence also shouldbe included in this calculation. The ratio ofadjusted capital and surplus to liabilitiesgauges the relative strength of an insurer’scapital base compared with its obligations.This ratio — calculated as capital and sur-plus funds plus the asset valuation reserve,divided by total liabilities, excluding the asset
valuation reserve — typically ranges from8% to 10%.
Operating and GAAP earnings
Net income is calculated under generallyaccepted accounting principles (GAAP); butwhen life insurance companies report earn-ings, financial analysts tend to focus insteadon operating earnings (a non-GAAP account-ing measure of profitability). The main dri-vers of operating earnings consist of revenues(including insurance premiums and fees, ad-visory fees, and net investment income) andexpenses that are associated with benefits,underwriting, acquisitions, insurance, andcore business operations.
In comparison, GAAP net income alsomay include realized investment gains andlosses, the change in the fair value of the in-terest rate component of cross-currencyswaps, and certain nonrecurring items (mi-nus interest expense and taxes). Operatingearnings are often less volatile than net in-come, which permits trends to be more dis-cernible, and they exclude the impact ofrealized investment gains and losses, wheremanagement can have some discretion overthe timing of investment sales. ■

AAccccuummuullaattiioonn ppeerriioodd — The period during which an in-sured person makes premium payments on a life insur-ance policy; also, the time before the commencementof income payments under an annuity contract.
AAccttuuaarryy — A person in the profession of calculatingstatistical risks, premium levels, and other technicalaspects of insurance.
AAddjjuussttaabbllee lliiffee — A form of life insurance that allowschanges on the policy face amount, the amount ofpremium, the period of protection, and the length ofthe premium payment period.
AAddmmiinniissttrraattiivvee sseerrvviicceess oonnllyy ((AASSOO)) — Services — suchas actuarial work, benefit plan design, claims pro-cessing, financial advice, and report preparation —provided by an insurer to an employer or other eligi-ble group, which accepts the underwriting risk; alsoknown as self-insurance.
AAddmmiitttteedd aasssseettss — Assets that regulators include whendetermining an insurer’s financial condition. Admit-ted assets are usually those that have a high degreeof liquidity (i.e., can be converted easily into cash).
AAddmmiitttteedd ccoommppaannyy — An insurance company autho-rized and licensed to do business in a given state.
AAddvveerrssee sseelleeccttiioonn — The tendency of persons withpoorer-than-average risks to apply for or maintain in-surance coverage.
AAggeenntt — A person who acts as the representative of aninsurer to sell insurance policies.
AAnnnnuuiittyy — A contract providing income at regular in-tervals for a specified period, such as a set numberof years or the lifetime of the annuitant. Payouts foran annuity can be immediate or deferred, as well asfixed or variable, and premiums can be single, multi-ple, and/or flexible.
AAsssseett--lliiaabbiilliittyy mmaannaaggeemmeenntt ((AALLMM)) — The practice ofmatching the anticipated market value of assets tothat of the liabilities they support for differing marketenvironments, such as changes in interest rates.ALM is important for insurers, because relativechanges in asset and liability values can have signif-icant effects on surplus.
BBaannkk--oowwnneedd lliiffee iinnssuurraannccee ((BBOOLLII)) — Insurance pur-chased by a bank on the lives of its executives.The bank pays the premiums, is the beneficiary,and owns the cash value of the policies. Similar tocompany-owned life insurance (COLI), BOLI canbe used to finance employee benefits and aug-ment net income.
BBeenneeffiitt rraattiioo — The present value of total expected ex-cess payments over the life of the contract, dividedby the present value of total expected assessmentsover the life of the contract.
BBrrookkeerr — One who represents an insured in the solici-tation, negotiation, or procurement of insurance con-tracts. A broker also may be an agent of the insurerfor certain purposes such as policy delivery or pre-mium collection.
BBrrookkeerr--aaggeenntt — One acting as agent for a set of insur-ers and as broker in dealing with other insurers.
CCaappttiivvee iinnssuurreerr — An insurance organization, usuallyunadmitted, that a company establishes to insure itsown risks. (See Admitted company.)
CCaasshh ffllooww uunnddeerrwwrriittiinngg — The use of rating and premi-um collection techniques by insurance companies tomaximize interest earnings on premiums.
CCaasshh ssuurrrreennddeerr vvaalluuee — The amount of cash availableto a policyholder upon the voluntary termination of acash value life insurance policy before it becomespayable by death or maturity.
CCeeddee — To transfer to a reinsurer all or part of the insur-ance or reinsurance written by the ceding company.
CCooiinnssuurraannccee — An agreement whereby the insurer andanother party share all losses covered by a policy ata set proportion.
CCoommbbiinneedd rraattiioo — The sum of an expense ratio and aloss ratio, often under statutory accounting proce-dures. An underwriting profit occurs when the com-bined ratio is under 100%.
CCoommmmuuttaattiioonn — Typically, the exchange of installmentbenefits for a lump sum. Under some reinsurancetreaties, it refers to the estimation, payment, andcomplete discharge of all future obligations for rein-surance losses, regardless of the continuing natureof certain losses.
CCoommppaannyy--oowwnneedd lliiffee iinnssuurraannccee ((CCOOLLII)) — Insurancepurchased by a company on a group of its employ-ees, whereby the company pays the premiums, ownsthe cash value of the policies, and is the beneficiary.Often used to finance employee benefit expensesand increase corporate net income.
GLOSSARY
SEP
TEM
BER
13,
200
7 /
INS
UR
AN
CE:
LIF
E &
HEA
LTH
IN
DU
STR
Y S
UR
VEY
29

SEP
TEM
BER
13,
200
7 /
INS
UR
AN
CE:
LIF
E &
HEA
LTH
IN
DU
STR
Y S
UR
VEY
30
CCoonnvveennttiioonn ssttaatteemmeenntt — The uniform annual financialstatement required by all US insurance jurisdictionsas prescribed by the National Association of Insur-ance Commissioners. Convention statements areprepared using statutory (rather than GAAP) ac-counting methods. (See Generally accepted ac-counting principles.)
CCrreeddiitt iinnssuurraannccee — Insurance on a debtor in favor of acreditor to pay off the balance due on a loan in theevent of the death or disability of the debtor.
DDeeffeerrrreedd aaccqquuiissiittiioonn ccoosstt ((DDAACC)) — The capitalizedsales cost associated with acquiring new business,which is then amortized (expensed) over the term ofthe contract or service provided. DAC is a feature ofGAAP accounting, but not statutory accounting.
DDeemmuuttuuaalliizzaattiioonn — The process by which a mutual in-surance company converts to a stock insurancecompany. In the conversion process, the mutual in-surer offers policyholders cash or stock in the newcompany. The demutualized company may also makea public stock offering.
DDiirreecctt wwrriitttteenn pprreemmiiuumm — Premiums collected by an in-surer without an allowance for premiums ceded toreinsurers.
DDiissaabbiilliittyy bbeenneeffiitt — A feature of some life insurancepolicies that provides for the waiver of premiums ifthe policyholder becomes totally and permanentlydisabled; a monthly income payment is sometimesprovided as well.
DDiissaabbiilliittyy iinnccoommee iinnssuurraannccee — Health insurance thatprovides periodic payments to replace income, actu-ally or presumptively lost, when the insured is unableto work due to sickness or injury.
EEaarrnneedd pprreemmiiuumm — Portion of a premium for whichthe insurer has already provided protection for thepolicyholder.
EEmmbbeeddddeedd vvaalluuee — A conservative insurance valuationmethod commonly employed outside North America.It is calculated by adding a firm’s adjusted net assetvalue (ANAV) to the present value of expected futureprofits to the firm, or the value of business in force(VBIF); it excludes contributions from new businessgenerated beyond existing policies and contracts.
EEnnddoowwmmeenntt iinnssuurraannccee — Life insurance where the faceamount is payable to the insured at the end of the con-tract or to a beneficiary if the insured dies before then.
EEqquuiittyy--iinnddeexxeedd aannnnuuiittyy ((EEIIAA)) — An annuity offering a mini-mum guaranteed interest rate combined with an inter-est rate linked to a market index. Because of theguaranteed rate, EIAs have less market risk than vari-able annuities, with the potential to earn returns betterthan fixed annuities when the stock market is rising.
EExxppeennssee rraattiioo — The percentage of the premium dollardevoted to paying the expenses of the insurer otherthan losses, usually calculated on a statutory ac-counting basis.
FFaaccuullttaattiivvee rreeiinnssuurraannccee — Reinsurance covering onlyspecified individual risks.
FFiinnaanncciiaall ssttrreennggtthh rraattiinngg — An independent opinion fur-nished by a rating agency regarding an insurer’sability to meet its obligations to policyholders. An in-surer’s financial strength rating is often an importantmeasure used by consumers when comparing differ-ent insurance products.
FFiixxeedd aannnnuuiittyy — An annuity that provides a fixed pay-ment (usually a fixed rate of interest) that will bepaid on the principal deposited in the annuity.
FFrraatteerrnnaall iinnssuurraannccee — Insurance offered to a specialgroup of people, namely, members of a lodge or fra-ternal order.
GGeenneerraall aaccccoouunntt — An investment portfolio used by aninsurer for investment of premium income not attrib-uted to policyholder separate accounts.
GGeenneerraallllyy aacccceepptteedd aaccccoouunnttiinngg pprriinncciipplleess ((GGAAAAPP)) —An accounting method that, among other things, at-tempts to match a company’s income and expensesby prorating costs over an insurance policy’s as-sumed life. The GAAP method is employed in the au-dited financial statements of publicly heldcompanies. (See Statutory accounting.)
GGuuaarraanntteeeedd iinnvveessttmmeenntt ccoonnttrraacctt ((GGIICC)) — A product of-fered by life insurance companies that guarantees aspecified rate of return over the life of the contract.Corporations sometimes offer GICs as part of a401(k) plan.
GGuuaarraanntteeeedd mmiinniimmuumm ddeeaatthh bbeenneeffiitt ((GGMMDDBB)) — An op-tion offered with some variable life policies thatguarantees the death benefit irregardless of thecash value of the policy.
GGuuaarraanntteeeedd mmiinniimmuumm iinnccoommee bbeenneeffiitt ((GGMMIIBB)) — An op-tion offered with some variable annuities wherebythe annuitant is entitled to a particular minimum levelof annuity payments, even if the account value doesnot support that particular level of payments (e.g.,due to investment losses).
GGuuaarraanntteeeedd mmiinniimmuumm wwiitthhddrraawwaall bbeenneeffiitt ((GGMMWWBB)) — Anoption offered with some variable annuities that guar-antees annuity payments to be at least equal to the sumof all premiums paid, regardless of account value.
HHeeaalltthh ssaavviinnggss aaccccoouunntt ((HHSSAA)) — A tax-deductible sav-ings account associated with a high-deductible in-surance plan that may be used to pay current andfuture healthcare costs. Annual contributions arelimited, and unused balances roll over year to year.

SEP
TEM
BER
13,
200
7 /
INS
UR
AN
CE:
LIF
E &
HEA
LTH
IN
DU
STR
Y S
UR
VEY
31
IInnccuurrrreedd bbuutt nnoott rreeppoorrtteedd ((IIBBNNRR)) — Losses that haveoccurred during a stated period but have not yetbeen reported to the insurer.
IInnssuurraannccee eexxaammiinneerr — The representative of a stateinsurance department assigned to participate inan insurance company’s official audit.
IInnssuurraannccee iinn ffoorrccee — Insurance for which premiumsare being paid or have been fully paid. It refers to thetotal face value of a life insurer’s portfolio of busi-ness: in other words, the potential maximum claimagainst an insurer.
IInnvveessttmmeenntt rreesseerrvvee — An item in the balance sheet ofan insurance company that represents a settingaside of assets to compensate for a possible reduc-tion in the market value of securities owned by thecompany.
LLaappssee rraattiioo — The ratio of the number of contracts orpolicies lapsed during a specified period to the num-ber in force at the beginning of that period.
LLaappsseedd ppoolliiccyy — A policy terminated for nonpayment ofpremiums. This term is sometimes limited to termina-tion that happens before the policy has accumulateda cash value or other surrender value.
LLeeggaall rreesseerrvvee — The minimum reserve required to beestablished for a life insurance contract according tolocal law.
LLiivviinngg bbeenneeffiittss rriiddeerr — A rider attached to life insur-ance policies that provides long-term care benefitsor benefits for the terminally ill.
LLoonngg--tteerrmm ccaarree ((LLTTCC)) iinnssuurraannccee — A policy that reim-burses daily health and social service expenses in-curred when the insured is confined to a nursingcare facility.
LLoossss aaddjjuussttmmeenntt eexxppeennssee — The cost of adjusting lossesfor filed claims, excluding the amount of the loss itself.
LLoossss ddeevveellooppmmeenntt — The difference between theamount of losses initially estimated by an insurer andthe amount evaluated at a later date.
LLoossss rraattiioo — Losses divided by the premiums paid.
MMaarrkkeett ccoonndduucctt eexxaamm — An examination by state in-surance regulators of the business practices and op-erations of an insurer and its agents.
MMiilllliioonn DDoollllaarr RRoouunndd TTaabbllee — An association of life in-surance agents who qualify by selling $1 million ormore of life insurance coverage.
MMoorrbbiiddiittyy — The relative incidence of disease; oftenrefers to the ratio of incidence of sickness to the num-ber of people in a given group over a given time period.
MMoorrttaalliittyy rraattee — Relationship of the frequency of deathsof individual members of a group to the entire groupover a particular time period; also, the death rate result-ing from specific kinds of illness or disease.
MMoorrttaalliittyy ttaabbllee — A table showing the incidence ofdeath at specified ages.
MMuuttuuaall iinnssuurraannccee ccoommppaannyy — An insurance companythat has no capital stock, but is owned by its policy-holders, who also elect its governing body. Earningsof the mutual company belong to the policyholdersand may be distributed to them in the form of policydividends or reduced premiums.
NNeett iinntteerreesstt eeaarrnneedd — The interest earned by an insur-er on its investments, typically after investment ex-penses but before income taxes.
NNeett pprreemmiiuummss wwrriitttteenn — Premium income retained byinsurance companies, directly or through accept-ing reinsurance, less payments made for businessreinsured.
NNeeww mmoonneeyy yyiieelldd — The average investment yield on gen-eral account assets recently purchased by an insurer.
NNoonnppaarrttiicciippaattiinngg ppoolliiccyy — An insurance policy thatdoes not pay policy dividends. Premiums for nonpar-ticipating policies are usually lower than those forparticipating policies.
OOrrddiinnaarryy lliiffee iinnssuurraannccee — A whole life policy that re-quires premiums continuously as long as the insuredlives; also called straight life insurance.
PPaarrttiicciippaattiinngg ppoolliiccyy — An insurance policy that distrib-utes policy dividends by cash payments, reducedpremiums, or units of paid-up life insurance.
PPeerrmmaanneenntt lliiffee iinnssuurraannccee — A term loosely applied tolife insurance other than group and term; usually,cash value life insurance such as whole life.
PPeerrssiisstteennccyy — The tendency or likelihood of insurancebusiness not lapsing or being replaced by anotherinsurer’s product.
PPoolliiccyy ddiivviiddeenndd — The return of part of the premiumpaid for a policy issued on a participating basis.
PPoolliiccyy llooaann — A loan made by a life insurance companyfrom its general funds to a policyholder, using thepolicy’s cash value as security.
PPoorrttffoolliioo yyiieelldd — The average investment yield, exclud-ing realized and unrealized gains, on an insurer’sgeneral account assets.
PPrreemmiiuumm — The payment, or one of the periodic pay-ments, that a policyholder agrees to make for an in-surance policy.

SEP
TEM
BER
13,
200
7 /
INS
UR
AN
CE:
LIF
E &
HEA
LTH
IN
DU
STR
Y S
UR
VEY
32
RRaattee — The cost of a given unit of insurance; premiumis the rate multiplied by the number of units of insur-ance purchased.
RReeiinnssuurraannccee — The practice whereby a third party (thereinsurer) agrees to indemnify part or all of the liabil-ity from a policy underwritten by an insurance carri-er in return for the payment of a premium or otherconsideration.
RReesseerrvveess — Funds set aside to cover costs of claimsincurred but not yet fully settled; the amount mayrepresent both actual and potential liabilities.
RReettrroocceessssiioonn — The transaction whereby a reinsurercedes all or part of the reinsurance it assumed toanother reinsurer.
RRiiddeerr — A special provision or group of provisions thatmay be added to a policy to expand or to limit thebenefits otherwise payable.
RRiisskk--bbaasseedd ccaappiittaall — The amount of capital an insurerneeds to meet its obligations to policyholders. Stateregulatory bodies calculate risk-based capital levels,taking into account various types of risk, and com-pare them with companies’ actual capital.
SSeeppaarraattee aaccccoouunntt — An asset account established byan insurer and segregated from other funds; usedprimarily for pension plans and variable life products.This arrangement permits wider latitude in the insur-er’s investment choices, particularly in equities andreal estate.
SSttaattuuttoorryy aaccccoouunnttiinngg pprriinncciipplleess ((SSAAPP)) — An accountingformat used by state insurance regulators, SAP isessentially cash-oriented (rather than accrual-oriented, as GAAP is) and has such requirements asimmediately expensing all costs related to writingbusiness. More conservative than GAAP, which fo-cuses on profit growth, statutory accounting focuseson solvency — a firm’s ability to meet its obligations.
SSttoocckk iinnssuurraannccee ccoommppaannyy — An incorporated insur-ance company owned by its stockholders, who re-ceive profits in the form of stockholder dividends andwho elect a board to direct the firm’s management.
SSuurrpplluuss — The excess of assets over liabilities; surplusdetermines an insurer’s capacity to write businessand consists of surplus paid in by stockholders andsurplus earned through operations.
SSuurrrreennddeerr cchhaarrggee — A fee levied on a policyholderwhen a life insurance policy or annuity is surren-dered for its cash value prior to its maturity date orcontract termination date. Such fees are meant todiscourage early retirement of policies and annuitycontracts and are typically structured to recover thecosts an insurer undertook to write the policy, knownas the policy acquisition costs.
TTeerrmm iinnssuurraannccee — Life insurance payable to a benefi-ciary only when the insured dies within a specifictime period.
UUnnddeerrwwrriittiinngg pprrooffiitt//lloossss — Profits or losses resulting frominsurance activities, calculated on a statutory basis, ascontrasted with that realized from investments.
UUnniivveerrssaall lliiffee ((UULL)) — A combination flexible premium,adjustable life insurance policy. Universal variablelife (UVL) policies combine universal life insurancewith variable life features.
VVaarriiaabbllee aannnnuuiittyy ((VVAA)) — A type of annuity under whichthe amount of each benefit payment is not guaran-teed or specified in the contract. Rather, benefit pay-ments fluctuate depending on the investment resultsof the assets held in the account.
VVaarriiaabbllee lliiffee ((VVLL)) — Life insurance that is similar towhole life in that its premiums are fixed. The variableaspects are the death benefit and the cash surren-der value. The death benefit is based on the value ofassets behind the contract at the time the benefit ispaid, above a guaranteed minimum. The cash valueis similarly determined, but no minimum is guaran-teed. The assets underlying variable life policies’benefits are usually held in separate accounts.
VViiaattiiccaall sseettttlleemmeenntt — The sale to a third party of an exist-ing life insurance policy. The seller receives a cashpayment from the buyer, which generally exceeds thecash surrender value but is less than the net deathbenefit. The buyer then pays the remaining premiumsand receives the death benefit when the insured dies.Viatical settlements are also referred to as “life settle-ments,” predominantly in cases where the insured isolder with a life expectancy exceeding two years.
WWhhoollee lliiffee — Life insurance that may be kept in-forcefor a person’s whole life and pays a benefit upon theperson’s death. Premiums may be payable for aspecified number of years (limited payment life) orfor life (straight life), though typically only to age 100.(See Term insurance.)
WWiirreehhoouussee — A reference to the largest brokeragefirms; dates back to when only the largest brokershad branches receiving financial market data byhigh-speed communication (“wires”).
XXXXXX rreesseerrvveess — Reserves established by insurers forcertain secondary guarantees associated with poli-cies such as universal life and variable universal life.The term denotes National Association of InsuranceCommissioners (NAIC) Model Regulation XXX, whichestablished the need for these reserves.

INDUSTRY REFERENCES
SEP
TEM
BER
13,
200
7 /
INS
UR
AN
CE:
LIF
E &
HEA
LTH
IN
DU
STR
Y S
UR
VEY
33
PERIODICALS
BBeesstt’’ss RReevviieewwBBeessttWWeeeekkA.M. Best Co. Inc.Ambest Rd., Oldwick, NJ 08858(908) 439-2200Web sites: http://www.bestreview.comhttp://www.bestweek.comA monthly magazine and a weekly newsletter, respec-tively, covering issues in the life insurance industry.
IInnvveessttmmeennttNNeewwssCrain Communications Inc.711 Third Ave., 3rd Fl., New York, NY 10017(212) 210-0775Web site: http://www.investmentnews.comA weekly newsletter for investment advisers coveringthe entire financial services industry.
NNaattiioonnaall UUnnddeerrwwrriitteerr:: LLiiffee && HHeeaalltthh//FFiinnaanncciiaall SSeerrvviicceessEEddiittiioonnThe National Underwriter Co.33-41 Newark St., 2nd Fl., Hoboken, NJ 07030(800) 543-0874; (201) 526-1230Web site: http://www.nationalunderwriter.com/
lifeandhealthWeekly magazine; news and information on the life andhealth insurance and financial services industries.
PPeennssiioonnss aanndd IInnvveessttmmeennttssCrain Communications Inc.711 Third Ave., New York, NY 10017(212) 210-0751Web site: http://www.pionline.comBiweekly newsletter; concentrates on the professionalmoney management industry.
BOOKS
TThhee IInnssuurraannccee DDiiccttiioonnaarryy:: WWhhaatt MMeeaannss WWhhaatt WWhheenn IIttCCoommeess ttoo LLiiffee,, HHeeaalltthh,, BBuussiinneessss,, HHoommee,, AAuuttoo aanndd OOtthheerrCCoovveerraaggeessSilver Lake PublishingWeb site: http://www.silverlakepub.com/catalog/
product_info.php?cPath=45&products_id=110Easy-to-use reference book that includes comprehen-sive definitions, examples, and information on insur-ance words, phrases, and concepts.
REFERENCES
NNIILLSS IINNSSoouurrccee GGlloossssaarryyNILS Publishing Co., a unit of CCH Inc.Web site: http://insource.nils.com/gloss/gloss.aspNILS is a leading provider of insurance law and regula-tory information. The INSource Glossary is an online re-source that defines common insurance industry termsand provides a search link so that users can see howspecific states define the same term in certain areas oftheir legislation.
RESEARCH FIRMS
AAddvvaannttaaggee CCoommppeennddiiuummWeb site: http://www.indexannuity.orgProvides research and consulting services to select fi-nancial companies in all aspects of index annuities.Publishes the quarterly Advantage Index Product Sales& Market Report and the Index Compendium monthlynewsletter.
SSNNLL FFiinnaanncciiaall1 SNL Plaza, P.O. Box 2124, Charlottesville, VA 22902(434) 977-1600Web site: http://www.snl.comA comprehensive source for financial services industrydata and analysis.
SSppeeccttrreemm GGrroouupp641 W. Lake St., Ste. 402, Chicago, IL 60661(312) 382-8284Web site: http://www.spectrem.comConsulting firm specializing in the research and analy-sis of the affluent, ultrahigh–net worth, and retirementmarkets.
VVAARRDDSSMorningstar Inc.225 W. Wacker Dr., Chicago, IL 60606(312) 696-6000Web site: http://www.vards.comProvides sales tracking and product information forvariable annuities data; publishes The VARDS Report.
RATING AGENCIES
These agencies provide life/health insurer financialstrength ratings and reports; some also provide debtrating services.
AA..MM.. BBeesstt CCoo.. IInncc..Ambest Rd., Oldwick, NJ 08858(908) 439-2200Web site: http://www.ambest.com
FFiittcchh IInncc..1 State Street Plaza, New York, NY 10004(212) 908-0500Web site: http://www.fitchratings.com
MMooooddyy’’ss IInnvveessttoorrss SSeerrvviiccee IInncc..99 Church St., New York, NY 10007(212) 553-0376Web site: http://www.moodys.com
SSttaannddaarrdd && PPoooorr’’ssThe McGraw-Hill Companies Inc.55 Water St., New York, NY 10041(212) 438-2000Web site: http://www.standardandpoors.com

SEP
TEM
BER
13,
200
7 /
INS
UR
AN
CE:
LIF
E &
HEA
LTH
IN
DU
STR
Y S
UR
VEY
34
WWeeiissss RRaattiinnggss IInncc..15430 Endeavour Dr., Jupiter, FL 33478(561) 627-4400Web site: http://www.weissratings.com
TRADE ASSOCIATIONS
AAmmeerriiccaann CCoouunncciill ooff LLiiffee IInnssuurreerrss ((AACCLLII))101 Constitution Ave. NW, Washington, DC 20001(202) 624-2418Web site: http://www.acli.comPublishes the Life Insurance Fact Book, an annual com-pilation of life insurance statistics.
AAmmeerriiccaa’’ss HHeeaalltthh IInnssuurraannccee PPllaannss601 Pennsylvania Ave. NW, South Bldg., Ste. 500Washington, DC 20004(202) 778-3200Web site: http://www.ahip.orgPublishes information and conducts conferences on awide range of issues affecting the health insurance industry.
BBaannkk IInnssuurraannccee aanndd SSeeccuurriittiieess AAssssoocciiaattiioonn303 W. Lancaster Ave., Ste. 2D, Wayne, PA 19087(610) 989-9047Web site: http://www.bisanet.orgPublishes data on insurance and annuity products mar-keted by banks and thrifts.
IInnvveessttmmeenntt CCoommppaannyy IInnssttiittuuttee1401 H St. NW, Washington, DC 20005(202) 326-5890Web site: http://www.ici.orgPublishes statistics on open-end and closed-end mutu-al funds and unit investment trusts.
LLIIMMRRAA IInntteerrnnaattiioonnaall300 Day Hill Rd., Windsor, CT 06095(860) 688-3358Web site: http://www.limra.comProvides research, consulting, and other services tocompanies marketing annuity, disability, health, life, mu-tual fund, and retirement savings products.
NNaattiioonnaall AAssssoocciiaattiioonn ffoorr VVaarriiaabbllee AAnnnnuuiittiieess ((NNAAVVAA))11710 Plaza America Dr., Ste. 100, Reston, VA 20190(703) 707-8830Web site: http://www.navanet.orgPublishes information and conducts conferences on thevariable annuity and variable life insurance industries.
NNaattiioonnaall AAssssoocciiaattiioonn ooff HHeeaalltthh UUnnddeerrwwrriitteerrss2000 N. 14th St., Ste. 450, Arlington, VA 22201(703) 276-0220Web site: http://www.nahu.orgPublishes Belth’s Annual Carrier Ratings Report, whichprovides facts about all US life and health carriers, andinformation on the financial strength of each.
NNaattiioonnaall AAssssoocciiaattiioonn ooff IInnssuurraannccee CCoommmmiissssiioonneerrss((NNAAIICC))2301 McGee St., Ste. 800, Kansas City, MO 64108(816) 842-3600Web site: http://www.naic.orgPublishes information on issues relevant to both thelife-and-health and property-casualty segments of theinsurance industry.
SSoocciieettyy ooff PPrrooffeessssiioonnaall AAddmmiinniissttrraattoorrss aannddRReeccoorrddkkeeeeppeerrss ((SSPPAARRKK))RG Wuelfing & Associates714 Hopmeadow St., Ste. 3, Simsbury, CT 06070(860) 658-5058Web site: http://www.rgwuelfing.comPublishes the annual Marketplace Update Report, astudy of the 401(k) market.
SSttaabbllee VVaalluuee IInnvveessttmmeenntt AAssssoocciiaattiioonn1025 Connecticut Ave. NW, Ste. 1000,Washington, DC 20036(202) 580-7620Web site: http://www.stablevalue.orgPublishes a newsletter, technical papers, and informa-tion regarding stable value products, such as guaran-teed investment contracts (GICS).

Operating revenuesNet sales and other operating revenues. Excludesinterest income if such income is “nonoperating.”Includes franchised/leased department income forretailers and royalties for publishers and oil and miningcompanies. Excludes excise taxes for tobacco, liquor,and oil companies.
Net incomeProfits derived from all sources, after deductions ofexpenses, taxes, and fixed charges, but before anydiscontinued operations, extraordinary items, anddividend payments (preferred and common).
Return on revenues Net income divided by operating revenues.
Return on assets Net income divided by average total assets. Used inindustry analysis and as a measure of asset-use efficiency.
Return on equity Net income, less preferred dividend requirements,divided by average common shareholder‘s equity.Generally used to measure performance and to makeindustry comparisons.
Current ratioCurrent assets divided by current liabilities. It is ameasure of liquidity. Current assets are those assetsexpected to be realized in cash or used up in theproduction of revenue within one year. Current liabilitiesgenerally include all debts/obligations falling due withinone year.
Debt/capital ratioLong-term debt (excluding current portion) divided bytotal invested capital. It indicates how highly “leveraged”a company might be. Long-term debt includes thosedebts/obligations due after one year, including bonds,notes payable, mortgages, lease obligations, andindustrial revenue bonds. Other long-term debt, whenreported as a separate account, is excluded; this accountgenerally includes pension and retirement benefits. Totalinvested capital is the sum of stockholders’ equity, long-term debt, capital lease obligations, deferred incometaxes, investment credits, and minority interest.
Debt as a percent of net working capitalLong-term debt (excluding current portion) divided by thedifference between current assets and current liabilities.It is an indicator of a company’s liquidity.
Price/earnings ratio The ratio of market price to earnings, obtained bydividing the stock’s high and low market price for theyear by earnings per share (before extraordinary items).It essentially indicates the value investors place on acompany’s earnings.
Dividend payout ratioThis is the percentage of earnings paid out in dividends.It is calculated by dividing the annual dividend by theearnings. Dividends are generally total cash paymentsper share over a 12-month period. Although payments areusually calculated from the ex-dividend dates, they mayalso be reported on a declared basis where this has beenestablished to be a company’s payout policy.
Dividend yield The total cash dividend payments divided by the year’shigh and low market prices for the stock.
Earnings per shareThe amount a company reports as having been earnedfor the year (based on generally accepted accountingstandards), divided by the number of shares outstanding.Amounts reported in Industry Surveys excludeextraordinary items.
Tangible book value per shareThis measure indicates the theoretical dollar amount per common share one might expect to receive shouldliquidation take place. Generally, book value isdetermined by adding the stated (or par) value of thecommon stock, paid-in capital, and retained earnings,then subtracting intangible assets, preferred stock atliquidating value, and unamortized debt discount. Thisamount is divided by the number of outstanding shares to get book value per common share.
Share price This shows the calendar-year high and low of a stock’smarket price.
In addition to the footnotes that appear at the bottom ofeach page, you will notice some or all of the following:NA—Not available.NM—Not meaningful.NR—Not reported.AF—Annual figure. Data are presented on an annualbasis.CF—Combined figure. In this case, data are not availablebecause one or more components are combined withother items.
DEFINITIONS FOR COMPARATIVE COMPANY ANALYSIS TABLES
SEP
TEM
BER
13,
200
7 /
INS
UR
AN
CE:
LIF
E &
HEA
LTH
IN
DU
STR
Y S
UR
VEY
35
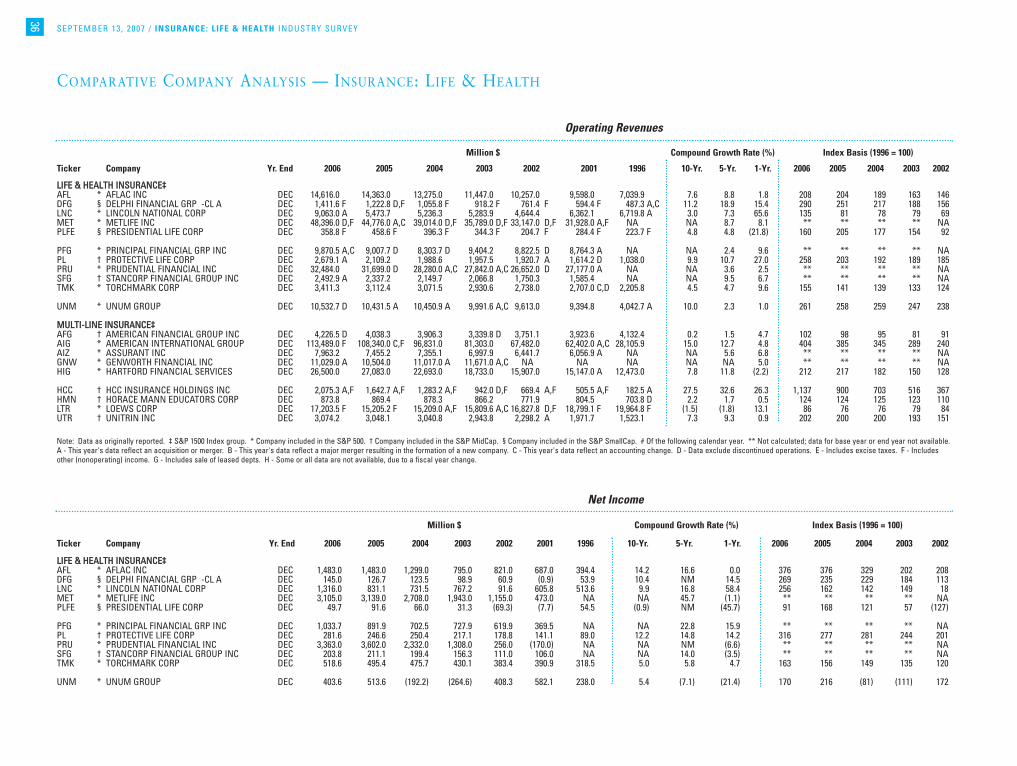
SEPTEMBER 13 , 2007 / INSURANCE: L IFE & HEALTH INDUSTRY SURVEY
36
COMPARATIVE COMPANY ANALYSIS — INSURANCE: LIFE & HEALTH
LLIIFFEE && HHEEAALLTTHH IINNSSUURRAANNCCEE‡‡AFL * AFLAC INC DEC 14,616.0 14,363.0 13,275.0 11,447.0 10,257.0 9,598.0 7,039.9 7.6 8.8 1.8 208 204 189 163 146 DFG § DELPHI FINANCIAL GRP -CL A DEC 1,411.6 F 1,222.8 D,F 1,055.8 F 918.2 F 761.4 F 594.4 F 487.3 A,C 11.2 18.9 15.4 290 251 217 188 156 LNC * LINCOLN NATIONAL CORP DEC 9,063.0 A 5,473.7 5,236.3 5,283.9 4,644.4 6,362.1 6,719.8 A 3.0 7.3 65.6 135 81 78 79 69 MET * METLIFE INC DEC 48,396.0 D,F 44,776.0 A,C 39,014.0 D,F 35,789.0 D,F 33,147.0 D,F 31,928.0 A,F NA NA 8.7 8.1 ** ** ** ** NAPLFE § PRESIDENTIAL LIFE CORP DEC 358.8 F 458.6 F 396.3 F 344.3 F 204.7 F 284.4 F 223.7 F 4.8 4.8 (21.8) 160 205 177 154 92
PFG * PRINCIPAL FINANCIAL GRP INC DEC 9,870.5 A,C 9,007.7 D 8,303.7 D 9,404.2 8,822.5 D 8,764.3 A NA NA 2.4 9.6 ** ** ** ** NAPL † PROTECTIVE LIFE CORP DEC 2,679.1 A 2,109.2 1,988.6 1,957.5 1,920.7 A 1,614.2 D 1,038.0 9.9 10.7 27.0 258 203 192 189 185 PRU * PRUDENTIAL FINANCIAL INC DEC 32,484.0 31,699.0 D 28,280.0 A,C 27,842.0 A,C 26,652.0 D 27,177.0 A NA NA 3.6 2.5 ** ** ** ** NASFG † STANCORP FINANCIAL GROUP INC DEC 2,492.9 A 2,337.2 2,149.7 2,066.8 1,750.3 1,585.4 NA NA 9.5 6.7 ** ** ** ** NATMK * TORCHMARK CORP DEC 3,411.3 3,112.4 3,071.5 2,930.6 2,738.0 2,707.0 C,D 2,205.8 4.5 4.7 9.6 155 141 139 133 124
UNM * UNUM GROUP DEC 10,532.7 D 10,431.5 A 10,450.9 A 9,991.6 A,C 9,613.0 9,394.8 4,042.7 A 10.0 2.3 1.0 261 258 259 247 238
MMUULLTTII--LLIINNEE IINNSSUURRAANNCCEE‡‡AFG † AMERICAN FINANCIAL GROUP INC DEC 4,226.5 D 4,038.3 3,906.3 3,339.8 D 3,751.1 3,923.6 4,132.4 0.2 1.5 4.7 102 98 95 81 91 AIG * AMERICAN INTERNATIONAL GROUP DEC 113,489.0 F 108,340.0 C,F 96,831.0 81,303.0 67,482.0 62,402.0 A,C 28,105.9 15.0 12.7 4.8 404 385 345 289 240 AIZ * ASSURANT INC DEC 7,963.2 7,455.2 7,355.1 6,997.9 6,441.7 6,056.9 A NA NA 5.6 6.8 ** ** ** ** NAGNW * GENWORTH FINANCIAL INC DEC 11,029.0 A 10,504.0 11,017.0 A 11,671.0 A,C NA NA NA NA NA 5.0 ** ** ** ** NAHIG * HARTFORD FINANCIAL SERVICES DEC 26,500.0 27,083.0 22,693.0 18,733.0 15,907.0 15,147.0 A 12,473.0 7.8 11.8 (2.2) 212 217 182 150 128
HCC † HCC INSURANCE HOLDINGS INC DEC 2,075.3 A,F 1,642.7 A,F 1,283.2 A,F 942.0 D,F 669.4 A,F 505.5 A,F 182.5 A 27.5 32.6 26.3 1,137 900 703 516 367 HMN † HORACE MANN EDUCATORS CORP DEC 873.8 869.4 878.3 866.2 771.9 804.5 703.8 D 2.2 1.7 0.5 124 124 125 123 110 LTR * LOEWS CORP DEC 17,203.5 F 15,205.2 F 15,209.0 A,F 15,809.6 A,C 16,827.8 D,F 18,799.1 F 19,964.8 F (1.5) (1.8) 13.1 86 76 76 79 84 UTR † UNITRIN INC DEC 3,074.2 3,048.1 3,040.8 2,943.8 2,298.2 A 1,971.7 1,523.1 7.3 9.3 0.9 202 200 200 193 151
Operating Revenues
Million $ Compound Growth Rate (%) Index Basis (1996 = 100)
Note: Data as originally reported. ‡ S&P 1500 Index group. * Company included in the S&P 500. † Company included in the S&P MidCap. § Company included in the S&P SmallCap. # Of the following calendar year. ** Not calculated; data for base year or end year not available.A - This year's data reflect an acquisition or merger. B - This year's data reflect a major merger resulting in the formation of a new company. C - This year's data reflect an accounting change. D - Data exclude discontinued operations. E - Includes excise taxes. F - Includesother (nonoperating) income. G - Includes sale of leased depts. H - Some or all data are not available, due to a fiscal year change.
Ticker Company Yr. End 2006 2005 2004 2003 2002 2001 1996 10-Yr. 5-Yr. 1-Yr. 2006 2005 2004 2003 2002
LLIIFFEE && HHEEAALLTTHH IINNSSUURRAANNCCEE‡‡AFL * AFLAC INC DEC 1,483.0 1,483.0 1,299.0 795.0 821.0 687.0 394.4 14.2 16.6 0.0 376 376 329 202 208 DFG § DELPHI FINANCIAL GRP -CL A DEC 145.0 126.7 123.5 98.9 60.9 (0.9) 53.9 10.4 NM 14.5 269 235 229 184 113 LNC * LINCOLN NATIONAL CORP DEC 1,316.0 831.1 731.5 767.2 91.6 605.8 513.6 9.9 16.8 58.4 256 162 142 149 18 MET * METLIFE INC DEC 3,105.0 3,139.0 2,708.0 1,943.0 1,155.0 473.0 NA NA 45.7 (1.1) ** ** ** ** NAPLFE § PRESIDENTIAL LIFE CORP DEC 49.7 91.6 66.0 31.3 (69.3) (7.7) 54.5 (0.9) NM (45.7) 91 168 121 57 (127)
PFG * PRINCIPAL FINANCIAL GRP INC DEC 1,033.7 891.9 702.5 727.9 619.9 369.5 NA NA 22.8 15.9 ** ** ** ** NAPL † PROTECTIVE LIFE CORP DEC 281.6 246.6 250.4 217.1 178.8 141.1 89.0 12.2 14.8 14.2 316 277 281 244 201 PRU * PRUDENTIAL FINANCIAL INC DEC 3,363.0 3,602.0 2,332.0 1,308.0 256.0 (170.0) NA NA NM (6.6) ** ** ** ** NASFG † STANCORP FINANCIAL GROUP INC DEC 203.8 211.1 199.4 156.3 111.0 106.0 NA NA 14.0 (3.5) ** ** ** ** NATMK * TORCHMARK CORP DEC 518.6 495.4 475.7 430.1 383.4 390.9 318.5 5.0 5.8 4.7 163 156 149 135 120
UNM * UNUM GROUP DEC 403.6 513.6 (192.2) (264.6) 408.3 582.1 238.0 5.4 (7.1) (21.4) 170 216 (81) (111) 172
Net Income
Million $ Compound Growth Rate (%) Index Basis (1996 = 100)
Ticker Company Yr. End 2006 2005 2004 2003 2002 2001 1996 10-Yr. 5-Yr. 1-Yr. 2006 2005 2004 2003 2002
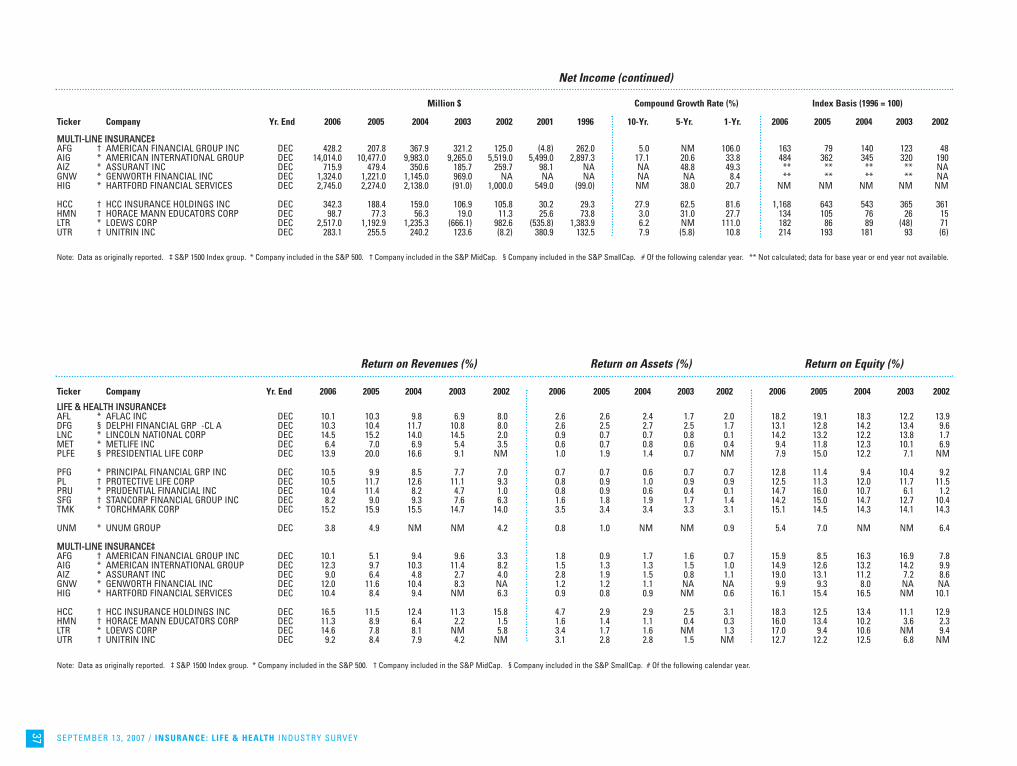
SEPTEMBER 13 , 2007 / INSURANCE: L IFE & HEALTH INDUSTRY SURVEY
37
MMUULLTTII--LLIINNEE IINNSSUURRAANNCCEE‡‡AFG † AMERICAN FINANCIAL GROUP INC DEC 428.2 207.8 367.9 321.2 125.0 (4.8) 262.0 5.0 NM 106.0 163 79 140 123 48 AIG * AMERICAN INTERNATIONAL GROUP DEC 14,014.0 10,477.0 9,983.0 9,265.0 5,519.0 5,499.0 2,897.3 17.1 20.6 33.8 484 362 345 320 190 AIZ * ASSURANT INC DEC 715.9 479.4 350.6 185.7 259.7 98.1 NA NA 48.8 49.3 ** ** ** ** NAGNW * GENWORTH FINANCIAL INC DEC 1,324.0 1,221.0 1,145.0 969.0 NA NA NA NA NA 8.4 ** ** ** ** NAHIG * HARTFORD FINANCIAL SERVICES DEC 2,745.0 2,274.0 2,138.0 (91.0) 1,000.0 549.0 (99.0) NM 38.0 20.7 NM NM NM NM NM
HCC † HCC INSURANCE HOLDINGS INC DEC 342.3 188.4 159.0 106.9 105.8 30.2 29.3 27.9 62.5 81.6 1,168 643 543 365 361 HMN † HORACE MANN EDUCATORS CORP DEC 98.7 77.3 56.3 19.0 11.3 25.6 73.8 3.0 31.0 27.7 134 105 76 26 15 LTR * LOEWS CORP DEC 2,517.0 1,192.9 1,235.3 (666.1) 982.6 (535.8) 1,383.9 6.2 NM 111.0 182 86 89 (48) 71 UTR † UNITRIN INC DEC 283.1 255.5 240.2 123.6 (8.2) 380.9 132.5 7.9 (5.8) 10.8 214 193 181 93 (6)
Net Income (continued)
Million $ Compound Growth Rate (%) Index Basis (1996 = 100)
Ticker Company Yr. End 2006 2005 2004 2003 2002 2001 1996 10-Yr. 5-Yr. 1-Yr. 2006 2005 2004 2003 2002
Note: Data as originally reported. ‡ S&P 1500 Index group. * Company included in the S&P 500. † Company included in the S&P MidCap. § Company included in the S&P SmallCap. # Of the following calendar year. ** Not calculated; data for base year or end year not available.
Return on Revenues (%) Return on Assets (%) Return on Equity (%)
Ticker Company Yr. End 2006 2005 2004 2003 2002 2006 2005 2004 2003 2002 2006 2005 2004 2003 2002
LLIIFFEE && HHEEAALLTTHH IINNSSUURRAANNCCEE‡‡AFL * AFLAC INC DEC 10.1 10.3 9.8 6.9 8.0 2.6 2.6 2.4 1.7 2.0 18.2 19.1 18.3 12.2 13.9DFG § DELPHI FINANCIAL GRP -CL A DEC 10.3 10.4 11.7 10.8 8.0 2.6 2.5 2.7 2.5 1.7 13.1 12.8 14.2 13.4 9.6LNC * LINCOLN NATIONAL CORP DEC 14.5 15.2 14.0 14.5 2.0 0.9 0.7 0.7 0.8 0.1 14.2 13.2 12.2 13.8 1.7MET * METLIFE INC DEC 6.4 7.0 6.9 5.4 3.5 0.6 0.7 0.8 0.6 0.4 9.4 11.8 12.3 10.1 6.9PLFE § PRESIDENTIAL LIFE CORP DEC 13.9 20.0 16.6 9.1 NM 1.0 1.9 1.4 0.7 NM 7.9 15.0 12.2 7.1 NM
PFG * PRINCIPAL FINANCIAL GRP INC DEC 10.5 9.9 8.5 7.7 7.0 0.7 0.7 0.6 0.7 0.7 12.8 11.4 9.4 10.4 9.2PL † PROTECTIVE LIFE CORP DEC 10.5 11.7 12.6 11.1 9.3 0.8 0.9 1.0 0.9 0.9 12.5 11.3 12.0 11.7 11.5PRU * PRUDENTIAL FINANCIAL INC DEC 10.4 11.4 8.2 4.7 1.0 0.8 0.9 0.6 0.4 0.1 14.7 16.0 10.7 6.1 1.2SFG † STANCORP FINANCIAL GROUP INC DEC 8.2 9.0 9.3 7.6 6.3 1.6 1.8 1.9 1.7 1.4 14.2 15.0 14.7 12.7 10.4TMK * TORCHMARK CORP DEC 15.2 15.9 15.5 14.7 14.0 3.5 3.4 3.4 3.3 3.1 15.1 14.5 14.3 14.1 14.3
UNM * UNUM GROUP DEC 3.8 4.9 NM NM 4.2 0.8 1.0 NM NM 0.9 5.4 7.0 NM NM 6.4
MMUULLTTII--LLIINNEE IINNSSUURRAANNCCEE‡‡AFG † AMERICAN FINANCIAL GROUP INC DEC 10.1 5.1 9.4 9.6 3.3 1.8 0.9 1.7 1.6 0.7 15.9 8.5 16.3 16.9 7.8AIG * AMERICAN INTERNATIONAL GROUP DEC 12.3 9.7 10.3 11.4 8.2 1.5 1.3 1.3 1.5 1.0 14.9 12.6 13.2 14.2 9.9AIZ * ASSURANT INC DEC 9.0 6.4 4.8 2.7 4.0 2.8 1.9 1.5 0.8 1.1 19.0 13.1 11.2 7.2 8.6GNW * GENWORTH FINANCIAL INC DEC 12.0 11.6 10.4 8.3 NA 1.2 1.2 1.1 NA NA 9.9 9.3 8.0 NA NAHIG * HARTFORD FINANCIAL SERVICES DEC 10.4 8.4 9.4 NM 6.3 0.9 0.8 0.9 NM 0.6 16.1 15.4 16.5 NM 10.1
HCC † HCC INSURANCE HOLDINGS INC DEC 16.5 11.5 12.4 11.3 15.8 4.7 2.9 2.9 2.5 3.1 18.3 12.5 13.4 11.1 12.9HMN † HORACE MANN EDUCATORS CORP DEC 11.3 8.9 6.4 2.2 1.5 1.6 1.4 1.1 0.4 0.3 16.0 13.4 10.2 3.6 2.3LTR * LOEWS CORP DEC 14.6 7.8 8.1 NM 5.8 3.4 1.7 1.6 NM 1.3 17.0 9.4 10.6 NM 9.4UTR † UNITRIN INC DEC 9.2 8.4 7.9 4.2 NM 3.1 2.8 2.8 1.5 NM 12.7 12.2 12.5 6.8 NM
Note: Data as originally reported. ‡ S&P 1500 Index group. * Company included in the S&P 500. † Company included in the S&P MidCap. § Company included in the S&P SmallCap. # Of the following calendar year.
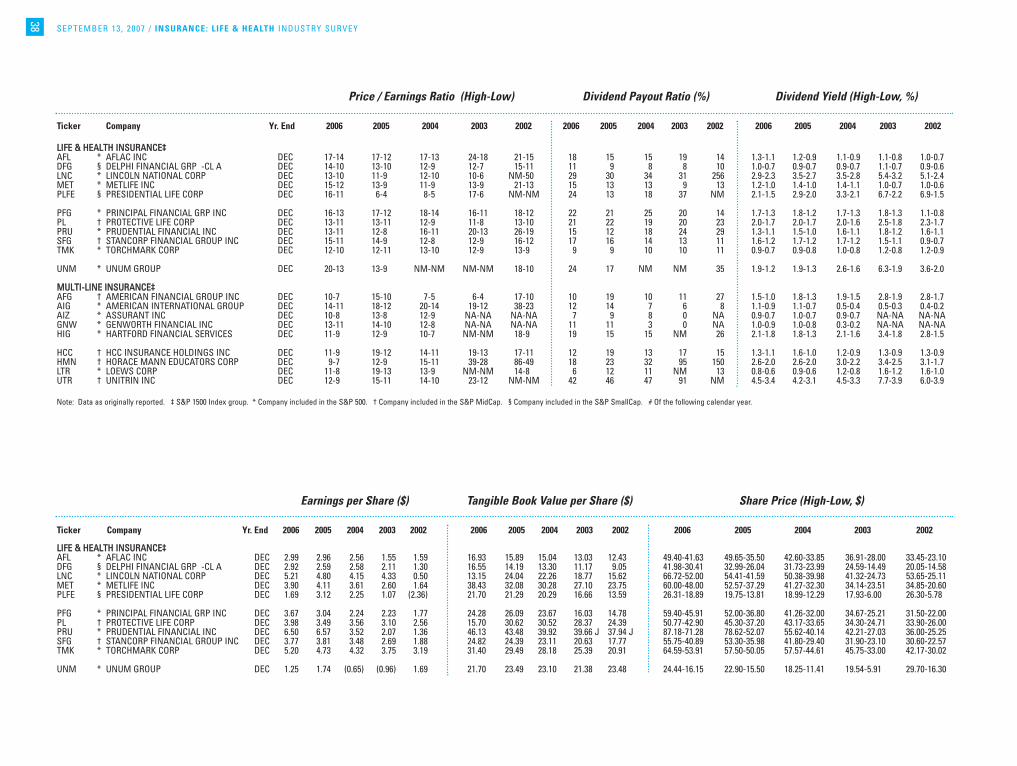
SEPTEMBER 13 , 2007 / INSURANCE: L IFE & HEALTH INDUSTRY SURVEY
38
Price / Earnings Ratio (High-Low) Dividend Payout Ratio (%) Dividend Yield (High-Low, %)
LLIIFFEE && HHEEAALLTTHH IINNSSUURRAANNCCEE‡‡AFL * AFLAC INC DEC 17-14 17-12 17-13 24-18 21-15 18 15 15 19 14 1.3-1.1 1.2-0.9 1.1-0.9 1.1-0.8 1.0-0.7DFG § DELPHI FINANCIAL GRP -CL A DEC 14-10 13-10 12-9 12-7 15-11 11 9 8 8 10 1.0-0.7 0.9-0.7 0.9-0.7 1.1-0.7 0.9-0.6LNC * LINCOLN NATIONAL CORP DEC 13-10 11-9 12-10 10-6 NM-50 29 30 34 31 256 2.9-2.3 3.5-2.7 3.5-2.8 5.4-3.2 5.1-2.4MET * METLIFE INC DEC 15-12 13-9 11-9 13-9 21-13 15 13 13 9 13 1.2-1.0 1.4-1.0 1.4-1.1 1.0-0.7 1.0-0.6PLFE § PRESIDENTIAL LIFE CORP DEC 16-11 6-4 8-5 17-6 NM-NM 24 13 18 37 NM 2.1-1.5 2.9-2.0 3.3-2.1 6.7-2.2 6.9-1.5
PFG * PRINCIPAL FINANCIAL GRP INC DEC 16-13 17-12 18-14 16-11 18-12 22 21 25 20 14 1.7-1.3 1.8-1.2 1.7-1.3 1.8-1.3 1.1-0.8PL † PROTECTIVE LIFE CORP DEC 13-11 13-11 12-9 11-8 13-10 21 22 19 20 23 2.0-1.7 2.0-1.7 2.0-1.6 2.5-1.8 2.3-1.7PRU * PRUDENTIAL FINANCIAL INC DEC 13-11 12-8 16-11 20-13 26-19 15 12 18 24 29 1.3-1.1 1.5-1.0 1.6-1.1 1.8-1.2 1.6-1.1SFG † STANCORP FINANCIAL GROUP INC DEC 15-11 14-9 12-8 12-9 16-12 17 16 14 13 11 1.6-1.2 1.7-1.2 1.7-1.2 1.5-1.1 0.9-0.7TMK * TORCHMARK CORP DEC 12-10 12-11 13-10 12-9 13-9 9 9 10 10 11 0.9-0.7 0.9-0.8 1.0-0.8 1.2-0.8 1.2-0.9
UNM * UNUM GROUP DEC 20-13 13-9 NM-NM NM-NM 18-10 24 17 NM NM 35 1.9-1.2 1.9-1.3 2.6-1.6 6.3-1.9 3.6-2.0
MMUULLTTII--LLIINNEE IINNSSUURRAANNCCEE‡‡AFG † AMERICAN FINANCIAL GROUP INC DEC 10-7 15-10 7-5 6-4 17-10 10 19 10 11 27 1.5-1.0 1.8-1.3 1.9-1.5 2.8-1.9 2.8-1.7AIG * AMERICAN INTERNATIONAL GROUP DEC 14-11 18-12 20-14 19-12 38-23 12 14 7 6 8 1.1-0.9 1.1-0.7 0.5-0.4 0.5-0.3 0.4-0.2AIZ * ASSURANT INC DEC 10-8 13-8 12-9 NA-NA NA-NA 7 9 8 0 NA 0.9-0.7 1.0-0.7 0.9-0.7 NA-NA NA-NAGNW * GENWORTH FINANCIAL INC DEC 13-11 14-10 12-8 NA-NA NA-NA 11 11 3 0 NA 1.0-0.9 1.0-0.8 0.3-0.2 NA-NA NA-NAHIG * HARTFORD FINANCIAL SERVICES DEC 11-9 12-9 10-7 NM-NM 18-9 19 15 15 NM 26 2.1-1.8 1.8-1.3 2.1-1.6 3.4-1.8 2.8-1.5
HCC † HCC INSURANCE HOLDINGS INC DEC 11-9 19-12 14-11 19-13 17-11 12 19 13 17 15 1.3-1.1 1.6-1.0 1.2-0.9 1.3-0.9 1.3-0.9HMN † HORACE MANN EDUCATORS CORP DEC 9-7 12-9 15-11 39-28 86-49 18 23 32 95 150 2.6-2.0 2.6-2.0 3.0-2.2 3.4-2.5 3.1-1.7LTR * LOEWS CORP DEC 11-8 19-13 13-9 NM-NM 14-8 6 12 11 NM 13 0.8-0.6 0.9-0.6 1.2-0.8 1.6-1.2 1.6-1.0UTR † UNITRIN INC DEC 12-9 15-11 14-10 23-12 NM-NM 42 46 47 91 NM 4.5-3.4 4.2-3.1 4.5-3.3 7.7-3.9 6.0-3.9
Ticker Company Yr. End 2006 2005 2004 2003 2002 2006 2005 2004 2003 2002 2006 2005 2004 2003 2002
Note: Data as originally reported. ‡ S&P 1500 Index group. * Company included in the S&P 500. † Company included in the S&P MidCap. § Company included in the S&P SmallCap. # Of the following calendar year.
Earnings per Share ($) Tangible Book Value per Share ($) Share Price (High-Low, $)
LLIIFFEE && HHEEAALLTTHH IINNSSUURRAANNCCEE‡‡AFL * AFLAC INC DEC 2.99 2.96 2.56 1.55 1.59 16.93 15.89 15.04 13.03 12.43 49.40-41.63 49.65-35.50 42.60-33.85 36.91-28.00 33.45-23.10DFG § DELPHI FINANCIAL GRP -CL A DEC 2.92 2.59 2.58 2.11 1.30 16.55 14.19 13.30 11.17 9.05 41.98-30.41 32.99-26.04 31.73-23.99 24.59-14.49 20.05-14.58LNC * LINCOLN NATIONAL CORP DEC 5.21 4.80 4.15 4.33 0.50 13.15 24.04 22.26 18.77 15.62 66.72-52.00 54.41-41.59 50.38-39.98 41.32-24.73 53.65-25.11MET * METLIFE INC DEC 3.90 4.11 3.61 2.60 1.64 38.43 32.08 30.28 27.10 23.75 60.00-48.00 52.57-37.29 41.27-32.30 34.14-23.51 34.85-20.60PLFE § PRESIDENTIAL LIFE CORP DEC 1.69 3.12 2.25 1.07 (2.36) 21.70 21.29 20.29 16.66 13.59 26.31-18.89 19.75-13.81 18.99-12.29 17.93-6.00 26.30-5.78
PFG * PRINCIPAL FINANCIAL GRP INC DEC 3.67 3.04 2.24 2.23 1.77 24.28 26.09 23.67 16.03 14.78 59.40-45.91 52.00-36.80 41.26-32.00 34.67-25.21 31.50-22.00PL † PROTECTIVE LIFE CORP DEC 3.98 3.49 3.56 3.10 2.56 15.70 30.62 30.52 28.37 24.39 50.77-42.90 45.30-37.20 43.17-33.65 34.30-24.71 33.90-26.00PRU * PRUDENTIAL FINANCIAL INC DEC 6.50 6.57 3.52 2.07 1.36 46.13 43.48 39.92 39.66 J 37.94 J 87.18-71.28 78.62-52.07 55.62-40.14 42.21-27.03 36.00-25.25SFG † STANCORP FINANCIAL GROUP INC DEC 3.77 3.81 3.48 2.69 1.88 24.82 24.39 23.11 20.63 17.77 55.75-40.89 53.30-35.98 41.80-29.40 31.90-23.10 30.60-22.57TMK * TORCHMARK CORP DEC 5.20 4.73 4.32 3.75 3.19 31.40 29.49 28.18 25.39 20.91 64.59-53.91 57.50-50.05 57.57-44.61 45.75-33.00 42.17-30.02
UNM * UNUM GROUP DEC 1.25 1.74 (0.65) (0.96) 1.69 21.70 23.49 23.10 21.38 23.48 24.44-16.15 22.90-15.50 18.25-11.41 19.54-5.91 29.70-16.30
Ticker Company Yr. End 2006 2005 2004 2003 2002 2006 2005 2004 2003 2002 2006 2005 2004 2003 2002
SEPTEMBER 13 , 2007 / INSURANCE: L IFE & HEALTH INDUSTRY SURVEY
39
The analysis and opinion set forth in this publication are provided by Standard & Poor’s Equity Research Services and are prepared separately from any other analytic activity of Standard & Poor’s. In this regard, Standard & Poor’s Equity Research Serviceshas no access to nonpublic information received by other units of Standard & Poor’s. The accuracy and completeness of information obtained from third-party sources, and the opinions based on such information, are not guaranteed.
Earnings per Share ($) (cont’d) Tangible Book Value per Share ($) (cont’d) Share Price (High-Low, $) (cont’d)
MMUULLTTII--LLIINNEE IINNSSUURRAANNCCEE‡‡AFG † AMERICAN FINANCIAL GROUP INC DEC 3.63 1.80 3.33 3.02 1.21 23.14 19.56 19.70 17.41 14.25 36.71-24.70 26.33-18.64 21.72-17.52 17.80-12.00 20.20-11.93AIG * AMERICAN INTERNATIONAL GROUP DEC 5.38 4.03 3.83 3.55 2.11 35.77 30.13 27.39 24.39 20.32 72.97-57.52 73.46-49.91 77.36-54.28 66.35-42.92 80.00-47.61AIZ * ASSURANT INC DEC 5.65 3.53 2.53 1.70 31.29 23.71 21.01 20.04 16.35 207.34 56.78-42.72 44.68-29.70 31.29-23.09 NA-NA NA-NAGNW * GENWORTH FINANCIAL INC DEC 2.90 2.57 2.34 1.98 NA 24.53 23.68 21.85 NA NA 36.47-31.00 35.25-25.72 27.84-18.75 NA-NA NA-NAHIG * HARTFORD FINANCIAL SERVICES DEC 8.89 7.63 7.32 (0.33) 4.01 53.07 45.03 42.55 35.00 35.31 94.03-79.24 89.49-65.35 69.57-52.73 59.27-31.64 70.24-37.25
HCC † HCC INSURANCE HOLDINGS INC DEC 3.08 1.78 1.63 1.13 1.13 11.64 10.45 8.42 6.68 5.70 35.15-28.51 32.95-21.31 23.17-18.35 21.39-14.87 19.30-12.74HMN † HORACE MANN EDUCATORS CORP DEC 2.29 1.80 1.32 0.44 0.28 13.90 12.03 11.84 10.67 10.53 21.01-16.05 20.80-15.86 19.30-13.94 16.95-12.43 24.08-13.61LTR * LOEWS CORP DEC 3.80 1.69 1.89 (1.40) 1.50 29.77 22.95 21.31 19.29 19.88 42.18-30.42 32.90-22.35 23.67-16.36 16.49-12.75 20.77-12.50UTR † UNITRIN INC DEC 4.17 3.70 3.51 1.83 (0.12) 28.95 26.46 24.61 21.75 21.56 51.45-39.33 54.13-40.80 49.99-36.72 42.50-21.50 42.80-27.85
Ticker Company Yr. End 2006 2005 2004 2003 2002 2006 2005 2004 2003 2002 2006 2005 2004 2003 2002
Note: Data as originally reported. ‡ S&P 1500 Index group. * Company included in the S&P 500. † Company included in the S&P MidCap. § Company included in the S&P SmallCap. # Of the following calendar year. J-This amount includes intangibles that cannot be identified.

Standard & Poor’sINDUSTRY SURVEYS
55 Water StreetNew York, NY 10041
Advertising
Aerospace & Defense
Agribusiness
Airlines
Alcoholic Beverages & Tobacco
Apparel & Footwear
Autos & Auto Parts
Banking
Biotechnology
Broadcasting & Cable
Chemicals
Communications Equipment
Computers: Commercial Services
Computers: Consumer Services &
the Internet
Computers: Hardware
Computers: Software
Computers: Storage & Peripherals
Electric Utilities
Environmental & Waste Management
Financial Services: Diversified
Foods & Nonalcoholic Beverages
Healthcare: Facilities
Healthcare: Managed Care
Healthcare: Pharmaceuticals
Healthcare: Products & Supplies
Heavy Equipment & Trucks
Homebuilding
Household Durables
Household Nondurables
Industrial Machinery
Insurance: Life & Health
Insurance: Property-Casualty
Investment Services
Lodging & Gaming
Metals: Industrial
Movies & Home Entertainment
Natural Gas Distribution
Oil & Gas: Equipment & Services
Oil & Gas: Production & Marketing
Paper & Forest Products
Publishing
REITs
Restaurants
Retailing: General
Retailing: Specialty
Savings & Loans
Semiconductor Equipment
Semiconductors
Supermarkets & Drugstores
Telecommunications: Wireless
Telecommunications: Wireline
Transportation: Commercial
Advertising/Asia, Europe
Aerospace & Defense/Europe
Airlines/Asia, Europe
Autos & Auto Parts/Asia, Europe
Banking/Asia, Europe, Latin America
Biotechnology/Asia, Europe
Broadcasting & Cable/Asia, Europe
Chemicals/Asia, Europe
Communications Equipment/Asia, Europe
Computers: Hardware/Asia
Construction & Engineering/Asia, Europe
Consumer Electronics/Asia
Electric Utilities/Asia, Europe
Foods & Nonalcoholic Beverages/Asia, Europe
Healthcare: Pharmaceuticals/Asia, Europe
Healthcare: Products & Supplies/Asia, Europe
Industrial Machinery/Asia, Europe
Insurance: Life & Health/Asia, Europe
Insurance: Property-Casualty/Asia, Europe
Investment Services/Asia, Europe
Oil & Gas: Production & Marketing/Asia, EMEA, Latin America
Publishing/Asia, Europe
Real Estate/Asia, Europe
Retailing: Specialty/Asia, Europe
Supermarkets & Drugstores/Asia, Europe
Telecommunications: Wireless/Asia, Europe, Latin America
Transportation: Commercial/Asia, Europe
Topics Covered by
INDUSTRY SURVEYS
GLOBAL INDUSTRY SURVEYS
Each of the topics listed above is the exclusive subject of an issue of Industry Surveys or Global Industry Surveys. To order an issue or receive subscription information, please call (800) 221-5277.
For information about Industry Surveys and Global Industry Surveys, please call (800) 523-4534.
Industry/Region Industry/Region