southern tasmania industrial land study -...
TRANSCRIPT

Southern Tasmania Industrial Land Study Stage 1 Final Report
STCA
December 2011

This report has been prepared for:
Southern Tasmanian Councils Authority (STCA)
This report has been prepared by: SGS Economics and Planning Pty Ltd
ACN 007 437 729
Level 5 171 Latrobe Street
MELBOURNE VIC 3000
P: + 61 3 8616 0331
F: + 61 3 8616 0332
W: www.sgsep.com.au
Offices in Brisbane, Canberra, Hobart, Melbourne, Perth, Sydney
Table of Contents
Page i of 114
Executive Summary ..................................................................... 1
1 Introduction......................................................................... 9
1.1 Background ................................................................................................................ 9
1.2 Aim ........................................................................................................................... 9
1.3 Remainder of this Report .............................................................................................. 9
2 Regional Context ................................................................ 11
2.1 Regional Context ....................................................................................................... 11
2.1.1 Population and Skills Base ............................................................................. 11
2.1.2 Employment and Industry ............................................................................. 15
2.2 Industrial Development .............................................................................................. 16
2.2.1 Industrial Specialisation ................................................................................ 16
2.2.2 Turnover and production ............................................................................... 36
2.2.3 Conclusions ................................................................................................. 39
2.3 Industrial Land Use .................................................................................................... 40
2.3.1 Existing Industry Estates ............................................................................... 40
2.3.2 Opportunities and Challenges ......................................................................... 43
2.3.3 Industrial Land Use Patterns .......................................................................... 46
2.4 Infrastructure and Investments ................................................................................... 50
3 Demand for Industrial Land ................................................. 53
3.1 A Revised Methodology .............................................................................................. 53
3.2 Land demand Projections ............................................................................................ 54
4 Vacant Industrial Land ........................................................ 61
4.1 Vacant Land Verification Process ................................................................................. 61
4.2 Assessment of Vacant Industrial Land .......................................................................... 64
4.2.1 Brighton Vacant and Suitable Industrial Land Assessment ................................. 65
4.2.2 Glenorchy Vacant and Suitable Industrial Land Assessment ............................... 68
4.2.3 Clarence Vacant and Suitable Industrial Land Assessment ................................. 71
4.2.4 Sorell Vacant and Suitable Industrial Land Assessment ..................................... 79
4.2.5 Kingborough Vacant and Suitable Industrial Land Assessment............................ 81
4.2.6 Derwent Valley Vacant and Suitable Industrial Land Assessment ........................ 86
4.2.7 Huon Valley Vacant and Suitable Industrial Land Assessment ............................. 88
4.2.8 Glamorgan-Spring Bay Vacant and Suitable Industrial Land Assessment ............. 94
4.2.9 Central Highlands and Southern Midlands Vacant and Suitable Industrial Land ..... 97
4.2.10 Overview of Vacant and Suitable Industrial Land .............................................. 98
4.3 Infill Capacity of Existing Land .................................................................................... 98
5 Comparison of Demand and Supply of Industrial Land .......... 100
5.1 Local Service Industries ........................................................................................... 100

Table of Contents
20110171 Southern Tasmania Industrial Land Study (FINAL 120416)
5.2 Comparison for Other Industries ................................................................................ 103
5.3 Recommendations and Conclusions ............................................................................ 107
Tables
Table 1 Summary of Industrial Land Demand Projections by Region (in ha), 2011-2041................ 5
Table 2 Supply and Demand by Local Service Industries (in ha) ............................................. 6
Table 3 Estimated Industry Growth in Turnover, 2007-08 to 2008-09 ................................... 36
Table 4 Share of Southern Councils Turnover, 2008-09 ....................................................... 39
Table 5 Industrial Precincts in Southern Tasmania, by land area .......................................... 41
Table 6 Land, location and access requirements for various activities .................................... 49
Table 7 Summary of Industrial Land Demand Projections by Region ..................................... 57
Table 8 Vacant Industrial Land in Central Highlands and Southern Midlands .............................. 97
Table 9 Summary of vacant and suitable industrial land ...................................................... 98
Table 10 Supply and demand of vacant industrial land (in ha), 2011 -2041 ........................... 100
Table 11 Vacant and Suitable Industrial Land with Demand by Local Service Industries (in ha) 101
Table 12 Vacant and Suitable Industrial Land after Allowing for Local Service Industries (in ha)103
Table 13 Land Supply, Demand and Shortfalls for Transport, Warehousing and Export Oriented
Industries* ...................................................................................................... 104
Table 14 Shortfalls of Industrial Land in Greater Hobart (in ha) ........................................... 106
Figures
Figure 1 Industrial Estates in Southern Tasmania .................................................................. 3
Figure 2 Industrial Land Demand by Category – Medium-term (in ha) ...................................... 5
Figure 3 Proportion of Population and Highest Level of Schooling, 2006 .................................. 12
Figure 4 Post-Secondary Education Levels, 2006 ................................................................. 13
Figure 5 Share of Employment by Occupation Type, 2006 .................................................... 14
Figure 6 Shares of Occupations by Type, 2006 .................................................................... 15
Figure 7 Location Quotients for Southern Tasmania, 2001 & 2006 ......................................... 17
Figure 8 Agricultural Location Quotients for Southern Tasmania, 2001 & 2006 ........................ 18
Figure 9 Manufacturing Location Quotients for the Southern Tasmania, 2001 & 2006 ............... 19
Figure 10 Location Quotients for Glenorchy, 2001 & 2006 ...................................................... 20
Figure 11 Location Quotients for Brighton, 2001 & 2006 ........................................................ 21
Figure 12 Employment in Transport Industry of Brighton, 2006 .............................................. 22
Figure 13 Location Quotienst for Clarence, 2001 & 2006 ........................................................ 23
Figure 14 Location Quotients for Hobart, 2001 & 2006 ........................................................... 24
Figure 15 Location Quotients for Kingborough, 2001 & 2006 ................................................... 25
Figure 16 Location Quotients for Huon Valley, 2001 & 2006 .................................................... 26
Figure 17 Distribution of Agricultural Employment in Huon Valley, 2006 ................................... 27
Figure 18 Location Quotients for Derwent Valley, 2001 & 2006 ............................................... 28
Figure 19 Distribution of Manufacturing Employment in Derwent Valley, 2006 .......................... 29
Figure 20 Location Quotients for Tasman, 2001 & 2006 ......................................................... 30
Figure 21 Distribution of Agricultural Employment in Tasman, 2006......................................... 31
Figure 22 Location Quotients for Southern Midlands, 2001 & 2006 .......................................... 32
Figure 23 Location Quotients for Central Highlands, 2001 &2006............................................. 33
Figure 24 Location Quotients for Sorell, 2001 & 2006 ............................................................ 34
Figure 25 Location Quotients for Glamorgan-Spring Bay, 2001 & 2006 .................................... 35
Table of Contents
20110171 Southern Tasmania Industrial Land Study (FINAL 120416)
Figure 26 Manufacturing employment and sales and service income in Tasmania ...................... 37
Figure 27 Share of Turnover by Industry, 2008-09 ................................................................ 38
Figure 28 Industrial Estates in Southern Tasmania ................................................................ 41
Figure 29 Industrial Land Demand by Category (in ha) 2011-2016 .......................................... 55
Figure 30 Industrial Land Demand by Category (in ha) 2011-2026 .......................................... 56
Figure 31 Industrial Land Demand by Category (in ha) 2011-2041 .......................................... 57
Figure 32 Industrial Land Demand for Local Service Industries, 2011-2016 .............................. 58
Figure 33 Industrial Land Demand for Local Service Industries, 2011-2026 .............................. 59
Figure 34 Industrial Land Demand for Local Service Industries, 2011-2041 .............................. 60
Figure 35 Vacant Industrial Land Parcels by Council, 2011 ..................................................... 62
Figure 36 Vacant Industrial Land Area by Council, 2011 ......................................................... 63
Figure 37 Vacant Industrial Land Parcels by Lot Size, 2011 .................................................... 63
Figure 38 Vacant Land by Parcel Size (% of total vacant stock), 2001 ...................................... 64
Figure 39 Vacant Industrial Land in Brighton and Parcel Land Gradients ................................... 66
Figure 40 Vacant Industrial Land in Brighton and Nearby Sensitive Uses ................................... 67
Figure 41 Vacant Industrial Land in Glenorchy and Parcel Land Gradients ................................. 69
Figure 42 Vacant Industrial Land in Glenorchy and Nearby Sensitive Uses ................................ 70
Figure 43 Vacant Industrial Land in Risdon Vale and Mornington, Parcel Land Gradients ............. 72
Figure 44 Vacant Industrial Land in Risdon Vale and Mornington, Nearby Sensitive Uses ............ 73
Figure 45 Vacant Industrial Land around Cambridge, Parcel Land Gradients ............................. 74
Figure 46 Vacant Industrial Land around Cambridge, Nearby Sensitive Uses ............................. 75
Figure 47 Vacant Industrial Land in Rokeby and Parcel Land Gradients .................................... 76
Figure 48 Vacant Industrial Land in Rokeby and Nearby Sensitive Uses .................................... 77
Figure 49 Vacant Industrial Land in Sorell, Parcel Land Gradients ............................................. 79
Figure 50 Vacant Industrial Land in Sorell and Nearby Sensitive Uses ...................................... 80
Figure 51 Vacant Industrial Land in Huntingfield and Firthside, Parcel Land Gradients ................ 81
Figure 52 Vacant Industrial Land in Huntingfield and Firthside and Nearby Sensitive Uses .......... 82
Figure 53 Vacant Industrial Land in Electrona and Margate, Parcel Land Gradients .................... 83
Figure 54 Vacant Industrial Land in Electrona and Margate and Nearby Sensitive Uses .............. 84
Figure 55 Vacant Industrial Land in Derwent Valley, Parcel Land Gradients ............................... 86
Figure 56 Vacant Industrial Land in Derwent Valley and Nearby Sensitive Uses ......................... 87
Figure 57 Vacant Industrial Land in Cygnet, Parcel Land Gradients .......................................... 88
Figure 58 Vacant Industrial Land in Cygnet and Nearby Sensitive Uses .................................... 89
Figure 59 Vacant Industrial Land in Geeveston, Parcel Land Gradients ..................................... 90
Figure 60 Vacant Industrial Land in Geeveston and Nearby Sensitive Uses ............................... 91
Figure 61 Vacant Industrial Land near Dover, Parcel Land Gradients ........................................ 92
Figure 62 Vacant Industrial Land near Dover and Nearby Sensitive Uses .................................. 93
Figure 63 Vacant Industrial Land in Triabunna, Parcel Land Gradients ...................................... 95
Figure 64 Vacant Industrial Land in Triabunna and Nearby Sensitive Uses ................................ 96
Southern Tasmania Industrial Land Study / Stage 1 Report
20110171 Southern Tasmania Industrial Land Study (FINAL 120416)
P. 1
Executive Summary
The key aim of this study is to provide for a 15-year supply of industrially zoned land within the
new pending planning schemes and to identify longer term industrial land within strategic planning
documents.
Stage 1 aims to assess the supply of vacant industrial land in the study area and compares this
with demand for industrial land over a 5, 15 and 30 year period. The outcomes of Stage 1 are
estimates of any shortfalls and/or oversupplies of industrial land for industrial uses by type.
Stage 2 aims to identify and assess options for potential future new and/or expanded sites for
locally significant industrial land clusters, regionally significant industrial land clusters and sites of
major industrial activity.
This report presents the findings of Stage 1 and includes conclusions and recommendations for
consideration in Stage 2 of the study.
Economic Profile
The Southern Tasmanian regional economy is vitally important to the State. There are an
estimated 94,000 jobs in the region with 92% located in Greater Hobart and 47% in Hobart
municipality alone. In the Southern Region, the Forestry, Fishing and Agriculture industry
contributes significantly to the region’s employment profile.
From 2001 to 2006 the manufacturing sector has seen a loss of employment. The decline in terms
of employment is largely a result of the rise of China and increased outsourcing, which takes
advantages of wage disparities between Australia and the rising Asian economies. This trend in
manufacturing is expected to continue into the future. However, analysis of recent turnover data
(2007 to 2009) indicates that local production and productivity have continued to increase in this
sector.
Compared to the national employment profile, the region has relative strengths in the food and
beverages manufacturing, wood and paper processing and the textile and clothing industries.
Glenorchy continues to be the industrial centre of Southern Tasmania. The key competitive
industries are manufacturing, electricity, gas, water and waste services, construction, wholesale
trade and transport, postal and warehousing.
Brighton has developed at a rapid pace to be the transport and warehousing hub of Greater Hobart.
Clarence has a mixed industrial base. Clarence is experiencing a shift towards service industries, in
line with the national trend. Similarly, Kingborough too is becoming more service orientated.
Hobart has a high concentration of public administration and advanced business services in the
city. As the city becomes increasingly service orientated, industries that require a lot of affordable

Southern Tasmania Industrial Land Study / Stage 1 Report
20110171 Southern Tasmania Industrial Land Study (FINAL 120416)
P. 2
land, such as manufacturing, are being pushed outwards towards the fringes of the metropolitan
area.
The economic base of the Huon Valley continues to rely on the agricultural sector, comprising of
forestry, which has been in decline, and aquaculture which continues to expand. Tasman
municipality too has a strong agricultural sector within which aquaculture and commercial fishing
play a key role. The Derwent Valley continues to rely on the paper processing industry (Norske
Skog).
Comparative analysis of employment by industry in the region identifies the key growth industries
to be agriculture, aquaculture, some niche manufacturing industries, wholesale and transport.
Growth in manufacturing is primarily driven by growth in productivity either by technological
adaptation or raising the skills of the workforce, with overall employment falling despite growth in
turnover.
The native logging industry in Southern Tasmania has been going through a period of structural
decline and repositioning. As such, wood processing and paper manufacturing have been
consequently affected. Anecdotally, the decline of the industry has levelled off recently.
Transport and warehousing, especially in Brighton is predicted to experience sustained growth.
Relocation of the rail yards from Hobart to Brighton will further drive land demand for transport
and warehousing businesses in the Brighton area.
Industrial Land Use Patterns
In the STCA Land Use Strategy for Southern Tasmania (2011) Industrial Activity is defined as:
“...the manufacturing, assembling, processing, storage and distribution of products and goods. It
can include wholesaling and retailing of goods and may include some uses associated with primary
production.”
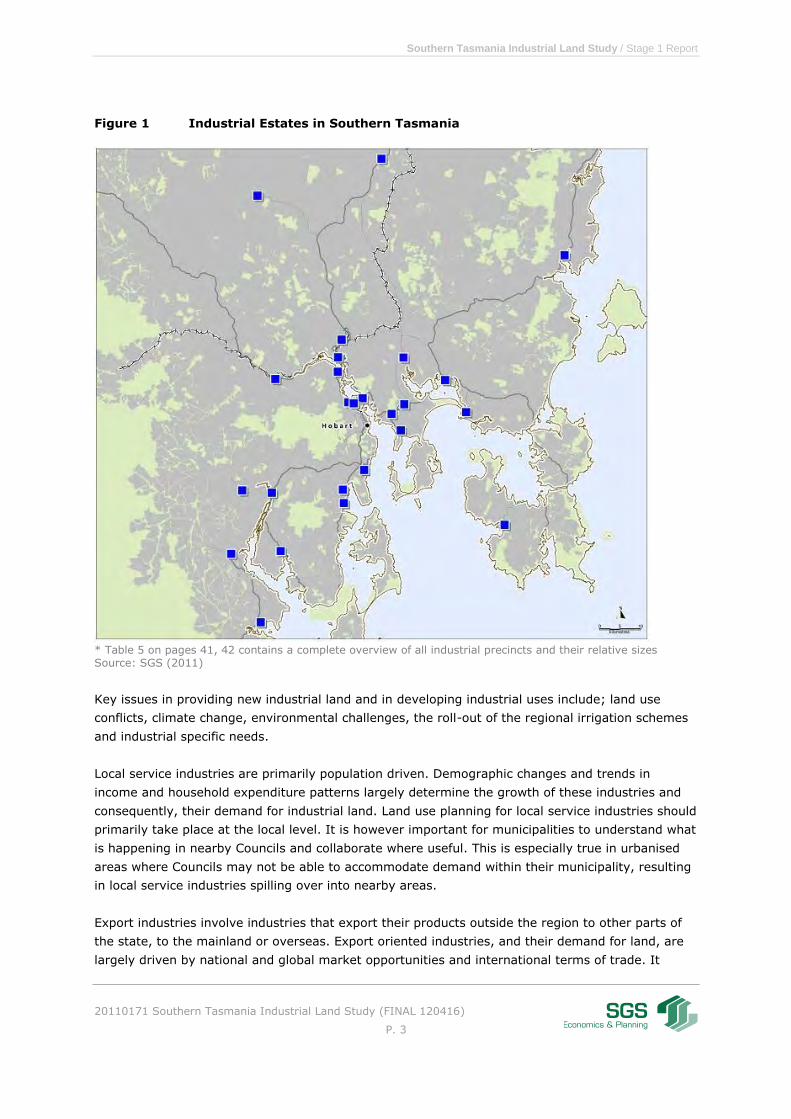
As noted in Making the Right Connections: Industrial Land Availability there are currently nine
major export oriented industrial sites. Other industrial estates are spread throughout the region.
The following map highlights the key existing industrial estates in Southern Tasmania.
Southern Tasmania Industrial Land Study / Stage 1 Report
20110171 Southern Tasmania Industrial Land Study (FINAL 120416)
P. 3
Figure 1 Industrial Estates in Southern Tasmania
* Table 5 on pages 41, 42 contains a complete overview of all industrial precincts and their relative sizes Source: SGS (2011)
Key issues in providing new industrial land and in developing industrial uses include; land use
conflicts, climate change, environmental challenges, the roll-out of the regional irrigation schemes
and industrial specific needs.
Local service industries are primarily population driven. Demographic changes and trends in
income and household expenditure patterns largely determine the growth of these industries and
consequently, their demand for industrial land. Land use planning for local service industries should
primarily take place at the local level. It is however important for municipalities to understand what
is happening in nearby Councils and collaborate where useful. This is especially true in urbanised
areas where Councils may not be able to accommodate demand within their municipality, resulting
in local service industries spilling over into nearby areas.
Export industries involve industries that export their products outside the region to other parts of
the state, to the mainland or overseas. Export oriented industries, and their demand for land, are
largely driven by national and global market opportunities and international terms of trade. It

Southern Tasmania Industrial Land Study / Stage 1 Report
20110171 Southern Tasmania Industrial Land Study (FINAL 120416)
P. 4
includes; most primary product processing and basic material processing, larger scale or
specialised manufacturing, and larger centralised distribution hubs. Export oriented industries
include support industries and services to export industries. Increasingly, export oriented industrial
firms are small and medium-sized firms and firms with activities that are of a light industrial
nature. These export oriented firms may not need to locate at sites that are suitable for major
impact or heavy industrial production, which was characteristic for the traditional export oriented
industries.
Planning for major export oriented industries can be complex. Land demand by major export
oriented industries is both infrequent and unpredictable. It is infrequent in the sense that it
involves one-off major investments that may only occur once every ten or twenty years. It is
unpredictable in the sense that it is uncertain exactly when this demand will occur. Rezoning
extensive areas of land in anticipation of demand that may or may not materialise may be an
inefficient approach. A more cost-effective approach would be to identify potential locations for
industrial land zoning, so as to ensure the land is available for rezoning and in the interim used in a
way that does not prevent future industrial use. Further, it is important to ensure planning
processes run smoothly and as quickly as possible in order to effectively accommodate demand
when it occurs. Current mechanisms are projects of State and regional significance and combined
permit and amendment process (Section 43 A).
Demand for Industrial Land
The industrial land demand projections are based on recent research compiled for the Department
of Economic Development, Tourism and the Arts (DEDTA). Compared to earlier research
undertaken in 2006 and 2008, the methodology has been revised on a number of key points.
The updated industrial land demand projections no longer include industrial uses on agricultural
properties and mining and resource sites. The projections are for industrial zoned land only. The
new projections make a distinction between four industrial types of activity:
o Local service industries, which are population driven;
o Export oriented industries, which are driven by market opportunities to export
to the mainland and overseas. The uptake of the irrigation schemes and resulting
agricultural transition and growth of export clusters are key determinants;
o Transport, warehousing and wholesales, which are intermediate industries
driven by both population and export growth and trend to gain higher efficiencies
with Just-in-Time (JiT) distribution processes. In the previous study this industry
was distributed between local service and export oriented industries;
o Bulky goods retailing, driven by population growth and the sector specific
characteristics most notably the matured life cycle of this subsector.
Two scenarios were developed for projecting the future demand of industrial land in Tasmania over
the next 30 years. Both scenarios are based on plausible assumptions about the state’s future. One
scenario provides land estimates according to a low scenario and the other according to a high
scenario. The scenarios provide a range (between low and high) within which future actual land
demand is expected to lie.
Southern Tasmania Industrial Land Study / Stage 1 Report
20110171 Southern Tasmania Industrial Land Study (FINAL 120416)
P. 5
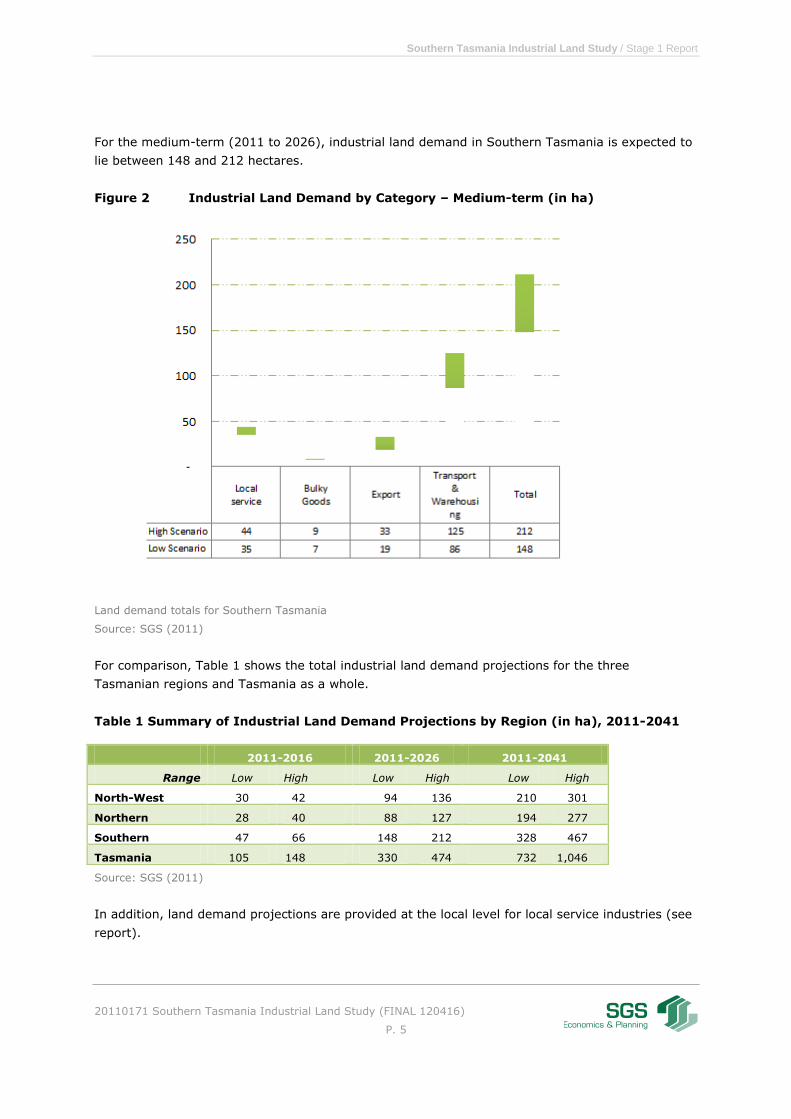
For the medium-term (2011 to 2026), industrial land demand in Southern Tasmania is expected to
lie between 148 and 212 hectares.
Figure 2 Industrial Land Demand by Category – Medium-term (in ha)
Land demand totals for Southern Tasmania
Source: SGS (2011)
For comparison, Table 1 shows the total industrial land demand projections for the three
Tasmanian regions and Tasmania as a whole.
Table 1 Summary of Industrial Land Demand Projections by Region (in ha), 2011-2041
2011-2016 2011-2026 2011-2041
Range Low High Low High Low High
North-West 30 42 94 136 210 301
Northern 28 40 88 127 194 277
Southern 47 66 148 212 328 467
Tasmania 105 148 330 474 732 1,046
Source: SGS (2011)
In addition, land demand projections are provided at the local level for local service industries (see
report).

Southern Tasmania Industrial Land Study / Stage 1 Report
20110171 Southern Tasmania Industrial Land Study (FINAL 120416)
P. 6
Vacant and Suitable Industrial Land
The land suitability analysis has significantly narrowed the available supply of vacant and suitable
industrial land in Southern Tasmania. The suitability of vacant land for industrial use was
investigated for all sites in terms of slope (average gradient of less than 10% is deemed suitable),
nearby sensitive uses such as residential and natural conservation areas and risks from sea level
rise. The initially vacant land supply of 199 hectares or 94 parcels has been diminished to 141
hectares or 67 parcels.
Comparison of Demand for Land with Vacant and Suitable Supply
In general terms, current supply is sufficient to meet demand over the next five years, without
taking account of site location and lot size. In the medium-term however, there is a projected
shortfall of industrial land for the next fifteen years (2011-2026).
When planning for industrial land, the aim should be to accommodate demand for local service
industries locally wherever possible. Most municipalities have sufficient land to accommodate local
industries. However, a number of municipalities, mostly the strongly urbanised areas, have
insufficient land to meet local service industry demand (Table 2). If it is not possible to create more
industrial land or to make better use of existing land, this demand will ‘flow over’ into nearby
municipalities.
Table 2 Supply and Demand by Local Service Industries (in ha)
2011 2011-2026 2011-2026
Land Supply Demand for local
service industries
Shortfalls
low high low high
Brighton 6.7 1.6 1.7
Clarence 81.1 4.4 5.5
Derwent Valley 0.6 0.7 0.8
Glenorchy 0.8 7.7 9.6 -6.9 -8.8
Hobart 0 11.7 14.5 -11.7 -14.5
Kingborough 3.6 4.8 6 -1.2 -2.4
Sorell 0.3 1.5 1.8 -1.2 -1.5
Central Highlands 15.2 0.1 0.1
Glamorgan-Spring Bay 2.3 0.9 1.1
Huon Valley 23 1.8 2.2
Southern Midlands 7 0.2 0.2
Tasman 0 0.1 0.2 -0.1 -0.2
Grand total 141 36 44 -21 -27
Source: SGS, 2011
Southern Tasmania Industrial Land Study / Stage 1 Report
20110171 Southern Tasmania Industrial Land Study (FINAL 120416)
P. 7
Demand for land by export oriented industries and transport and warehousing needs to be
accommodated at the regional level. Further, it should be noted that the Greater Hobart area,
where 92% of the current economic activity takes place, should be earmarked as the preferred
area for most of these industries to be located. Greater Hobart has relatively good transport
connections interstate and internationally, as well as a large and skilled work force, supporting
institutions and a service industry base. Those industries that rely on agriculture and natural
resources would benefit from locating in the more regional municipalities of Southern Tasmania.
The expected shortfall of industrial land for export oriented industries and transport and
warehousing over the next 15 years would up to 57 hectares when considering all available land in
the entire region. When considering that the majority of demand (92%) would occur within Greater
Hobart, then the shortfall of land in Greater Hobart is expected to be 34 to 88 hectares. For the
regional areas in Southern Tasmania there is in principle no shortfall of industrial land for export
industries and transport and warehousing.
In short, the following list summarises the issues and tasks that need to be addressed in Stage 2
of this study:
Shortfalls of local industrial land to accommodate future demand for local service industries
over the period 2011-2026 in:
o Glenorchy
o Kingborough
o Sorell
o Hobart and
o minor shortfalls in Tasman.
Potential shortfalls for local service industries based on current lot sizes and competing
demand from transport and warehousing and export oriented industries in Brighton.
Shortfalls of regionally significant industrial land to accommodate future demand for
transport & warehousing and export oriented industries of between 34 and 88 hectares. Of
this total, between 7 and 18 hectares would be for export oriented industries and 27
to 70 hectares for transport & warehousing. The additional land needs should
primarily be catered for within Greater Hobart.
Identified potential future locations for industrial development in this report, including1:
o Clarence (Kennedy Road and adjacent to the Hobart International Airport)
o Brighton (New industrial park adjacent to new Intermodal Transport Hub)
o Huon Valley (Potential for new industrial land in Huonville – as identified in Huon
Valley Land Use and Development Strategy).
1 In addition, SGS will consider sites that have been identified as part of a survey amongst all Councils
as part of the Industrial land Demand Study (2011-2041) for DEDTA, and any other sites that may be suggested as part of the Stage 2 process.
Southern Tasmania Industrial Land Study / Stage 1 Report
20110171 Southern Tasmania Industrial Land Study (FINAL 120416)
P. 8
Accessibility and road infrastructure capacity to regionally significant industrial land
supplies in Clarence and elsewhere.
Identify and consider, in broad terms only, potential sites to accommodate long term
industrial land demand (30 year horizon) of between 188 and 326 hectares.

Southern Tasmania Industrial Land Study / Stage 1 Report
20110171 Southern Tasmania Industrial Land Study (FINAL 120416)
P. 9
1 Introduction
1.1 Background
The Southern Tasmania Industrial Land study is an initiative by the Southern Tasmanian Councils
Authority (STCA) and the twelve municipalities it represents.
Examinations as part of the Southern Regional Land Use Strategy (SRLUS) indicate:
There is an apparent shortage of industrial land within the region, which may manifest
within the short to medium term;
Many existing industrial sites are constrained by surrounding land uses; and
The availability of sufficient and suitable industrial zoned land is critical to the economic
performance and prosperity of the region.
1.2 Aim
The key aim of this study is to provide for a 15-year supply of industrially zoned land within the
new pending planning schemes and to identify longer term industrial land within strategic planning
documents.
Stage 1 aims to assess the supply of vacant industrial land in the study area and compares this
with demand for industrial land over a 5, 15 and 30 year period. The outcomes of Stage 1 are
estimates of any shortfalls and/or oversupplies of industrial land for industrial uses by type.
Stage 2 aims to identify and assess options for potential future new and/or expanded sites for
locally significant industrial land clusters, regionally significant industrial land clusters and sites of
major industrial activity. Stage 2 will provide a detailed site analysis and spatial definition of
preferred regionally significant industrial land clusters. This analysis is envisaged to inform the
allocation of industrial land zoning for the new planning schemes. The outcome of Stage 2 is a
regional industrial land strategy.
This report presents the findings of Stage 1 and includes conclusions and recommendations for
consideration in Stage 2 of the study.
1.3 Remainder of this Report
Section 2 provides a socio-economic background to the study area and to industrial development in
the study area.
Section 3 provides a summary and interpretation of the results of the Industrial Land Demand
Study for Tasmania (2011-2041). SGS submitted the draft report of this study in September 2011.

Southern Tasmania Industrial Land Study / Stage 1 Report
20110171 Southern Tasmania Industrial Land Study (FINAL 120416)
P. 10
Section 4 presents the results of the Industrial Land Audit which SGS undertook to investigate,
estimate, confirm and assess the supply of vacant and suitable industrial land that is available in
Southern Tasmania.
Finally, Section 5 provides a comparison of demand for and supply of vacant industrial land over
the next 5, 15 and 30 years. It identifies shortfalls of land by location and by type of industry. It
also lists a number of issues that need to be addressed in Stage 2 of this study.

Southern Tasmania Industrial Land Study / Stage 1 Report
20110171 Southern Tasmania Industrial Land Study (FINAL 120416)
P. 11
2 Regional Context
This section provides a regional overview of Southern Tasmania in relation to industrial land use
and includes a regional economic profile, existing industrial estates in Southern Tasmania,
industrial land use challenges and issues of infrastructure and investment. The section is based on
a review of existing studies, strategies and policies that affect industrial land development and use
and regional infrastructure provision in the Southern Tasmania Councils Authority (STCA) area.
Appendix A provides an overview of the documents that were reviewed.
In addition, a range of statistical data has been sourced.
2.1 Regional Context
2.1.1 Population and Skills Base
Southern Tasmania was estimated to have 241,000 residents in 2006, comprising approximately
48% of the State’s total population. Southern Tasmania has had historically low population growth
when compared to mainland centres. From 2001 to 2008 the region’s population growth was 0.9%.
per annum. It is expected that moderate population growth will continue in future years. The rate
of growth will be influenced by fertility, mortality and migration. The population is ageing with a
median age of 39.6 years in 2006, an increase from a median of 34.1 in 2001. The ageing
population and slow to moderate growth rates present a challenge to the region, which increasingly
finds it difficult to source skilled workers for key industries such as advanced manufacturing (STCA
Regional Land Use Strategy for Southern Tasmania 2011).
Three aspects of the skills base of Southern Tasmania were explored by SGS’s previous studies.
First, secondary education levels were compared to both the regional and Australia wide averages.
Second, the levels of advanced education in Southern Tasmania were compared to Australia. Third,
the distribution of employment by job classification was compared, where appropriate to the
regional and national economies. These three steps identified any significant disparities between
the national and regional economies in terms of human capital.
Base levels of education provide some of the skills required to grow an economy. Graduating
Secondary school from year 10 onwards is considered the base level of education throughout
Australia. Legislation dictates that no child can leave school, training or some apprenticeship until
the age of 17.
Comparisons of national and regional base education levels reveal that Southern Tasmania has a
relatively low skilled population, with the exception of Hobart and Kingborough. Brighton has the
lowest levels of base education, with almost 20% of the population under the national average of
people who have at least a year 12 education, shown in Figure 3.

Southern Tasmania Industrial Land Study / Stage 1 Report
20110171 Southern Tasmania Industrial Land Study (FINAL 120416)
P. 12
The higher levels of advanced education evident in Hobart stems from the type of employment that
tends to occur in capital cities. High value, knowledge intensive jobs are mainly located within cities
due to the benefits of economies of scope and scale, which is also known as agglomeration
benefits. These jobs are also comparatively highly paid. In order to access these jobs prospective
employees usually require a higher level of education. In Tasmania, people can generally afford to
live close to their work. Due to these two factors (type of employment and location of employment)
it is expected to have higher levels of education and a more advanced workforce.
Low levels of education are not necessarily a problem for a region. Whether or not it is a problem
depends entirely on the comparative advantage and future strategic aspirations of the region. For
example, if a rural area currently dependent on agriculture was strategically targeting a high value,
complex form of manufacturing for growth that industry would require specialised workers. If low
levels of education are present in an area or the education is not in line with the skills required to
grow that form of manufacturing the industry may struggle to grow.
Generally speaking, the increased international competition with countries that offer lower wages
poses a continuous risk to the regional economy. Diversifying into higher value added industries is
seen as a strategic necessity. The skills base in Southern Tasmania is an ongoing point of concern
for the Tasmanian government. Any attempt to move into higher value added industries requires a
re-alignment of the skills with the region. Addressing skills is crucial in altering the composition of
an economy.
The differences in the levels of schooling attained throughout the region are not necessarily an
indication of a drawback for growth of a region. Dynamics of specific areas need to be accounted
for when ascertaining whether or not a region requires higher levels of formal education.
Figure 3 Proportion of Population and Highest Level of Schooling, 2006
Source: ABS, Census (2006).
0%
10%
20%
30%
40%
50%
60%
Year 12 or equivalent Year 11 or equivalent Year 10 or equivalent
Southern Tasmania Industrial Land Study / Stage 1 Report
20110171 Southern Tasmania Industrial Land Study (FINAL 120416)
P. 13
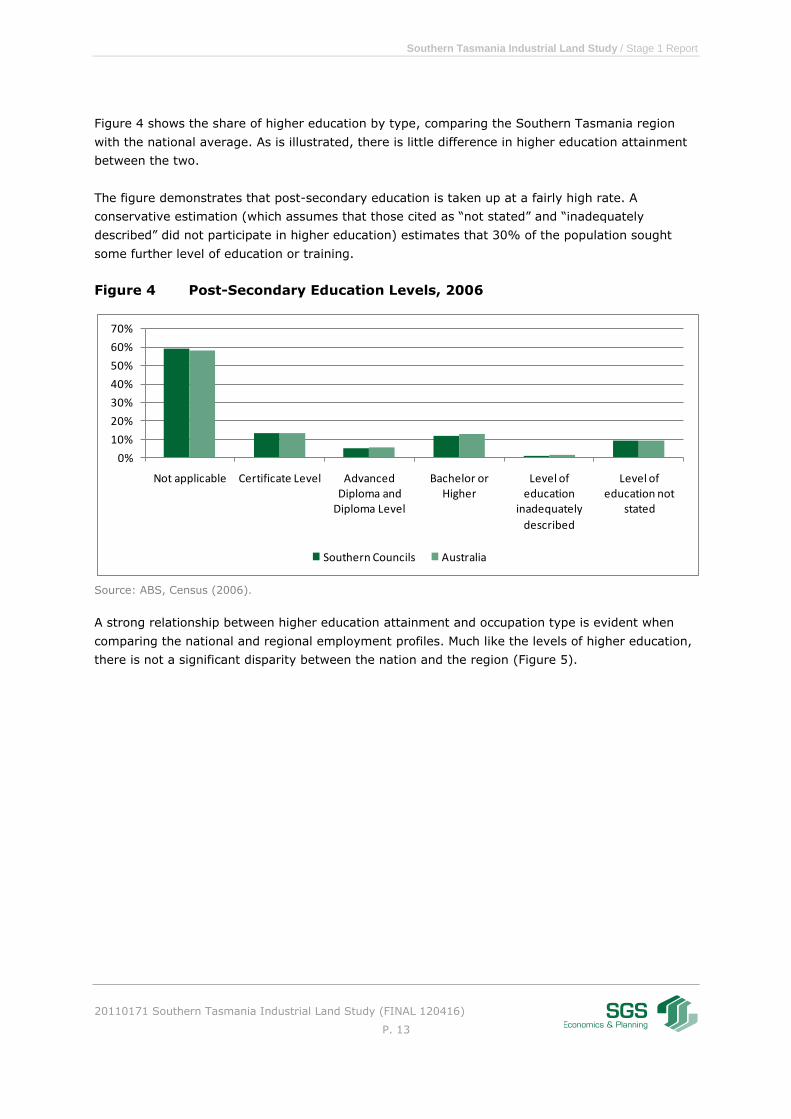
Figure 4 shows the share of higher education by type, comparing the Southern Tasmania region
with the national average. As is illustrated, there is little difference in higher education attainment
between the two.
The figure demonstrates that post-secondary education is taken up at a fairly high rate. A
conservative estimation (which assumes that those cited as “not stated” and “inadequately
described” did not participate in higher education) estimates that 30% of the population sought
some further level of education or training.
Figure 4 Post-Secondary Education Levels, 2006
Source: ABS, Census (2006).
A strong relationship between higher education attainment and occupation type is evident when
comparing the national and regional employment profiles. Much like the levels of higher education,
there is not a significant disparity between the nation and the region (Figure 5).
0%
10%
20%
30%
40%
50%
60%
70%
Not applicable Certificate Level Advanced Diploma and
Diploma Level
Bachelor or Higher
Level of education
inadequately
described
Level of education not
stated
Southern Councils Australia

Southern Tasmania Industrial Land Study / Stage 1 Report
20110171 Southern Tasmania Industrial Land Study (FINAL 120416)
P. 14
Figure 5 Share of Employment by Occupation Type, 2006
Source: ABS, Census (2006).
While at a regional level occupation type mirrors national patterns, at an LGA level this is not the
case. For example, comparing Brighton, which had the lowest levels of year 12 education, with the
well education population of Hobart and the national average highlights the disparities within the
region.
The levels of education relate to the types of employment found within the LGA. Hobart, with its
highly educated population would have strategic advantages for professional employment relative
to Brighton and the national average (see Figure 6).
The relationship would be similar when comparing any rural region with an urbanised area and
does not indicate that there is a disadvantage to Brighton. What the figure does indicate is that the
region, as a whole is diverse and has many different economic factors impacting on it.
0%
1%
2%
3%
4%
5%
6%
7%
8%
9%
10%
Tasmania
Southern Tasmania

Southern Tasmania Industrial Land Study / Stage 1 Report
20110171 Southern Tasmania Industrial Land Study (FINAL 120416)
P. 15
Figure 6 Shares of Occupations by Type, 2006
Source: ABS, Census (2006).
2.1.2 Employment and Industry
The region’s economy is vitally important to the State. There are an estimated 94,000 jobs in the
region with 92% located in Greater Hobart and 47% in Hobart municipality alone. In the Southern
Region the Forestry, Fishing and Agriculture industry significantly contributes to the region’s
employment profile. Other dominant industries of employment include Retail Trade (16% of the
region’s employment) and Health and Community Services (13%), followed by Government
Administration and Defence (11.5%), Education (8.8%), Property and Business Services (8.5%),
Accommodation, Cafes and Restaurants (5.7%) and Construction (5.1%). In comparison
Manufacturing comprises 4.7% of the region’s employment, Transport and Storage comprises 3.5%
and Wholesale Trade comprises 3.4% of the employment profile.
From 2001 to 2006 employment growth was strongest in Government Administration and Defence,
adding 3,250 jobs. The Manufacturing, Wholesale Trade and Agriculture, Forestry and Fishing
sectors saw a loss of employment over the same period. The manufacturing sector saw the largest
loss of employment with 499 jobs lost between 2001 and 2006 (STCA Regional Land Use Strategy
for Southern Tasmania 2011). However, analysis of recent turnover data (2007 to 2009) indicates
that production and productivity continue to increase in these sectors (see section 2.2.2).
0%
2%
4%
6%
8%
10%
12%
14%
16%
18%
Southern Tasmania
Brighton (M)
Hobart (C)

Southern Tasmania Industrial Land Study / Stage 1 Report
20110171 Southern Tasmania Industrial Land Study (FINAL 120416)
P. 16
2.2 Industrial Development
2.2.1 Industrial Specialisation
Employment by industry data provides an understanding of the economic strengths and
specialisations of regions.
Relative employment comparisons between regions can be made through using the Location
Quotient (LQ) technique. The LQ measures the proportion of employment in certain industries
relative to the proportions in other regions. In the following LQ analysis the Southern Statistical
District (SD) will be compared to Australia as a whole and the Local Government Areas (LGA’s) of
the Southern region.
If an industry has an LQ of 1 there is an equal share of employment between national and regional
employment for a particular industry. A value above 1 indicates a greater proportion, whereas a LQ
value of less than 1 represents a relatively lower share of employment for that industry compared
to the national average.
This analysis implicitly incorporates the attributes of a region. The attributes or characteristics of a
region enable comparative advantages. Economies, due to their physical, technological and
intellectual characteristics can have cost, productivity and other strategic advantages relative to
other economies. This is widely considered to be one of the origins of international trade and in an
increasingly global economy dependent on trade it can be considered one of the drivers of which
industries locate and thrive in economies. The theory of comparative advantage generally applies
to entire economies rather than specific regions within a country, but the theory and application of
the theory can be applied to regions as well as entire economies.
These advantages lead to differing proportions of employment in a region, which is revealed
through the LQ analysis. When the value is greater than 1 it is an indication that a region is fairly
specialised and has a competitive advantage in that field of industry over other regions. Generally
speaking, a region is a net exporter if the location quotient is high (that is >1), and a net importer
if the location quotient is low (that is <1).
Southern Tasmania Measured Against Australia
The figure below (Figure 7) details the LQ between the SD and the whole of Australia over the past
two census periods (2001 and 2006). Results are split by industry. Using this analysis the relative
strengths of the region lie in agriculture, utility services, accommodation, the public service,
education, healthcare, the arts and administration services.

Southern Tasmania Industrial Land Study / Stage 1 Report
20110171 Southern Tasmania Industrial Land Study (FINAL 120416)
P. 17
Figure 7 Location Quotients for Southern Tasmania, 2001 & 2006
* Location quotients against Australia
Source: ABS, Census (2001 and 2006).
Agriculture, being a key strength of the region requires further, in depth analysis for the purposes
of industrial land demand. Decoupling the industries down into a more detailed classification, which
splits the industry into smaller components, reveals that not all sub-industries outperform
Australia. Forestry and logging and commercial fishing are the two key sub-industries of the region.
-
0.50
1.00
1.50
2.00
2.50
2001 2006

Southern Tasmania Industrial Land Study / Stage 1 Report
20110171 Southern Tasmania Industrial Land Study (FINAL 120416)
P. 18
The relative proportions of employment in those industries are most evident when comparing
Australia against Southern Tasmania. The full breakdown of agriculture is shown in Figure 8.
Figure 8 Agricultural Location Quotients for Southern Tasmania, 2001 &
2006
* Compared to Australia
Source: ABS, Census (2001 and 2006)
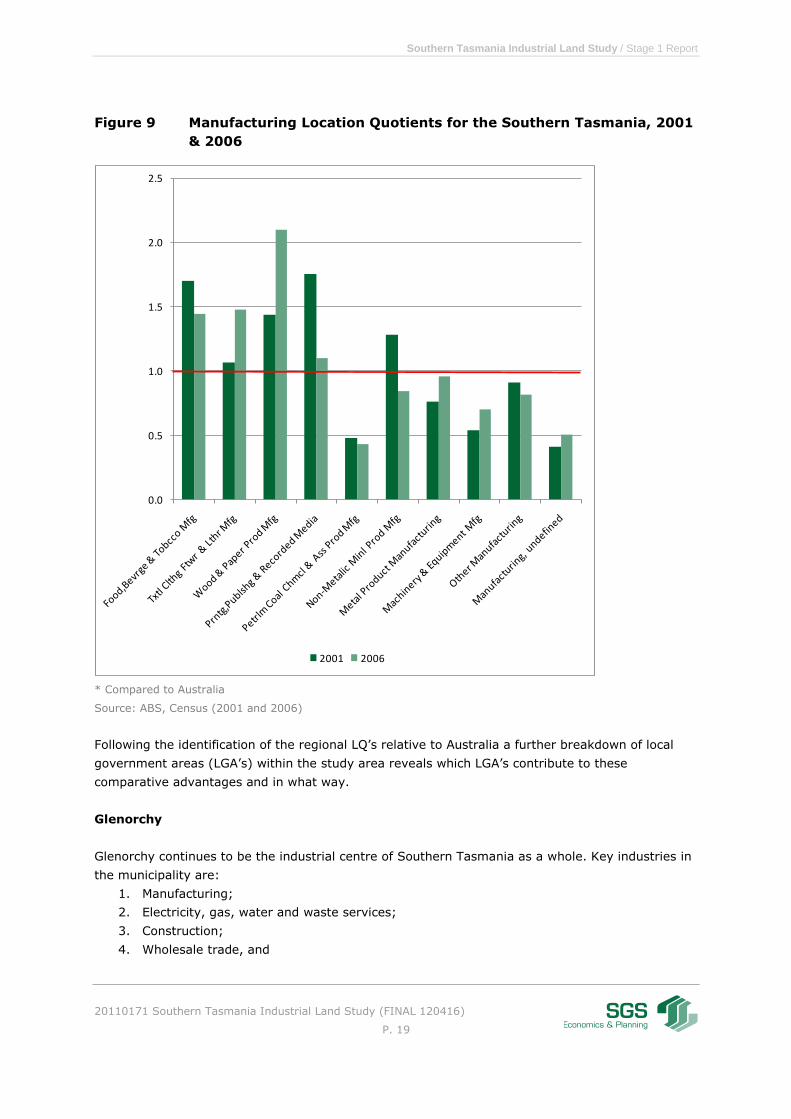
Manufacturing, whilst not outperforming the national proportion of employment (see Figure 7),
does have a significant presence in some areas of Southern Tasmania (see the Appendix for a LQ
analysis for each LGA within Southern Tasmania). For this reason manufacturing has also been split
to reveal a finer level of detail. Compared to the national employment proportions the region has
its strengths in food and beverage manufacturing, wood and paper and textile and clothing
industries, which are shown in Figure 9.
This manufacturing comparison was done as manufacturing represents a significant proportion of
income and employment for the region. Manufacturing activity is a key determinant for industrial
land demand and therefore cannot be excluded from in-depth analysis regardless of the LQ for the
industry.
0.0
1.0
2.0
3.0
4.0
5.0
6.0
7.0
8.0
9.0
Agriculture Services to Agriculture Hunting &
Trapping
Forestry and Logging
Commercial Fishing
Agriculture Undefined
2001 2006
Southern Tasmania Industrial Land Study / Stage 1 Report
20110171 Southern Tasmania Industrial Land Study (FINAL 120416)
P. 19
Figure 9 Manufacturing Location Quotients for the Southern Tasmania, 2001
& 2006
* Compared to Australia
Source: ABS, Census (2001 and 2006)
Following the identification of the regional LQ’s relative to Australia a further breakdown of local
government areas (LGA’s) within the study area reveals which LGA’s contribute to these
comparative advantages and in what way.
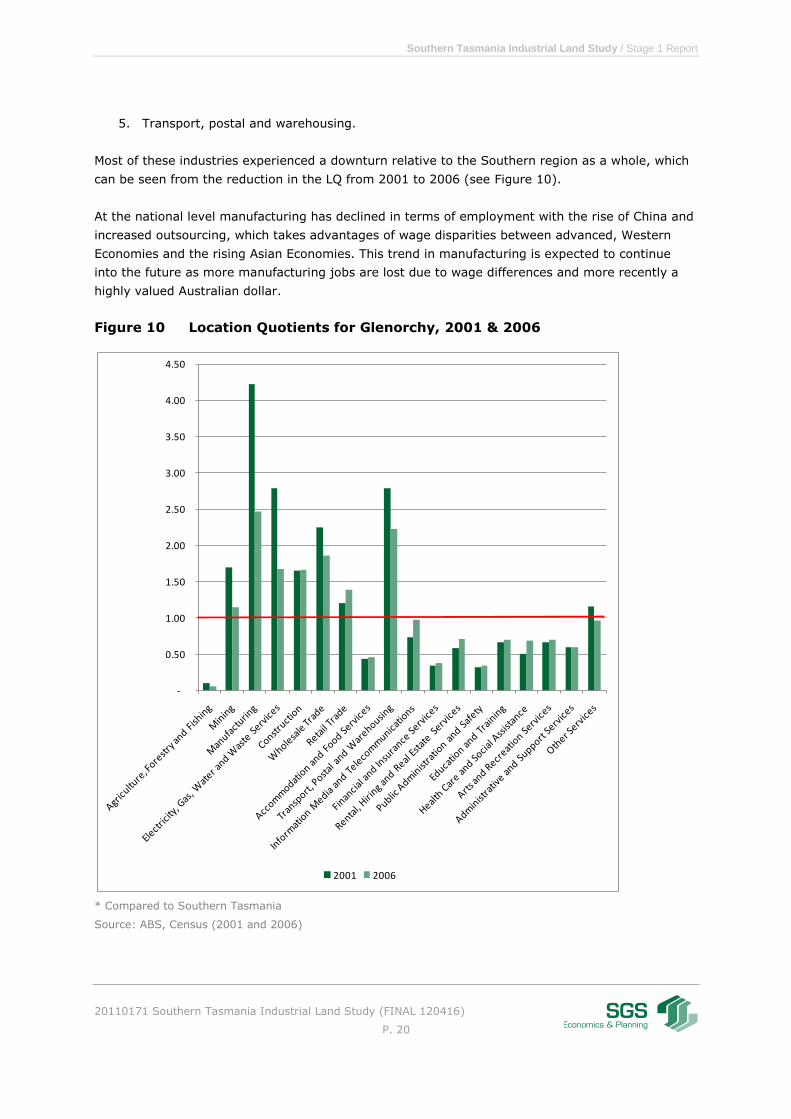
Glenorchy
Glenorchy continues to be the industrial centre of Southern Tasmania as a whole. Key industries in
the municipality are:
1. Manufacturing;
2. Electricity, gas, water and waste services;
3. Construction;
4. Wholesale trade, and
0.0
0.5
1.0
1.5
2.0
2.5
2001 2006
Southern Tasmania Industrial Land Study / Stage 1 Report
20110171 Southern Tasmania Industrial Land Study (FINAL 120416)
P. 20
5. Transport, postal and warehousing.
Most of these industries experienced a downturn relative to the Southern region as a whole, which
can be seen from the reduction in the LQ from 2001 to 2006 (see Figure 10).
At the national level manufacturing has declined in terms of employment with the rise of China and
increased outsourcing, which takes advantages of wage disparities between advanced, Western
Economies and the rising Asian Economies. This trend in manufacturing is expected to continue
into the future as more manufacturing jobs are lost due to wage differences and more recently a
highly valued Australian dollar.
Figure 10 Location Quotients for Glenorchy, 2001 & 2006
* Compared to Southern Tasmania
Source: ABS, Census (2001 and 2006)
-
0.50
1.00
1.50
2.00
2.50
3.00
3.50
4.00
4.50
2001 2006
Southern Tasmania Industrial Land Study / Stage 1 Report
20110171 Southern Tasmania Industrial Land Study (FINAL 120416)
P. 21
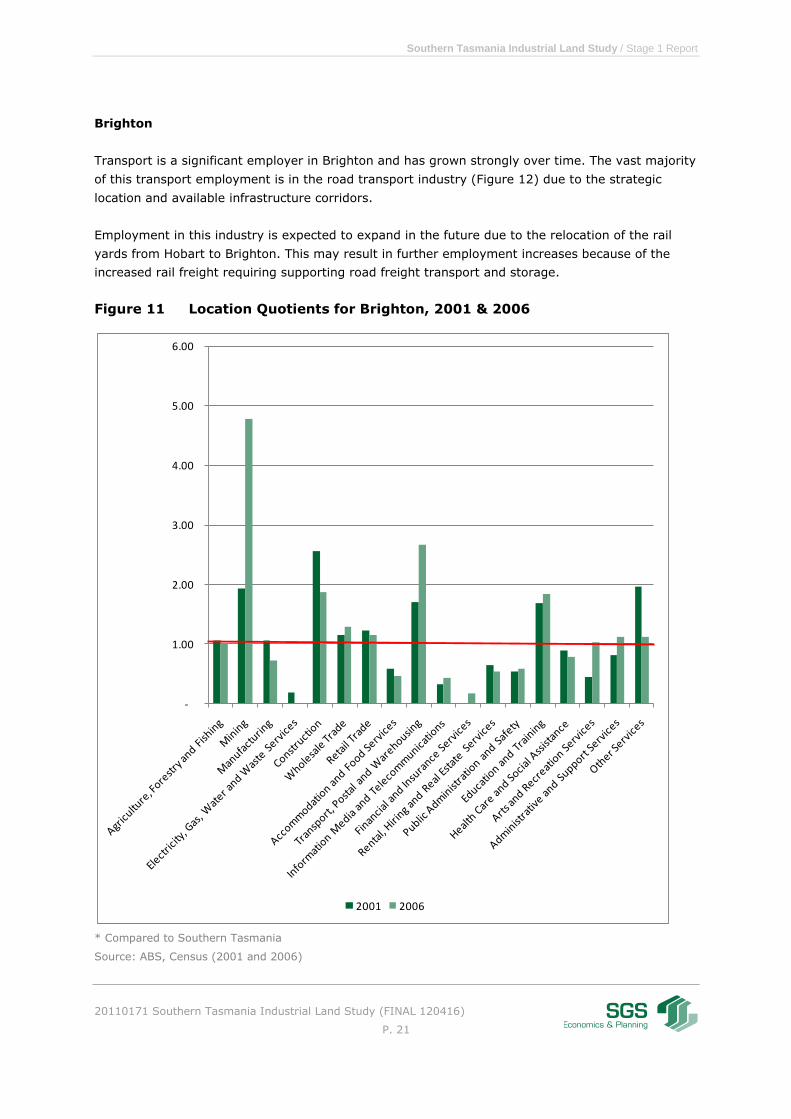
Brighton
Transport is a significant employer in Brighton and has grown strongly over time. The vast majority
of this transport employment is in the road transport industry (Figure 12) due to the strategic
location and available infrastructure corridors.
Employment in this industry is expected to expand in the future due to the relocation of the rail
yards from Hobart to Brighton. This may result in further employment increases because of the
increased rail freight requiring supporting road freight transport and storage.
Figure 11 Location Quotients for Brighton, 2001 & 2006
* Compared to Southern Tasmania
Source: ABS, Census (2001 and 2006)
-
1.00
2.00
3.00
4.00
5.00
6.00
2001 2006

Southern Tasmania Industrial Land Study / Stage 1 Report
20110171 Southern Tasmania Industrial Land Study (FINAL 120416)
P. 22
Figure 12 Employment in Transport Industry of Brighton, 2006
Source: ABS, Census (2006)
0%
20%
40%
60%
80%
100%
120%
Road Transport
Rail Transport
Water Transport
Air and Space
Transport
Other Transport
Services to Transport
Storage Transport and
Storage,
undefined
Southern Tasmania Industrial Land Study / Stage 1 Report
20110171 Southern Tasmania Industrial Land Study (FINAL 120416)
P. 23
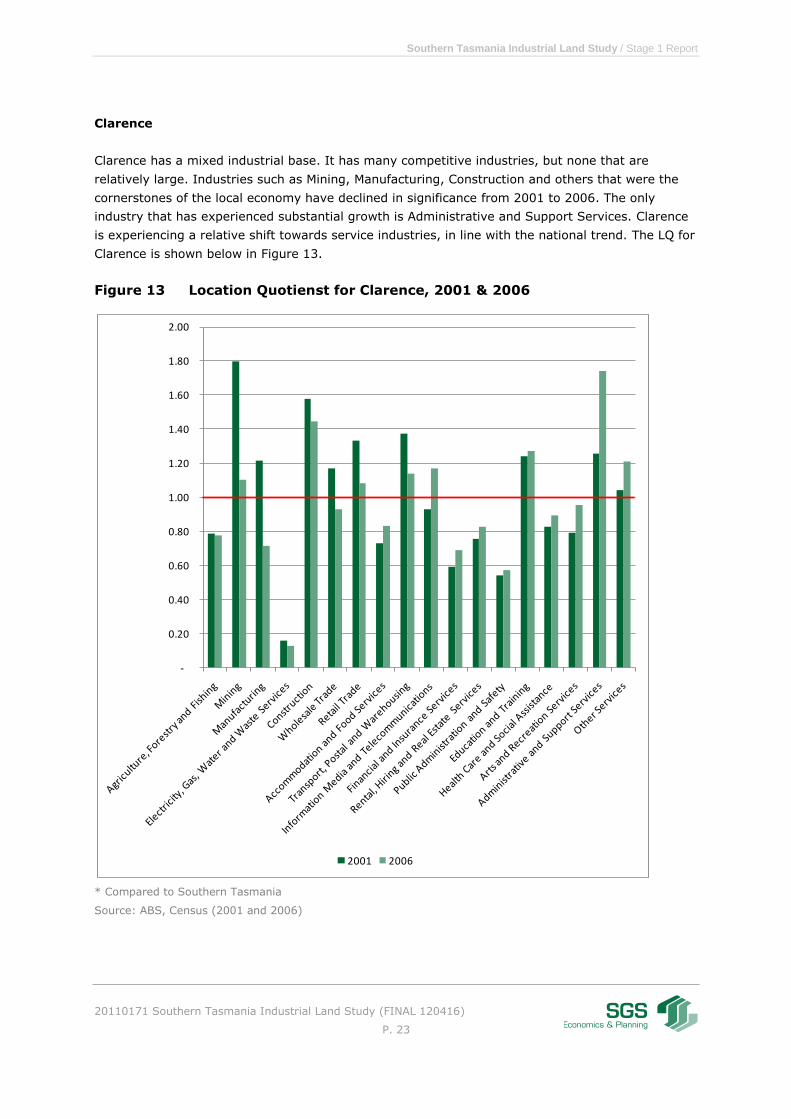
Clarence
Clarence has a mixed industrial base. It has many competitive industries, but none that are
relatively large. Industries such as Mining, Manufacturing, Construction and others that were the
cornerstones of the local economy have declined in significance from 2001 to 2006. The only
industry that has experienced substantial growth is Administrative and Support Services. Clarence
is experiencing a relative shift towards service industries, in line with the national trend. The LQ for
Clarence is shown below in Figure 13.
Figure 13 Location Quotienst for Clarence, 2001 & 2006
* Compared to Southern Tasmania
Source: ABS, Census (2001 and 2006)
-
0.20
0.40
0.60
0.80
1.00
1.20
1.40
1.60
1.80
2.00
2001 2006

Southern Tasmania Industrial Land Study / Stage 1 Report
20110171 Southern Tasmania Industrial Land Study (FINAL 120416)
P. 24
Hobart
Being the capital of Tasmania there is a high concentration of public administration and advanced
business services in the city. This is evident in the LQ analysis below (Figure 14). These services
have grown in share over the study period (2001-2006). Transport has decreased dramatically
over the study period and is expected to decrease further as the rail yards are relocated to
Brighton in the near future.
As a city, which is becoming increasingly service orientated, Hobart’s industries that require a lot of
affordable land, such as Manufacturing, are decreasing in their importance to the city’s economy.
Figure 14 Location Quotients for Hobart, 2001 & 2006
* Compared to Southern Tasmania
Source: ABS, Census (2001 and 2006)
-
0.20
0.40
0.60
0.80
1.00
1.20
1.40
1.60
1.80
2001 2006

Southern Tasmania Industrial Land Study / Stage 1 Report
20110171 Southern Tasmania Industrial Land Study (FINAL 120416)
P. 25
Kingborough
The economy of Kingborough changed over the study period. Traditional industries such as
Agriculture, Mining, Manufacturing and Construction have decreased significantly in their
importance to the regional economy. In contrast, the modern service based industries have grown
substantially, suggesting Kingborough is transforming into a more modern industrialised economy.
The LQ for Kingborough is shown in Figure 15.
Figure 15 Location Quotients for Kingborough, 2001 & 2006
* Compared to Southern Tasmania
Source: ABS, Census (2001 and 2006)
-
0.50
1.00
1.50
2.00
2.50
3.00
3.50
2001 2006
Southern Tasmania Industrial Land Study / Stage 1 Report
20110171 Southern Tasmania Industrial Land Study (FINAL 120416)
P. 26
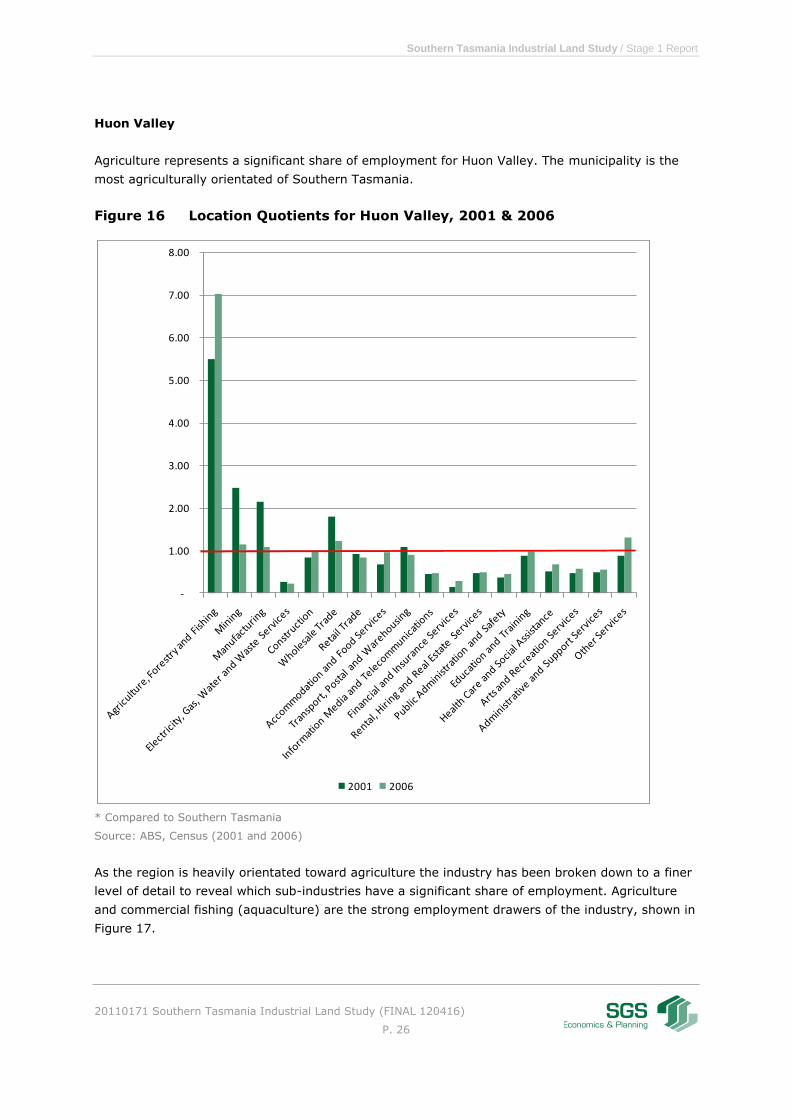
Huon Valley
Agriculture represents a significant share of employment for Huon Valley. The municipality is the
most agriculturally orientated of Southern Tasmania.
Figure 16 Location Quotients for Huon Valley, 2001 & 2006
* Compared to Southern Tasmania
Source: ABS, Census (2001 and 2006)
As the region is heavily orientated toward agriculture the industry has been broken down to a finer
level of detail to reveal which sub-industries have a significant share of employment. Agriculture
and commercial fishing (aquaculture) are the strong employment drawers of the industry, shown in
Figure 17.
-
1.00
2.00
3.00
4.00
5.00
6.00
7.00
8.00
2001 2006

Southern Tasmania Industrial Land Study / Stage 1 Report
20110171 Southern Tasmania Industrial Land Study (FINAL 120416)
P. 27
Commercial fishing which mostly consists of aquaculture is growing strongly all over Southern
Tasmania and it is expected to draw a greater share of employment in the future.
Figure 17 Distribution of Agricultural Employment in Huon Valley, 2006
Source: ABS, Census (2006)
0%
10%
20%
30%
40%
50%
60%
Agriculture Services to Agriculture Hunting &
Trapping
Forestry and Logging
Commercial Fishing
Agriculture Undefined
Southern Tasmania Industrial Land Study / Stage 1 Report
20110171 Southern Tasmania Industrial Land Study (FINAL 120416)
P. 28
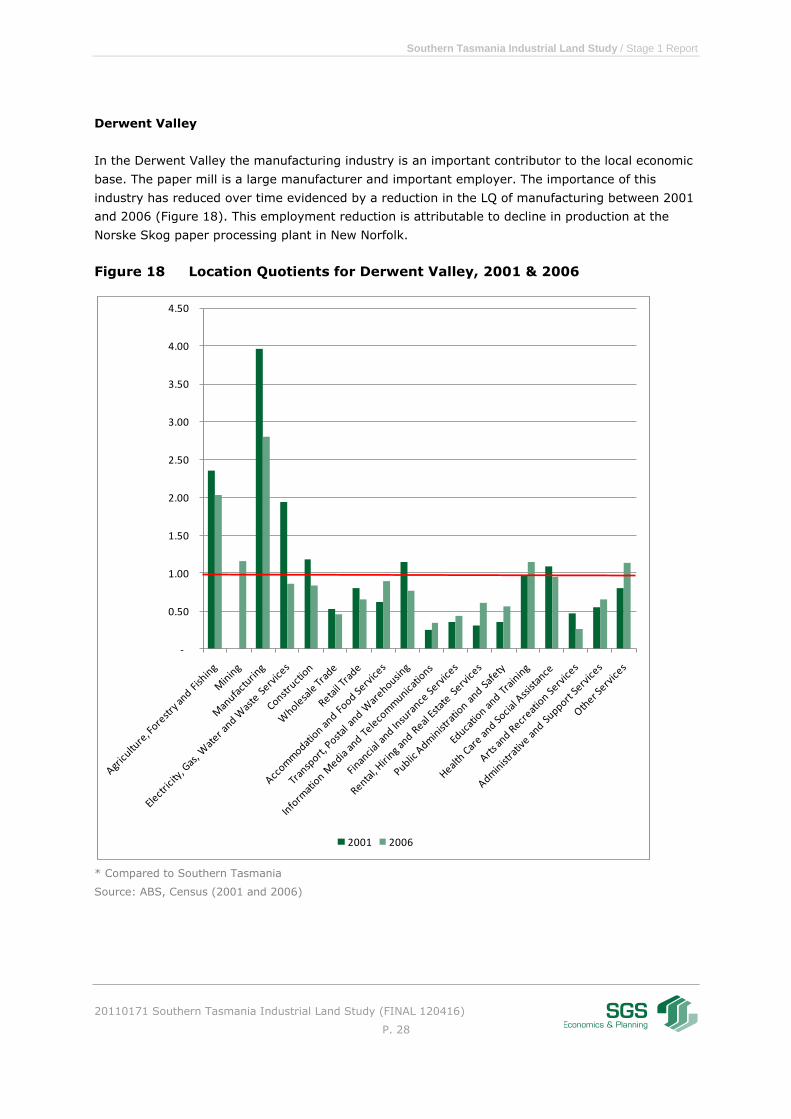
Derwent Valley
In the Derwent Valley the manufacturing industry is an important contributor to the local economic
base. The paper mill is a large manufacturer and important employer. The importance of this
industry has reduced over time evidenced by a reduction in the LQ of manufacturing between 2001
and 2006 (Figure 18). This employment reduction is attributable to decline in production at the
Norske Skog paper processing plant in New Norfolk.
Figure 18 Location Quotients for Derwent Valley, 2001 & 2006
* Compared to Southern Tasmania
Source: ABS, Census (2001 and 2006)
-
0.50
1.00
1.50
2.00
2.50
3.00
3.50
4.00
4.50
2001 2006

Southern Tasmania Industrial Land Study / Stage 1 Report
20110171 Southern Tasmania Industrial Land Study (FINAL 120416)
P. 29
Figure 19 Distribution of Manufacturing Employment in Derwent Valley, 2006
Source: ABS, Census (2001 and 2006)
The other section of Derwent Valleys economy the relatively out performs the southern councils is
agriculture. Much like the Manufacturing industry explained above, agriculture is no longer as
important to the area in 2006 as it was in 2001. Breaking the agricultural industry down to the
next level reveals that there is a significant proportion of forestry and logging within the region.
0%
10%
20%
30%
40%
50%
60%
70%
80%
90%
100%
Food,Bevrge & Tobcco Mfg
Txtl Clthg Ftwr & Lthr Mfg
Wood & Paper Prod Mfg
Prntg,Publshg & Recorded
Media
Petrlm Coal Chmcl & Ass
Prod Mfg
Non-Metalic Minl Prod Mfg
Metal Product Manufacturing
Machinery & Equipment Mfg
Other Manufacturing
Manufacturing, undefined

Southern Tasmania Industrial Land Study / Stage 1 Report
20110171 Southern Tasmania Industrial Land Study (FINAL 120416)
P. 30
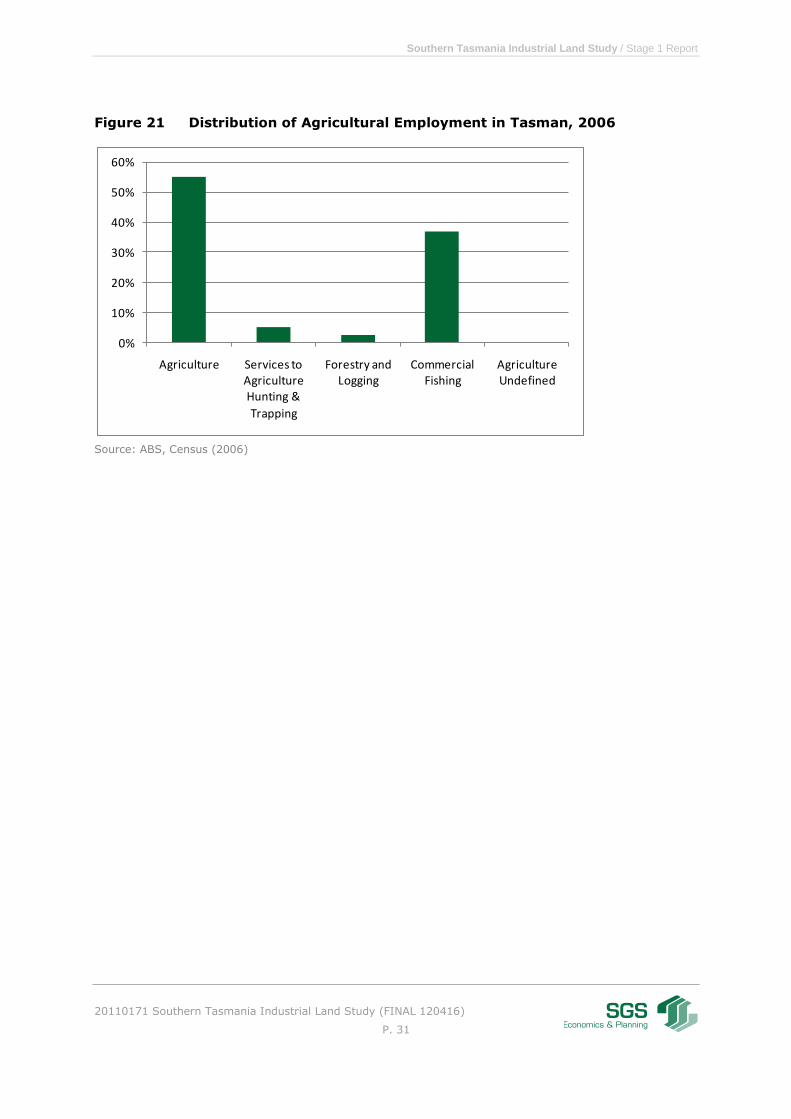
Tasman
Tasman municipality too has a strong agricultural sector within which aquaculture plays a key role.
A significant share of the municipalities in the Southern region is agriculturally oriented.
Figure 20 Location Quotients for Tasman, 2001 & 2006
* Compared to Southern Tasmania
Source: ABS, Census (2001 and 2006)
Tasman is not the only municipality that has relative strength in agriculture; others include the
Central Highlands, Glamorgan, Huon Valley, Sorell and Southern Midlands. Tasman has a strong
and growing aquaculture industry, shown in Figure 21.
-
1.00
2.00
3.00
4.00
5.00
6.00
2001 2006
Southern Tasmania Industrial Land Study / Stage 1 Report
20110171 Southern Tasmania Industrial Land Study (FINAL 120416)
P. 31
Figure 21 Distribution of Agricultural Employment in Tasman, 2006
Source: ABS, Census (2006)
0%
10%
20%
30%
40%
50%
60%
Agriculture Services to Agriculture Hunting &
Trapping
Forestry and Logging
Commercial Fishing
Agriculture Undefined

Southern Tasmania Industrial Land Study / Stage 1 Report
20110171 Southern Tasmania Industrial Land Study (FINAL 120416)
P. 32
Southern Midlands
The local economy of the Southern Midlands too is driven by a strong agricultural sector. The figure
below shows the strong concentration of employment in the agricultural sector. It is foreshadowed
that the roll-out of the regional irrigation scheme will further strengthen the sector in the future. As
with the other councils, employment in forestry would have dropped since 2006. Transport and
warehousing is another important industrial activity.
Figure 22 Location Quotients for Southern Midlands, 2001 & 2006
* Compared to Southern Tasmania
Source: ABS, Census (2001 and 2006)
-
1.00
2.00
3.00
4.00
5.00
6.00
7.00
8.00
9.00
2001 2006
Southern Tasmania Industrial Land Study / Stage 1 Report
20110171 Southern Tasmania Industrial Land Study (FINAL 120416)
P. 33
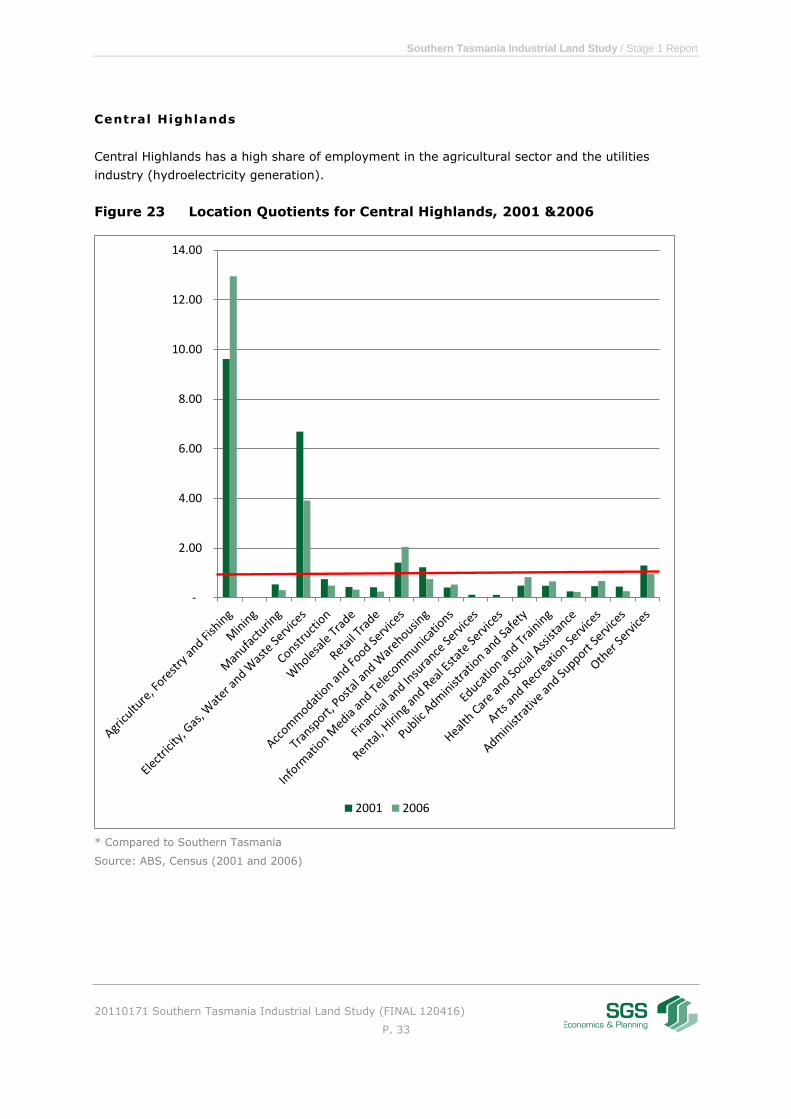
Central Highlands
Central Highlands has a high share of employment in the agricultural sector and the utilities
industry (hydroelectricity generation).
Figure 23 Location Quotients for Central Highlands, 2001 &2006
* Compared to Southern Tasmania
Source: ABS, Census (2001 and 2006)
-
2.00
4.00
6.00
8.00
10.00
12.00
14.00
2001 2006

Southern Tasmania Industrial Land Study / Stage 1 Report
20110171 Southern Tasmania Industrial Land Study (FINAL 120416)
P. 34
Sorell
Sorell has a fairly diversified economy. Important industries are agriculture, manufacturing (food
processing), construction, wholesale and retail trade.
Figure 24 Location Quotients for Sorell, 2001 & 2006
* Compared to Southern Tasmania
Source: ABS, Census (2001 and 2006)
-
0.50
1.00
1.50
2.00
2.50
3.00
2001 2006

Southern Tasmania Industrial Land Study / Stage 1 Report
20110171 Southern Tasmania Industrial Land Study (FINAL 120416)
P. 35
Glamorgan-Spring Bay
The economy of Glamorgan-Spring Bay is highly specialised in agriculture, forestry and fishing and
accommodation and food services (reflecting the tourism industry).
Figure 25 Location Quotients for Glamorgan-Spring Bay, 2001 & 2006
* Compared to Southern Tasmania
Source: ABS, Census (2001 and 2006)
-
1.00
2.00
3.00
4.00
5.00
6.00
2001 2006

Southern Tasmania Industrial Land Study / Stage 1 Report
20110171 Southern Tasmania Industrial Land Study (FINAL 120416)
P. 36
2.2.2 Turnover and production
Changes to industrial land demand are ultimately contingent on which industries are performing
well and those that are underperforming or in outright decline. Monitoring changes in the turnover
of industries reveals those industries that are doing well and which are in decline, thus allowing a
robust indication of which industries may require more land for industrial purposes in the future.
Overall changes in turnover for the region during the financial years of 2007-2008 and 2008-2009
were positive with the region experiencing an estimated 8% growth in turnover. This positive
change was not shared by all industries. Table 4 shows the change in turnover for all industries at
the broad level.
Table 3 Estimated Industry Growth in Turnover, 2007-08 to 2008-09
* Turnover estimates are based on number of businesses per turnover category and the mean turnover per
business for each category.
Source: SGS (2011), based on ABS (cat no. 8165.0)
The Global Financial Crisis had its peak economic impact in the last quarter of 2008 when
international credit markets froze and uncertainty was strangling economies. The second financial
Industry
Turnover
07-08
(Thousands)
Turnover
08-09
(Thousands)
Change
Agriculture, Forestry and Fishing 351,675$ 370,300$ 5.3%
Mining 413$ 1,275$ 209.1%
Manufacturing 118,125$ 129,825$ 9.9%
Electricity, Gas, Water and Waste Services -$ 938$ 0.0%
Construction 88,263$ 100,738$ 14.1%
Wholesale Trade 24,225$ 38,775$ 60.1%
Retail Trade 218,813$ 219,563$ 0.3%
Accommodation and Food Services 66,713$ 94,350$ 41.4%
Transport, Postal and Warehousing 46,613$ 52,313$ 12.2%
Information Media and Telecommunications 2,288$ 12,825$ 460.7%
Financial and Insurance Services 18,488$ 15,550$ -15.9%
Rental, Hiring and Real Estate Services 27,200$ 30,450$ 11.9%
Professional, Scientif ic and Technical Services 42,125$ 45,013$ 6.9%
Administrative and Support Services 5,288$ 3,638$ -31.2%
Public Administration and Safety 1,050$ 1,050$ 0.0%
Education and Training 788$ 750$ -4.8%
Health Care and Social Assistance 28,088$ 18,263$ -35.0%
Arts and Recreation Services 5,263$ 6,113$ 16.2%
Other Services 25,200$ 23,288$ -7.6%
Not Classif ied 10,988$ 3,725$ -66.1%
Total 1,081,600$ 1,168,738$ 8.1%

Southern Tasmania Industrial Land Study / Stage 1 Report
20110171 Southern Tasmania Industrial Land Study (FINAL 120416)
P. 37
year (08-09) included in the above table includes this period, thus capturing the changes to
industries during the Global Financial Crisis.
The following industries should be particularly noted given their strong turnover growth:
Agriculture, Forestry and Fishing (5%);
Manufacturing (10%);
Constructions (14%);
Wholesale trade (60%), and
Transport, Postal and Warehousing (12%).
It is important to note that manufacturing experiencing turnover growth does not necessarily
indicate an increase in employment within that industry. Industries in Australia, particularly in
manufacturing are becoming less labour intensive and increasingly orientated toward high-value
added products and processes. The figure below (Figure 26) illustrates this point as it shows a drop
in manufacturing employment in Tasmania between 2006-07 and 2008-09, whilst incomes from
sales and services increased. This trend is also seen at the national level.
Figure 26 Manufacturing employment and sales and service income in
Tasmania
Source: ABS, Cat,o. 8155.0
The regional economy was not immune to the forces of the Global Financial Crisis. Financial
institutions around the world experienced reductions in business activity due to uncertainty and
institutional insolvency. This many have contributed to the reduction in Financial Services of 16%
between the two comparison periods.
Using the above analysis of growth industries it is also informative to look at the shares of turnover
by industry to the regional economy, which will reveal the regions that contribute most to overall
turnover. Clearly, agriculture contributes the most to the regional economy, with 32% of the total
$-
$1,000
$2,000
$3,000
$4,000
$5,000
$6,000
$7,000
$8,000
$9,000
$10,000
0
5
10
15
20
25
30
2006–07 2007–08 2008–09
Employment ('000)
Sales and service income ($m)

Southern Tasmania Industrial Land Study / Stage 1 Report
20110171 Southern Tasmania Industrial Land Study (FINAL 120416)
P. 38
regional turnover. Most of the municipalities in Southern Tasmania are strongly agriculturally
oriented. The abundance of productive land in some areas leaves a large amount of land that can
be used for agricultural purposes, thus leading to the large share of production, shown in Figure 27
and explained above.
The urban centre of Hobart and to a lesser extent Glenorchy and Clarence represent by far the
largest share of turnover by LGA’s (see Table 4). Hobart, Glenorchy and Clarence collectively
represent the vast majority of turnover in the region. The urban areas are also home to many head
offices, including some larger agriculture, forestry and fishing businesses, such as Tassal.
Figure 27 Share of Turnover by Industry, 2008-09
Source: SGS (2011), based on ABS (cat no. 8165.0)
0%
5%
10%
15%
20%
25%
30%
35%

Southern Tasmania Industrial Land Study / Stage 1 Report
20110171 Southern Tasmania Industrial Land Study (FINAL 120416)
P. 39
Table 4 Share of Southern Councils Turnover, 2008-09
Source: SGS (2011), based on ABS (cat no. 8165.0)
Hobart, Glenorchy and Clarence represent over three quarters of regional turnover (illustrated in
Table 4).
2.2.3 Conclusions
Comparative analysis of employment by industry in the region and the local areas show the key
industries. The key growth industries have been identified to be agriculture, aquaculture,
manufacturing (food processing), wholesale trade and transport.
As the aquaculture industry matures there is likely to be additional land demand. Depending on the
level of expansion in this industry the supporting businesses in transport and manufacturing
(specifically food processing) may experience increased activity in some regions.
Growth in manufacturing is primarily driven by growth in productivity either by technological
adaptation or raising the skills of the workforce, with overall employment falling despite the growth
in turnover. The native logging industry in Southern Tasmania has been going through a period of
structural decline and repositioning. Wood processing and paper manufacturing have been
consequently affected. There are anecdotal signs the decline of the industry has levelled off.
Transport, especially within Brighton is predicted to experience sustained growth. Relocation of the
rail yards from Hobart to Brighton will further drive demand for land by transport and warehousing
businesses in the Brighton area.
LGA Proportion of Turnover Share
Brighton 1.8%
Clarence 12.4%
Derw ent Valley 1.0%
Glenorchy 25.2%
Hobart 43.6%
Kingborough 6.6%
Sorell 1.9%
Central Highlands 0.8%
Glamorgan/Spring Bay 1.4%
Huon Valley 4.0%
Southern Midlands 0.9%
Tasman 0.5%
Total 100.0%

Southern Tasmania Industrial Land Study / Stage 1 Report
20110171 Southern Tasmania Industrial Land Study (FINAL 120416)
P. 40
2.3 Industrial Land Use
As defined in the STCA Draft Land Use Strategy for Southern Tasmania (Draft 2011) Industrial
Activity is defined as:
“...the manufacturing, assembling, processing, storage and distribution of products and
goods. It can include wholesaling and retailing of goods and may include some uses
associated with primary production.”
There is a wide variety amongst industrial land uses in Southern Tasmania, with different focus on
industry scope. There is a mix of manufacturing businesses focusing on the processing of regional
produce, manufacturing for local industry and consumers, warehousing, depots and bulky goods
retailers. There is diversity in the scale and focus of the customers, for example there are local
service industries as well as export orientated industries. Each has different requirements that
require differing levels of infrastructure and land requirements.
2.3.1 Existing Industry Estates
As noted in Making the Right Connections: Industrial Land Availability there are currently nine
major export oriented industrial sites:
Boyer (Norske Skøg – paper and pulp processing)
Whitestone Point, Austins Ferry (timber mills) currently under consideration to be
redeveloped, possibly for alternative uses
Claremont (Cadbury – chocolate manufacturing)
Prince of Wales Bay, Glenorchy (Incat – catamaran construction)
Lutana (Nyrstar – Zinc Processing)
Margate/Electrona in Kingborough (ship building & aquaculture)
Southwood, Huon Valley (Integrated timber processing project –veneer mill)
Triabunna (Wood chip mill and port facilities), which has recently been sold and may be
redeveloped in the medium term into a eco-tourism destination2
Brighton Transport Hub (new location of rail yards, intermodal hub)
Other industrial estates are spread throughout the region. The following map (Figure 28) highlights
the key existing industrial estates in Southern Tasmania.
2 http://www.theage.com.au/national/greenies-buy-woodchip-mill-20110713-1he6h.html?from=age_sb

Southern Tasmania Industrial Land Study / Stage 1 Report
20110171 Southern Tasmania Industrial Land Study (FINAL 120416)
P. 41
Figure 28 Industrial Estates in Southern Tasmania
Source: SGS (2011)
There is nearly 3,500 hectares of industrial zoned land in Southern Tasmania. Table 5 is an
overview of all the industrial estates and their total land areas. The data is sourced from the Valuer
General’s land use database.
Table 5 Industrial Precincts in Southern Tasmania, by land area
(see next page)

Southern Tasmania Industrial Land Study / Stage 1 Report
20110171 Southern Tasmania Industrial Land Study (FINAL 120416)
P. 42
Municipality Precinct hectares
Bridgewater Boral Quarry 234
Brighton Industrial Hub 322
Cove Hill 68
Clarence Cambridge (incl Kennedy Dr) 257
Mornington 115
Risdon Vale (Scotts Road) 158
Rokeby (Droughty Point Rd) 87
Seven Mile Beach 85
Central Highlands Bothwell 16
Derwent Valley Boyer (paper mill) 710
Maydena 30
New Norfolk 19
Glenorchy Austins ferry (Whitestone Drive) Closed, may be rezoned 36
Claremont (Cadbury) 34
Derwent Park includes Nyrstar 92
Dowsing Point (Technology Park) 13
Glenorchy (dispersed sites) 67
Goodwood 7
Montrose 6
Moonah 54
New Town (incl part of Selfs Point) 6
Glam. Spring Bay Bicheno (the Gulch) 68
Swansea 10
Triabunna (woodchip mill and remaining
strial)
97% is woodchip mill site 395
Hobart New Town / Selfs Point 21
North Hobart 5
Regatta Point (Queens Domain) 29
Sullivans Cove (including Macquarie Point
Wharf)
47
Huon Valley Cygnet 37
Dover 37
Geeveston 42
Huonville and remainder 36
Port Huon 62
Kingborough Baretta 9
Electrona (Pothana Road) 34
Huntingfield 22
Kingston (Firthside plus Tinderbox) 11
Margate 32
Southern Midlands Oatlands 23
Sorell Carlton (Joseph Road) 2
Dunalley 0
Sorell (Giblin Drive) 5
Tasman Nubeena (incl White Beach) 67
TOTAL 3,409

Southern Tasmania Industrial Land Study / Stage 1 Report
20110171 Southern Tasmania Industrial Land Study (FINAL 120416)
P. 43
* Includes Ranelagh, Grove, Glen Huon and Southport. Excludes Southwood which is not industrial zoned land Source: Valuer General’s land use database (2011)
2.3.2 Opportunities and Challenges
There are a number of key issues in providing new industrial land and development of associated
industries. These include land use conflicts, environmental challenges, population and employment
challenges and emerging trends in the industry.
Land Use Conflicts
As discussed in Clarence City Industrial Development Strategy, Brighton Structure Plan, Huon
Valley Land Use and Development Strategy and the STCA Draft Land Use Strategy, some currently
zoned industrial areas and potential locations face a number of land use conflicts. This includes
proximity to existing residential areas, poor geography and isolation from resources and transport
connections. In existing and historic areas of industrial land zones, there is often a conflict with
nearby residential and commercial areas. Historically, industrial sites were planned close to labour
resources, i.e. urban areas. Over time, the urban areas expanded and grew even closer around
industrial sites, which were often used for heavy manufacturing. The historical sites are therefore
mostly limited in terms of potential development and expansion of industrial land and uses. This
conflict is particularly evident in Glenorchy and Hobart.
In a number of locations further development of industry is inappropriate due to local topography,
as industrial land requires flat land or land that is not too steep. Generally speaking, the average
site slope should not exceed 10%.
Climate Change
A key issue facing the region is that presented by the changing climate. This is highlighted in The
Regional Land Use Strategy for Southern Tasmania as well as a number of other strategic
documents. Some of the key changes include rise of sea-level, water availability and changes to
local flora and fauna. With upcoming initiatives this might change the suitability of heavy polluting
industries but might also present key opportunities through the investment and development of
cleaner energy infrastructure. There is also a potential for changes to expand agricultural
production stemming from change in temperatures and changes in rainfall patterns, which might
affect local food processing and manufacturing plants. Further, under climate change scenarios
Tasmania is projected to be less affected by droughts and extreme weather events than many
mainland agricultural areas. This would make Tasmania comparatively more attractive for
agricultural production. Anecdotal evidence suggests more producers are expanding their
production to Tasmania.

Southern Tasmania Industrial Land Study / Stage 1 Report
20110171 Southern Tasmania Industrial Land Study (FINAL 120416)
P. 44
Regional Irrigation Schemes
The roll-out of the regional irrigation schemes in Tasmania has the ability to transform extensive
agricultural areas into intensive agricultural areas. Although this development is expected to affect
the northern parts of the State more than the South, the Southern Midlands are expected to
benefit particularly as well as parts of Clarence and Sorell. One of the positive flow-on effects will
be increased food and beverage processing and increased transport and storage of farm produce.
Proposed Industry Locations
A number of reviewed documents and strategies identify proposed locations for new industrial
zoned land. This includes:
Clarence (Kennedy Road and adjacent to the Hobart International Airport)
Brighton (New industrial park adjacent to new Intermodal Transport Hub)
Huon Valley (Potential for new industrial land in Huonville – as identified Huon Valley Land
Use and Development Strategy)
Significant growth is expected in a number of key locations due to their strategic position. This
includes the proposed rezoning of land in Kennedy Road area adjacent to the Hobart International
Airport, where industry can leverage off the strategic advantage of the proximity to the Airport for
time sensitive and high value goods.
Demand for industrial land adjacent to the Brighton Freight/Transport Hub is expected to remain
strong due to the locational advantages offered at the intermodal hub.
Emerging Trends and Types of Industry
There have been a range of structural changes in the traditional light and heavy manufacturing
sectors in Australia that have occurred over the past 20 years. Some of these changes and trends
are expected to continue in the coming years. These changes include the focus on higher value
products, emphasis on co-location and clustering of industry, changes in development pattern and
changes in industry.
Industry restructuring has and may continue to affect the size of the wood processing industry.
Gunns, traditionally a key manufacturing in this industry has shifted its focus towards plantation
forestry. As a result the growth and size of the timber industry in Southern Tasmania has seen
dramatic change in recent years, as exemplified by the issues relating to the Triabunna site and the
closure of the Austins Ferry (Glenorchy) site.
Several other important trends are influencing demand for industrial land. An important trend has
been the relocation of large, heavy industrial and low value-added manufacturing activities to low
cost countries in the Asia-Pacific, while other industrial activities increasingly focus on high value
adding processes. Industries in Australia are becoming less labour intensive and focussed at high
value-adding processes.
Southern Tasmania Industrial Land Study / Stage 1 Report
20110171 Southern Tasmania Industrial Land Study (FINAL 120416)
P. 45
Another trend that has been visible for about twenty years is the establishment of groups of small
and medium sized, often specialised, firms that form clusters. In a geographic sense too, these
companies tend to cluster in order to facilitate just-in-time and flexible production and logistic
processes. These processes are often operating on a 24/7 basis. The maritime cluster in Prince of
Wales Bay is an example of an industrial cluster.
Co-location is becoming increasingly important for many industries. This is particularly important
through the breakdown of the vertically integrated companies to a series of independent companies
that value add at each step of a supply chain. Industry clustering allows the development of scale
and lower costs for industry, it also attracts employees and enables high value knowledge sharing
and industry innovation.
This trend has also resulted in the growth of the transport and logistics sector. Before, large
industrial conglomerates would operate the entire value-chain in-house. Now, increasingly the
value-chain comprises a range of small and specialised suppliers, in which transport and logistics
too have become a separate and recognisable link in the production chain.
Improved and stricter environmental and land use regulations have fostered the development of
industrial uses that are environmentally more sustainable.
Another trend should be added to this overview. At the metropolitan level there is a trend of
geographic replacement which involves high impact and transport oriented uses relocating to
strategically located sites at the fringes of urban systems. These strategic locations are on main
transport corridors, preferably multi-modal, and with sufficient buffer from residential and other
sensitive uses. The land they vacate is re-occupied by smaller scale often light industrial uses.
Historically, industries located near or in key urban centres with minimal or no buffer from
residential areas. Tighter environmental and pollution controls as well as improved strategic
planning with proper use and development standards continue to develop and to become more
prescriptive. As a result, it is becoming ever less attractive for manufacturing and transport-
oriented firms to locate within urban boundaries and residential areas. These industries increasingly
move to strategic locations at the fringes of urban systems.
This trend is clearly visible in the context of Greater Hobart, where Glenorchy has historically
fulfilled the role of the key industrial hub and to some extent continues to fulfil that role. With the
development of the Brighton Industrial Estate and the industrial estate in Cambridge and the
Airport Business Parks, many larger manufacturing, heavy impact and transport oriented firms are
establishing in these new areas, that are much better suited for the types of activities these firms
are associated with. As for Glenorchy, large and traditional manufacturing industries are one by
one relocating from the City to the fringe, overseas or closing down (often as a result of global
market pressures). Blundstone and Juicy Isle are two key examples, as well as the upcoming
closure of the Gunns plant in Austins Ferry. Other closures of manufacturing plants since the 1990s
in Glenorchy include Richardson Meats, ACI Glass, Textile Industries Australia, Humes, Stanley
Tools and Sanitarium (GCC, 2010).

Southern Tasmania Industrial Land Study / Stage 1 Report
20110171 Southern Tasmania Industrial Land Study (FINAL 120416)
P. 46
This geographic replacement trend opens up some opportunities for other industrial uses that
remain within the urban system: local service industries. Local service industries are population
driven: demand for construction, trades, car repair and other services are primarily driven by the
size of the local market, i.e. population.
Key residential concentrations, such as Glenorchy, are the preferred location for local service firms
because they provide close access to the market. Population profiles and projections help to
understand and quantify future demand for land for local service industries.
More demand for smaller and medium sized lots and opportunities for co -
location
To reflect recent changes in industry that has come through structural and international change,
industries are requiring different land and services to meet the changing needs of industries. As the
Industrial Activity report highlights there has been a reduced demand for larger industrial sites,
with increased use of technology. This has also resulted in lower demand for labour due to
technological innovation and productivity gains. It is also noted that many industrial uses also
require on-site ancillary functions, such as a head office and sales, functions that are non-
industrial.
The aquaculture in Huon Valley and Kingborough has developed to niche and high value export
orientated products that. Currently aquaculture industry is dispersed with some processing plants
in the Huon Valley, Margate and Cambridge near the airport. The ongoing development of this
industry may require the development of industrial land in Huon, Channel and Kingborough areas.
Growth industries will continue to be the food and beverage processing industry, and provide a
strong base for regional manufacturing. Typically this is focussed on regional produce and located
near the produce. Some processing industries will continue to be located on farm properties where
the produce is grown, while other such as the Cadbury processing plant will be located in regionally
strategic locations.
2.3.3 Industrial Land Use Patterns
Local service industries are primarily population driven. Demographic changes and trends in
income and household expenditure patterns largely determine the growth of these industries and
consequently, their demand for industrial land.
Export industries involve industries that export their products to outside the region; to other parts
of the state, to the mainland or overseas. Export oriented industries, and their demand for land,
are largely driven by national and global market opportunities and international terms of trade. It
includes; most primary product processing and basic material processing, larger scale or
specialised manufacturing, and larger centralised distribution hubs. Export oriented industries
include support industries and services to export industries.

Southern Tasmania Industrial Land Study / Stage 1 Report
20110171 Southern Tasmania Industrial Land Study (FINAL 120416)
P. 47
Location requirements and preferences of local service industries and export oriented industries
vary. While local service industries tend to locate close to their market, export oriented industries
favour strategically positioned locations close to a skilled labour force, transport corridors,
resources or inputs. Lot area requirements differ between local service and export oriented
industries as well, with the latter generally requiring larger lots. Location and land requirements
also vary by type of industrial activity. Land use planning for local service industries should
primarily take place at the local level. It is however important for municipalities to understand what
is happening in nearby Council and cooperation is important. This is especially true in urbanised
areas where some Council’s may not be able to accommodate demand within their municipality,
resulting in local service industries spilling over into nearby areas.
Local service industries would generally be located in locally and regionally significant clusters while
traditional export oriented industries tend to operate from ‘sites of major industrial activity’.
Increasingly however, export oriented industrial firms are small and medium-sized firms and firms
with activities that are of a light industrial nature. These export oriented firms may not need to
locate at sites that are suitable for major impact or heavy industrial production.
Planning for major export oriented industries can be complex. Land demand by major export
oriented industries is both infrequent and unpredictable. It is infrequent in the sense that it
involves one-off major investments that may only occur once every ten or twenty years. It is
unpredictable in the sense that it is uncertain exactly when this demand will occur. Rezoning
extensive areas of land in anticipation of demand that may or may not materialise may be an
inefficient approach. A more cost-effective approach would be to identify potential locations for
industrial land zoning, so as to ensure the land is available for rezoning and in the interim used in a
way that does not prevent future industrial use. Further, it is important to ensure planning
processes run smoothly and as quickly as possible in order to effectively accommodate demand
when it occurs.
In general terms, land and location requirements are as follows:
Local service industries will be accommodated on locally-significant industrial estates.
These estates would generally be close to major population centres with good access to
arterial roads. The land parcels would be small, generally up to 1,000 to 2,000 sqm. The
land needs to be affordable.
Small and medium sized export oriented industries increasingly operate in clusters, depend
on just-in-time supply chains and include non-industrial elements such as R&D,
administration and marketing. These industries are best located on regionally significant
industrial estates, with good access to key road, rail and air transport as well as an
adequately educated workforce. Some uses may require buffer from sensitive uses
although most activities would classify as light industrial. Land lots would range from small
(<500 sqm) to medium (5 hectares) and some large lots of 5 hectares and more.
o To various degrees of success local and regional governments in partnerships with
private parties have developed industry parks to foster economic growth. There are
many examples of business and science parks and ‘theme’ oriented clusters that
have been set up with a strategic aim to foster innovation, incubation and industry

Southern Tasmania Industrial Land Study / Stage 1 Report
20110171 Southern Tasmania Industrial Land Study (FINAL 120416)
P. 48
maturing (Witte & McDougall, 20103). The Techno Park in Glenorchy is the only
example in Tasmania of a somewhat successful incubator park. Since its’
establishment it has now reached a mature stage and is home to established
businesses.
o Some successful clusters have established themselves around one or two
innovative and growing firms that required their suppliers and service deliverers
close-by in order to manage innovative, customer-focused production chains.
Often, these clusters have started small and once their merit was recognised,
formal systems of Government support get established in order to further prosper
and mature the industry. The Silicon Valley is the best known example world-wide.
The maritime cluster in Prince of Wales Bay is probably Tasmania’s best example.
Traditional large-scale export oriented industries have quite literally lost ground over the
last few decades. Many industries have closed down or moved to countries with low labour
costs, most notably China, South Korea, Thailand, India and Malaysia. These industries
tend to locate on large scale industrial lots with sufficient area to allow for growth and
sufficient buffer from sensitive uses. The lots tend to be located close to the resource base,
close to labour and/or close to strategic points in the transport chain. Close to the
resource, these industries may be located on rural or special purpose zoned land.
Apart from being local service oriented or export oriented, location and site requirements vary
considerable by type of industry as well: a warehouse has other site considerations than, for
instance a mineral processing plant.
The overview (over page, Table 6) shows the key site and location requirements for different types
of industries. The table has been adapted to reflect specific aspects of Southern Tasmanian
situation.
3 Witte, E. & A. McDougall (2010), “Knowledge Hubs, Innovation Precincts, Technology
Parks, Employment Centres – Whatever label you want – They’re much more than real estate projects.” In: Economic Development Australia (EDA) Volume 4, Number 3.
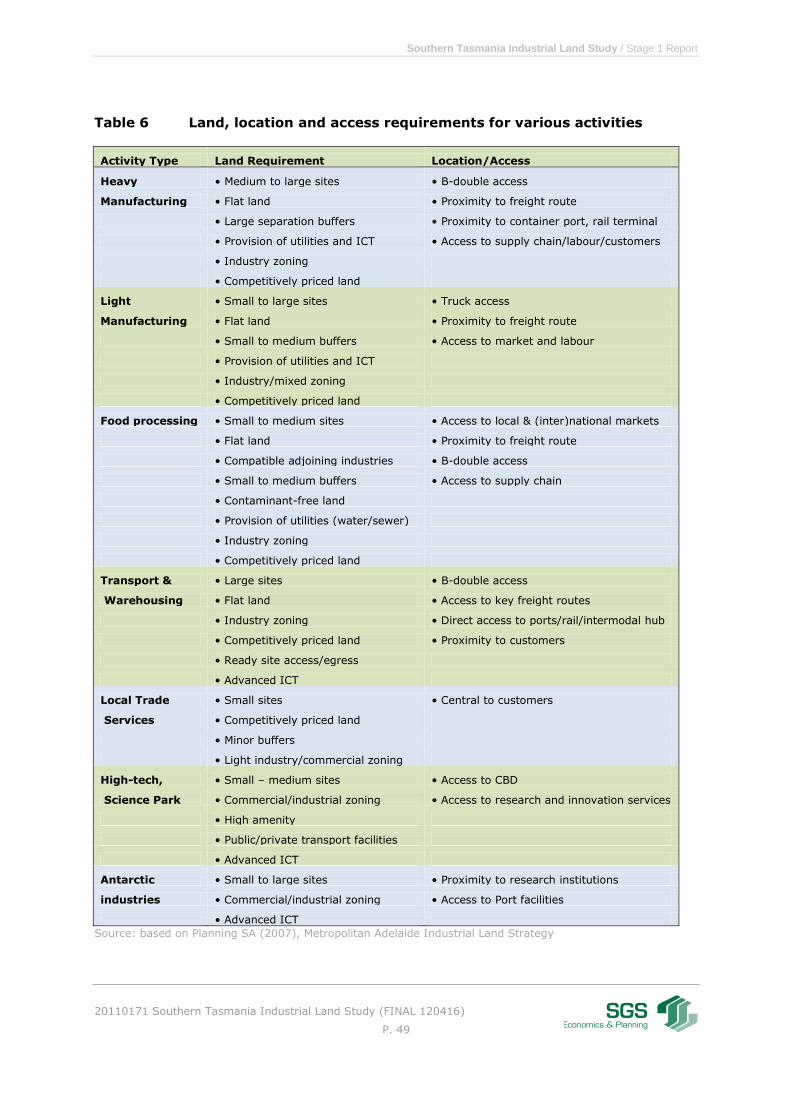
Southern Tasmania Industrial Land Study / Stage 1 Report
20110171 Southern Tasmania Industrial Land Study (FINAL 120416)
P. 49
Table 6 Land, location and access requirements for various activities
Activity Type Land Requirement Location/Access
Heavy • Medium to large sites • B-double access
Manufacturing • Flat land • Proximity to freight route
• Large separation buffers • Proximity to container port, rail terminal
• Provision of utilities and ICT • Access to supply chain/labour/customers
• Industry zoning
• Competitively priced land
Light • Small to large sites • Truck access
Manufacturing • Flat land • Proximity to freight route
• Small to medium buffers • Access to market and labour
• Provision of utilities and ICT
• Industry/mixed zoning
• Competitively priced land
Food processing • Small to medium sites • Access to local & (inter)national markets
• Flat land • Proximity to freight route
• Compatible adjoining industries • B-double access
• Small to medium buffers • Access to supply chain
• Contaminant-free land
• Provision of utilities (water/sewer)
• Industry zoning
• Competitively priced land
Transport & • Large sites • B-double access
Warehousing • Flat land • Access to key freight routes
• Industry zoning • Direct access to ports/rail/intermodal hub
• Competitively priced land • Proximity to customers
• Ready site access/egress
• Advanced ICT
Local Trade • Small sites • Central to customers
Services • Competitively priced land
• Minor buffers
• Light industry/commercial zoning
High-tech, • Small – medium sites • Access to CBD
Science Park • Commercial/industrial zoning • Access to research and innovation services
• High amenity
• Public/private transport facilities
• Advanced ICT
Antarctic • Small to large sites • Proximity to research institutions
industries • Commercial/industrial zoning • Access to Port facilities
• Advanced ICT
Source: based on Planning SA (2007), Metropolitan Adelaide Industrial Land Strategy

Southern Tasmania Industrial Land Study / Stage 1 Report
20110171 Southern Tasmania Industrial Land Study (FINAL 120416)
P. 50
2.4 Infrastructure and Investments
The current provision of infrastructure in Southern Tasmania is mixed with areas that are well
serviced by the present needs of industry and other areas that require strategic investment in a
range of infrastructure. The infrastructure discussed in the reviewed documents includes roads,
railways, ports, Hobart Airport, water, electricity and communications.
The Southern Integrated Transport Plan aims to provide a strategy that will improve the efficiency
of regional transport. The Plan highlights the lack of regional linkages that presently exist. It is
highlighted that the Tasman and Arthur Highways are presently inadequate for the current needs of
freight and tourists. It is also highlighted that the location of industrial land is best situated at
accessible locations that have highway and railway access, and depending on the nature of use,
access to port facilities. Transport is an important cost element to industries through (in)efficiency
of logistical arrangements and the ability for workers to access and travel to employment.
As discussed in Background Report: Infrastructure it is noted that water reservoirs, waste water
and storm water systems will face a core challenge through the potential impacts from climate
change. This may involve temporary reduced supply in drinking water, and reliable water into
Hobart’s catchments. Waste water and storm water will face challenges from raised sea-levels
which may impact on effluent systems and their ability to transport waste offshore.
The current breakdown of energy from each source in Tasmania includes 73% from Hydro
Tasmania, 8% from Gas and 17% from Basslink power. Although current levels are healthy, recent
low water catchment levels showed the possible impacts in terms of reduced power production. The
current network is characterised by the large number of low capacity generators. Due to forecast
growth for power it is envisaged that one major sub-station will need to be constructed per year.
There are also other potential changes to the current operation of the network, including the
impact from a price on carbon emissions which might drive up demand in hydro power, potential
development of wind turbines and potential thermal overloading. To combat some current issues
with the network a new 220 kw transmission line has been proposed to connect Hobart provide a
better connection for energy.
As highlighted in Background Report Infrastructure communications faces significant investment
through the National Broadband Network (NBN) Initiative. This is currently under construction by
NBN Tasmania and plans to connect 200,000 homes in Tasmania to fibre optic or high-speed
broadband over the next 5 years. It is envisaged that this will significantly improve the
communication capacities for residents and businesses.
As noted in the Southern Integrated Transport Plan, 98% of Tasmania’s interstate export volume is
carried through sea cargo. The majority of freight activity occurs in the three northern ports of
Burnie, Devonport and Launceston. The freight to and from Southern Tasmania is transported by
road and rail to and from these northern ports via rail and the Midland Highway. The key transport
and storage hub will become the Brighton Transport Hub, once the rail yards relocate from Hobart
port to Brighton.

Southern Tasmania Industrial Land Study / Stage 1 Report
20110171 Southern Tasmania Industrial Land Study (FINAL 120416)
P. 51
The Review of Working Port of Hobart suggests Hobart Port remains a key element for
infrastructure in the region. The Antarctic and cruise sector as well as the servicing of the local
maritime fleet will remain the key drivers of the Port. The Port will accommodate growth in cruise
ships visiting Hobart, and sea travel and transport to and from the Antarctic. It is stated that new
development in the Port area should not compromise existing and future port operations.
Currently Tasmania’s freight is focused on the road network, with only 6% of freight transported by
rail. Roads are critically important for the transportation of goods as well as people for
employment. The key road connection between Southern Tasmania to the north and its ports is the
Midland Highway which enters Greater Hobart in Brighton. This makes that Brighton is ideally
located to act as a transport and industry hub. Some key developments include the concept to
construct a new Bridge at the current Bridgewater Bridge crossing. There are also some other road
improvements including new roundabouts and improvements to highway junction upgrades.
For freight movement the new integrated transport hub at Brighton already presents a significant
change in the movement of goods in the greater Hobart area. The hub will have integrated rail and
road access. The hub will help improve the efficiency of the rail freight network, with the slowest
section of infrastructure between Bridgewater Bridge and Macquarie Point becoming obsolete after
the hub is taken into operation (Brighton Transport Hub, Development Application).
The Tasmania Urban Passenger Transport report highlights the current passenger network which
provides an important component of the Greater Hobart transport network. A number of key issues
face the network including fare structure, dispersed suburbs and abundance of car parking and car
use. The fare structure currently charges by zone, the longer the distance the more the cost of the
journey; this is highlighted as created a disadvantage for residents in outer areas. This is coupled
to the dispersed land use patterns of suburbs and prevalent car use which makes providing a well
utilised public transport system difficult. It is acknowledged that the public transport system can
play an important role in reducing congestion and emissions that are caused by transport. One
proposal includes upgrading of the railway into a rapid transit system (as the relocations of the rail
yards will free up the line).
Some regional infrastructure issues as identified in the STCA land use strategy and background
reports include:
Southern Water indicates there are a number of source issues of regional significance,
including:
o A number of especially regional areas experience demands that exceed allocation
o Weaknesses in the central distribution system, including:
Demand in Kingborough that exceeds capacity to maintain water levels in
the Ridgeway Dam. This requires a new main. The construction of it which
will be constrained by existing buildings, infrastructure and the topography,
Demand for an additional transfer main in Margate to boost capacity with
potential expansion to Coningham and Kettering
o Low pressure and potential fire protection issues in elevated areas around Hobart
and fringe areas of Clarence.
There are capacity issues with wastewater, including:

Southern Tasmania Industrial Land Study / Stage 1 Report
20110171 Southern Tasmania Industrial Land Study (FINAL 120416)
P. 52
o Granton and Austins Ferry (trunk lines needed for demand)
o Treatment plants needed at Prince of Wales Bay, East Risdon, Rosny, Margate and
Blackman’s Bay
o Macquarie Point plant
o Taroona plant is overloaded
o East Risdon and Margate treatment plants currently exceed licensed flows
o Lack of stormwater drains across the city
o Many regional issues including need to relocate treatment sites to more appropriate
locations in tourist towns and at capacity waste treatment systems
It is also noted that key strategic roads require upgrading for future passenger and freight
tasks, this includes the Midland Highway.
Need for a second Hobart to Kingborough electricity transmission line to improve reliability,
security and ultimately the transmission supply to areas south of Hobart.
Rail improvements are required to carry increased freight loads.
Key investments by location include:
Brighton Freight and Transport Hub
$3.25 million to recurrent funding to Metro Tasmania to improve urban public transport
services
$750,000 each year to improve park and ride interchanges
Proposed upgrading of the Bridgewater Bridge
$190 million upgrade in the Midland Highway
$31.6 million for the Main North-South Line Rail Capacity improvements, this includes
curve and grade easing
$24 million for rail capacity improvements at Rhyndaston
$1.1 million for the upgrading of the Boyer Line
Investment in upgrades to the Hobart International Airport
Southern Tasmania Industrial Land Study / Stage 1 Report
20110171 Southern Tasmania Industrial Land Study (FINAL 120416)
P. 53
3 Demand for Industrial Land
This section reports on projections for industrial land demand over the next 5, 15 and 30 years.
The industrial land demand projections are based on recent research for the Department of
Economic Development, Tourism and the Arts (DEDTA).
The industrial land demand report containing the results of this research is the latest version and
follow-up on the Industrial Land Demand for Tasmania, Short to Medium Term Overview that was
undertaken in 2006 (with an update in 2008).
3.1 A Revised Methodology
Compared to the earlier research undertaken in 2006 and 2008, the methodology has been revised
on a number of key points. The revised industrial land demand projections only include land uses
that occupy industrial zoned land, and exclude industrial uses on for instance agricultural land, but
include land demand by bulky goods retailing which currently often locates on industrial land.
As a result of, the new industrial land demand projections do no longer include industrial uses on
agricultural properties and on mining and resource sites. The projections are for industrial zoned
land only. A grey area in that respect is bulky goods retailing. Whether this use should be provided
for on industrial zoned land is arguable, and is not determined within the scope of this study. The
land demand projections provide land demand estimates for bulky goods retailing as a separate
category.
This leads to the second major revision in methodology compared to the earlier study. Over the
last decade or so, SGS has collected and entered industrial land use ratios in a database. The data
stem from a range of previous studies by SGS on industrial land in metropolitan Melbourne, Sydney
and regional cities. The data shows that land use ratios (that is land area per employee) by
industry are fairly consistent between different locations. The application of these industry specific
data to Tasmania has enabled us to provide industrial land demand projections by four industry
categories:
o Local service industries, which are population driven;
o Export oriented industries, which are driven by market opportunities to export
to the mainland and overseas. The uptake of the irrigation schemes and resulting
agricultural transition and growth of export clusters are key determinants;
o Transport, warehousing and wholesales, which are intermediate industries
driven by both population and export growth and trend to gain higher efficiencies
with Just-in-Time (JiT) distribution processes. In the previous study this industry
was distributed between local service and export oriented industries;
o Bulky goods retailing is driven by population growth and the sector specific
characteristics most notably the matured life cycle of this subsector.
The previous study made a distinction between local service and export oriented industries only.

Southern Tasmania Industrial Land Study / Stage 1 Report
20110171 Southern Tasmania Industrial Land Study (FINAL 120416)
P. 54
The employment projections for local service industries and bulky goods retailing are assumed to
be driven by population growth and real income changes. The income projections are age specific
and take ageing of the population into account as well as the impacts of compulsory
superannuation. The employment projections for export oriented industries are driven by market
opportunities for Tasmanian export products. The rate of uptake of the irrigation schemes is a key
determinant. The employment projections for wholesale and trade are driven by both local
demographic changes (i.e. population growth and real income changes) and export trade.
3.2 Land demand Projections
Two scenarios were developed for projecting the future demand of industrial land in Tasmania over
the next 30 years. Both scenarios are based on plausible assumptions about the state’s future. One
scenario provides land estimates according to a low scenario and the other according to a high
scenario. The scenarios provide a range (between low and high) within which future actual land
demand is expected to lie.
The low scenario assumes that population growth will follow the medium population growth
scenario by Demographic Change Advisory Council of Tasmania (DCAC)4. For export oriented
industries and transport & warehousing the underlying assumptions are firstly that the uptake and
roll-out of the regional irrigation schemes is slower than anticipated. This results in a slower
expansion of food processing, transport and warehousing and industries servicing farms.
According to the high scenario population growth will be strong and in line with the DCAC high
growth scenario. The housing market is assumed to grow moderately to strongly, providing
opportunities for the bulky goods industry to grow moderately (slower than over the last decade).
The uptake and roll-out of the regional irrigation schemes will be strong, allowing the agricultural
industry to increase production and shift to higher margin crops. Food and beverage processing as
well as transport and warehousing experience strong growth. The mining sector will continue to
grow with new processing facilities being set up in the north-west. Higher value-added
manufacturing will expand in certain clusters, most notably the maritime and mining engineering.
The wood processing industries will see growth in niche areas such as specialty timbers and
processing.
The Industrial Land Demand for Tasmania (2011-2041) report provides a more detailed description
of the method used and underlying assumptions.
For the short, medium and long term, the land demand projections for Southern Tasmania are as
follows. In the short term industrial land demand for Southern Tasmania is projected to lie between
47 and 66 hectares. The figure below (Figure 29) shows the land demand projections by industrial
category.
4 Comparison of population estimates by ABS with the DCAC projections for 2007-2010
indicates that real population growth in Tasmania was between the medium and high scenario.

Southern Tasmania Industrial Land Study / Stage 1 Report
20110171 Southern Tasmania Industrial Land Study (FINAL 120416)
P. 55
Figure 29 Industrial Land Demand by Category (in ha) 2011-2016
Totals for Southern Tasmania
Source: SGS (2011)
In the medium term from 2011 to 2026, industrial land demand is expected to lie between 148 and
212 hectares (Figure 30).

Southern Tasmania Industrial Land Study / Stage 1 Report
20110171 Southern Tasmania Industrial Land Study (FINAL 120416)
P. 56
Figure 30 Industrial Land Demand by Category (in ha) 2011-2026
Totals for Southern Tasmania
Source: SGS (2011)
For the long term from 2011 to 2041, industrial land demand is expected to lie between 328 and
467 hectares (Figure 31).
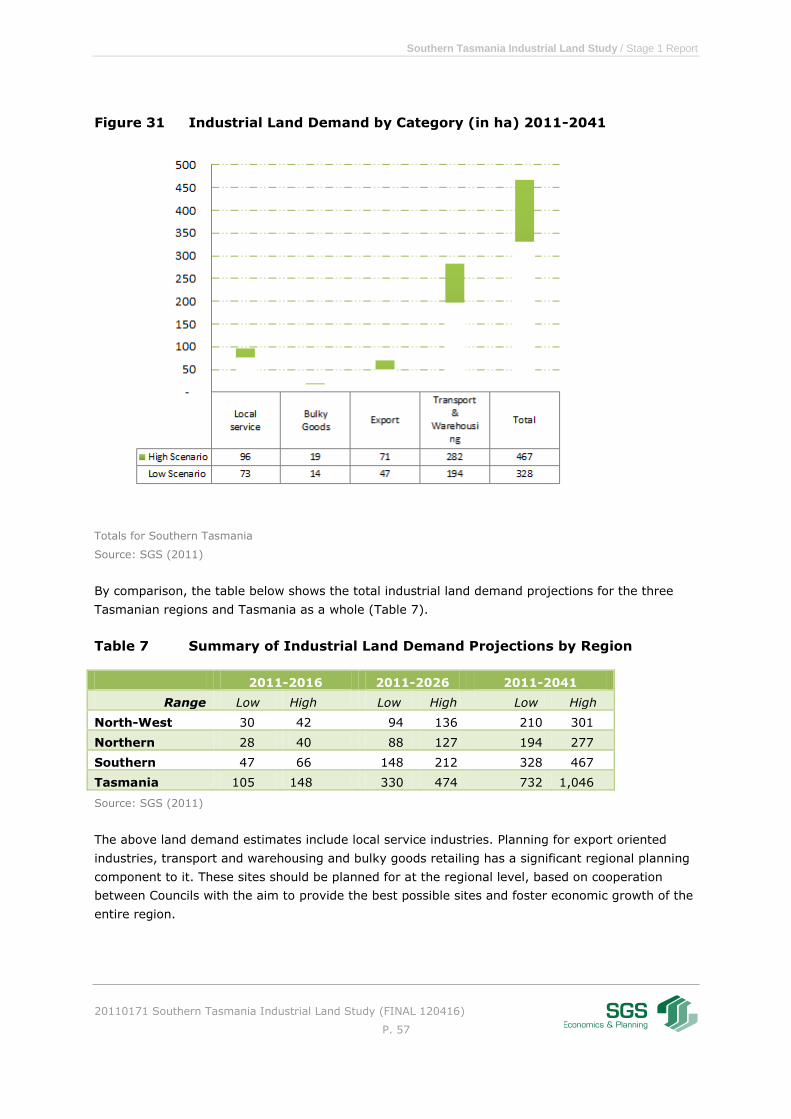
Southern Tasmania Industrial Land Study / Stage 1 Report
20110171 Southern Tasmania Industrial Land Study (FINAL 120416)
P. 57
Figure 31 Industrial Land Demand by Category (in ha) 2011-2041
Totals for Southern Tasmania
Source: SGS (2011)
By comparison, the table below shows the total industrial land demand projections for the three
Tasmanian regions and Tasmania as a whole (Table 7).
Table 7 Summary of Industrial Land Demand Projections by Region
2011-2016 2011-2026 2011-2041
Range Low High Low High Low High
North-West 30 42 94 136 210 301
Northern 28 40 88 127 194 277
Southern 47 66 148 212 328 467
Tasmania 105 148 330 474 732 1,046
Source: SGS (2011)
The above land demand estimates include local service industries. Planning for export oriented
industries, transport and warehousing and bulky goods retailing has a significant regional planning
component to it. These sites should be planned for at the regional level, based on cooperation
between Councils with the aim to provide the best possible sites and foster economic growth of the
entire region.

Southern Tasmania Industrial Land Study / Stage 1 Report
20110171 Southern Tasmania Industrial Land Study (FINAL 120416)
P. 58
Local service industries are predominantly planned for at the local level. The key exceptions to that
being strongly urbanised municipalities where there is little or no space left to create additional
industrial land, and where there is often pressure to convert existing industrial land to other higher
value uses such as residential or commercial. In Southern Tasmania this is mainly the case in
Hobart and Glenorchy, where some demand can be accommodated by infill development,
densification or uptake of vacated heavy manufacturing sites. The remainder of the demand will
increasingly ‘flow over’ into adjacent municipalities with sufficient industrial land available, such as
Clarence and Brighton. As part of a survey conducted amongst the Southern Councils, the Hobart
City Council response indicated that the impression exists that some of the light industrial (car
related) light industries are increasingly being pushed out of the City (DEDTA, 2011).
In order to assist municipalities in their land use planning, land demand for local service industries
were also calculated at the local level. The figures below show land demand for local service
industries for the short (Figure 32), medium (Figure 33) and long term (Figure 34).
Figure 32 Industrial Land Demand for Local Service Industries, 2011-2016
Source: SGS (2011)
In the short term, land demand for local service industries is highest in Glenorchy and Hobart,
between 6.1 hectares and 7.6 hectares. Because of the limited availability of industrial land, a
significant share of this demand may need to be accommodated elsewhere in a nearby
municipality. Kingborough is expected to experience demand of between 1.5 and 1.9 hectares,
while Clarence is expected to experience demand of between 1.4 and 1.7 hectares.
- 1.0 2.0 3.0 4.0 5.0 6.0 7.0 8.0 9.0
Brighton
Central Highl
Clarence
Derw Valley
Glam/Spring B
Glenorchy
Hobart
Huon Valley
Kingborough
Sorell
Southern Midl
Tasman
BrightonCentral
HighlClarence
Derw Valley
Glam/Spring B
Glenorchy
HobartHuon Valley
Kingborough
SorellSouthern Midl
Tasman
Low 0.5 0.0 1.4 0.2 0.3 2.5 3.6 0.6 1.5 0.5 0.1 0.0
High 0.5 0.0 1.7 0.3 0.4 3.1 4.5 0.7 1.9 0.6 0.1 0.1
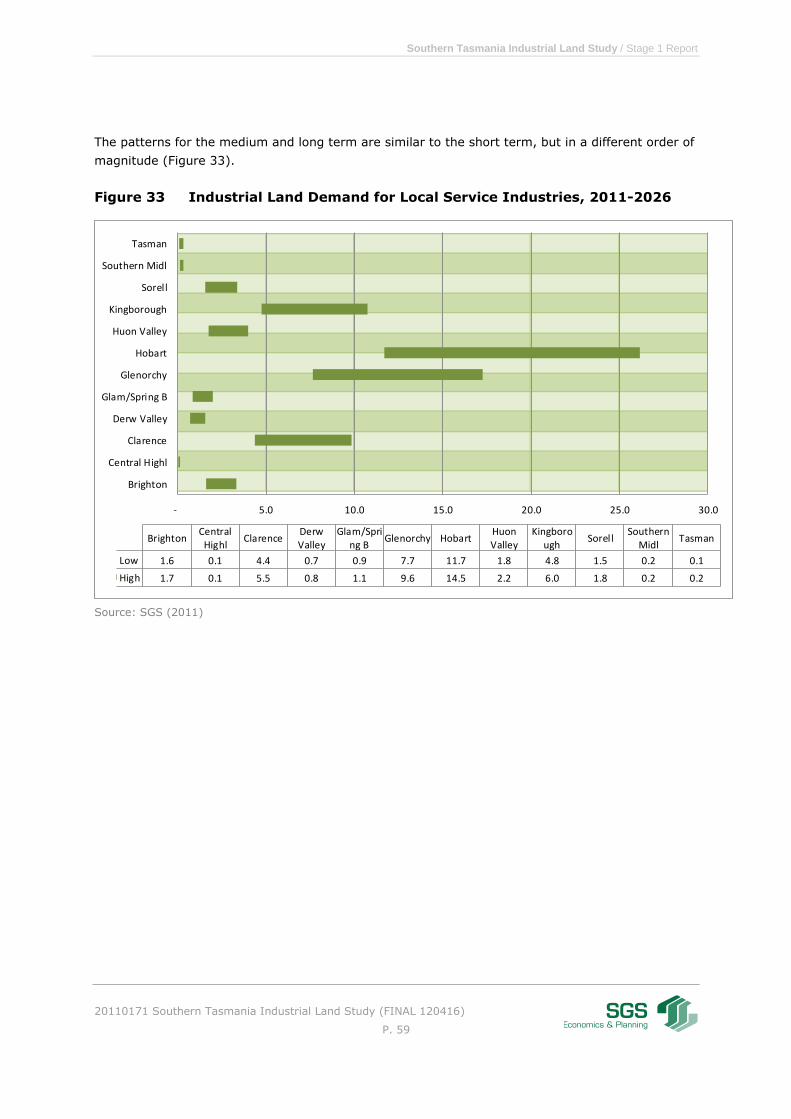
Southern Tasmania Industrial Land Study / Stage 1 Report
20110171 Southern Tasmania Industrial Land Study (FINAL 120416)
P. 59
The patterns for the medium and long term are similar to the short term, but in a different order of
magnitude (Figure 33).
Figure 33 Industrial Land Demand for Local Service Industries, 2011-2026
Source: SGS (2011)
- 5.0 10.0 15.0 20.0 25.0 30.0
Brighton
Central Highl
Clarence
Derw Valley
Glam/Spring B
Glenorchy
Hobart
Huon Valley
Kingborough
Sorell
Southern Midl
Tasman
BrightonCentral
HighlClarence
DerwValley
Glam/Spring B
Glenorchy HobartHuonValley
Kingborough
SorellSouthern
MidlTasman
Low 1.6 0.1 4.4 0.7 0.9 7.7 11.7 1.8 4.8 1.5 0.2 0.1
High 1.7 0.1 5.5 0.8 1.1 9.6 14.5 2.2 6.0 1.8 0.2 0.2
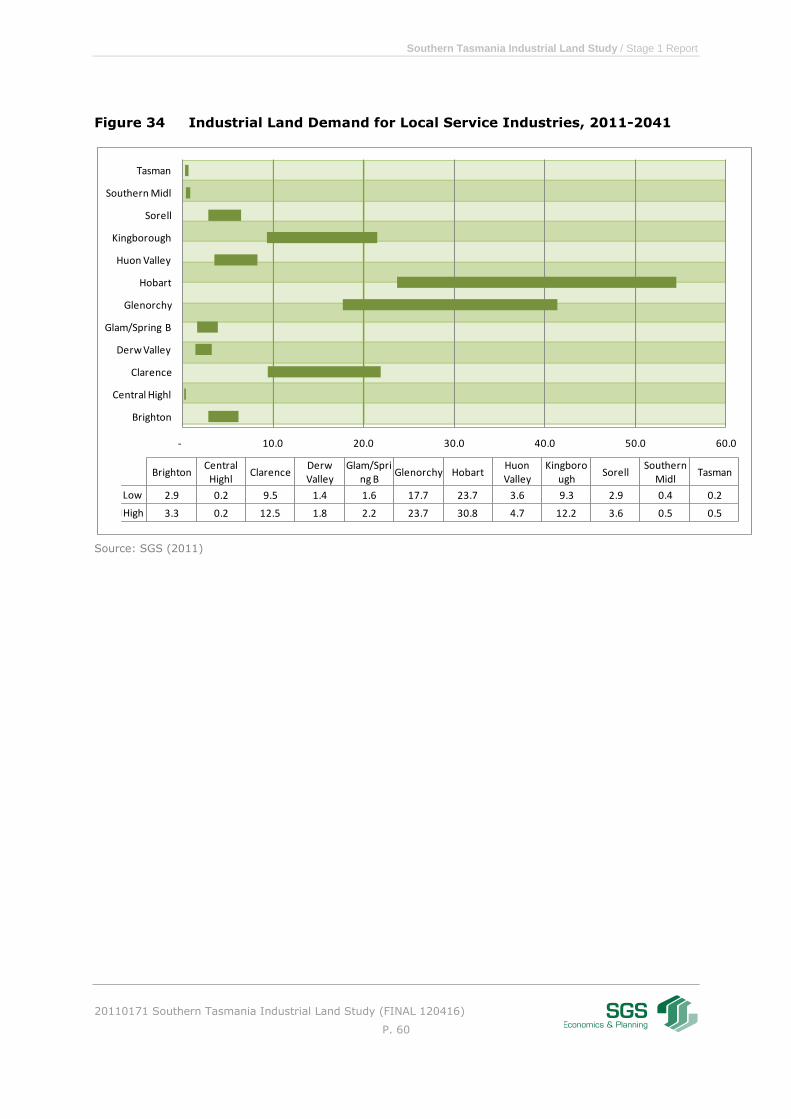
Southern Tasmania Industrial Land Study / Stage 1 Report
20110171 Southern Tasmania Industrial Land Study (FINAL 120416)
P. 60
Figure 34 Industrial Land Demand for Local Service Industries, 2011-2041
Source: SGS (2011)
- 10.0 20.0 30.0 40.0 50.0 60.0
Brighton
Central Highl
Clarence
Derw Valley
Glam/Spring B
Glenorchy
Hobart
Huon Valley
Kingborough
Sorell
Southern Midl
Tasman
BrightonCentral
HighlClarence
Derw Valley
Glam/Spring B
Glenorchy HobartHuon Valley
Kingborough
SorellSouthern
MidlTasman
Low 2.9 0.2 9.5 1.4 1.6 17.7 23.7 3.6 9.3 2.9 0.4 0.2
High 3.3 0.2 12.5 1.8 2.2 23.7 30.8 4.7 12.2 3.6 0.5 0.5
Southern Tasmania Industrial Land Study / Stage 1 Report
20110171 Southern Tasmania Industrial Land Study (FINAL 120416)
P. 61
4 Vacant Industrial Land
This section identifies the type, quantity and location of the available vacant industrial land in
Southern Tasmania.
4.1 Vacant Land Verification Process
In order to determine the supply of vacant industrial land an approach was adopted to ensure the
estimates are as correct as possible. As part of earlier assignment work regarding industrial land by
SGS it was found that some data sources were inconsistent in regards to the current supply of
vacant land. The existing supply of vacant industrial land is of course always a representation of
the situation at a given moment. The supply changes as a result of uptake of vacant land, land
becoming vacant again after being used and as a result of more land rezoning.
The greatest inconsistency in vacant land data existed between the General Valuer’s data and
Clarence City Council data. The data of both sources were compiled at the parcel level and any
duplications were removed.
The next step involved the verification process of all the potential vacant industrial land lots in
Southern Tasmania. The first step of verification consisted of an examination of aerial imaging of
these parcels (10cm resolution and accurate to 30cm, images taken in April 2011). For some
parcels for which the imaging was not available, the List satellite images were used (dated March
2010). This step resulted in parcels being eliminated as being ‘vacant’. The current use of a
number of parcels remained ‘unsure’ after this step.
The supply of potential vacant parcels were also presented to Council planning representatives
during a meeting (19 September 2011) and email follow up for confirmation. As a result, more
parcels were definitive eliminated as being ‘not vacant’ or confirmed being ‘vacant’. This step also
resulted in a number of parcels being added by the municipalities as being currently ‘vacant’.
The last step consisted of site visits to a handful of parcels of which the current use was still
‘unsure’. After this final step, all parcels had been definitely confirmed as being ‘vacant’ or ‘not
vacant’.
The verification process has resulted in updated estimates of existing vacant industrial land in
Southern Tasmania. In total, it is estimated there are 84 vacant industrial parcels comprising a
total land area of 176 hectares. The majority of vacant land is situated within the municipality of
Clarence.
The figures below show that most vacant lots (Figure 35) and the majority of the vacant land area
(Figure 36) is located in Clarence City Council, followed by Kingborough Council and Brighton
Council. In terms of vacant land area, significant areas are also still available in Huon Valley
Council.

Southern Tasmania Industrial Land Study / Stage 1 Report
20110171 Southern Tasmania Industrial Land Study (FINAL 120416)
P. 62
Four municipalities have no vacant industrial land available, being Hobart, Tasman, Southern
Midlands and Central Highlands. In Hobart all industrial land has been taken up, with no
opportunity increase industrial zoned land. Tasman, Southern Midlands and Central Highlands
would most likely have the opportunity to rezone land to industrial if there was a demonstrated
need.
Figure 35 Vacant Industrial Land Parcels by Council, 2011
BC= Brighton Council; CCC= Clarence City Council; DVC= Derwent Valley Council, GCC= Glenorchy City
Council, HVC Huon Valley Council; KB= Kingborough Council; G-SB= Glamorgan-Spring Bay Council
Source: SGS (2011)
BC CCC DVC GCC HVC KC Sorell G-SB
Lots 10 40 1 4 5 17 4 3
0
5
10
15
20
25
30
35
40
45
Nu
mb
er
of
lots
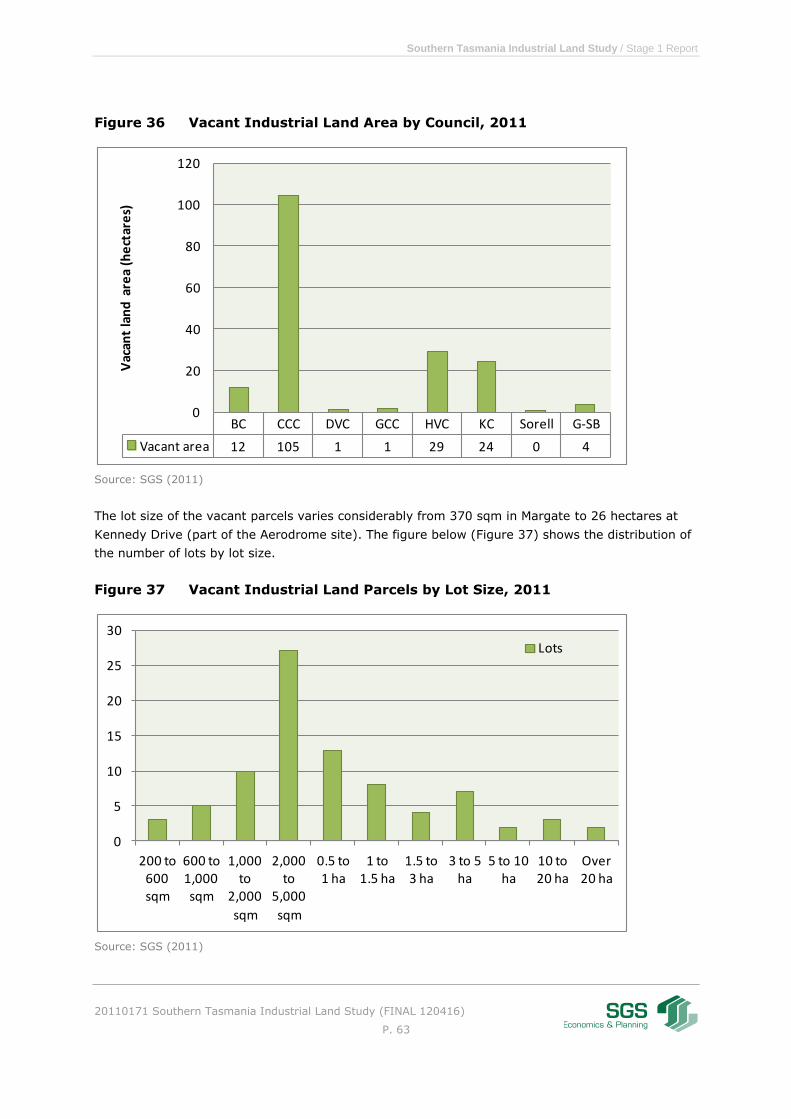
Southern Tasmania Industrial Land Study / Stage 1 Report
20110171 Southern Tasmania Industrial Land Study (FINAL 120416)
P. 63
Figure 36 Vacant Industrial Land Area by Council, 2011
Source: SGS (2011)
The lot size of the vacant parcels varies considerably from 370 sqm in Margate to 26 hectares at
Kennedy Drive (part of the Aerodrome site). The figure below (Figure 37) shows the distribution of
the number of lots by lot size.
Figure 37 Vacant Industrial Land Parcels by Lot Size, 2011
Source: SGS (2011)
BC CCC DVC GCC HVC KC Sorell G-SB
Vacant area 12 105 1 1 29 24 0 4
0
20
40
60
80
100
120
Vac
ant
lan
d a
rea
(he
ctar
es)
0
5
10
15
20
25
30
200 to 600 sqm
600 to 1,000 sqm
1,000 to
2,000
sqm
2,000 to
5,000
sqm
0.5 to 1 ha
1 to 1.5 ha
1.5 to 3 ha
3 to 5 ha
5 to 10 ha
10 to 20 ha
Over 20 ha
Lots

Southern Tasmania Industrial Land Study / Stage 1 Report
20110171 Southern Tasmania Industrial Land Study (FINAL 120416)
P. 64
The larger lots, with areas of 10 to 20 hectares and over 20 hectares, represent 56% of the total
vacant land stock. In sum the large lots are nearly 99 hectares. The figure below demonstrates this
by displaying the share of land area by lot size (Figure 38). Small lots, with areas of up to 5,000
sqm represent 6% of the total vacant land stock or just below 11 hectares.
Figure 38 Vacant Land by Parcel Size (% of total vacant stock), 2001
Source: SGS (2011)
4.2 Assessment of Vacant Industrial Land
This section describes the available vacant land by municipality in some detail:
Firstly, this section reports on the location of vacant land using GIS maps.
Second, there will be a discussion on the suitability of land given its slope and how it is
situated in relation to infrastructure and sensitive uses. Regarding the slope of the land,
SGS has calculated the average slope for each lot5. Generally speaking, a slope of 10% or
more makes the land unsuitable for industrial uses. Slopes between 5% and 10% are less
preferable for many uses. Sensitive uses have been categorised based on the current
zoning of the land. Land zonings that are not seen as potentially conflicting with industrial
uses have not been categorised and are displayed in grey. The sensitive land categories
are:
o Residential (including future residential)
o Community facilities, including some parks and foreshores
o Environmental protection, including natural areas with conservation values
o Heritage, areas with heritage values
5 The average slope is generally a good indicator of the steepness of the land. However, in
some cases a slope is concentrated in a minor area of the parcel, and in those cases the measure used here may provide an inaccurate interpretation of the suitability of the land.
200 to 600 sqm
600 to 1,000 sqm
1,000 to 2,000 sqm
2,000 to 5,000 sqm
0.5 to 1 ha
1 to 1.5 ha
1.5 to 3 ha
3 to 5 ha5 to 10
ha10 to 20
haOver 20
ha
Share of area 0% 0% 1% 5% 5% 5% 4% 15% 9% 28% 28%
0%
5%
10%
15%
20%
25%
30%
Shar
e o
f to
tal v
acan
t la
nd
are
a (%
)
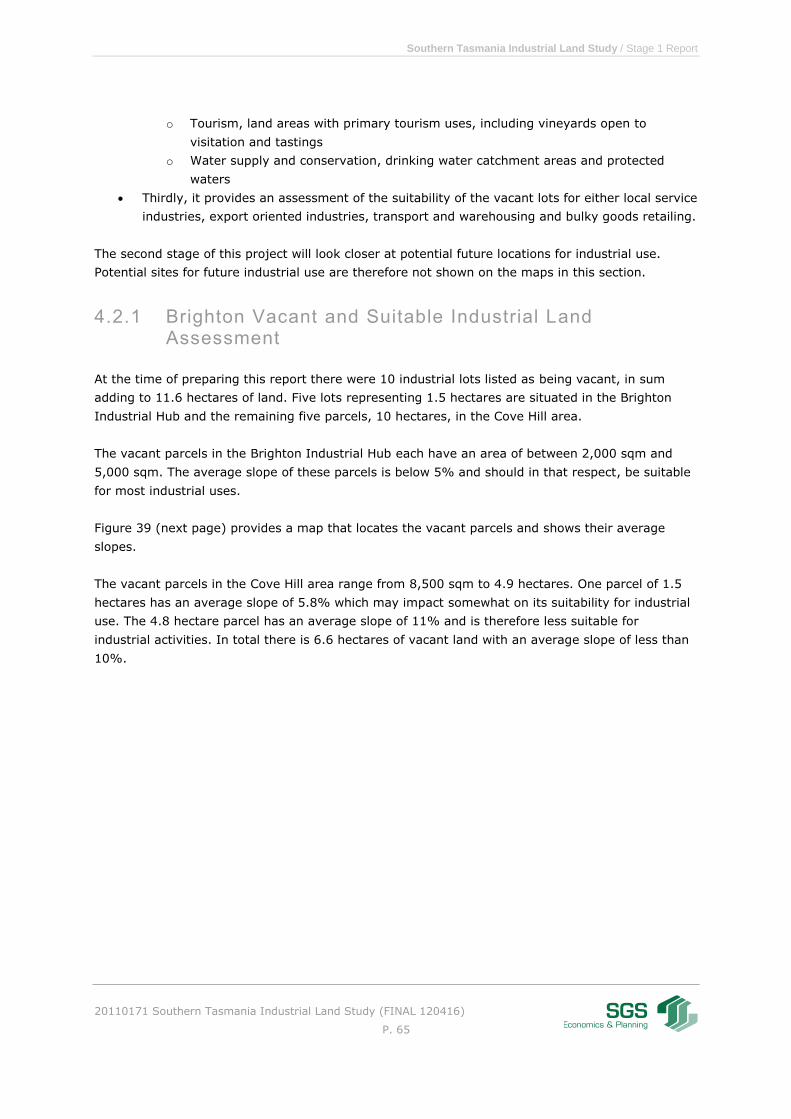
Southern Tasmania Industrial Land Study / Stage 1 Report
20110171 Southern Tasmania Industrial Land Study (FINAL 120416)
P. 65
o Tourism, land areas with primary tourism uses, including vineyards open to
visitation and tastings
o Water supply and conservation, drinking water catchment areas and protected
waters
Thirdly, it provides an assessment of the suitability of the vacant lots for either local service
industries, export oriented industries, transport and warehousing and bulky goods retailing.
The second stage of this project will look closer at potential future locations for industrial use.
Potential sites for future industrial use are therefore not shown on the maps in this section.
4.2.1 Brighton Vacant and Suitable Industrial Land Assessment
At the time of preparing this report there were 10 industrial lots listed as being vacant, in sum
adding to 11.6 hectares of land. Five lots representing 1.5 hectares are situated in the Brighton
Industrial Hub and the remaining five parcels, 10 hectares, in the Cove Hill area.
The vacant parcels in the Brighton Industrial Hub each have an area of between 2,000 sqm and
5,000 sqm. The average slope of these parcels is below 5% and should in that respect, be suitable
for most industrial uses.
Figure 39 (next page) provides a map that locates the vacant parcels and shows their average
slopes.
The vacant parcels in the Cove Hill area range from 8,500 sqm to 4.9 hectares. One parcel of 1.5
hectares has an average slope of 5.8% which may impact somewhat on its suitability for industrial
use. The 4.8 hectare parcel has an average slope of 11% and is therefore less suitable for
industrial activities. In total there is 6.6 hectares of vacant land with an average slope of less than
10%.
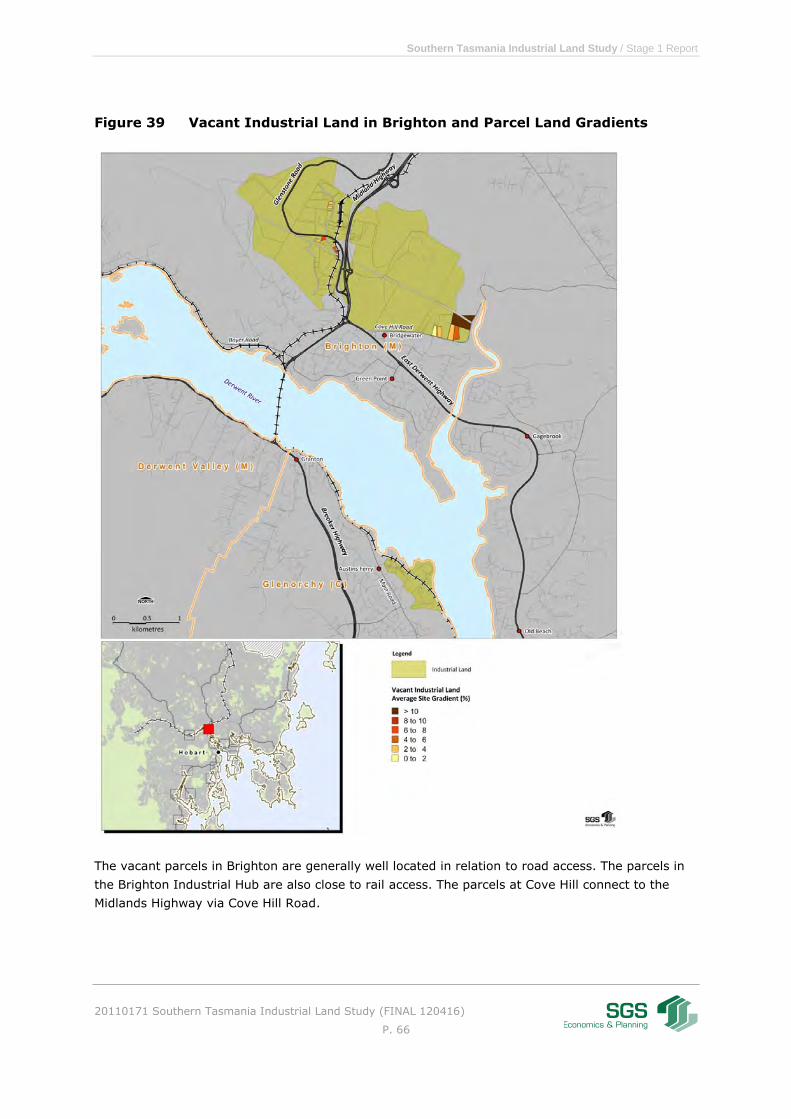
Southern Tasmania Industrial Land Study / Stage 1 Report
20110171 Southern Tasmania Industrial Land Study (FINAL 120416)
P. 66
Figure 39 Vacant Industrial Land in Brighton and Parcel Land Gradients
The vacant parcels in Brighton are generally well located in relation to road access. The parcels in
the Brighton Industrial Hub are also close to rail access. The parcels at Cove Hill connect to the
Midlands Highway via Cove Hill Road.
Southern Tasmania Industrial Land Study / Stage 1 Report
20110171 Southern Tasmania Industrial Land Study (FINAL 120416)
P. 67
The parcels are largely situated with sufficient buffer from sensitive uses (Figure 40). The land
categorised ‘community facilities’ involves a little used area. The assessment shows that 6.6
hectares or 9 parcels are suitable for industrial use in terms of slope and nearby uses.
Figure 40 Vacant Industrial Land in Brighton and Nearby Sensitive Uses
Southern Tasmania Industrial Land Study / Stage 1 Report
20110171 Southern Tasmania Industrial Land Study (FINAL 120416)
P. 68
4.2.2 Glenorchy Vacant and Suitable Industrial Land Assessment
Glenorchy is the traditional industrial centre of Greater Hobart. While some larger manufacturers
have relocated and/or closed over the last few decades, their vacated parcels have generally been
taken up quickly by smaller industrial land users, mostly local service industries. While there are
always some industrial vacancies as part of changes and relocations, by and large, most land in
Glenorchy has been occupied.
Currently, only four vacant industrial parcels remain (1.2 hectares): two small parcels in the
Chapel Street area (between 500 and 700 sqm), one parcel in Prince of Wales Bay (3,700 sqm)
and one parcel in the Science & Technology Park (7,000 sqm). The parcels at Chapel Street are
currently used as informal parking areas.
The average slopes of these areas do not restrict their suitability (Figure 41). The parcel in POW
Bay has an average slope of 13.6% which limits the useability of the site.

Southern Tasmania Industrial Land Study / Stage 1 Report
20110171 Southern Tasmania Industrial Land Study (FINAL 120416)
P. 69
Figure 41 Vacant Industrial Land in Glenorchy and Parcel Land Gradients

Southern Tasmania Industrial Land Study / Stage 1 Report
20110171 Southern Tasmania Industrial Land Study (FINAL 120416)
P. 70
All four parcels are located within established industrial areas (Figure 42). The Chapel Street area
is close to residential uses and as a result of historically developed land use patterns, there are
some residential uses within the Chapel Street precinct, thereby creating some use issues within
the industrial precinct.
Figure 42 Vacant Industrial Land in Glenorchy and Nearby Sensitive Uses

Southern Tasmania Industrial Land Study / Stage 1 Report
20110171 Southern Tasmania Industrial Land Study (FINAL 120416)
P. 71
The assessment indicates that 8,128 sqm or 3 parcels are suitable for industrial use in terms of
slope and nearby uses. The parcel at POW Bay is constrained by slope.
4.2.3 Clarence Vacant and Suitable Industrial Land Assessment
Clarence is the municipality which currently comprises the most extensive supply of vacant
industrial land of 40 parcels and 105 hectares. The vacant land areas and their average slopes are
shown in the three following maps for Risdon Vale and Mornington (Figure 43 & Figure 44),
Kennedy Drive and surrounds (Figure 45 & Figure 46) and Rokeby (Figure 47 &Figure 48).
At Risdon Vale there are currently two vacant parcels with a total area of 19.8 hectares. The
largest parcel has an average slope of 13.1%. At Mornington there are currently seven vacant lots
of which two have a slope of greater than 10%. In total there is 4.9 hectares of vacant land with a
slope of less than 10% in Risdon Vale and Mornington precincts (Figure 43).
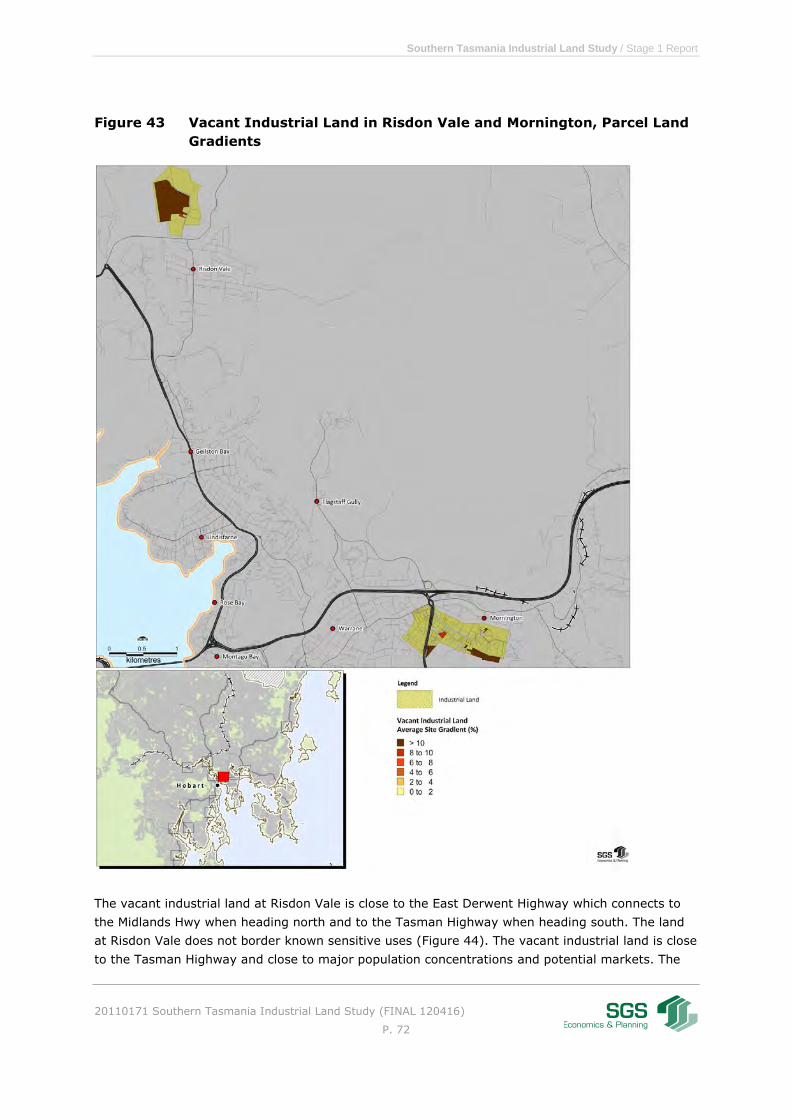
Southern Tasmania Industrial Land Study / Stage 1 Report
20110171 Southern Tasmania Industrial Land Study (FINAL 120416)
P. 72
Figure 43 Vacant Industrial Land in Risdon Vale and Mornington, Parcel Land
Gradients
The vacant industrial land at Risdon Vale is close to the East Derwent Highway which connects to
the Midlands Hwy when heading north and to the Tasman Highway when heading south. The land
at Risdon Vale does not border known sensitive uses (Figure 44). The vacant industrial land is close
to the Tasman Highway and close to major population concentrations and potential markets. The

Southern Tasmania Industrial Land Study / Stage 1 Report
20110171 Southern Tasmania Industrial Land Study (FINAL 120416)
P. 73
two lots at Mornington that have a slope greater than 10%, also border an area with sensitive
natural values (category Environmental Protection).
Figure 44 Vacant Industrial Land in Risdon Vale and Mornington, Nearby
Sensitive Uses
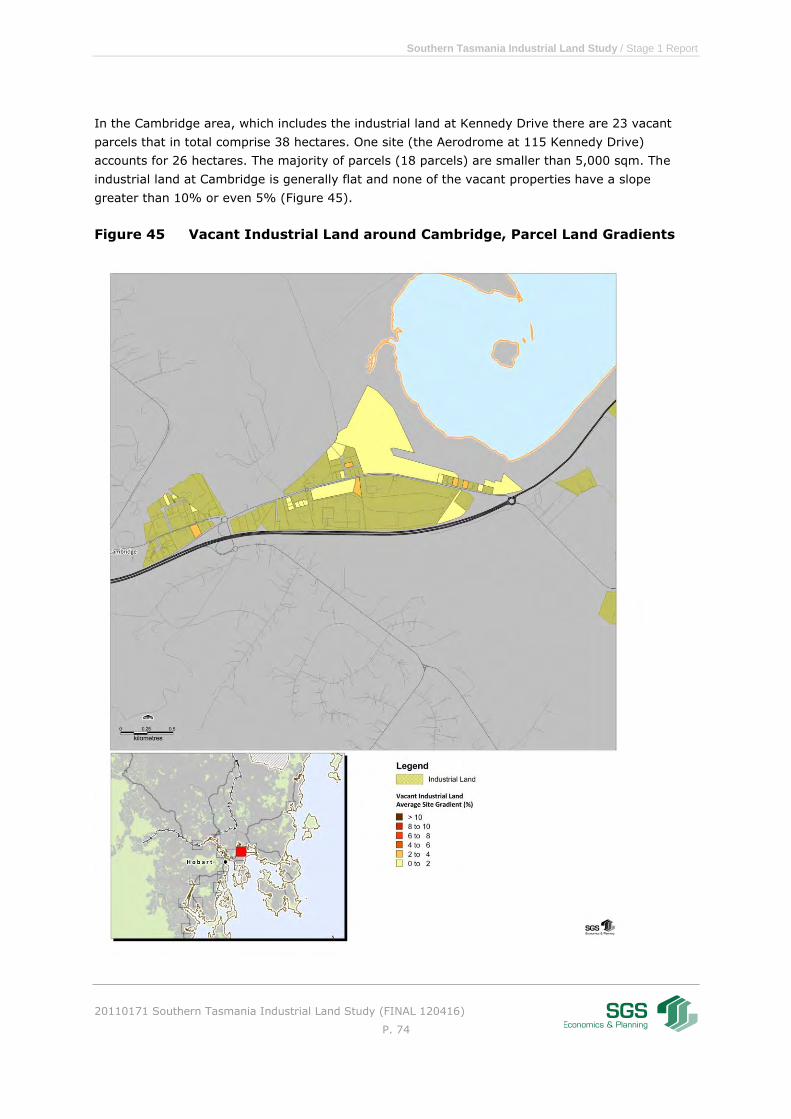
Southern Tasmania Industrial Land Study / Stage 1 Report
20110171 Southern Tasmania Industrial Land Study (FINAL 120416)
P. 74
In the Cambridge area, which includes the industrial land at Kennedy Drive there are 23 vacant
parcels that in total comprise 38 hectares. One site (the Aerodrome at 115 Kennedy Drive)
accounts for 26 hectares. The majority of parcels (18 parcels) are smaller than 5,000 sqm. The
industrial land at Cambridge is generally flat and none of the vacant properties have a slope
greater than 10% or even 5% (Figure 45).
Figure 45 Vacant Industrial Land around Cambridge, Parcel Land Gradients
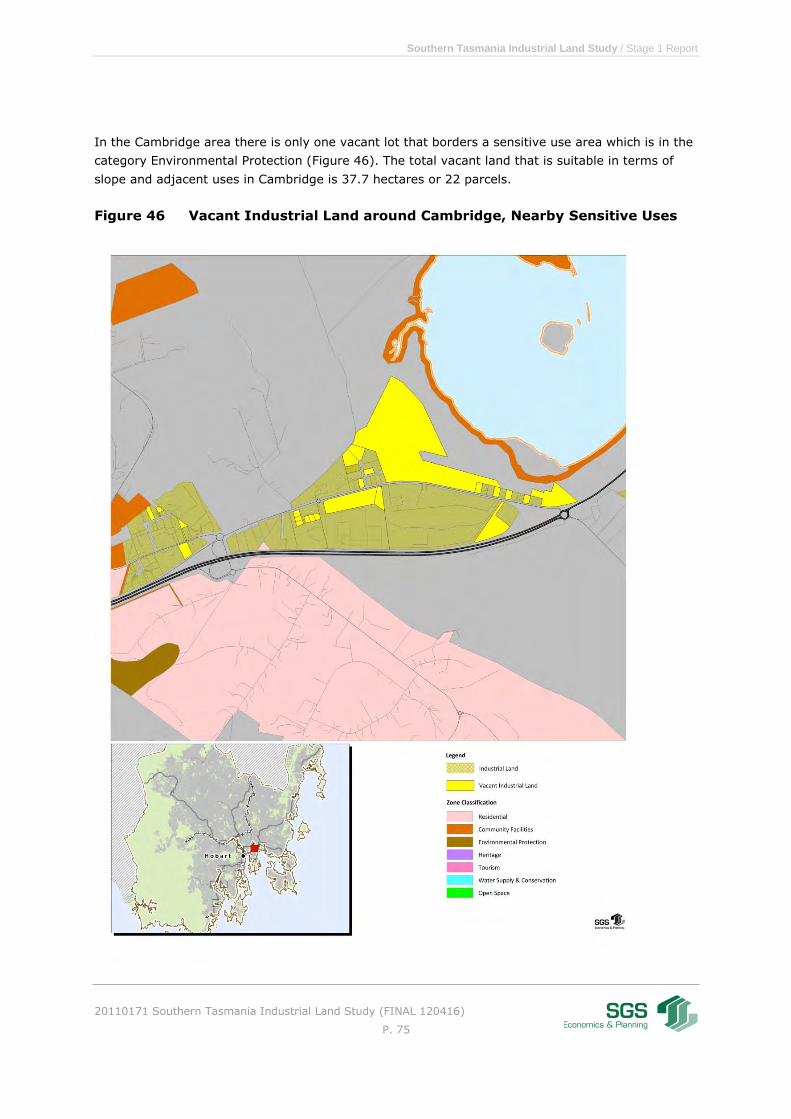
Southern Tasmania Industrial Land Study / Stage 1 Report
20110171 Southern Tasmania Industrial Land Study (FINAL 120416)
P. 75
In the Cambridge area there is only one vacant lot that borders a sensitive use area which is in the
category Environmental Protection (Figure 46). The total vacant land that is suitable in terms of
slope and adjacent uses in Cambridge is 37.7 hectares or 22 parcels.
Figure 46 Vacant Industrial Land around Cambridge, Nearby Sensitive Uses
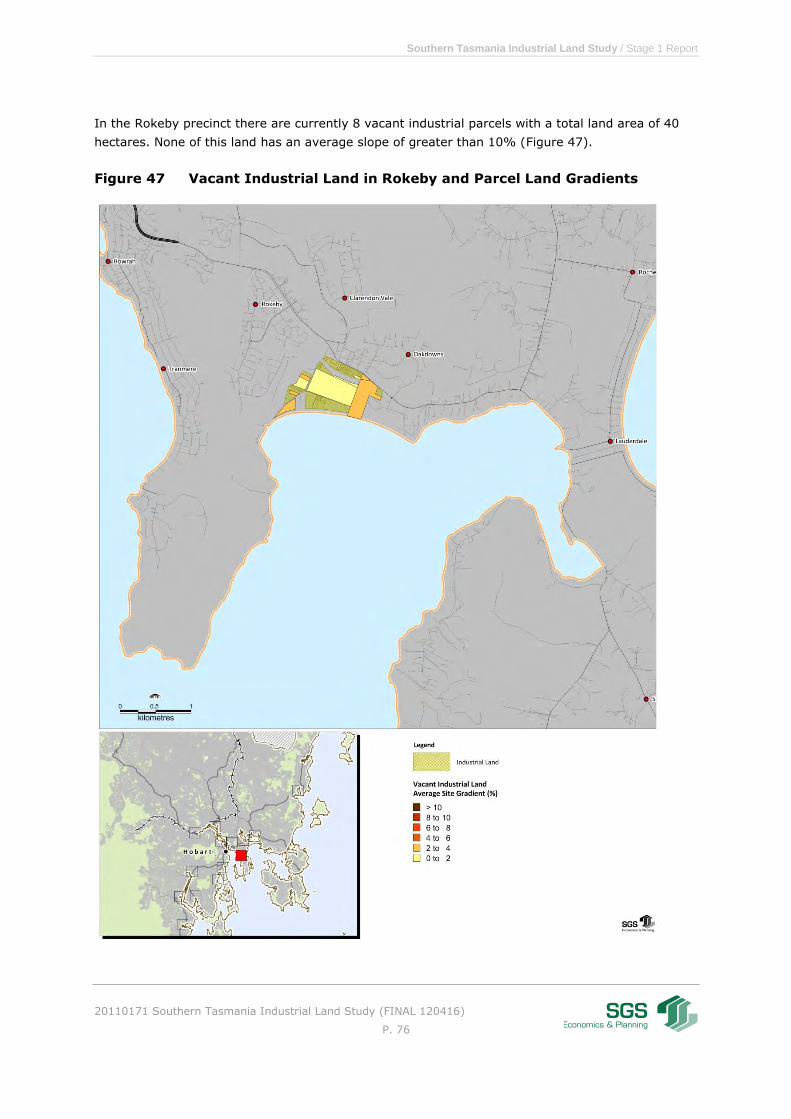
Southern Tasmania Industrial Land Study / Stage 1 Report
20110171 Southern Tasmania Industrial Land Study (FINAL 120416)
P. 76
In the Rokeby precinct there are currently 8 vacant industrial parcels with a total land area of 40
hectares. None of this land has an average slope of greater than 10% (Figure 47).
Figure 47 Vacant Industrial Land in Rokeby and Parcel Land Gradients

Southern Tasmania Industrial Land Study / Stage 1 Report
20110171 Southern Tasmania Industrial Land Study (FINAL 120416)
P. 77
The vacant land in the Rokeby area is mostly enclosed within the existing industrial precinct (Figure
48). There are three lots that border an area which is categorised as community facilities which
may limit the suitability of the land for certain industrial uses. A very small area of one of the very
large land parcels borders a sensitive use and should therefore still be regarded as suitable for
industrial use (with enough area to create buffer within the site itself). The two remaining parcels
represent a total area of 2.8 hectares.
Figure 48 Vacant Industrial Land in Rokeby and Nearby Sensitive Uses

Southern Tasmania Industrial Land Study / Stage 1 Report
20110171 Southern Tasmania Industrial Land Study (FINAL 120416)
P. 78
However, there is one large site in the Rokeby area that lies adjacent to the coast and is low lying.
Sea level rise modelling shows that the entire area would be flooded in the case of a storm surge
and rising sea levels. This is assuming an average sea level rise of 84 cm by 2100 above the mean
sea level in 2004 (The List, November 2011). It appears to be comparable to the Lauderdale area
in terms of susceptibility to flooding and climate change. This site is therefore regarded as less
suitable for industrial uses. This parcel is also adjacent Community uses.
As a result there are 6 parcels in Rokeby that are both vacant and suitable in terms of slope and
adjacent uses. These parcels total 37.5 hectares of industrial land.
The overall result for Clarence (consisting of Risdon Vale and Mornington, Kennedy Drive and
surrounds, and Rokeby) illustrates that there are 34 vacant lots which are suitable for industrial
use in terms of slope, nearby sensitive uses and sea level rise. The total area comprises 80
hectares.

Southern Tasmania Industrial Land Study / Stage 1 Report
20110171 Southern Tasmania Industrial Land Study (FINAL 120416)
P. 79
4.2.4 Sorell Vacant and Suitable Industrial Land Assessment
There are currently four vacant industrial lots in Sorell, comprising 2,700 sqm in total. The lot sizes
are small and each lot is between 600 and 1,000 sqm. All four lots are generally flat (Error!
eference source not found.).
Figure 49 Vacant Industrial Land in Sorell, Parcel Land Gradients

Southern Tasmania Industrial Land Study / Stage 1 Report
20110171 Southern Tasmania Industrial Land Study (FINAL 120416)
P. 80
All four lots are also contained within an existing industrial precinct. Two of the four parcels are
located close to an open space area, but appear to have sufficient buffers (Figure 50).
Figure 50 Vacant Industrial Land in Sorell and Nearby Sensitive Uses

Southern Tasmania Industrial Land Study / Stage 1 Report
20110171 Southern Tasmania Industrial Land Study (FINAL 120416)
P. 81
4.2.5 Kingborough Vacant and Suitable Industrial Land Assessment
In the Huntingfield and Firthside areas there are currently 11 vacant lots, in total comprising 3.7
hectares. Six parcels, with a total area of 1.3 hectares, have an average slope which is greater
than 10%, making them less suitable for industrial use. In addition, there are three lots with an
average slope of 8 to 10% and two parcels with a slope of 6 to 8% (Figure 51).
Figure 51 Vacant Industrial Land in Huntingfield and Firthside, Parcel Land
Gradients

Southern Tasmania Industrial Land Study / Stage 1 Report
20110171 Southern Tasmania Industrial Land Study (FINAL 120416)
P. 82
The Huntingfield precinct is closely located to the Peter Murell Reserve, which is a sensitive land
use type under the category Environmental Protection. Two large parcels are located adjacent to
the reserve, making them less suitable for industrial development, while two parcels are adjacent
to residential areas. In total these four parcels, comprise 2.1 hectares. Given the constraints of
Huntingfield, only one lot of ~2,500 sqm appears to be suitable for industrial use. A development
approval for a transport depot has been issued for this site.
Figure 52 Vacant Industrial Land in Huntingfield and Firthside and Nearby
Sensitive Uses
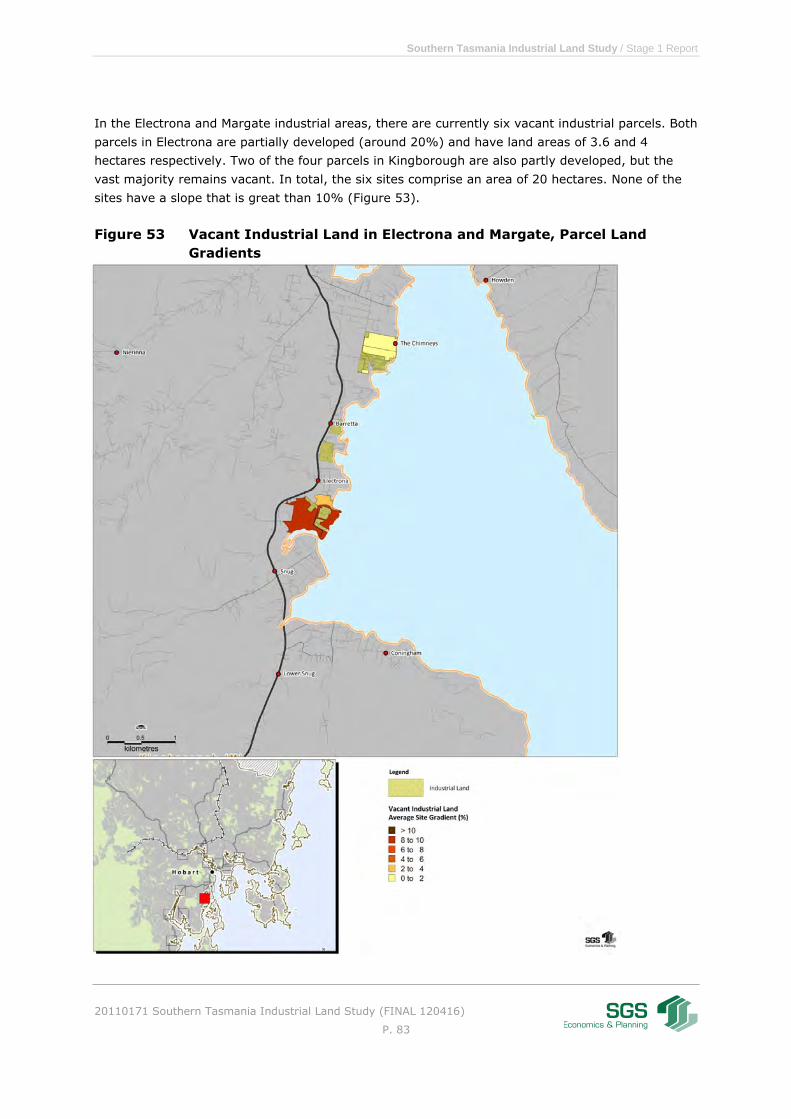
Southern Tasmania Industrial Land Study / Stage 1 Report
20110171 Southern Tasmania Industrial Land Study (FINAL 120416)
P. 83
In the Electrona and Margate industrial areas, there are currently six vacant industrial parcels. Both
parcels in Electrona are partially developed (around 20%) and have land areas of 3.6 and 4
hectares respectively. Two of the four parcels in Kingborough are also partly developed, but the
vast majority remains vacant. In total, the six sites comprise an area of 20 hectares. None of the
sites have a slope that is great than 10% (Figure 53).
Figure 53 Vacant Industrial Land in Electrona and Margate, Parcel Land
Gradients

Southern Tasmania Industrial Land Study / Stage 1 Report
20110171 Southern Tasmania Industrial Land Study (FINAL 120416)
P. 84
Five of the six parcels adjoin residential and environmentally protected land and would therefore be
less suitable for industrial development (Figure 54). Council indicates that two of these sites
contain a significant share of land with priority vegetation, making them unsuitable for industrial
development. Additionally, one of the sites would be difficult to gain access to. As a result, only one
site with an area remains largely undeveloped and suitable for industrial use in terms of slope and
adjacent uses. This parcel is measures 3.4 hectares.
Figure 54 Vacant Industrial Land in Electrona and Margate and Nearby
Sensitive Uses

Southern Tasmania Industrial Land Study / Stage 1 Report
20110171 Southern Tasmania Industrial Land Study (FINAL 120416)
P. 85
Overall Kingborough has only two vacant and suitable sites (in terms of slope and adjacent uses)
for industrial development. These sites have a total area of 3.6 hectares. The smaller of the two
lots already has a development permit issued for it.
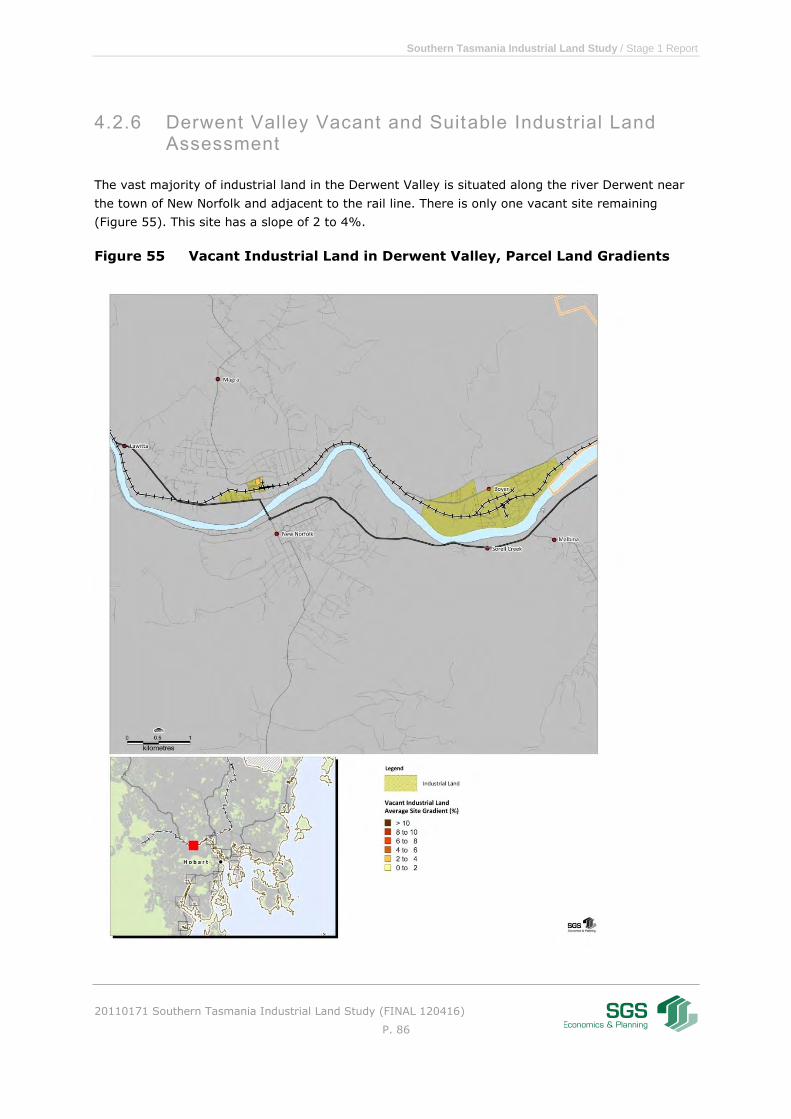
Southern Tasmania Industrial Land Study / Stage 1 Report
20110171 Southern Tasmania Industrial Land Study (FINAL 120416)
P. 86
4.2.6 Derwent Valley Vacant and Suitable Industrial Land Assessment
The vast majority of industrial land in the Derwent Valley is situated along the river Derwent near
the town of New Norfolk and adjacent to the rail line. There is only one vacant site remaining
(Figure 55). This site has a slope of 2 to 4%.
Figure 55 Vacant Industrial Land in Derwent Valley, Parcel Land Gradients
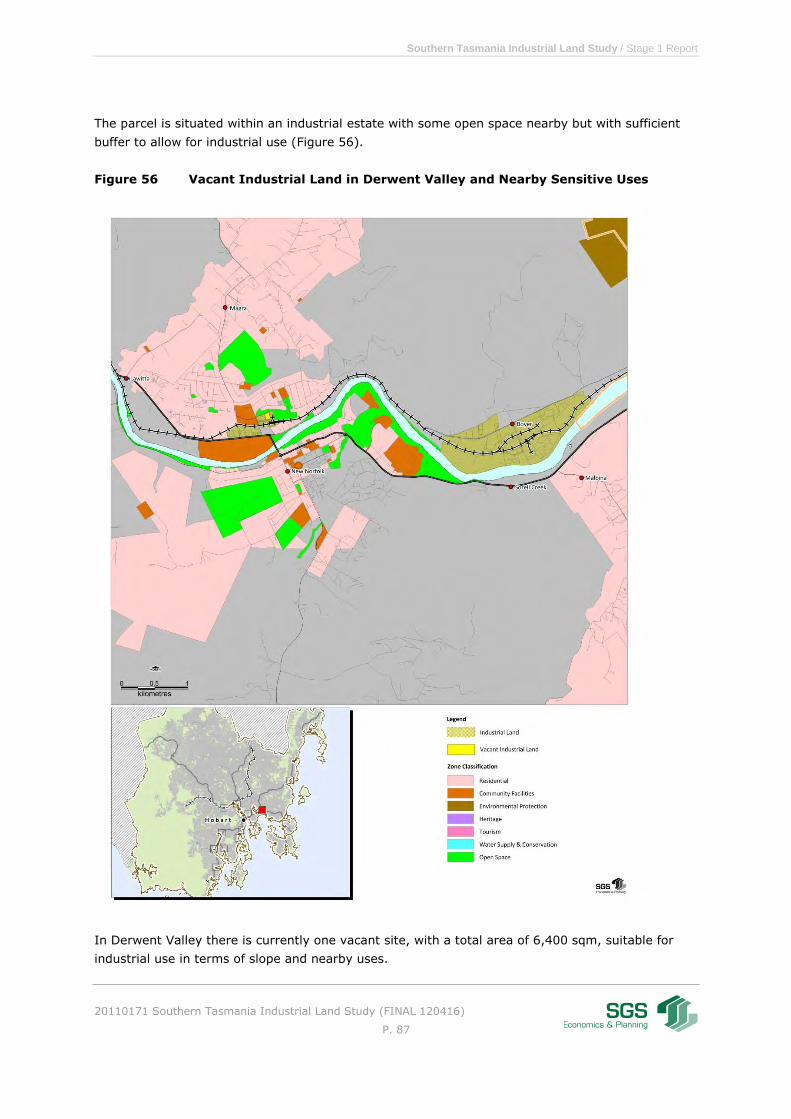
Southern Tasmania Industrial Land Study / Stage 1 Report
20110171 Southern Tasmania Industrial Land Study (FINAL 120416)
P. 87
The parcel is situated within an industrial estate with some open space nearby but with sufficient
buffer to allow for industrial use (Figure 56).
Figure 56 Vacant Industrial Land in Derwent Valley and Nearby Sensitive Uses
In Derwent Valley there is currently one vacant site, with a total area of 6,400 sqm, suitable for
industrial use in terms of slope and nearby uses.

Southern Tasmania Industrial Land Study / Stage 1 Report
20110171 Southern Tasmania Industrial Land Study (FINAL 120416)
P. 88
4.2.7 Huon Valley Vacant and Suitable Industrial Land Assessment
There are five vacant industrial sites in the Huon Valley with a total area of 29 hectares. There are
currently no vacant industrial land parcels remaining in Huonville. Three of the sites are located in
the Cygnet area. Of these three sites, two have an average slope of more than 10% (12% and
15%) which makes them less suitable for industrial use (Figure 57). The remaining site has a slope
of less than 10%, and measures 3 hectares.
Figure 57 Vacant Industrial Land in Cygnet, Parcel Land Gradients

Southern Tasmania Industrial Land Study / Stage 1 Report
20110171 Southern Tasmania Industrial Land Study (FINAL 120416)
P. 89
The three sites in Cygnet are located in a mostly agricultural area, at sufficient distance from any
sensitive uses (Figure 58).
Figure 58 Vacant Industrial Land in Cygnet and Nearby Sensitive Uses

Southern Tasmania Industrial Land Study / Stage 1 Report
20110171 Southern Tasmania Industrial Land Study (FINAL 120416)
P. 90
There is one vacant parcel with a total area of 2 hectares of industrial land in the Geeveston area.
This site has an average slope of greater than 10% making the site less suitable for industrial
development (Figure 59).
Figure 59 Vacant Industrial Land in Geeveston, Parcel Land Gradients
Source: SGS, 2011
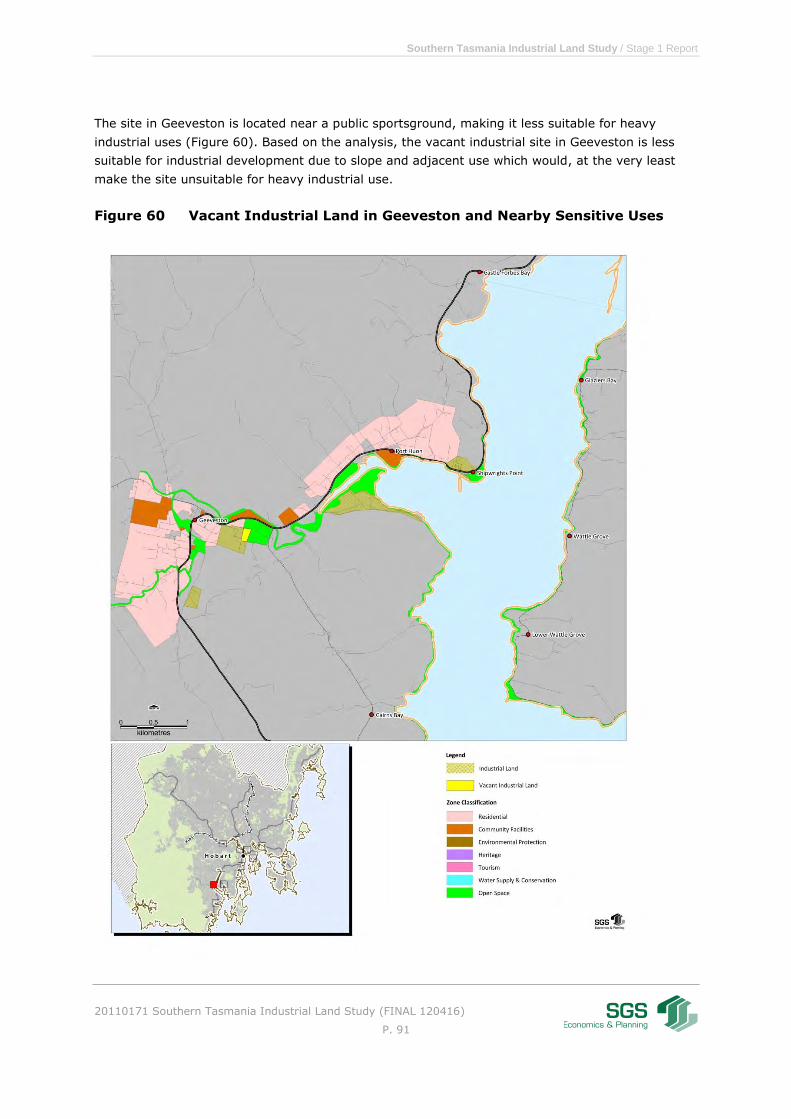
Southern Tasmania Industrial Land Study / Stage 1 Report
20110171 Southern Tasmania Industrial Land Study (FINAL 120416)
P. 91
The site in Geeveston is located near a public sportsground, making it less suitable for heavy
industrial uses (Figure 60). Based on the analysis, the vacant industrial site in Geeveston is less
suitable for industrial development due to slope and adjacent use which would, at the very least
make the site unsuitable for heavy industrial use.
Figure 60 Vacant Industrial Land in Geeveston and Nearby Sensitive Uses
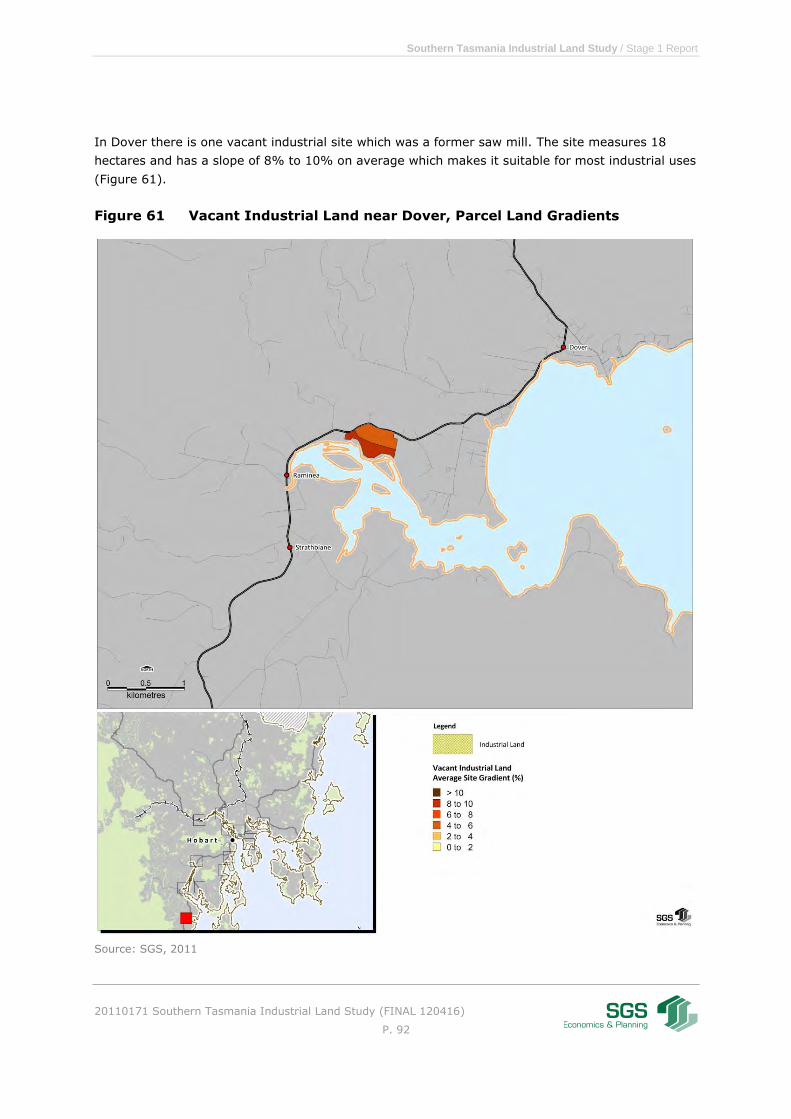
Southern Tasmania Industrial Land Study / Stage 1 Report
20110171 Southern Tasmania Industrial Land Study (FINAL 120416)
P. 92
In Dover there is one vacant industrial site which was a former saw mill. The site measures 18
hectares and has a slope of 8% to 10% on average which makes it suitable for most industrial uses
(Figure 61).
Figure 61 Vacant Industrial Land near Dover, Parcel Land Gradients
Source: SGS, 2011

Southern Tasmania Industrial Land Study / Stage 1 Report
20110171 Southern Tasmania Industrial Land Study (FINAL 120416)
P. 93
The site is located close to the waterfront along which there is a strip of open space (Figure 62).
The site is sufficiently large to enable an appropriate buffer from the open space area.
Figure 62 Vacant Industrial Land near Dover and Nearby Sensitive Uses
Source: SGS, 2011
Southern Tasmania Industrial Land Study / Stage 1 Report
20110171 Southern Tasmania Industrial Land Study (FINAL 120416)
P. 94
The above analysis shows there are two vacant and suitable industrial parcels in Huon Valley, one
in Cygnet and the other in Dover. The two sites comprise a total area of 2.1 hectares. Further, it
should be noted that the rezoning of a 20 ha site in Ranelagh to industrial zone has been recently
approved (October 2011). This site will be assessed as one of the future industrial sites (Stage 2).
4.2.8 Glamorgan-Spring Bay Vacant and Suitable Industrial Land Assessment
In the Glamorgan-Spring Bay region there are currently three vacant industrial lots in the town of
Triabunna. In addition, the future of the Triabunna mill remains uncertain, and could impact on
several related local industries.
The three vacant lots have a total area of 3.7 hectares with each of the sites having an area
between 1 and 1.5 hectares. The three sites all have a slope less than 6%, making them suitable
for industrial use from that perspective (Figure 63).

Southern Tasmania Industrial Land Study / Stage 1 Report
20110171 Southern Tasmania Industrial Land Study (FINAL 120416)
P. 95
Figure 63 Vacant Industrial Land in Triabunna, Parcel Land Gradients

Southern Tasmania Industrial Land Study / Stage 1 Report
20110171 Southern Tasmania Industrial Land Study (FINAL 120416)
P. 96
Two of the three sites are at a sufficient distance from sensitive uses with one of these sites being
separated from residential uses by the main highway (Figure 64). This site may be less suitable for
heavy industrial uses. The third vacant site is adjacent to a residential area and an open space strip
along the waterfront. This site would be less suitable for industrial use.
Figure 64 Vacant Industrial Land in Triabunna and Nearby Sensitive Uses
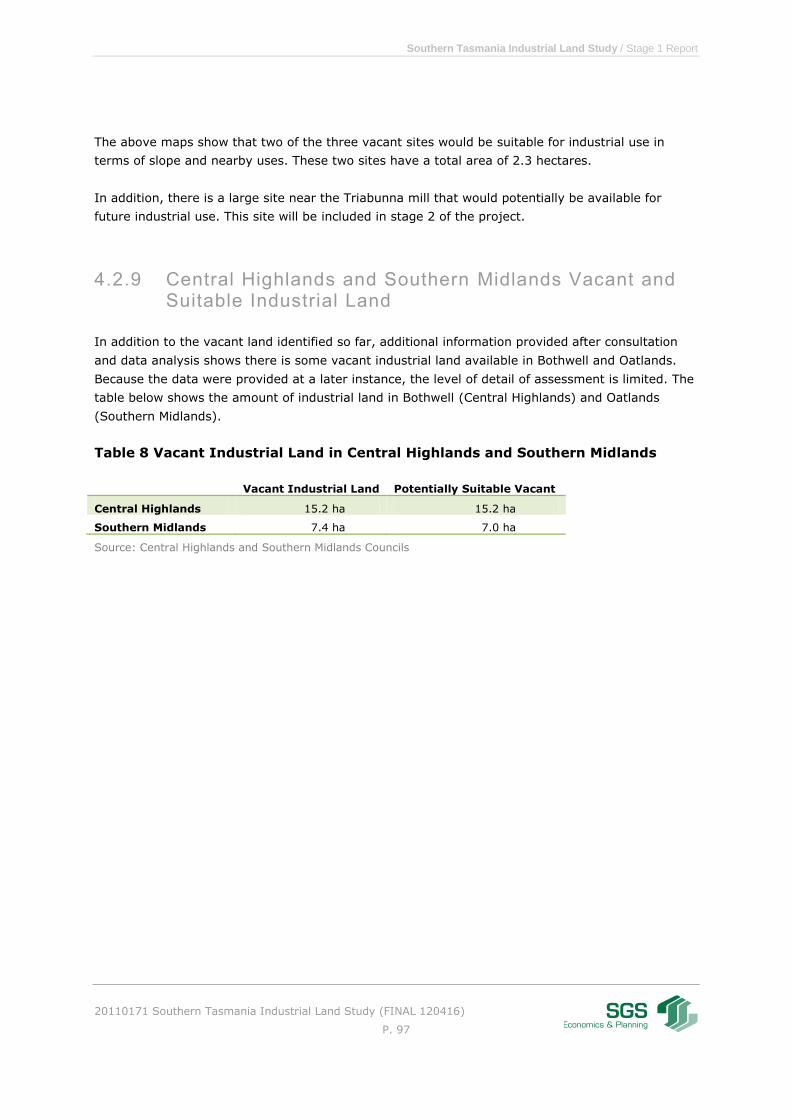
Southern Tasmania Industrial Land Study / Stage 1 Report
20110171 Southern Tasmania Industrial Land Study (FINAL 120416)
P. 97
The above maps show that two of the three vacant sites would be suitable for industrial use in
terms of slope and nearby uses. These two sites have a total area of 2.3 hectares.
In addition, there is a large site near the Triabunna mill that would potentially be available for
future industrial use. This site will be included in stage 2 of the project.
4.2.9 Central Highlands and Southern Midlands Vacant and Suitable Industrial Land
In addition to the vacant land identified so far, additional information provided after consultation
and data analysis shows there is some vacant industrial land available in Bothwell and Oatlands.
Because the data were provided at a later instance, the level of detail of assessment is limited. The
table below shows the amount of industrial land in Bothwell (Central Highlands) and Oatlands
(Southern Midlands).
Table 8 Vacant Industrial Land in Central Highlands and Southern Midlands
Vacant Industrial Land Potentially Suitable Vacant
Central Highlands 15.2 ha 15.2 ha
Southern Midlands 7.4 ha 7.0 ha
Source: Central Highlands and Southern Midlands Councils

Southern Tasmania Industrial Land Study / Stage 1 Report
20110171 Southern Tasmania Industrial Land Study (FINAL 120416)
P. 98
4.2.10 Overview of Vacant and Suitable Industrial Land
The land suitability analysis has significantly narrowed the available supply of vacant and suitable
industrial land in Southern Tasmania. Table 9 illustrates that the initially vacant land supply of 199
hectares or 94 parcels has been diminished to 141 hectares or 67 parcels, once accounting for the
slope and nearby uses of individual parcels.
Table 9 Summary of vacant and suitable industrial land
Municipality Vacant
parcels
Vacant
area
(ha)
Vacant
parcels,
slope
<10%
Vacant
area,
slope
<10%
Vacant
parcels, no
conflicting
uses AND
slope <10%
Vacant area,
no conflicting
uses AND
slope <10%
Brighton 10 11.6 9 6.6 9 6.6
Glenorchy 4 11.8 3 0.8 3 0.8
Clarence 40 105.0 37 83.2 34 81.1
Sorell 4 0.3 4 0.3 4 0.3
Kingborough 17 24.4 11 23.1 2 5.7
Derwent Valley 1 0.6 1 0.6 1 0.6
Huon Valley 5 29.2 2 21.1 2 21.1
Glam.-S.Bay 3 3.7 3 3.7 2 2.3
Central Highl. 3 15.2 3 15.2
Southern Midl. 7 7.4 6 7.0
Grant Total 94 198.5 70 139.4 67 140.6
* Municipalities without any vacant industrial land are not shown
Source: SGS (2011)
4.3 Infill Capacity of Existing Land
Of all the municipalities of Southern Tasmania, Glenorchy has the most pressing shortage of
industrial land. As part of an experimental exercise, SGS analysed current industrial land use
patterns in Glenorchy6.
As a rule of thumb, the building area to site area ratio for industrial activities (local service and
export oriented industries) is 50% or 1:2. This ratio is based on SGS’ data collected over a range of
land use studies in urban and suburban areas in Victoria.
6 From the land use database a selection was made on types of businesses (only industrial,
workshop and manufacturing sites). Then all sites without building areas were excluded from
the analysis. And finally only those localities with more than 20 businesses that meet these criteria were taken into account.

Southern Tasmania Industrial Land Study / Stage 1 Report
20110171 Southern Tasmania Industrial Land Study (FINAL 120416)
P. 99
Comparison of Glenorchy’s building to site ratio with the SGS database suggests that the intensity
of land use in some industrialised areas of Glenorchy is below average. It was calculated that if the
building to site ratio was 50% in Glenorchy, there would still be 26 hectares of vacant industrial
land available.
Better use of existing land has the potential to increase the capacity of municipalities to
accommodate demand for local service industries. This is especially true for those areas that are
experiencing a shortfall of land that may restrict local economic development.
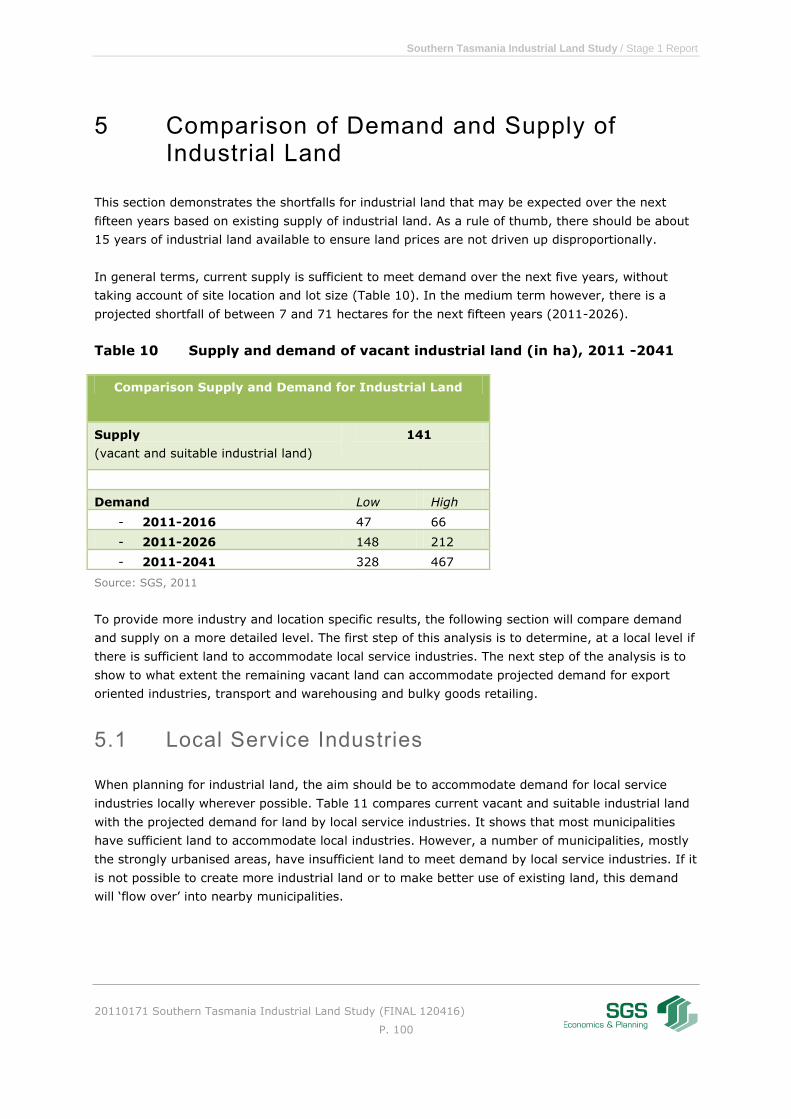
Southern Tasmania Industrial Land Study / Stage 1 Report
20110171 Southern Tasmania Industrial Land Study (FINAL 120416)
P. 100
5 Comparison of Demand and Supply of Industrial Land
This section demonstrates the shortfalls for industrial land that may be expected over the next
fifteen years based on existing supply of industrial land. As a rule of thumb, there should be about
15 years of industrial land available to ensure land prices are not driven up disproportionally.
In general terms, current supply is sufficient to meet demand over the next five years, without
taking account of site location and lot size (Table 10). In the medium term however, there is a
projected shortfall of between 7 and 71 hectares for the next fifteen years (2011-2026).
Table 10 Supply and demand of vacant industrial land (in ha), 2011 -2041
Comparison Supply and Demand for Industrial Land
Supply
(vacant and suitable industrial land)
141
Demand Low High
- 2011-2016 47 66
- 2011-2026 148 212
- 2011-2041 328 467
Source: SGS, 2011
To provide more industry and location specific results, the following section will compare demand
and supply on a more detailed level. The first step of this analysis is to determine, at a local level if
there is sufficient land to accommodate local service industries. The next step of the analysis is to
show to what extent the remaining vacant land can accommodate projected demand for export
oriented industries, transport and warehousing and bulky goods retailing.
5.1 Local Service Industries
When planning for industrial land, the aim should be to accommodate demand for local service
industries locally wherever possible. Table 11 compares current vacant and suitable industrial land
with the projected demand for land by local service industries. It shows that most municipalities
have sufficient land to accommodate local industries. However, a number of municipalities, mostly
the strongly urbanised areas, have insufficient land to meet demand by local service industries. If it
is not possible to create more industrial land or to make better use of existing land, this demand
will ‘flow over’ into nearby municipalities.

Southern Tasmania Industrial Land Study / Stage 1 Report
20110171 Southern Tasmania Industrial Land Study (FINAL 120416)
P. 101
Table 11 Vacant and Suitable Industrial Land with Demand by Local Service
Industries (in ha)
2011 2011-2026 2011-2026
Land Supply Demand for local
service industries
Shortfalls
low high low high
Brighton 6.7 1.6 1.7
Clarence 81.1 4.4 5.5
Derwent Valley 0.6 0.7 0.8
Glenorchy 0.8 7.7 9.6 -6.9 -8.8
Hobart 0 11.7 14.5 -11.7 -14.5
Kingborough 3.6 4.8 6 -1.2 -2.4
Sorell 0.3 1.5 1.8 -1.2 -1.5
Central Highlands 15.2 0.1 0.1
Glamorgan-Spring Bay 2.3 0.9 1.1
Huon Valley 23 1.8 2.2
Southern Midlands 7 0.2 0.2
Tasman 0 0.1 0.2 -0.1 -0.2
Grand total 140.6 35.5 43.7 -21.1 -27.4
Source: SGS, 2011
Although there is no in principle shortfall, the current lot sizes in Brighton are not necessarily
appropriate for local service industries: all parcels are over 2,000 sqm. Consultation with Council
has revealed that some land currently zoned commercial is likely to be rezoned to industrial. This
may provide growth opportunities for local service industries. This is an issue that will be further
investigated in Stage 2 of the project.
Clarence has the most abundant supply of industrial land. Although there is no shortfall of
industrial land to meet demand for local service industries, the currently available lot sizes may
constrain industries requiring parcels of less than 1,000 sqm. As an indication, approximately 40%
of all existing industrial uses operate from lots smaller than 1,000 sqm.
Derwent Valley has sufficient land available to meet demand from local service industries over the
next 15 years. Central Highlands and Southern Midlands have sufficient land available to meet local
demands over the medium to long term.
Glenorchy has insufficient industrial land available to accommodate projected demand for local
service industries. Better use (more intense use) of existing land may enable a higher level of self-
containment (see also 4.3 Infill Capacity of Existing Land). Any demand that is not accommodated
within Glenorchy will most likely flow over to the nearby municipalities of Brighton and Clarence.
Southern Tasmania Industrial Land Study / Stage 1 Report
20110171 Southern Tasmania Industrial Land Study (FINAL 120416)
P. 102
There is sufficient industrial land in Triabunna (Glamorgan-Spring Bay) to accommodate local
service industries. However, current lot sizes do not correspond with the average needs of local
service industries.
In the Huon Valley there is sufficient industrial land to accommodate local service industries.
However, the location and lot sizes of the land do not correspond with the typical needs of local
service industries. Recently, the rezoning of approximately 20 hectares of land to industrial was
approved. This land is close to the regional centre Huonville and therefore likely well positioned to
absorb demand for local service industries. The industrial land in Cygnet (the second centre in the
Valley) would need to be subdivided to meet the needs of local service industries.
For Kingborough, the current supply of suitable industrial land may be insufficient to accommodate
demand by local service industries. A site has been identified for future industrial use. This site will
be assessed in stage two of the study. The available vacant and suitable land does not provide for
small lots of less than 2,000 sqm.
For Sorell, the available vacant industrial land is not sufficient to accommodate demand from local
service industries over a 15-year timeframe. The shortfall is estimated between 1.2 and 1.5
hectares. So far, no new potential sites for future industrial use have been identified. This issue will
be taken up in stage 2 of the study.
Hobart is the most urbanised area of Southern Tasmania and the prime economic centre. As in
many other cities, local service industries are pushed towards the fringes of the metropolitan area.
The shortfall of industrial land for local service industries is projected to be between 12 and 15
hectares over the next 15 years. Most of this demand will flow over into nearby municipalities with
sufficient suitable land; mostly Clarence. While there is little, if any opportunity to create more
industrial land in Hobart, it would be important to retain at least some industrial land. It is
expected that Hobart, and to some extent Glenorchy will experience a market drive towards higher
value uses in these areas and a push to rezone some industrial land to commercial and in some
cases to residential.
For the Central Highlands and the Southern Midlands no shortfall is expected over the next 15
years for local service industries. The municipalities indicate there is no demand for industrial land.
Tasman is projected to experience a small shortfall of industrial land to accommodate local service
industries. Consultation with Council shows there may be opportunities for future industrial
zonings. This will be further investigated in stage 2.
If both Hobart and Glenorchy are not able to accommodate more local service industries through
better use of existing land and/or the creation of more industrial land, there is between 19 and 23
hectares of demand for local service industries that would flow over to nearby municipalities,
mostly Clarence and some to Brighton (but that is further out from the centre of Greater Hobart
and demand would experience competition from export industries and transport and warehousing).
Assuming that Clarence and Brighton would accommodate this over flow of demand, there would
be no vacant land left in Brighton and between 57 and 63 hectares of industrial land left in

Southern Tasmania Industrial Land Study / Stage 1 Report
20110171 Southern Tasmania Industrial Land Study (FINAL 120416)
P. 103
Clarence to accommodate other industrial uses, that is export oriented industries, transport and
warehousing and bulky goods retailing.
5.2 Comparison for Other Industries
Table 12 shows the amount of vacant and suitable industrial land by municipality that remains after
allowing for demand by local service industries (and over flow demand). It shows that after
allowing for demand by local service industries there is between 101 (high demand scenario) and
108 (low demand scenario) hectares of land remaining.
Table 12 Vacant and Suitable Industrial Land after Allowing for Local Service
Industries (in ha)
Supply after allowing for local
service industries (2011-2026)
low high
Brighton 0.0 0.0
Central Highlands 15.1 15.1
Clarence 63.1 57.2
Derwent Valley 0 0.0
Glamorgan-Spring Bay 1.4 1.2
Glenorchy 0.0 0.0
Hobart 0.0 0.0
Huon Valley 21.2 20.8
Kingborough 0.0 0.0
Sorell 0.0 0.0
Southern Midlands 6.8 6.8
Tasman 0.0 0.0
Grand total 107.7 101.2
Source: SGS (2011)
The majority of the land, or about two thirds, is located within the municipality of Clarence. A
significant amount is also located in the Huon Valley. No land would remain available in Brighton.
However, export oriented industries and transport and warehousing may take up the current five
vacant hectares before local service industries do: in that case Brighton would experience a
shortfall of land for local service industries.
In planning for industrial land for the remaining categories (export oriented industries, transport
and warehousing and bulky goods retailing) both export oriented industries and transport and
warehousing will be treated preferentially to bulky goods retailing (which does not necessarily need
to be accommodated on industrial land). Moreover, most of the demand for bulky goods retailing is
likely to be catered for within the Hobart International Airport precinct, which is federal land, and
as such development does not need to comply with local planning guidelines.

Southern Tasmania Industrial Land Study / Stage 1 Report
20110171 Southern Tasmania Industrial Land Study (FINAL 120416)
P. 104
About 92% of jobs in Southern Tasmania are located in Greater Hobart. It is most likely that this
pattern will not change strongly in the future. If excluding land demand for bulky goods retailing,
the expected shortfall of industrial land for other industries over the next 15 years would be up to
57 hectares when considering available land in the entire region (a. Shortfall of Land (Southern
Tasmania) Table 13). When considering that the majority of demand (92%) would occur within
Greater Hobart, then the shortfall of land would be between 34 and 88 (b. Shortfall of Land
(Greater Hobart Table 13). For the regional areas in Southern Tasmania there is in principle no
shortfall of industrial land for export industries and transport and warehousing.
Table 13 Land Supply, Demand and Shortfalls for Transport, Warehousing
and Export Oriented Industries*
Low scenario High scenario
Supply
- Brighton 0.0 0.0
- Clarence* 63.1 57.2
- Glamorgan-Spring Bay 1.4 1.2
- Huon Valley 21.2 20.8
- Central Highlands 15.1 15.1
- Southern Midlands 6.8 6.8
a. Total Supply 107.7 101.2
b. Total Supply Greater Hobart 63.1 57.2
c. Total Supply regional areas outside Greater Hobart 44.6 44.0
Demand 2011-2026
- Transport and Warehousing 86 125
- Export Oriented Industries 19 33
Total Demand (100%) 105 158
Total Demand for Greater Hobart (92%) 97 145
Total Demand for regional areas (8%) 8 13
a. Shortfall of land (Southern Tasmania) +3 -57
b. Shortfall of land (Greater Hobart) -34 -88
c. Shortfall of land (regional areas outside Greater Hobart) +37 +31
* After allowing demand for local service industries to be accommodated.
**Assuming Clarence accommodates over flow demand from both Glenorchy and Hobart.
Source: SGS (2011)
In general terms, Brighton and Clarence are best positioned for many regionally-significant
industrial sites, most notably transport and warehousing.

Southern Tasmania Industrial Land Study / Stage 1 Report
20110171 Southern Tasmania Industrial Land Study (FINAL 120416)
P. 105
Brighton is strategically positioned at the outskirts of Greater Hobart, is along the key transport
corridor to the north, and its linked to interstate and international markets via its port. However,
there is currently little vacant land remaining.
The Clarence region has good access to the Hobart International Airport, and therefore any
development requiring air transport would best be located in Clarence. However, if it is not possible
to significantly expand the supply of industrial land in the Brighton area, then Clarence would be
the next best location to accommodate a significant share of demand for transport, warehousing
and export oriented industries. This would require sufficient access and road capacity between
Clarence and the north-south corridor. This issue will need to be addressed in Stage 2 of the study.
Industrial land in the Huon Valley is not optimally located to accommodate significant portions of
demand for transport, warehousing and export oriented industries. The Huon Valley is best located
to accommodate land demand from industries that are related to the rich resources of the region:
timber (which is experiencing decline currently), aquaculture and agriculture. However, transport
and warehousing related to these industries could be accommodated in the Huon Valley.
Industrial land in Glamorgan-Spring Bay is located at significant distance from the economic centre
of Greater Hobart, with sub-optimal road connections providing access to the region. The industrial
land in Triabunna would be suitable for transport, warehousing and export oriented industries
associated with aquaculture / commercial fishing, forest industry and activities, and could make
use of the local port facilities.
In short, the vast majority of transport, warehousing and export oriented industry activities will
expectedly locate in Greater Hobart. Greater Hobart is home to 92% of the region’s employment
and economic activity, has a relatively skilled labour force and access to transport routes with
(indirect) interstate and international connections. Greater Hobart is also where most supporting
service industries, government and education institutions are located. Within Greater Hobart there
is only land available in Clarence and Brighton. These areas add between 57 and 63 hectares of
industrial land suitable for transport, warehousing and export oriented industries, after allowing for
local service industries.
When taking the scale of Greater Hobart into account, the total shortfall of industrial land for
transport, warehousing and export oriented industries is between 34 to 88 hectares (row b.
Shortfall of land Greater Hobart Table 13). This figure is after accounting for industries that would
locate in regional areas. There is in principle sufficient vacant industrial land in the regional areas
of Southern Tasmania.

Southern Tasmania Industrial Land Study / Stage 1 Report
20110171 Southern Tasmania Industrial Land Study (FINAL 120416)
P. 106
The ratio between transport, warehousing and export oriented industries land demand is
approximately 1:4, with the projected shortfalls shown in the table below (Table 14). It should be
noted that better use of existing land (intensification and infill development) may reduce the
shortfall somewhat. This would however require State and or regional measures to enable better
use of existing land through land redevelopment projects.
Table 14 Shortfalls of Industrial Land in Greater Hobart (in ha)
Low High
Shortfall Transport & Warehousing 27 70
Export Oriented Industries 7 18
Total Land Shortfall* 34 88
*For export oriented industries and transport & warehousing
Source: SGS (2011)
Stage 2 of this study needs to address these shortfalls and identify opportunities for future
industrial zoned land to accommodate these needs, primarily within the Greater Hobart area.
In the longer term (to 2041) total demand for industrial land is projected to increase to between
328 to 467 hectares, suggesting an additional need in the order of 187 and 326 hectares of land.
Stage 2 of the study needs to consider –in broad terms only- what areas may need to be reserved
for industrial use for the very long term (30 years).

Southern Tasmania Industrial Land Study / Stage 1 Report
20110171 Southern Tasmania Industrial Land Study (FINAL 120416)
P. 107
5.3 Recommendations and Conclusions
In short, the following list summarises the issues and tasks that need to be addressed in Stage 2 of
this study:
Shortfalls of local industrial land to accommodate future demand for local service industries
over the period 2011-2026 in:
o Glenorchy;
o Kingborough;
o Sorell;
o Hobart; and
o possible minor shortfalls in Tasman.
Potential shortfalls for local service industries based on current lot sizes and competing
demand from transport and warehousing and export oriented industries in Brighton.
Shortfalls of regionally significant industrial land to accommodate future demand for
transport & warehousing and export oriented industries of between 34 and 88 hectares. Of
this total, between 7 and 18 hectares would be for export oriented industries and 27 to 70
hectares for transport & warehousing. The additional land needs should primarily be
catered for within Greater Hobart.
Identified potential future locations for industrial development in this report, including7:
o Clarence (Kennedy Road and adjacent to the Hobart International Airport)
o Brighton (New industrial park adjacent to new Intermodal Transport Hub)
o Huon Valley (Potential for new industrial land in Huonville – as identified in Huon
Valley Land Use and Development Strategy).
Accessibility and road infrastructure capacity to regionally significant industrial land
supplies in Clarence and elsewhere.
Identify and consider, in broad terms only, potential sites to accommodate long term
industrial land demand (30 year horizon) of between 188 and 326 hectares.
7 In addition, SGS will consider sites that have been identified as part of a survey amongst all Councils
as part of the Industrial land Demand Study (2011-2041) for DEDTA.
Southern Tasmania Industrial Land Study / Stage 1 Report
20110171 Southern Tasmania Industrial Land Study (FINAL 120416)
P. 108
Appendix A Documents, Strategies and Policies Review
The following documents were reviewed:
Clarence City Industrial Development Strategy, AEC Group (2007)
Draft Hobart Airport Master Plan, Hobart International Airport Pty Ltd, Arup (2009)
Brighton Structure Plan, Brighton Council, Aurecon (2008)
City of Clarence Business Prospectus, Clarence City Council (2008)
Making the right connections: a strategic study of industrial land and infrastructure in
Southern Tasmania, Department of Infrastructure, Energy & Resources (2005)
Region Background Report – Southern Integrated Transport Plan, State of Tasmania &
Southern Tasmanian Councils Authority, Department of Infrastructure, Energy & Resources
(2006)
Tasmanian Urban Passenger Transport Framework: Future Directions for passenger
transport in Tasmania’s urban areas, State of Tasmania, Department of Infrastructure,
Energy & Resources (2009)
Huon Valley Land Use & Development Strategy, Huon Valley Council, GHD Pty Ltd (2007)
Planning Scheme Review Project: Topic Papers – Infrastructure, Glenorchy City Council,
Glenorchy City Council (2008c)
Review of the Working Port of Hobart, Tasports Pty Ltd, Merrick & Associates (2008)
Metropolitan Adelaide Industry Land Use Strategy, Planning SA Government of South
Australia (2007)
Economic Impact Assessment of a DFO at the Hobart International Airport, Hobart City
Council, SGS Economics and Planning (2006)
Hobart Gaps and Opportunities Analysis, Hobart City Council, SGS Economics and Planning
(2006)
Industrial Land Demand Tasmania: Short to Medium Term overview, Department of
Economic Development, SGS Economics & Planning Pty Ltd (2008 & 2011)
Draft Southern Tasmania Regional Land Use Strategy.
Southern Tasmania Regional Land Use Strategy Background Report No.12: Industrial
Activity, Southern Tasmanian Councils Authority (Sep 2010)
Site investigation report for the Brighton Transport Hub, SKM
Southern Integrated Transport Plan, Department of Infrastructure, Energy & Resources and
the Southern, Tasmanian Councils Authority (2010)
Draft Orford-Triabunna Structure Plan.
Draft Huonville Structure Plan.

Southern Tasmania Industrial Land Study / Stage 1 Report
20110171 Southern Tasmania Industrial Land Study (FINAL 120416)
P. 109