southeast minnesota economic and business … minnesota economic and business conditions report...
TRANSCRIPT

Southeast MinnesotaEconomic and Business Conditions ReportThird Quarter 2014

1
TABLE OF CONTENTS
Executive Summary ................................................................................1
Southeast Minnesota Leading Economic Indicators Index .....................2
Southeast Minnesota Business Filings ....................................................4
Southeast Minnesota Labor Market Conditions ...................................10
Southeast Minnesota Bankruptcies ......................................................15
Economic Indicators .............................................................................16
Sources ................................................................................................. 18
Executive Summary
Southeast Minnesota business conditions are expected to remain steady over the next several months according to a variety of economic indicators. Despite a small decline in the Southeast Minnesota Index of Leading Economic Indicators (LEI) in the third quarter, the level of the LEI is well above its 2013 value. Improvements in consumer sentiment and lower initial jobless claims had a positive impact on this quarter’s LEI, while a slowing of the growth of new filings for business incorporation and limited liability company (LLC), a fall in the Minnesota Business Conditions index, and declining Rochester metropolitan area residential building permits served as a drag on the leading index. Despite the one-point decline in the third quarter LEI, the Southeast Minnesota Index remains 5.5 percent higher than one year ago.
There were 765 new business filings with the Office of the Minnesota Secretary of State in Southeast Minnesota in the third quarter of 2014 — representing a 9.9 percent decline from one year ago. There were 74 new regional business incorporations in the third quarter, a 37 percent rise over year ago levels. Over the past year, new limited liability company (LLC) filings in Southeast Minnesota increased by 2.8 percent—rising to 442 in the third quarter of 2014. New assumed names totaled 212 in this year’s third quarter—a reduction of 34.4 percent from the third quarter of 2013. There were 37 new filings for non-profits in the third quarter—two more filings than one year ago.
Employment of Southeast Minnesota residents increased by 0.9 percent over the year ending September 2014. Compared to September 2013, nearly 2,500 more residents now have jobs. The regional unemployment rate was 3.3 percent in September, an improvement from 4.2 percent in the year earlier period. Initial claims for unemployment insurance in October 2014 were 324 lower (a 21.6 percent decline) than one year ago. The labor force was little changed over the past 12 months. Regional job vacancies increased in the most recent period. Job vacancies per 100 unemployed are now higher than they have been for many years. Bankruptcies fell to an annual total of 883 in the second quarter. This is 17.3 percent lower than the annual total in last year’s second quarter.
Data from the Rochester area—the largest market in Southeast Minnesota—were mixed with recent weakness in the value of residential building permits, lower new business filings, and lower average hourly earnings being offset by lower initial jobless claims, expanded employment, and a declining Rochester area unemployment rate.
2
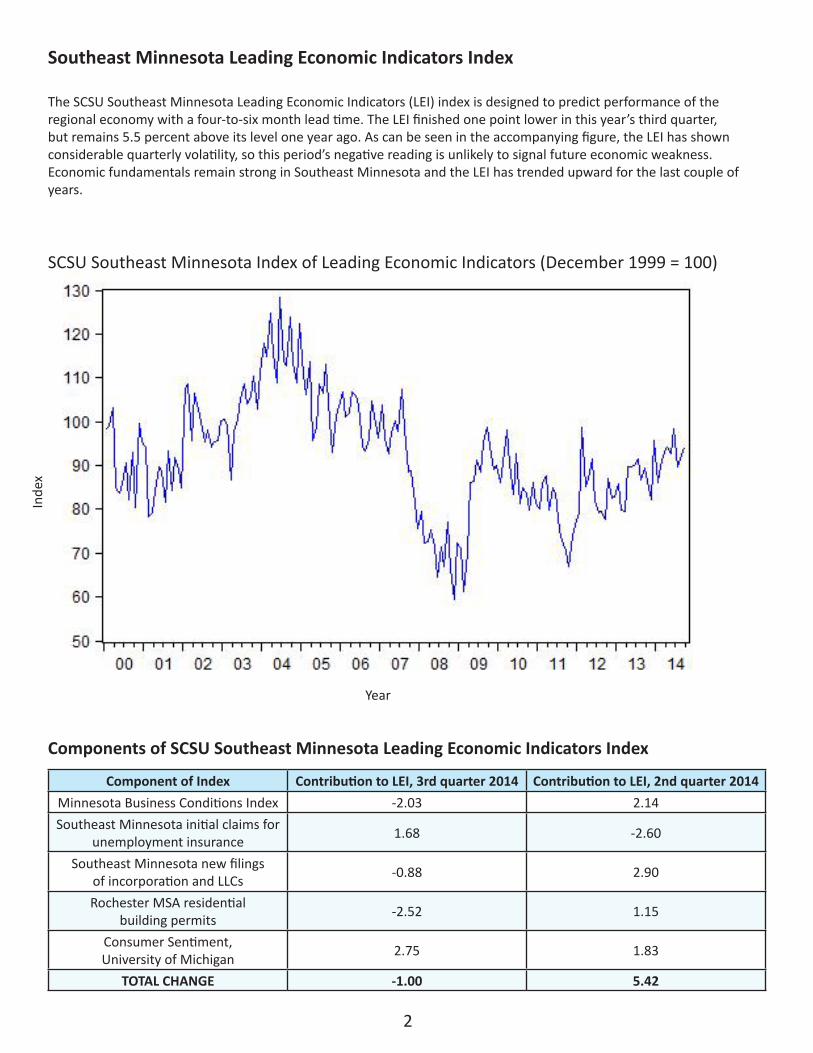
Southeast Minnesota Leading Economic Indicators Index
The SCSU Southeast Minnesota Leading Economic Indicators (LEI) index is designed to predict performance of the regional economy with a four-to-six month lead time. The LEI finished one point lower in this year’s third quarter, but remains 5.5 percent above its level one year ago. As can be seen in the accompanying figure, the LEI has shown considerable quarterly volatility, so this period’s negative reading is unlikely to signal future economic weakness. Economic fundamentals remain strong in Southeast Minnesota and the LEI has trended upward for the last couple of years.
Component of Index Contribution to LEI, 3rd quarter 2014 Contribution to LEI, 2nd quarter 2014Minnesota Business Conditions Index -2.03 2.14Southeast Minnesota initial claims for
unemployment insurance 1.68 -2.60
Southeast Minnesota new filings of incorporation and LLCs -0.88 2.90
Rochester MSA residential building permits -2.52 1.15
Consumer Sentiment, University of Michigan 2.75 1.83
TOTAL CHANGE -1.00 5.42
Components of SCSU Southeast Minnesota Leading Economic Indicators Index
SCSU Southeast Minnesota Index of Leading Economic Indicators (December 1999 = 100)
Year
Inde
x
3
Leading Economic Indicators Index
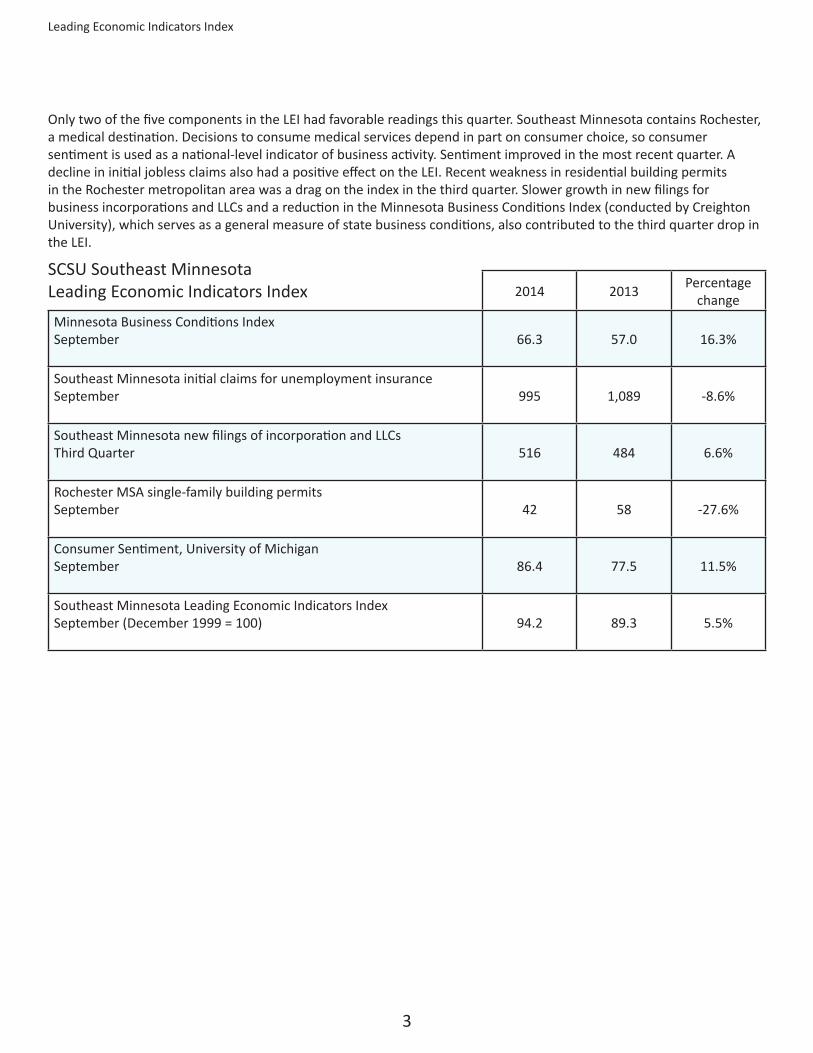
Only two of the five components in the LEI had favorable readings this quarter. Southeast Minnesota contains Rochester, a medical destination. Decisions to consume medical services depend in part on consumer choice, so consumer sentiment is used as a national-level indicator of business activity. Sentiment improved in the most recent quarter. A decline in initial jobless claims also had a positive effect on the LEI. Recent weakness in residential building permits in the Rochester metropolitan area was a drag on the index in the third quarter. Slower growth in new filings for business incorporations and LLCs and a reduction in the Minnesota Business Conditions Index (conducted by Creighton University), which serves as a general measure of state business conditions, also contributed to the third quarter drop in the LEI.
2014 2013 Percentage change
Minnesota Business Conditions Index September 66.3 57.0 16.3%
Southeast Minnesota initial claims for unemployment insuranceSeptember 995 1,089 -8.6%
Southeast Minnesota new filings of incorporation and LLCsThird Quarter 516 484 6.6%
Rochester MSA single-family building permitsSeptember 42 58 -27.6%
Consumer Sentiment, University of MichiganSeptember 86.4 77.5 11.5%
Southeast Minnesota Leading Economic Indicators IndexSeptember (December 1999 = 100) 94.2 89.3 5.5%
SCSU Southeast Minnesota Leading Economic Indicators Index

4
Southeast Minnesota Business Filings
Total new business filings grew rapidly from 2000 to 2005, at which point they leveled off for three years (2006–2008). The abrupt increase in new filings in the middle of 2008 is largely a result of increased new LLC filings. This outlier (resembling a shark fin in the graph below) is related to considerably higher filings in the construction industry due to legal and regulatory issues and appears to be a one-time only transitory event seen in the data in all regions of Minnesota. New filings declined during and after the Great Recession, but have rebounded since the beginning of 2012. Third quarter total new business filings were 9.9 percent lower than in the third quarter of 2013.
Note: The graphs in this section show the 12-month moving total for the various new business filings in Southeast Minnesota registered with the Office of the Minnesota Secretary of State, thereby removing seasonal patterns in the data.
Total New Business Filings—Southeast Minnesota Planning Area (12-month moving total)
Quarter III:2013
IV:2013
I:2014
II:2014
III:2014
2014 Quarter 3: Percent change from prior year
Southeast Minnesota Total New Business Filings 842 780 847 842 765 -9.9%
Year
Filin
gs

5
Business Filings
New business incorporations trended downward in Southeast Minnesota from 2005 to 2012, but they appear to have leveled off over the past two years. In the third quarter of 2014, this series increased by 37 percent from one year earlier.
New Incorporations—Southeast Minnesota Planning Area (12-month moving total)
Quarter III:2013
IV:2013
I:2014
II:2014
III:2014
2014 Quarter 3: Percent change from prior year
Southeast Minnesota New Business Incorporations 54 75 63 75 74 37.0%
Year
Filin
gs

6
Business Filings
There has been a move in Southeast Minnesota, as in all of the state, away from the traditional incorporation form of business organization towards the LLC. While new business incorporations remain an important indicator of new business formation, LLCs are increasingly useful in evaluating regional economic performance. As seen below, there is a considerable upward trend in LLCs . With the exception of the outlier period in 2008-2009, new LLC formation has shown a fairly steady rate of growth since 2000. Third quarter LLC filings increased by 2.8 percent over their level from a year ago.
New Limited Liability Companies—Southeast Minnesota Planning Area (12-month moving total)
Quarter III:2013
IV:2013
I:2014
II:2014
III:2014
2014 Quarter 3: Percent change from prior year
Southeast Minnesota New Limited Liability Companies 430 450 473 513 442 2.8%
Year
Filin
gs

7
Business Filings
Assumed names, which include sole proprietors or organizations that do not have limited liability, declined substantially in Southeast Minnesota in the third quarter. With a 34.4 percent annualized decrease in the recent quarter, the regional reduction in new assumed names was the largest decline of all six Minnesota planning areas. As can be seen in the accompanying graph, this series remains very volatile.
New Assumed Names—Southeast Minnesota Planning Area (12-month moving total)
Quarter III:2013
IV:2013
I:2014
II:2014
III:2014
2014 Quarter 3: Percent change from prior year
Southeast Minnesota New Assumed Names 323 207 273 213 212 -34.4%
Year
Filin
gs

8
Business Filings
After bottoming out in 2010, the number of new non-profits registered with the Office of the Minnesota Secretary of State increased to levels seen just before the Great Recession. The number of newly formed non-profits totaled 37 in the recent quarter (a 5.7 percent increase from last year’s third quarter).
New Non-Profits—Southeast Minnesota Planning Area (12-month moving total)
Quarter III:2013
IV:2013
I:2014
II:2014
III:2014
2014 Quarter 3: Percent change from prior year
Southeast Minnesota New Non-Profits 35 48 38 41 37 5.7%
Year
Filin
gs

9
Business Filings
The two maps below attempt to highlight new business formation in the Rochester Metropolitan Statistical Area (MSA) in two periods: 2000–2004 (quarter 3) and 2010–2014 (quarter 3). This MSA consists of three counties—Olmsted, Dodge and Wabasha. Each dot in the map represents a newly formed business in the relevant time period. While the composition of the dots has certainly changed (for example, there are now more LLCs and fewer business incorporations), little seems to have changed in the general pattern of business formation in the Rochester MSA since the beginning of the 21st century. Most newly formed businesses are in the Rochester city area and other clusters of business filings tend to follow key roadways.
New Business Formation Between 2000 and 2004:III—Rochester MSA
New Business Formation Between 2010 and 2014:III—Rochester MSA

10
Southeast Minnesota Labor Market Conditions
Employment of residents in the Southeast Minnesota planning area grew 0.9 percent over the past year. As shown in the accompanying graph, the 12-month moving average of total employment has increased since the beginning of 2011.
Note: Seasonally adjusted labor market data are typically not available to evaluate regional economic performance so some series have been created to illustrate seasonal patterns of the regional labor market. Graphs of these indicators are found in this section of the report. Tabular data are not seasonally adjusted. To request access to seasonally adjusted series, contact the SCSU School of Public Affairs Research Institute, [email protected].
Employment—Southeast Minnesota Planning Area (12-month moving average)
Month September2013
April 2014
May 2014
June2014
July2014
August2014
September2014
Employment (Not seasonally
adjusted)262,962 261,528 262,841 265,222 266,717 266,082 265,374
Year
Empl
oym
ent

11
Labor Market Conditions
Seasonally adjusted unemployment in Southeast Minnesota continued to decline in the third quarter of 2014. The unemployment rate in this part of Minnesota has declined since peaking out at the end of the Great Recession. The non-seasonally adjusted unemployment rate now stands at 3.3 percent—considerably lower than the 4.2 percent rate observed one year ago.
Unemployment Rate, seasonally adjusted—Southeast Minnesota Planning Area
Month September2013
April 2014
May 2014
June2014
July2014
August2014
September2014
Unemployment Rate(Not seasonally adjusted) 4.2% 4.3% 4.0% 4.4% 4.1% 3.5% 3.3%
Year
Une
mpl
oym
ent R
ate

12
Labor Market Conditions
New claims for October 2014 unemployment insurance were 324 lower than one year ago. This represents a 21.6 percent annual decline. On a seasonally adjusted basis, these claims have continued to fall since peaking out in mid-2009.
Total Initial Claims for Unemployment Insurance, seasonally adjusted—Southeast Minnesota Planning Area
Month October2013
May2014
June 2014
July2014
August 2014
September2014
October2014
Initial claims(Not seasonally adjusted) 1,498 1,216 1,354 1,093 817 995 1,174
Year
Clai
ms

13
Labor Market Conditions
The number of job vacancies is expanding throughout the state as worker shortages grow. In the Southeast Minnesota planning area, the rate of job vacancies per 100 unemployed was 54.52 in the second quarter of 2014 (the most recently available data). This is the highest reading for this series in several years.
Job Vacancies per 100 Unemployed—Southeast Minnesota Planning Area
Quarter 2011:IV 2012:II 2012:IV 2013:II 2013:IV 2014:II Job Vacancies per 100
Unemployed 27.25 43.64 37.24 41.85 48.21 54.52
Year
Vaca
ncie
s

14
Labor Market Conditions
The Southeast Minnesota labor force has declined slightly over the last year. Since September 2010, the labor force has dropped by 1,336 people—a 0.5 percent decline. Only the Twin Cities and Central Minnesota planning areas are currently experiencing a rising work force; the labor force is declining in Minnesota’s other four planning areas.
Labor Force—Southeast Minnesota Planning Area (12-month moving average)
Year (September) 2009 2010 2011 2012 2013 2014Labor Force
(Not seasonally adjusted) 273,431 275,728 274,511 274,746 274,488 274,392
Year
Labo
r For
ce

15
Bankruptcies
This quarter’s report includes a measure of bankruptcies in Southeast Minnesota. The 12-month moving total shown below illustrates the annual number of bankruptcies since 2004. After trending upward since 2007, the annual number of bankruptcies has steadily declined since the beginning of 2011. The region appears to be returning to a level of bankruptcies that was last seen before the Great Recession. The precipitous drop in bankruptcies in late 2005 resulted from a law change (the Bankruptcy Abuse Prevention and Consumer Protection Act) that made it more difficult for households to declare bankruptcy. This pattern of bankruptcy filings is seen in each of Minnesota’a six planning areas.
Year (Second Quarter) 2009 2010 2011 2012 2013 2014Annual Bankruptcies(Not seasonally adjusted) 1,499 1,728 1,526 1,308 1,068 883
Bank
rupt
cies
Quarter
Total Annual Bankruptcies—Southeast Minnesota Planning Area (12-month moving average)
Southeast Minnesota Bankruptcies
16
Economic Indicators
Southeast Minnesota Economic Indicators
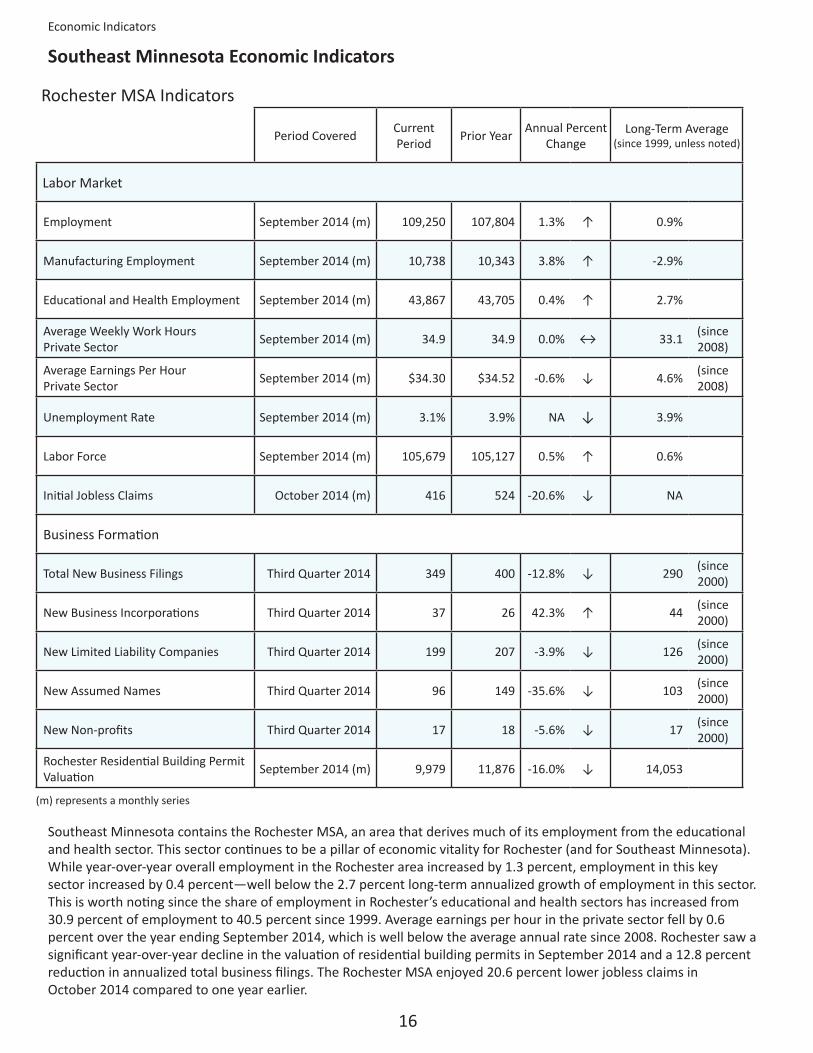
Rochester MSA Indicators
Southeast Minnesota contains the Rochester MSA, an area that derives much of its employment from the educational and health sector. This sector continues to be a pillar of economic vitality for Rochester (and for Southeast Minnesota). While year-over-year overall employment in the Rochester area increased by 1.3 percent, employment in this key sector increased by 0.4 percent—well below the 2.7 percent long-term annualized growth of employment in this sector. This is worth noting since the share of employment in Rochester’s educational and health sectors has increased from 30.9 percent of employment to 40.5 percent since 1999. Average earnings per hour in the private sector fell by 0.6 percent over the year ending September 2014, which is well below the average annual rate since 2008. Rochester saw a significant year-over-year decline in the valuation of residential building permits in September 2014 and a 12.8 percent reduction in annualized total business filings. The Rochester MSA enjoyed 20.6 percent lower jobless claims in October 2014 compared to one year earlier.
Period Covered Current Period Prior Year Annual Percent
ChangeLong-Term Average
(since 1999, unless noted)
Labor Market
Employment September 2014 (m) 109,250 107,804 1.3% ↑ 0.9%
Manufacturing Employment September 2014 (m) 10,738 10,343 3.8% ↑ -2.9%
Educational and Health Employment September 2014 (m) 43,867 43,705 0.4% ↑ 2.7%
Average Weekly Work HoursPrivate Sector September 2014 (m) 34.9 34.9 0.0% ↔ 33.1 (since
2008)
Average Earnings Per HourPrivate Sector September 2014 (m) $34.30 $34.52 -0.6% ↓ 4.6% (since
2008)
Unemployment Rate September 2014 (m) 3.1% 3.9% NA ↓ 3.9%
Labor Force September 2014 (m) 105,679 105,127 0.5% ↑ 0.6%
Initial Jobless Claims October 2014 (m) 416 524 -20.6% ↓ NA
Business Formation
Total New Business Filings Third Quarter 2014 349 400 -12.8% ↓ 290 (since 2000)
New Business Incorporations Third Quarter 2014 37 26 42.3% ↑ 44 (since 2000)
New Limited Liability Companies Third Quarter 2014 199 207 -3.9% ↓ 126 (since 2000)
New Assumed Names Third Quarter 2014 96 149 -35.6% ↓ 103 (since 2000)
New Non-profits Third Quarter 2014 17 18 -5.6% ↓ 17 (since 2000)
Rochester Residential Building Permit Valuation September 2014 (m) 9,979 11,876 -16.0% ↓ 14,053
(m) represents a monthly series

17
Economic Indicators
State and National Indicators
Across the state there was growth in payrolls and a decline in the unemployment rate from one year ago. Average weekly hours worked fell, although earnings per hour in the private sector rose over the past year. Two of three broader indicators suggest strength in the state economy. Milk prices are 32.2 percent higher than one year ago—an important favorable indicator in many areas of Minnesota. Enplanements at the Minneapolis-St. Paul Airport increased by3.2 percent over the last 12 months.
The national economy continued to grow at a solid pace in the third quarter. Compared to year earlier levels, stock prices, industrial production, retail sales, real income, real consumption expenditures, payroll employment, and the unemployment rate all look strong. Oil prices have declined over the past year, putting more discretionary income in the hands of consumers as they enter the holiday season. The national economy looks to have considerable momentum as 2015 approaches.
MINNESOTA Indicators Sept 2014 June 2014 Sept 2013
Change from one
quarter agoAnnual Change
Nonfarm payroll employment, SA 2,834,700 2,818,800 2,784,000 0.6% 1.8%Average weekly hours worked, private sector 34.0 34.5 34.3 -1.4% -0.9%Unemployment rate, seasonally adjusted 4.1% 4.5% 4.9% NA NAEarnings per hour, private sector $25.83 $25.73 $25.77 0.4% 0.2%Philadelphia Fed Coincident Indicator, MN 166.07 164.09 160.31 1.2% 3.6%Philadelphia Fed Leading Indicator, MN 2.32 2.24 1.67 3.6% 38.9%Minnesota Business Conditions Index 66.3 70.1 57 -5.4% 16.3%Price of milk received by farmers (cwt) $26.70 $23.40 $20.20 14.1% 32.2%Enplanements, MSP Airport, thousands 1,409.8 1,609.6 1,366.7 -12.4% 3.2%
NATIONAL Indicators Sept 2014 June 2014 Sept 2013
Change from one
quarter agoAnnual Change
Nonfarm payroll employment, SA, thousands 139,435 138,764 136,800 0.5% 1.9%Industrial production, index, SA 105.0 104.0 100.7 4.3% 3.3%Real retail sales, SA 186,423 185,251 181,553 0.6% 2.7%Real personal Income less transfers 11,291 11,237 11,032 0.5% 2.3%Real personal consumption expenditures 10,964 10,935 10,742 0.3% 2.1%Unemployment rate 5.9% 6.1% 7.2% NA NANew building permits, SA, thousands 1,031 973 993 6.0% 3.8%Standard & Poor’s 500 stock price index 1,993.23 1,947.09 1,687.17 4.5% 20.3%Oil, price per barrel in Cushing, OK $93.21 $105.79 $106.29 -11.9% -12.3%
18
Sources
The Southeast Minnesota Quarterly Economic and Business Conditions Report is a collaboration between the Office of the Minnesota Secretary of State and the School of Public Affairs Research Institute (SOPARI) of St. Cloud State University. All calculations and text are the result of work by SOPARI, which is solely responsible for errors and omissions herein.
This issue is part of a series for the six planning areas of Minnesota – Central, Northeast, Northwest, Southeast, Southwest and Twin Cities. The Southeast Minnesota Planning Area consists of 11 counties: Dodge, Fillmore, Freeborn, Goodhue, Houston, Mower, Olmsted, Rice, Steele, Wabasha and Winona.
Text authored by Professors King Banaian and Rich MacDonald of the Economics Department of St. Cloud State University. Research assistance provided by Katie Kotschevar. Yasemin Yucedag and Joe Kucan assisted with bankruptcy data. Professor David Wall of the SCSU Geography Department provided GIS assistance.
Sources
Council for Community and Economic Research: Cost-of-Living Index.
Creighton University Heider College of Business: Minnesota Business Conditions Index, Rural MainStreet Index.
Federal Reserve Bank of Philadelphia: Minnesota Coincident Indicator Index, Minnesota Leading Indicators Index.
Federal Reserve Board of Governors: Industrial Production.
Institute for Supply Management: Manufacturing Business Survey, Purchasing Managers Index.
Metropolitan Airports Commission: MSP Enplanements.
Minnesota Department of Employment and Economic Development (and U.S. Department of Labor Bureau of Labor Statistics):
Average Hourly Earnings, Average Weekly Work Hours, Employment, Initial Claims for Unemployment Insurance, Job Vacancies, Labor
Force, Manufacturing Employment, Unemployment Rate.
Office of the Minnesota Secretary of State: Assumed Names, Business Incorporations, Limited Liability Companies, Non-Profits.
Standard & Poor’s: Standard & Poor’s 500 Stock Price Index.
Thomson Reuters and University of Michigan: Index of Consumer Sentiment.
U.S. Bankruptcy Courts: Total Annual Bankruptcies
U.S. Census Bureau: Durable Goods Orders, Housing Permits, Residential Building Permits, Retail Sales.
U.S. Department of Agriculture: Milk Prices.
U.S. Department of Commerce Bureau of Economic Analysis: Real Personal Consumption, Real Personal Income, Real Wages and
Salaries.
U.S. Energy Information Administration: Oil Prices.