south atlantic coastal study quarterly webinar
TRANSCRIPT
South Atlantic Coastal StudyQuarterly Webinar
CONNECTION INFORMATION:
Webinar:
https://attendee.gotowebinar.com/register/8910897840115176205
Webinar #4
January 26th, 2021
2
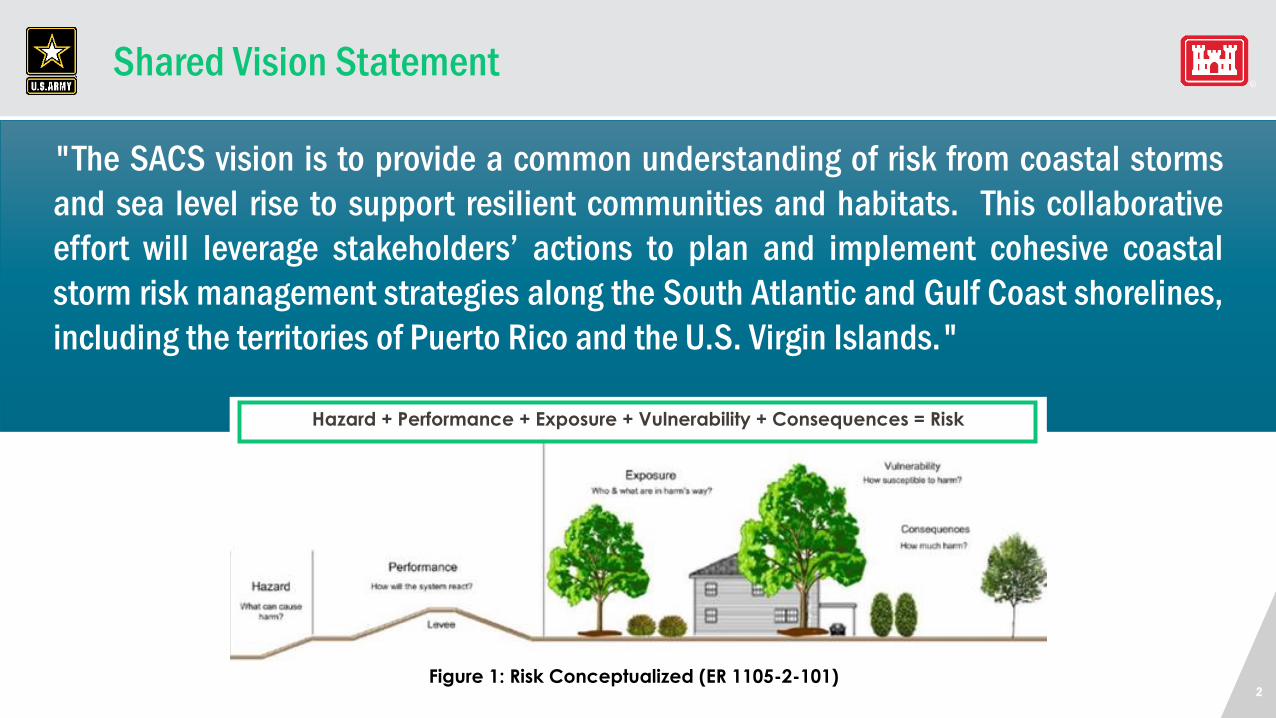
Shared Vision Statement
"The SACS vision is to provide a common understanding of risk from coastal storms
and sea level rise to support resilient communities and habitats. This collaborative
effort will leverage stakeholders’ actions to plan and implement cohesive coastal
storm risk management strategies along the South Atlantic and Gulf Coast shorelines,
including the territories of Puerto Rico and the U.S. Virgin Islands."
Hazard + Performance + Exposure + Vulnerability + Consequences = Risk
Figure 1: Risk Conceptualized (ER 1105-2-101)
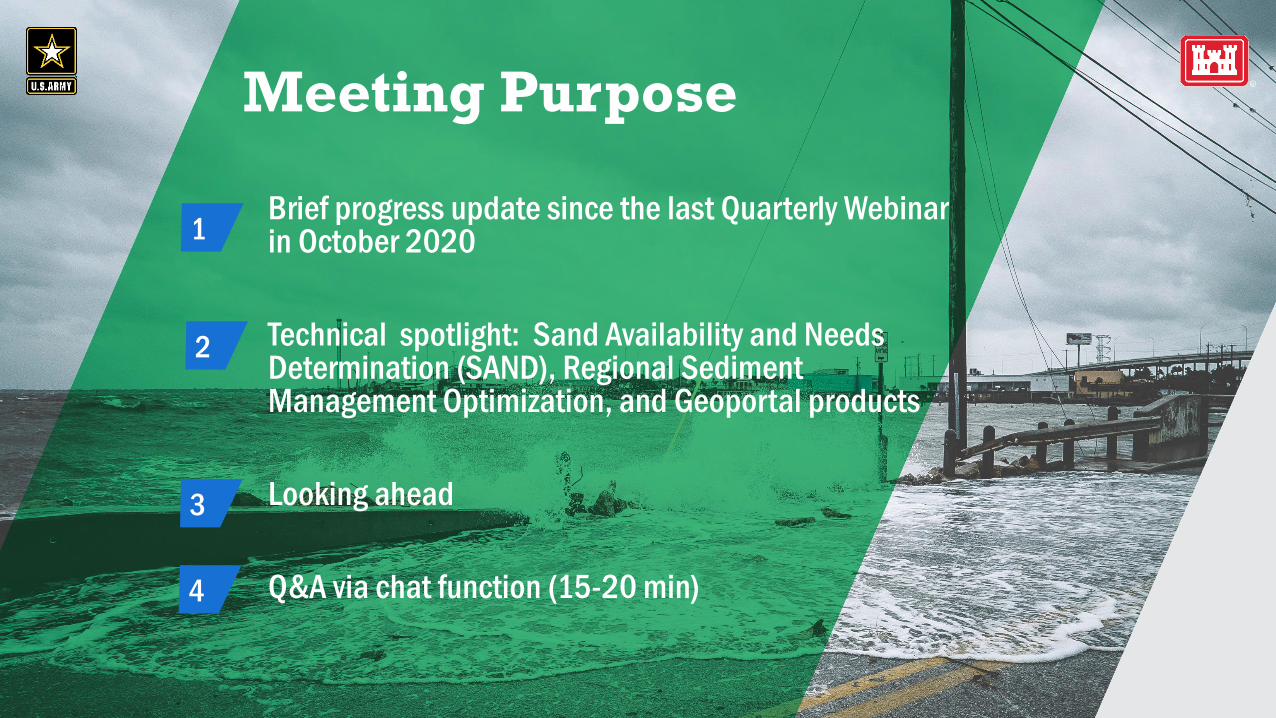
Meeting Purpose
Brief progress update since the last Quarterly Webinar in October 2020
Technical spotlight: Sand Availability and Needs Determination (SAND), Regional Sediment Management Optimization, and Geoportal products
Looking ahead
Q&A via chat function (15-20 min)
1
2
3
4
4
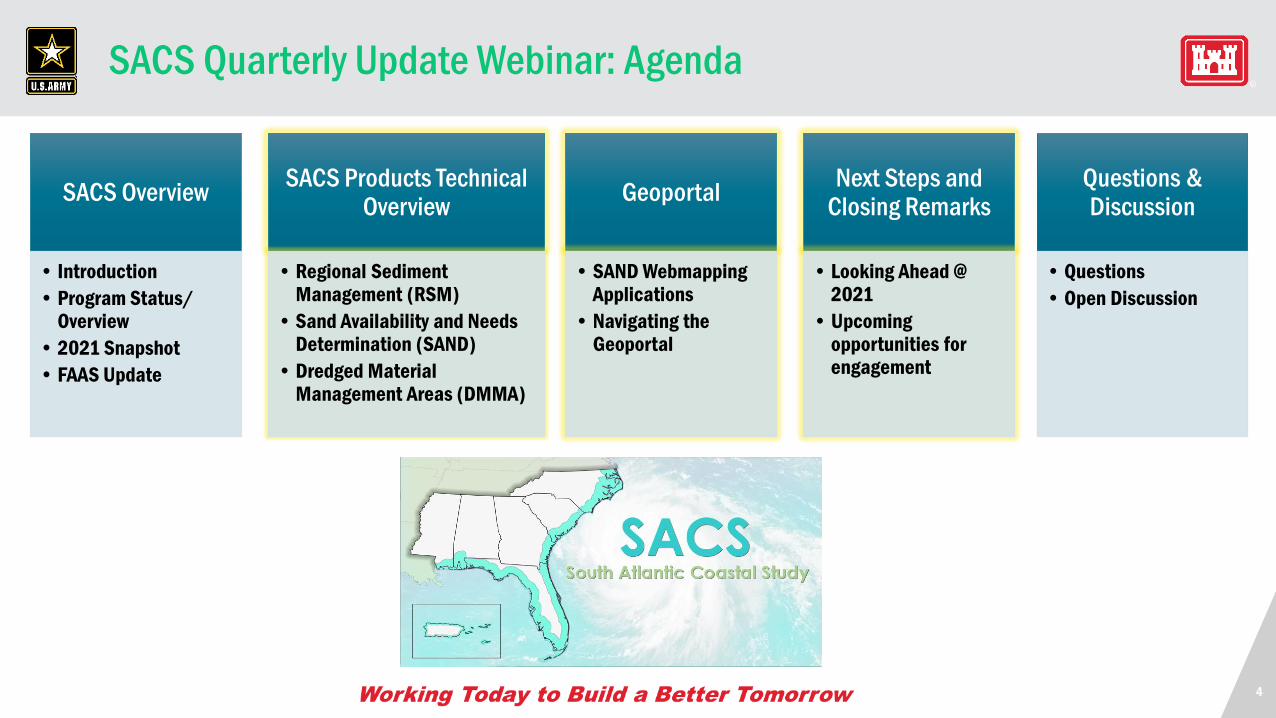
SACS Quarterly Update Webinar: Agenda
SACS Overview
• Introduction
• Program Status/ Overview
• 2021 Snapshot
• FAAS Update
SACS Products Technical Overview
• Regional Sediment Management (RSM)
• Sand Availability and Needs Determination (SAND)
• Dredged Material Management Areas (DMMA)
Questions & Discussion
Next Steps and Closing Remarks
• Looking Ahead @ 2021
• Upcoming opportunities for engagement
• Questions
• Open Discussion
Geoportal
• SAND WebmappingApplications
• Navigating the Geoportal
5
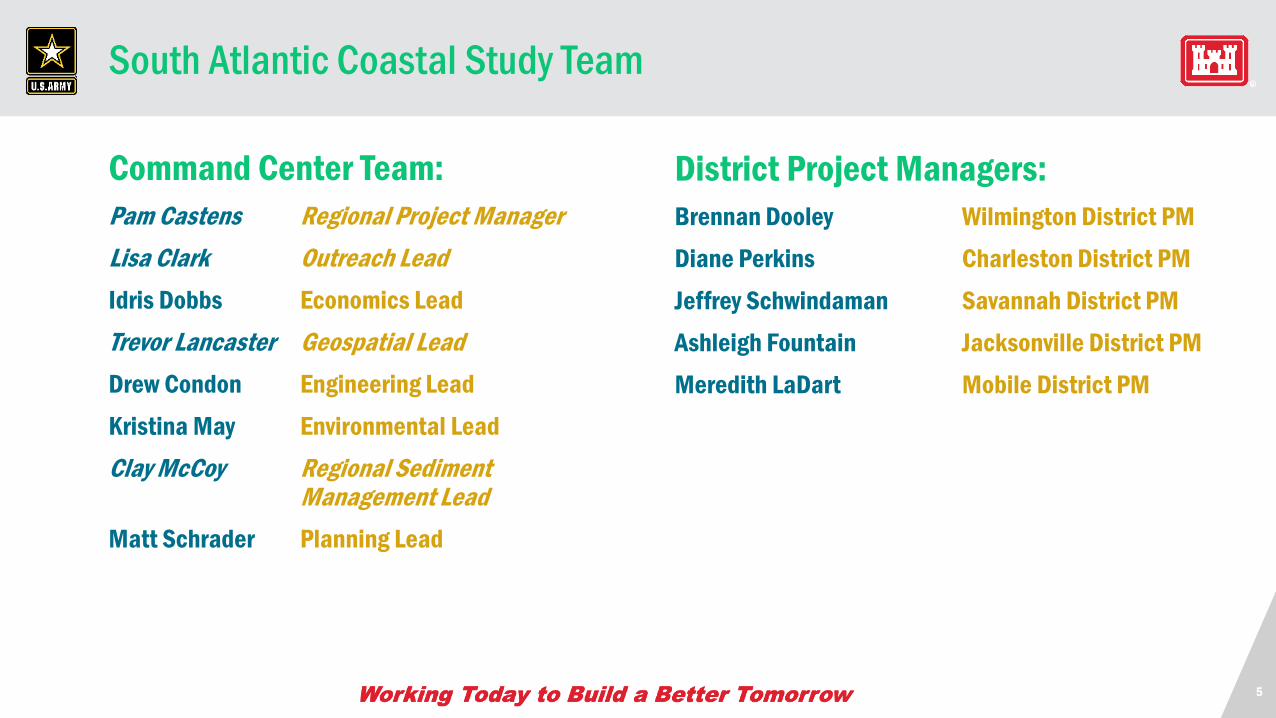
Command Center Team:
Pam Castens Regional Project Manager
Lisa Clark Outreach Lead
Idris Dobbs Economics Lead
Trevor Lancaster Geospatial Lead
Drew Condon Engineering Lead
Kristina May Environmental Lead
Clay McCoy Regional Sediment Management Lead
Matt Schrader Planning Lead
District Project Managers:
Brennan Dooley Wilmington District PM
Diane Perkins Charleston District PM
Jeffrey Schwindaman Savannah District PM
Ashleigh Fountain Jacksonville District PM
Meredith LaDart Mobile District PM
South Atlantic Coastal Study Team
6
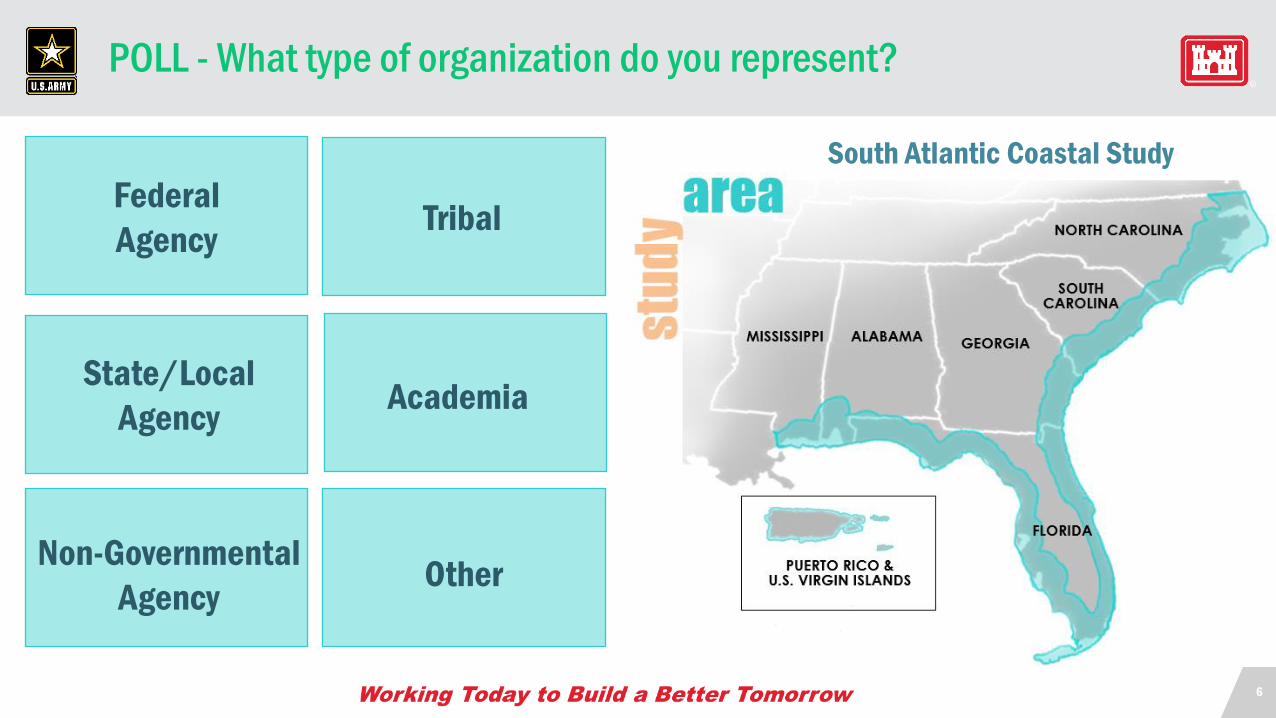
POLL - What type of organization do you represent?
Federal
Agency
State/Local
AgencyAcademia
OtherNon-Governmental
Agency
South Atlantic Coastal Study
Tribal
7
POPULATION & INFRASTRUCTURE
HAZARDS
ENVIRONMENTAL & CULTURAL
WA
VEW
ATC
H III
AD
CIR
C/S
TWA
VE
CSTO
RM
CO
UPLE
RJO
INT
PR
OB
AB
ILIT
Y
USFWS; BON SECOUR NWR
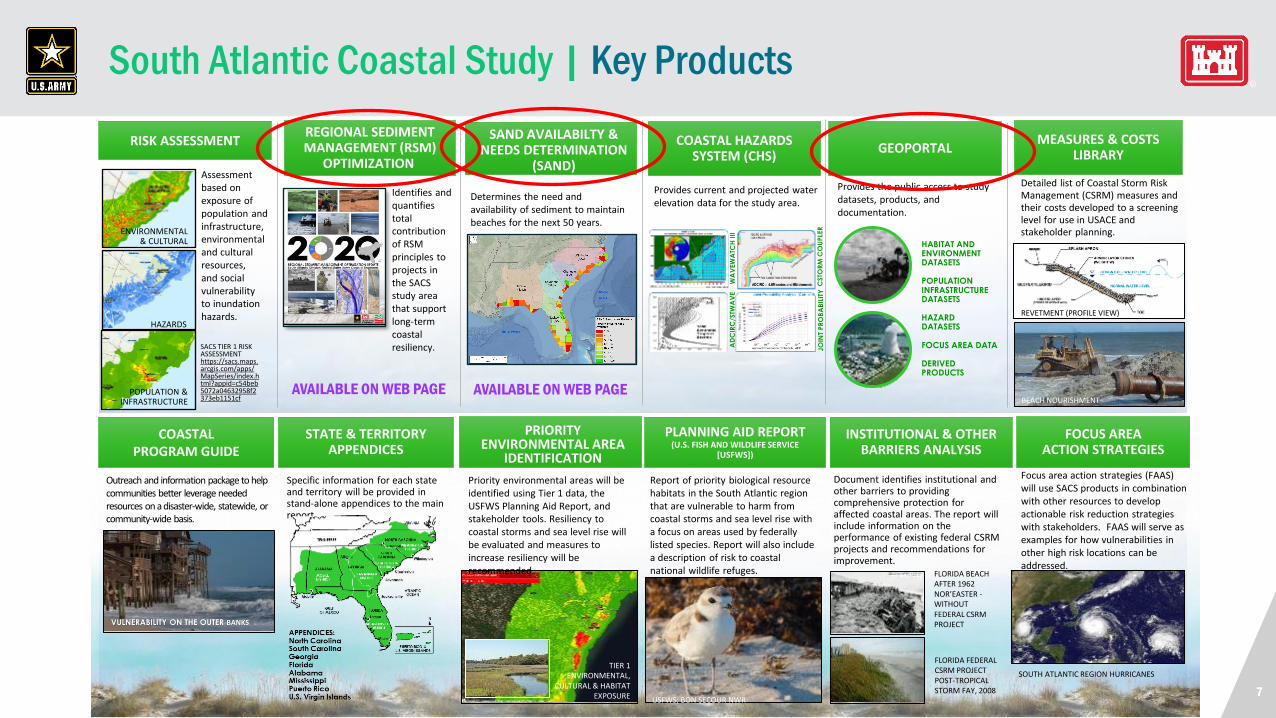
RISK ASSESSMENTREGIONAL SEDIMENTMANAGEMENT (RSM)
OPTIMIZATION
COASTAL HAZARDSSYSTEM (CHS)
GEOPORTALMEASURES & COSTS
LIBRARY
Assessment based on exposure of population and infrastructure, environmental and cultural resources, and social vulnerability to inundation hazards.
Identifies and quantifies total contribution of RSM principles to projects in the SACS study area that support long-term coastal resiliency.
Determines the need and availability of sediment to maintain beaches for the next 50 years.
Provides current and projected water elevation data for the study area.
Provides the public access to study datasets, products, and documentation.
Detailed list of Coastal Storm Risk Management (CSRM) measures and their costs developed to a screening level for use in USACE and stakeholder planning.
HABITAT AND ENVIRONMENT DATASETS
POPULATION INFRASTRUCTUREDATASETS
HAZARDDATASETS
FOCUS AREA DATA
DERIVEDPRODUCTS
REVETMENT (PROFILE VIEW)
BEACH NOURISHMENT
COASTAL PROGRAM GUIDE
STATE & TERRITORYAPPENDICES
PLANNING AID REPORT (U.S. FISH AND WILDLIFE SERVICE
[USFWS])
INSTITUTIONAL & OTHER BARRIERS ANALYSIS
FOCUS AREA ACTION STRATEGIES
Outreach and information package to help communities better leverage needed resources on a disaster-wide, statewide, or community-wide basis.
Specific information for each state and territory will be provided in stand-alone appendices to the main report.
Priority environmental areas will be identified using Tier 1 data, the USFWS Planning Aid Report, and stakeholder tools. Resiliency to coastal storms and sea level rise will be evaluated and measures to increase resiliency will be recommended.
Report of priority biological resource habitats in the South Atlantic region that are vulnerable to harm from coastal storms and sea level rise with a focus on areas used by federally listed species. Report will also include a description of risk to coastal national wildlife refuges.
Document identifies institutional and other barriers to providing comprehensive protection for affected coastal areas. The report will include information on the performance of existing federal CSRM projects and recommendations for improvement.
Focus area action strategies (FAAS) will use SACS products in combination with other resources to develop actionable risk reduction strategies with stakeholders. FAAS will serve as examples for how vulnerabilities in other high risk locations can be addressed.
VULNERABILITY ON THE OUTER BANKS
FLORIDA FEDERALCSRM PROJECTPOST-TROPICAL STORM FAY, 2008
TIER 1 ENVIRONMENTAL,
CULTURAL & HABITAT EXPOSURE
FLORIDA BEACH AFTER 1962 NOR’EASTER -WITHOUT FEDERAL CSRM PROJECT
SACS TIER 1 RISK ASSESSMENT https://sacs.maps.arcgis.com/apps/MapSeries/index.html?appid=c54beb5072a04632958f2373eb1151cf
SOUTH ATLANTIC REGION HURRICANES
PRIORITY ENVIRONMENTAL AREA
IDENTIFICATION
SAND AVAILABILTY & NEEDS DETERMINATION
(SAND)
AVAILABLE ON WEB PAGE AVAILABLE ON WEB PAGE
South Atlantic Coastal Study | Key Products
8
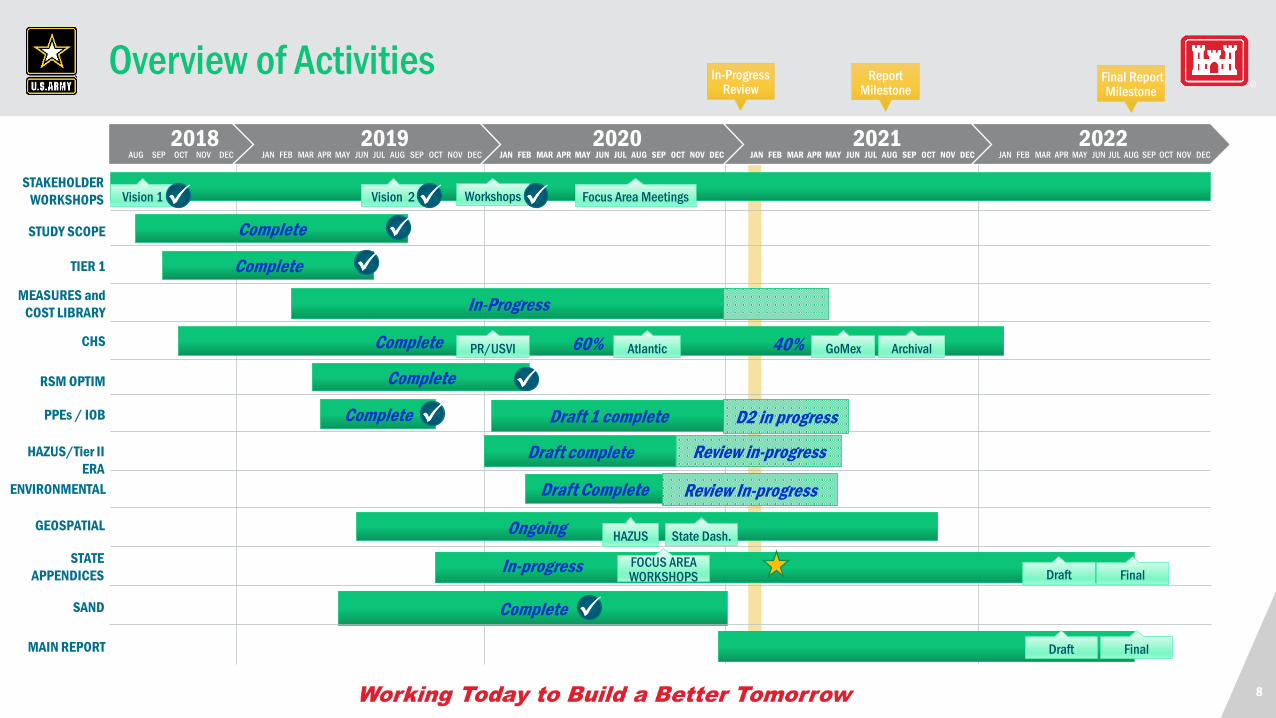
Overview of ActivitiesReport
Milestone
2018 2019 2020 2021 2022
STAKEHOLDER
WORKSHOPS
AUG SEP OCT NOV DEC JAN FEB MAR APR MAY JUN JUL AUG SEP OCT NOV DEC JAN FEB MAR APR MAY JUN JUL AUG SEP OCT NOV DEC JAN FEB MAR APR MAY JUN JUL AUG SEP OCT NOV DEC JAN FEB MAR APR MAY JUN JUL AUG SEP OCT NOV DEC
Vision 1 Vision 2 Focus Area MeetingsWorkshops
Complete
Complete
In-Progress
PR/USVI
Complete
STUDY SCOPE
TIER 1
MEASURES and
COST LIBRARY
CHSAtlantic GoMex Archival
RSM OPTIM
PPEs / IOB
STATE
APPENDICES
CompleteSAND
HAZUS/Tier II
ERA
Complete
MAIN REPORT Draft Final
GEOSPATIAL
ENVIRONMENTAL Draft Complete
Draft 1 complete
HAZUS State Dash.
Complete 60% 40%
Ongoing
FOCUS AREA WORKSHOPS
In-progress
Final Report Milestone
Draft complete Review in-progress
Review In-progress
Draft Final
D2 in progress
In-Progress Review

9
2021 Snapshot
2021JAN FEB MAR APR MAY JUN JUL AUG SEP OCT NOV DEC
REGIONAL PRODUCTS
FAAS/Appendix Refinement and Reviews
CHS:SA Public
Avail
CHS Validation Meeting
Final Draft IOB Report
Final IOB Report
STATE APPENDICES
Complete Draft FAAS and State/Territory
Appendices
Strategies/High risk
areas
DRAFT REPORTConcurrent Reviews
Final Measures and Cost Library REPORT
Final Environmental At-Risk Resource Technical Report
CHS:PR/USVI
Public Avail
CHS:GoMex
Public Avail
Rec Milestone
Report Milestone
MCL WEBAPP DEVELOPMENT
Final CPG Report
Prep Draft Report for ReleaseDraft Main Report/FAAS/Appendices Refinement and Review
Wrap-Up All Remaining CHS Activities
IPR
Stakeholder Coordination
10
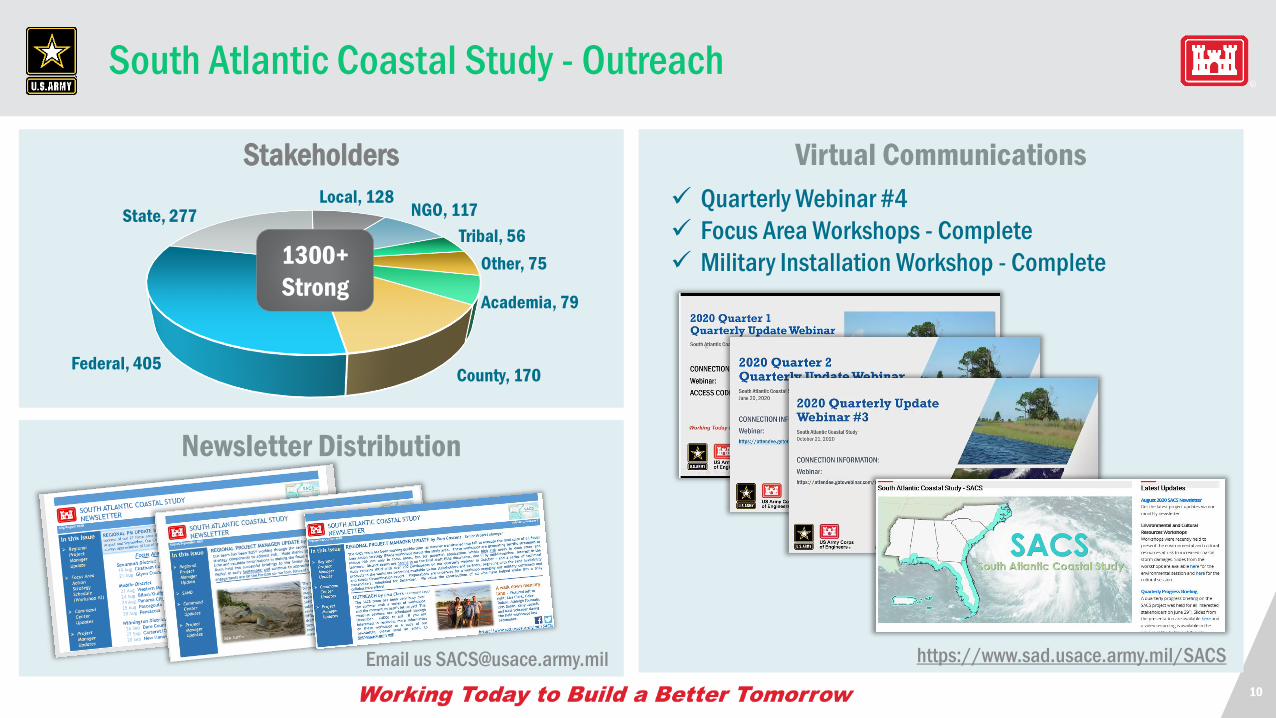
Virtual Communications
Newsletter Distribution
Stakeholders
South Atlantic Coastal Study - Outreach
Academia, 79
County, 170Federal, 405
State, 277Local, 128
NGO, 117
Tribal, 56
Other, 75
https://www.sad.usace.army.mil/SACS
1300+
Strong
✓ Quarterly Webinar #4
✓ Focus Area Workshops - Complete
✓ Military Installation Workshop - Complete
Email us [email protected]
11
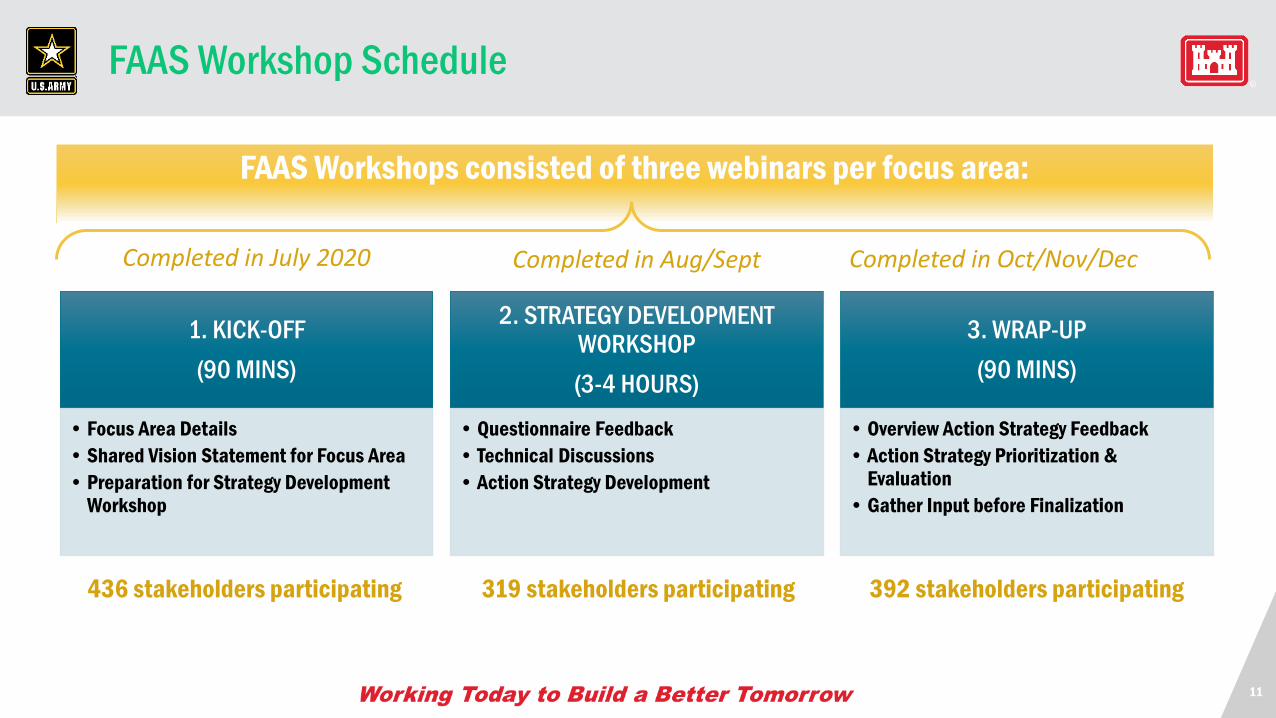
FAAS Workshop Schedule
FAAS Workshops consisted of three webinars per focus area:
1. KICK-OFF
(90 MINS)
• Focus Area Details
• Shared Vision Statement for Focus Area
• Preparation for Strategy Development Workshop
2. STRATEGY DEVELOPMENT WORKSHOP
(3-4 HOURS)
• Questionnaire Feedback
• Technical Discussions
• Action Strategy Development
3. WRAP-UP
(90 MINS)
• Overview Action Strategy Feedback
• Action Strategy Prioritization & Evaluation
• Gather Input before Finalization
Completed in Aug/SeptCompleted in July 2020 Completed in Oct/Nov/Dec
436 stakeholders participating 319 stakeholders participating 392 stakeholders participating
SACS ProductsSand Availability and Needs Determination
2020 Regional Sediment Management Optimization Update
Dredged Material Management Area
Clay McCoy, PhD
14
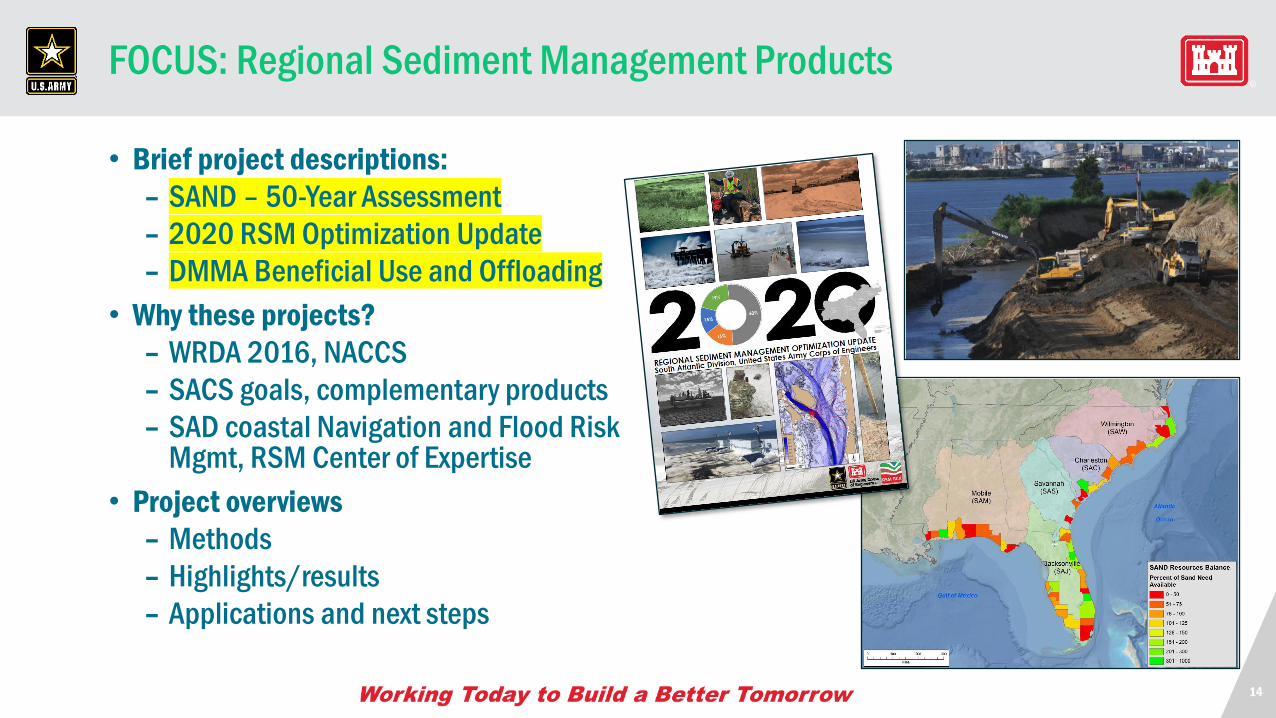
FOCUS: Regional Sediment Management Products
• Brief project descriptions:
– SAND – 50-Year Assessment
– 2020 RSM Optimization Update
– DMMA Beneficial Use and Offloading
• Why these projects?
– WRDA 2016, NACCS
– SACS goals, complementary products
– SAD coastal Navigation and Flood Risk Mgmt, RSM Center of Expertise
• Project overviews
– Methods
– Highlights/results
– Applications and next steps
15
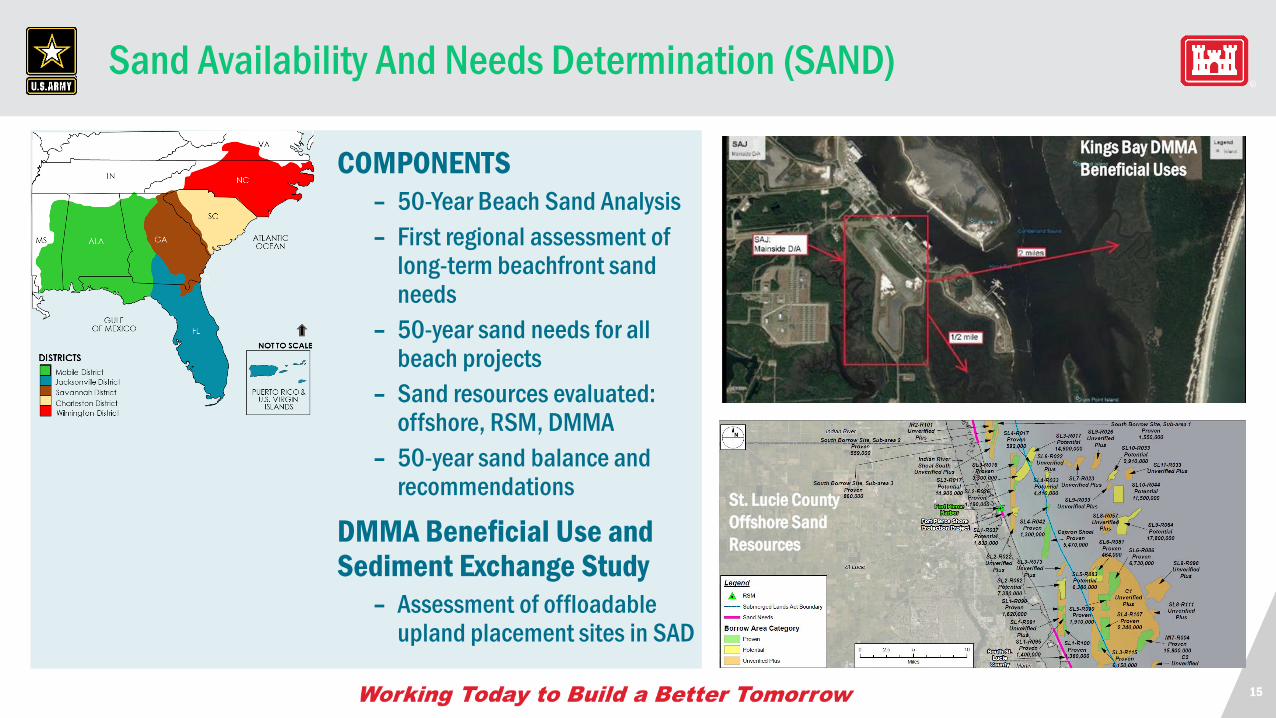
Sand Availability And Needs Determination (SAND)
COMPONENTS
– 50-Year Beach Sand Analysis
– First regional assessment of long-term beachfront sand needs
– 50-year sand needs for all beach projects
– Sand resources evaluated: offshore, RSM, DMMA
– 50-year sand balance and recommendations
DMMA Beneficial Use and Sediment Exchange Study
– Assessment of offloadableupland placement sites in SAD
Kings Bay DMMA
Beneficial Uses
St. Lucie County
Offshore Sand
Resources
16
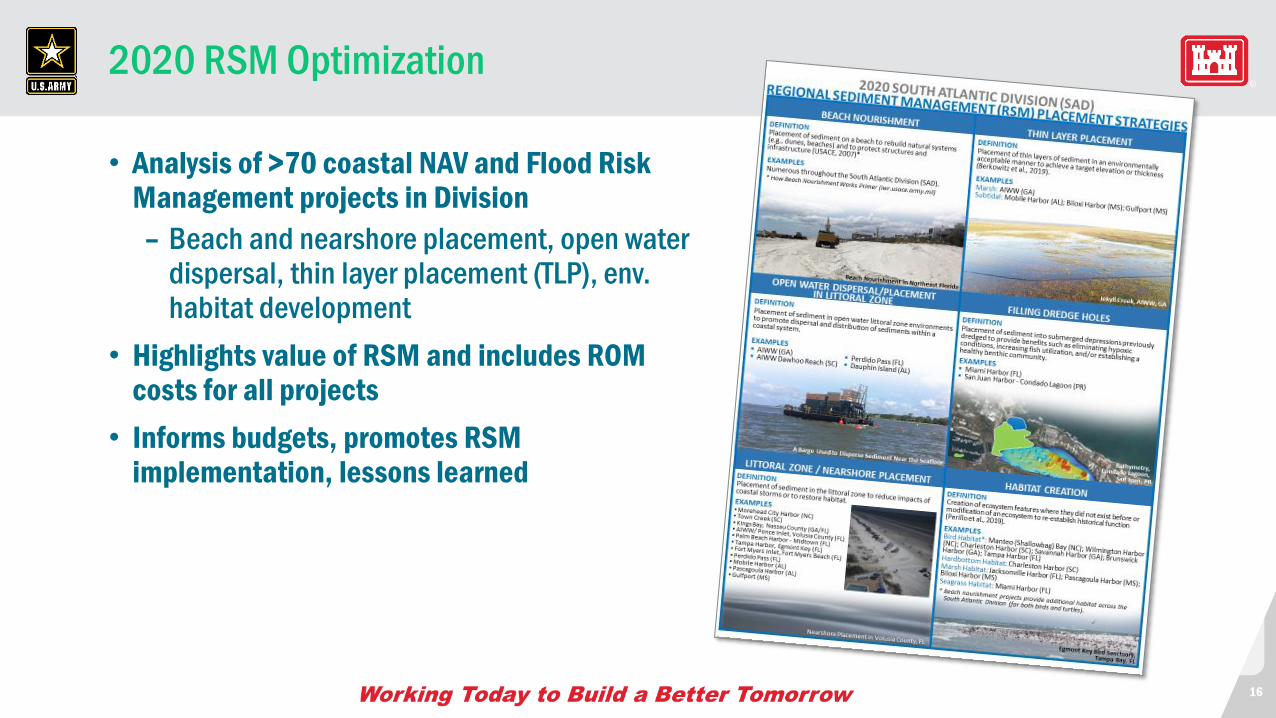
2020 RSM Optimization
• Analysis of >70 coastal NAV and Flood Risk Management projects in Division
– Beach and nearshore placement, open water dispersal, thin layer placement (TLP), env. habitat development
• Highlights value of RSM and includes ROM costs for all projects
• Informs budgets, promotes RSM implementation, lessons learned
17
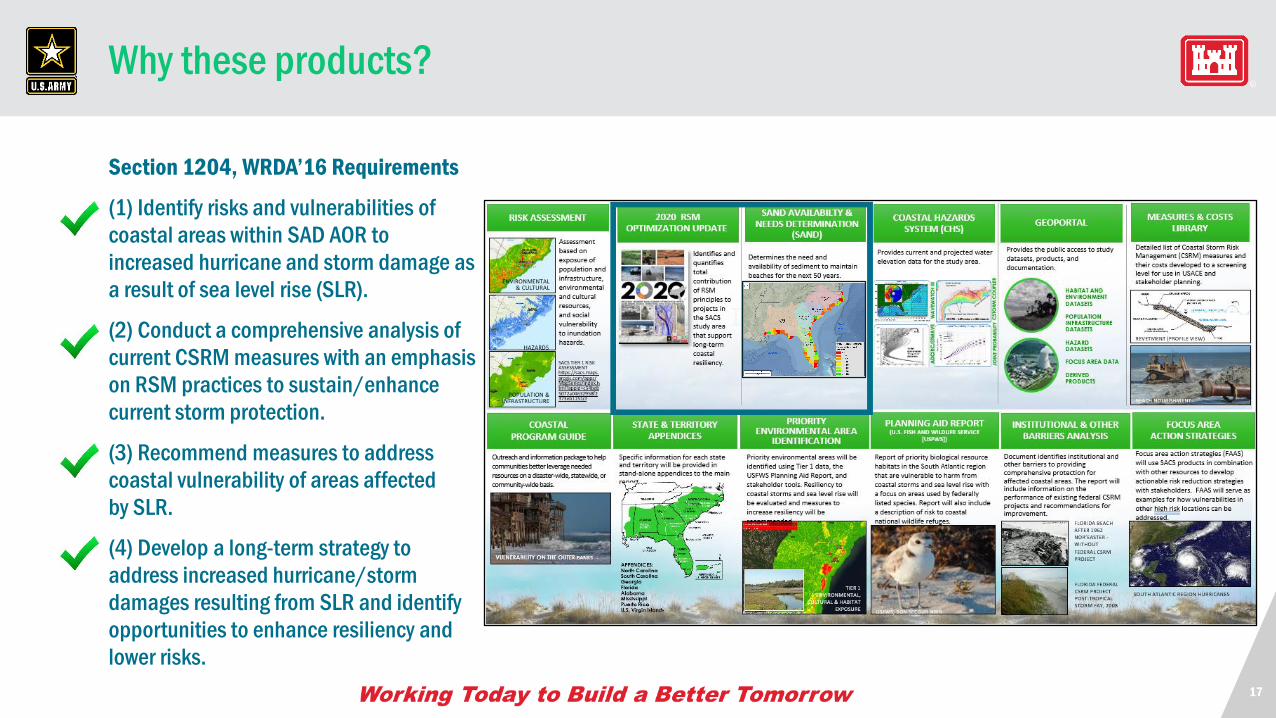
Why these products?
Section 1204, WRDA’16 Requirements
(1) Identify risks and vulnerabilities of
coastal areas within SAD AOR to
increased hurricane and storm damage as
a result of sea level rise (SLR).
(2) Conduct a comprehensive analysis of
current CSRM measures with an emphasis
on RSM practices to sustain/enhance
current storm protection.
(3) Recommend measures to address
coastal vulnerability of areas affected
by SLR.
(4) Develop a long-term strategy to
address increased hurricane/storm
damages resulting from SLR and identify
opportunities to enhance resiliency and
lower risks.
18
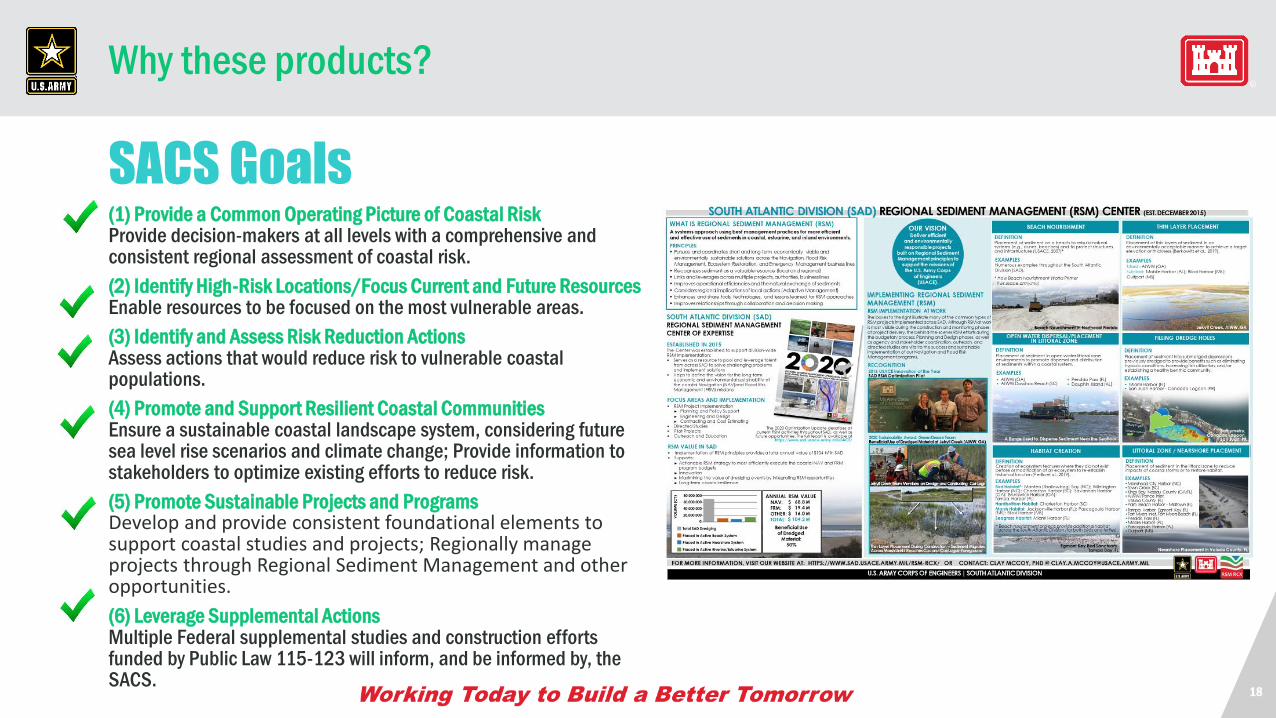
Why these products?
(1) Provide a Common Operating Picture of Coastal Risk Provide decision-makers at all levels with a comprehensive and consistent regional assessment of coastal risk.
(2) Identify High-Risk Locations/Focus Current and Future Resources Enable resources to be focused on the most vulnerable areas.
(3) Identify and Assess Risk Reduction ActionsAssess actions that would reduce risk to vulnerable coastal populations.
(4) Promote and Support Resilient Coastal Communities Ensure a sustainable coastal landscape system, considering future sea level rise scenarios and climate change; Provide information to stakeholders to optimize existing efforts to reduce risk.
(5) Promote Sustainable Projects and Programs Develop and provide consistent foundational elements to support coastal studies and projects; Regionally manage projects through Regional Sediment Management and other opportunities.
(6) Leverage Supplemental Actions Multiple Federal supplemental studies and construction efforts funded by Public Law 115-123 will inform, and be informed by, the SACS.
SACS Goals
19
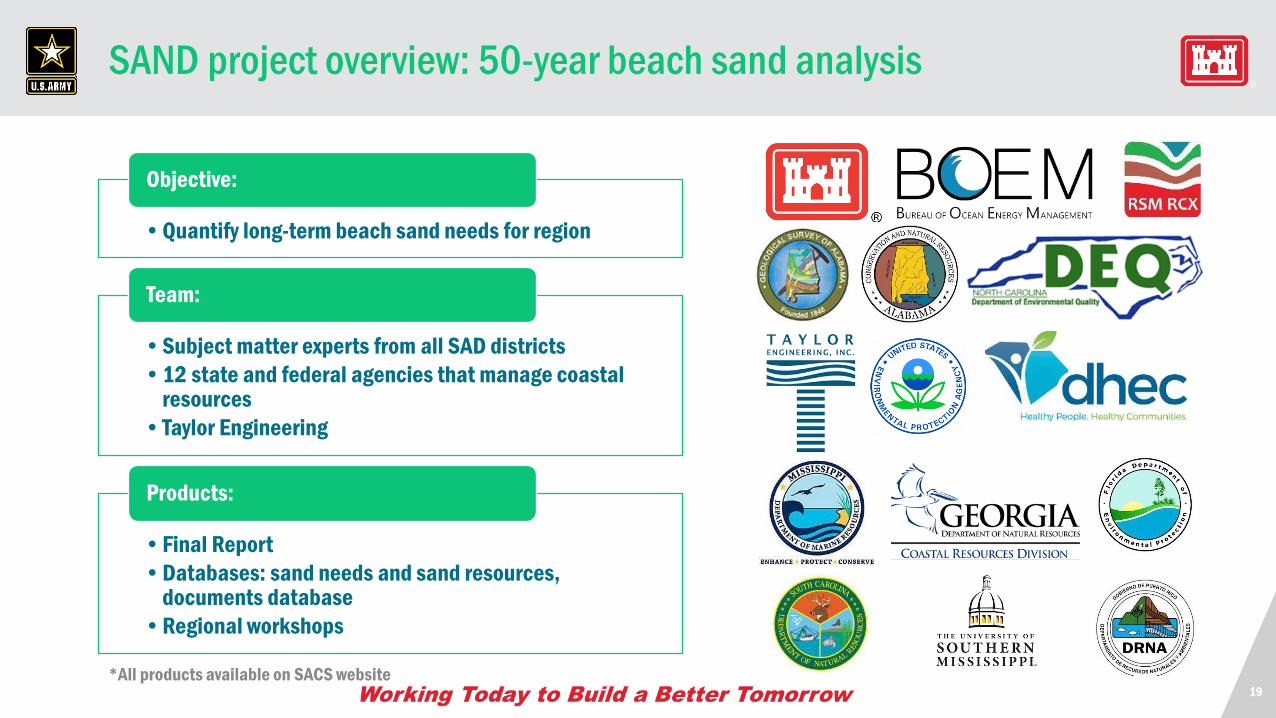
SAND project overview: 50-year beach sand analysis
•Quantify long-term beach sand needs for region
Objective:
•Subject matter experts from all SAD districts
•12 state and federal agencies that manage coastal resources
•Taylor Engineering
Team:
•Final Report
•Databases: sand needs and sand resources, documents database
•Regional workshops
Products:
*All products available on SACS website
20
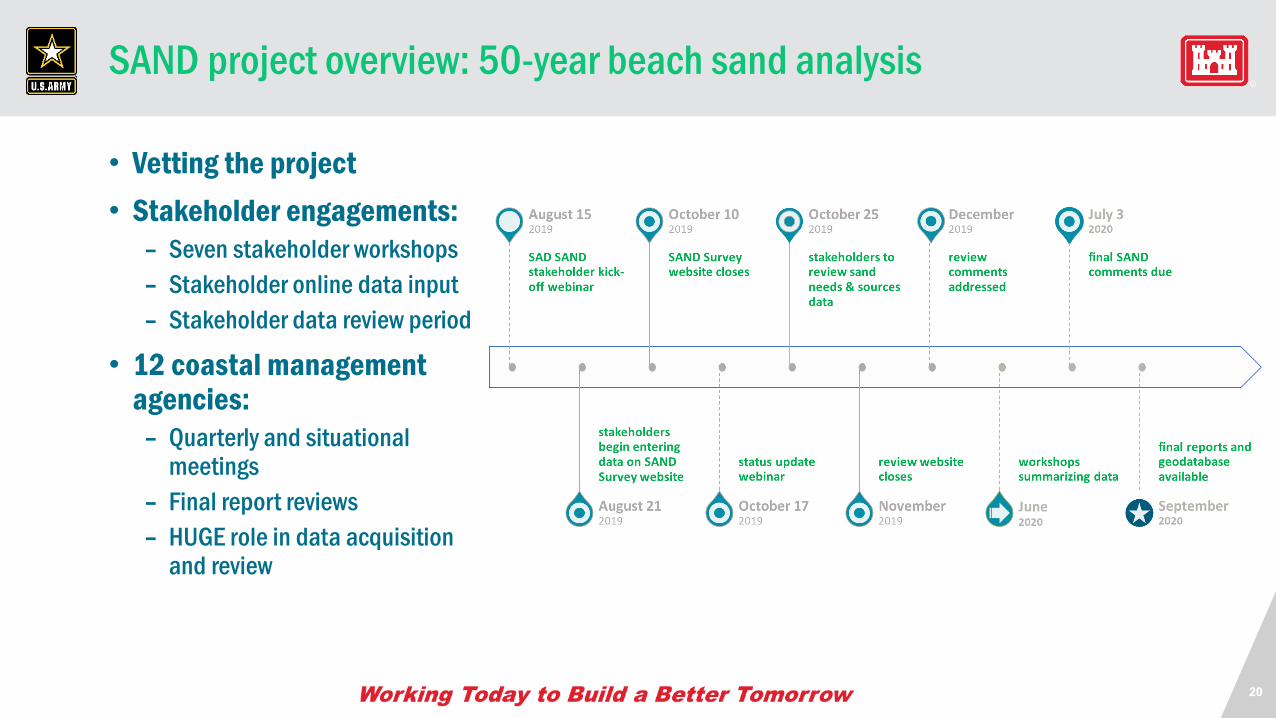
SAND project overview: 50-year beach sand analysis
• Vetting the project
• Stakeholder engagements:
– Seven stakeholder workshops
– Stakeholder online data input
– Stakeholder data review period
• 12 coastal management agencies:
– Quarterly and situational meetings
– Final report reviews
– HUGE role in data acquisition and review
21
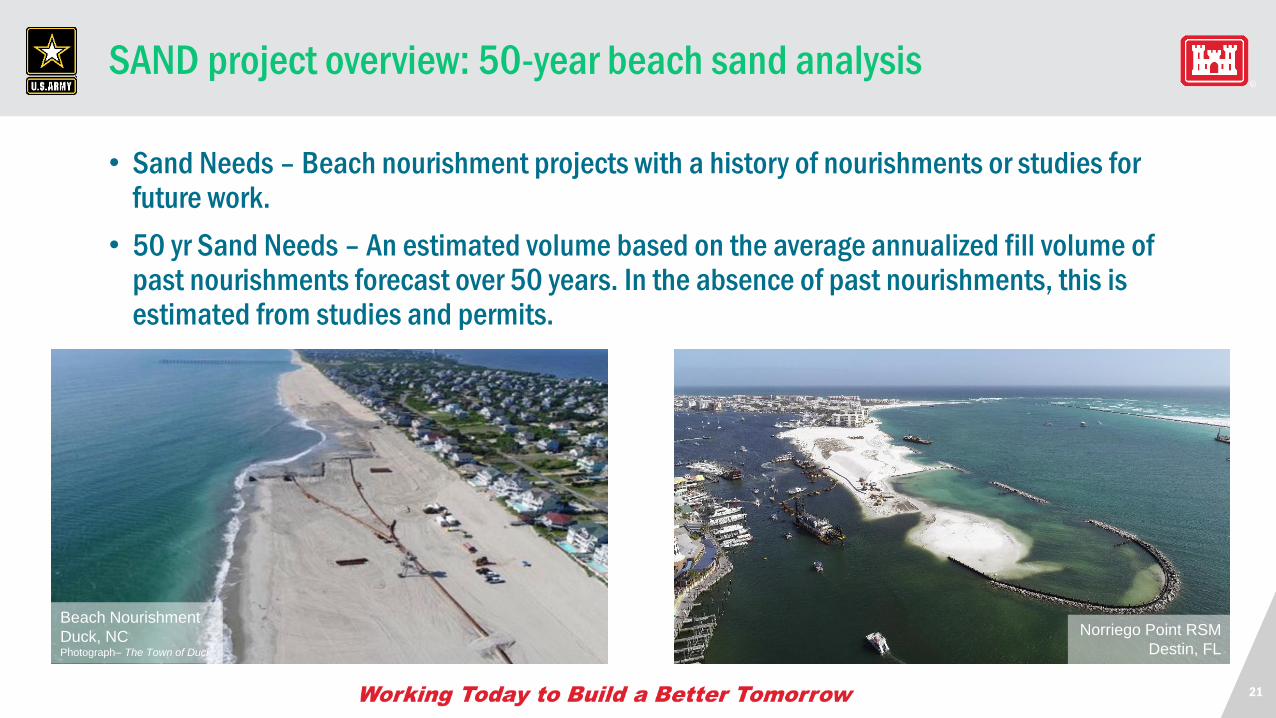
Norriego Point RSM
Destin, FL
Beach Nourishment
Duck, NCPhotograph– The Town of Duck
SAND project overview: 50-year beach sand analysis
• Sand Needs – Beach nourishment projects with a history of nourishments or studies for future work.
• 50 yr Sand Needs – An estimated volume based on the average annualized fill volume of past nourishments forecast over 50 years. In the absence of past nourishments, this is estimated from studies and permits.
22
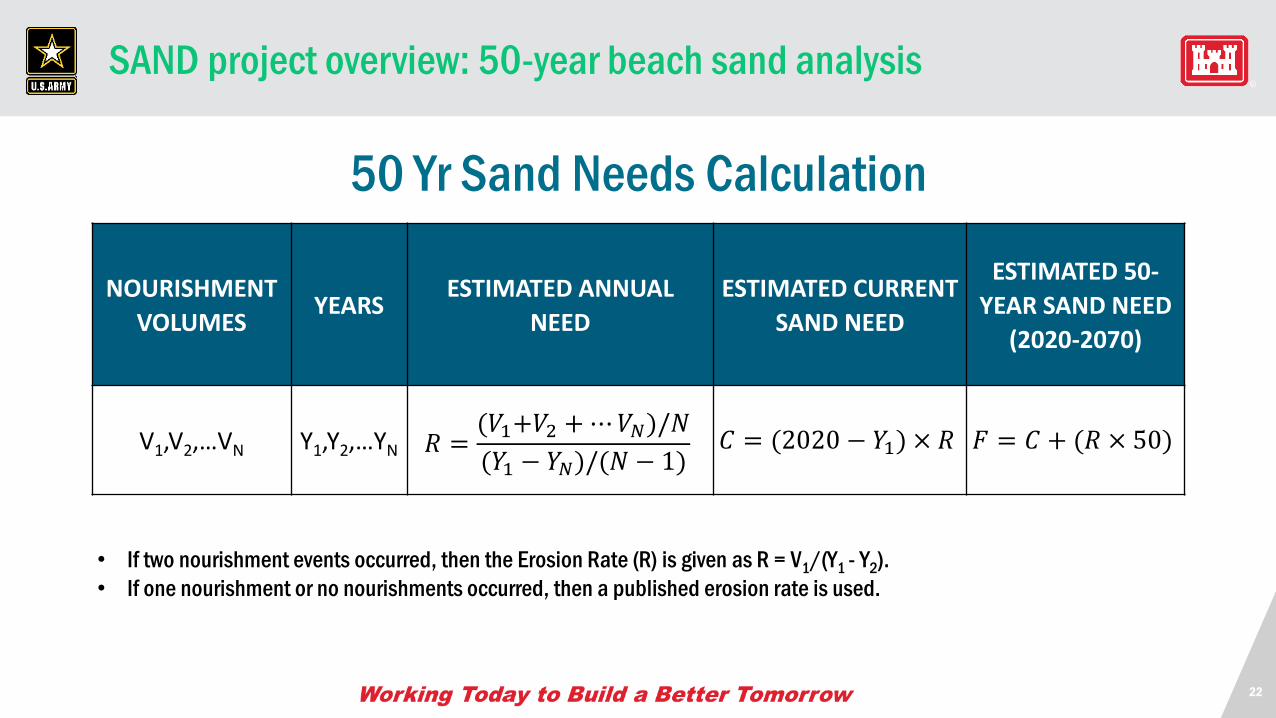
50 Yr Sand Needs Calculation
NOURISHMENT
VOLUMESYEARS
ESTIMATED ANNUAL
NEED
ESTIMATED CURRENT
SAND NEED
ESTIMATED 50-
YEAR SAND NEED
(2020-2070)
V1,V2,…VN Y1,Y2,…YN 𝑅 =(𝑉1+𝑉2 +⋯𝑉𝑁)/𝑁
(𝑌1 − 𝑌𝑁)/(𝑁 − 1)𝐶 = (2020 − 𝑌1) × 𝑅 𝐹 = 𝐶 + (𝑅 × 50)
• If two nourishment events occurred, then the Erosion Rate (R) is given as R = V1/(Y1 - Y2).
• If one nourishment or no nourishments occurred, then a published erosion rate is used.
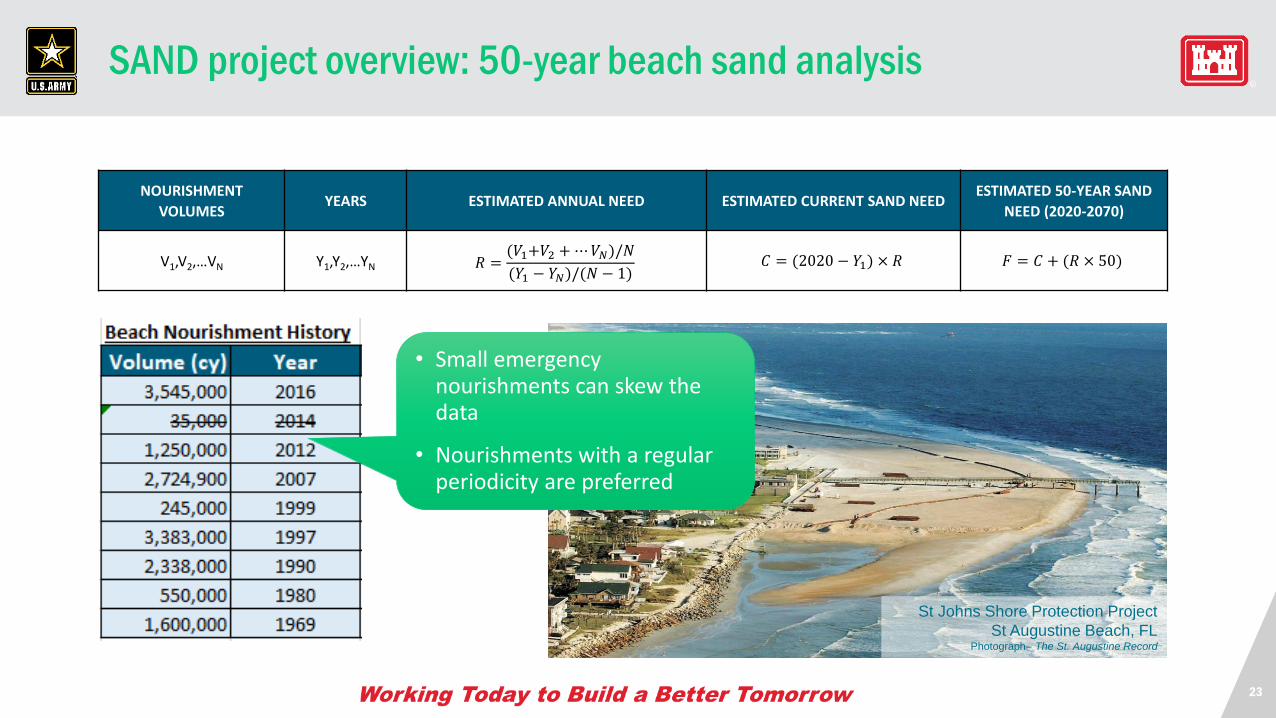
SAND project overview: 50-year beach sand analysis
23
NOURISHMENT
VOLUMESYEARS ESTIMATED ANNUAL NEED ESTIMATED CURRENT SAND NEED
ESTIMATED 50-YEAR SAND
NEED (2020-2070)
V1,V2,…VN Y1,Y2,…YN 𝑅 =(𝑉1+𝑉2 +⋯𝑉𝑁)/𝑁
(𝑌1 − 𝑌𝑁)/(𝑁 − 1)𝐶 = (2020 − 𝑌1) × 𝑅 𝐹 = 𝐶 + (𝑅 × 50)
St Johns Shore Protection Project
St Augustine Beach, FLPhotograph– The St. Augustine Record
SAND project overview: 50-year beach sand analysis
• Small emergency nourishments can skew the data
• Nourishments with a regular periodicity are preferred
24
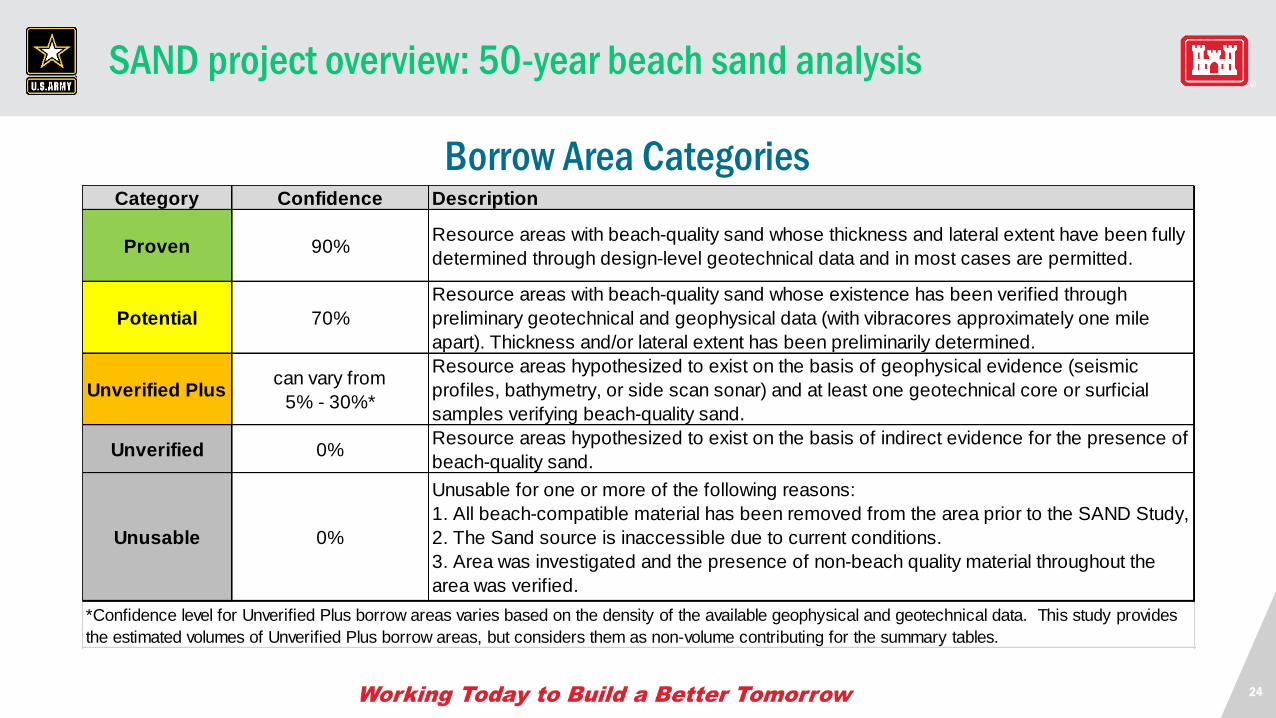
Borrow Area CategoriesCategory Confidence Description
Proven 90%Resource areas with beach-quality sand whose thickness and lateral extent have been fully
determined through design-level geotechnical data and in most cases are permitted.
Potential 70%
Resource areas with beach-quality sand whose existence has been verified through
preliminary geotechnical and geophysical data (with vibracores approximately one mile
apart). Thickness and/or lateral extent has been preliminarily determined.
Unverified Pluscan vary from
5% - 30%*
Resource areas hypothesized to exist on the basis of geophysical evidence (seismic
profiles, bathymetry, or side scan sonar) and at least one geotechnical core or surficial
samples verifying beach-quality sand.
Unverified 0%Resource areas hypothesized to exist on the basis of indirect evidence for the presence of
beach-quality sand.
Unusable 0%
Unusable for one or more of the following reasons:
1. All beach-compatible material has been removed from the area prior to the SAND Study,
2. The Sand source is inaccessible due to current conditions.
3. Area was investigated and the presence of non-beach quality material throughout the
area was verified.
*Confidence level for Unverified Plus borrow areas varies based on the density of the available geophysical and geotechnical data. This study provides
the estimated volumes of Unverified Plus borrow areas, but considers them as non-volume contributing for the summary tables.
SAND project overview: 50-year beach sand analysis
25
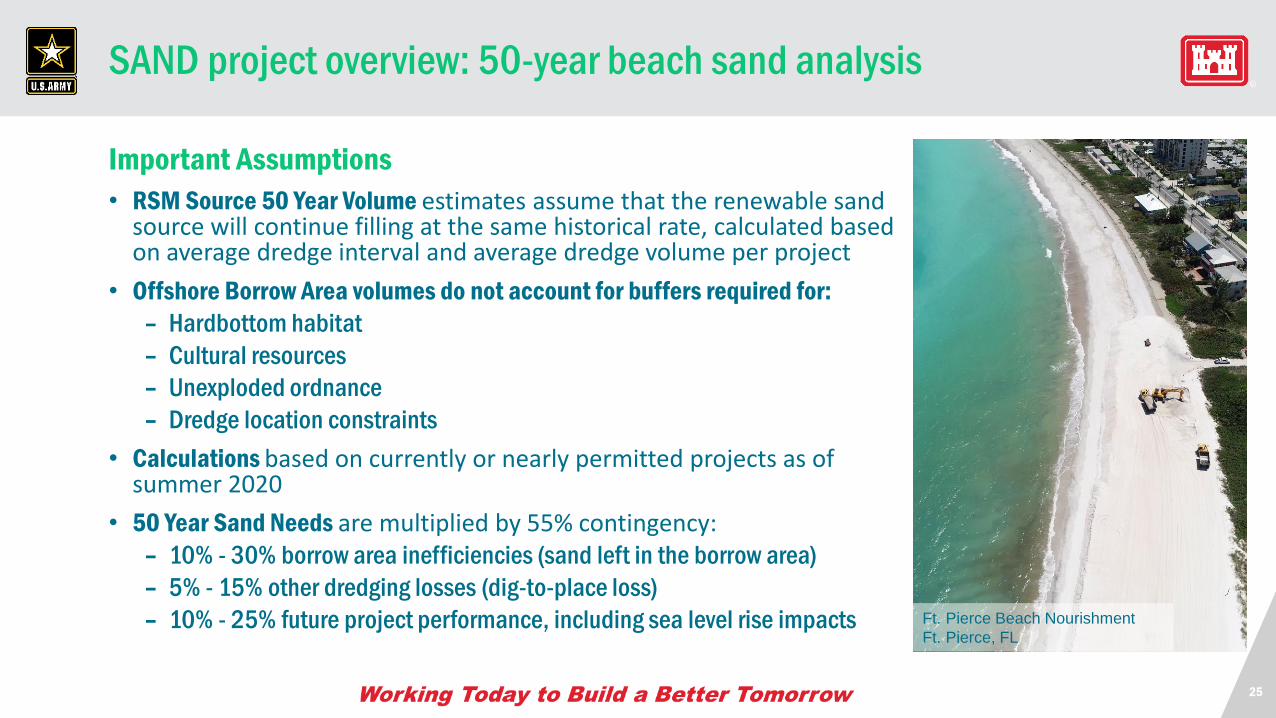
Ft. Pierce Beach Nourishment
Ft. Pierce, FL
SAND project overview: 50-year beach sand analysis
Important Assumptions
• RSM Source 50 Year Volume estimates assume that the renewable sand source will continue filling at the same historical rate, calculated based on average dredge interval and average dredge volume per project
• Offshore Borrow Area volumes do not account for buffers required for:
– Hardbottom habitat
– Cultural resources
– Unexploded ordnance
– Dredge location constraints
• Calculations based on currently or nearly permitted projects as of summer 2020
• 50 Year Sand Needs are multiplied by 55% contingency: – 10% - 30% borrow area inefficiencies (sand left in the borrow area)
– 5% - 15% other dredging losses (dig-to-place loss)
– 10% - 25% future project performance, including sea level rise impacts
26
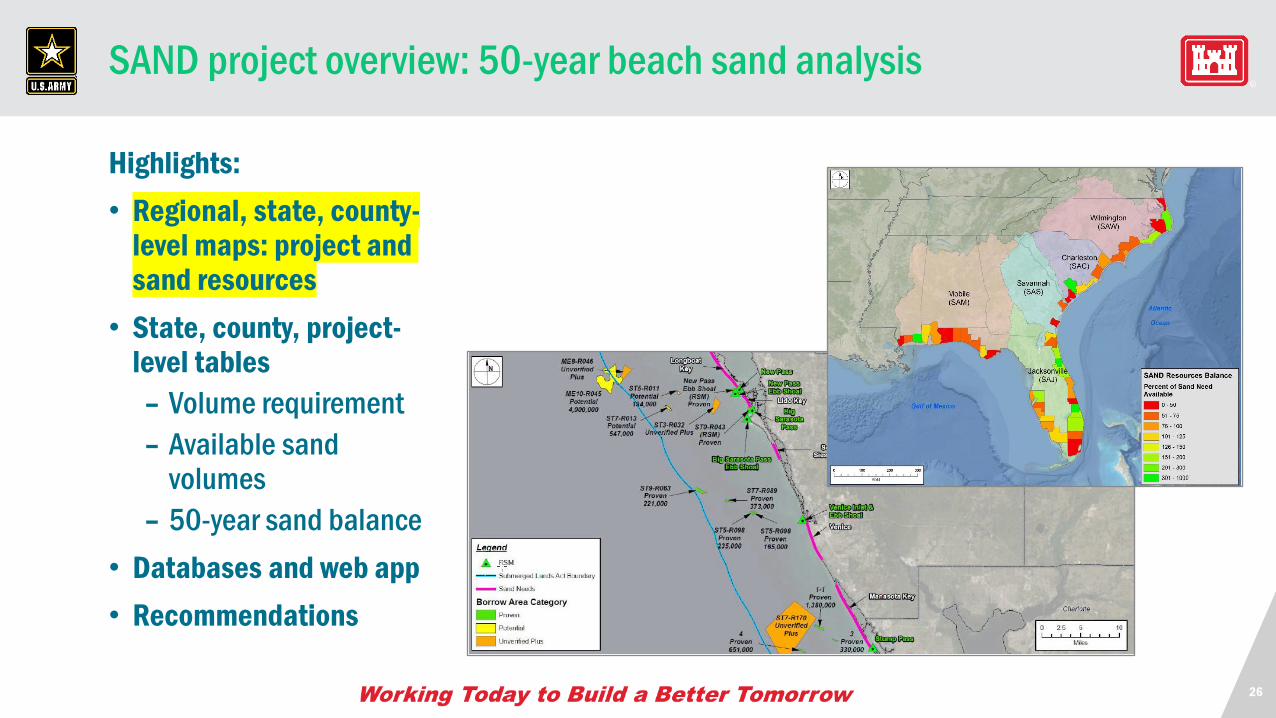
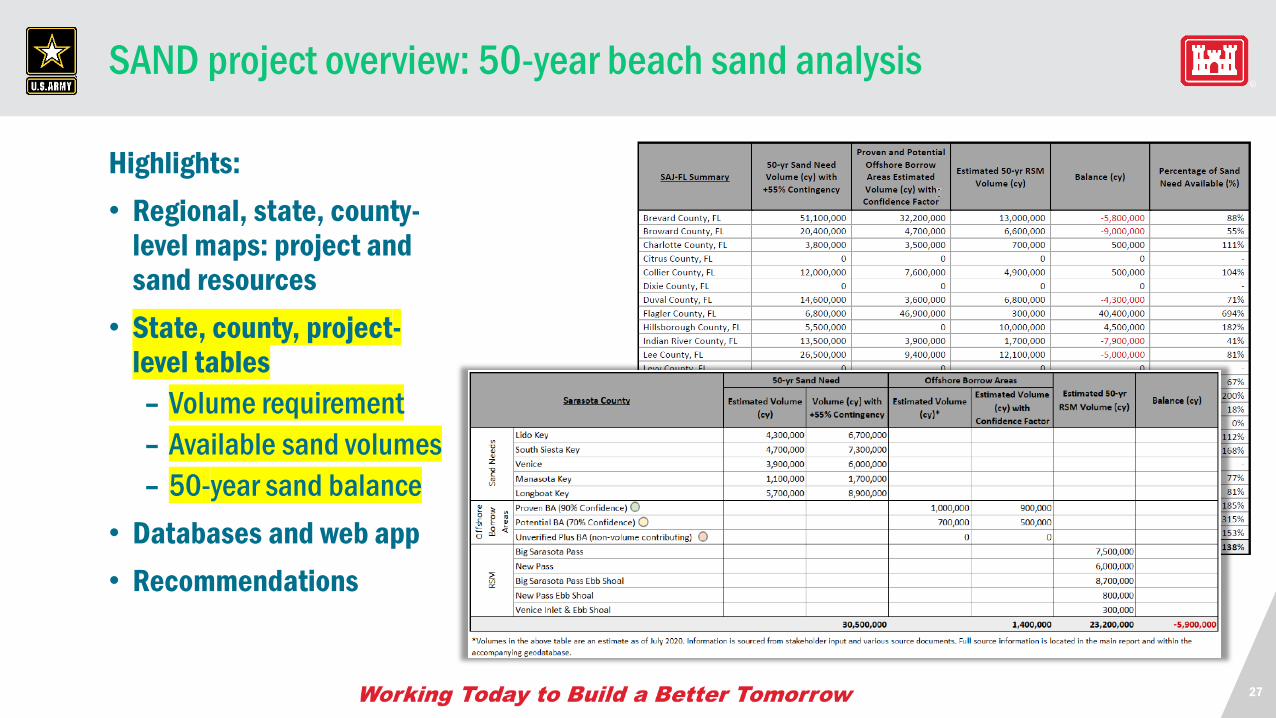
SAND project overview: 50-year beach sand analysis
Highlights:
• Regional, state, county-level maps: project and sand resources
• State, county, project-level tables
– Volume requirement
– Available sand volumes
– 50-year sand balance
• Databases and web app
• Recommendations
27
SAND project overview: 50-year beach sand analysis
Highlights:
• Regional, state, county-level maps: project and sand resources
• State, county, project-level tables
– Volume requirement
– Available sand volumes
– 50-year sand balance
• Databases and web app
• Recommendations
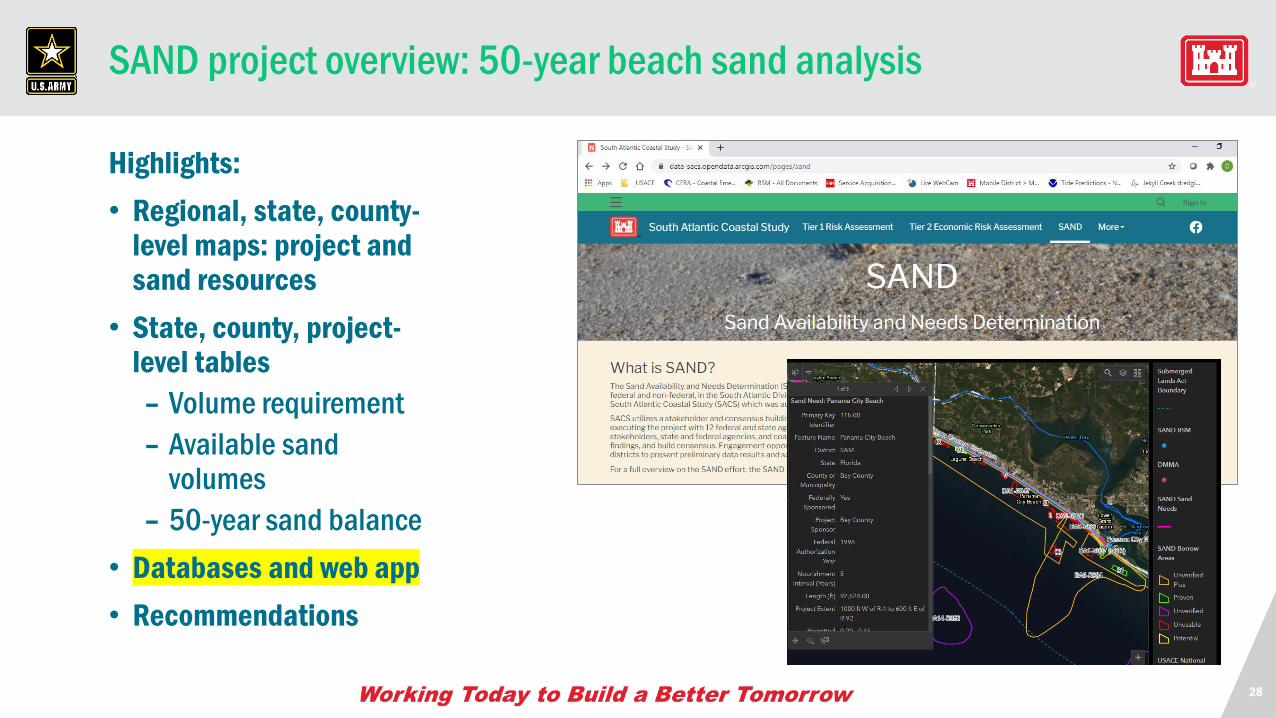
28
SAND project overview: 50-year beach sand analysis
Highlights:
• Regional, state, county-level maps: project and sand resources
• State, county, project-level tables
– Volume requirement
– Available sand volumes
– 50-year sand balance
• Databases and web app
• Recommendations
29
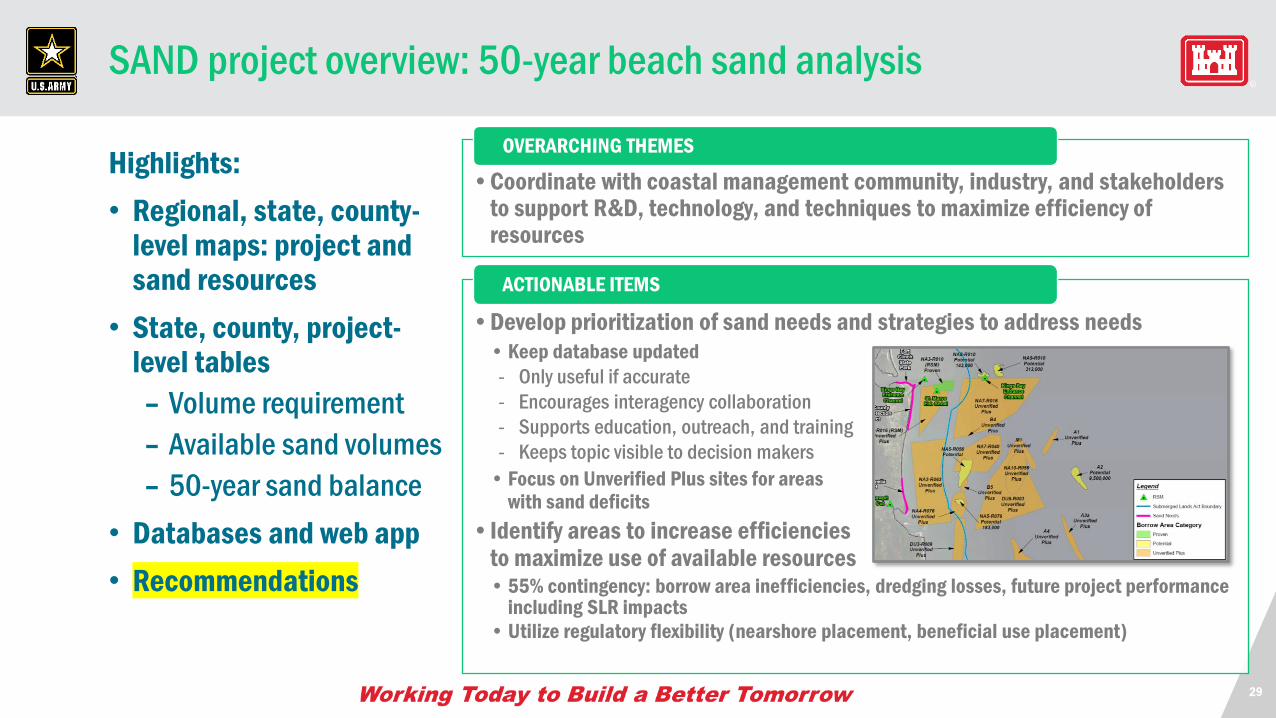
•Coordinate with coastal management community, industry, and stakeholders to support R&D, technology, and techniques to maximize efficiency of resources
OVERARCHING THEMES
•Develop prioritization of sand needs and strategies to address needs
• Keep database updated
- Only useful if accurate
- Encourages interagency collaboration
- Supports education, outreach, and training
- Keeps topic visible to decision makers
• Focus on Unverified Plus sites for areas with sand deficits
•Identify areas to increase efficiencies to maximize use of available resources• 55% contingency: borrow area inefficiencies, dredging losses, future project performance
including SLR impacts
• Utilize regulatory flexibility (nearshore placement, beneficial use placement)
SAND project overview: 50-year beach sand analysis
Highlights:
• Regional, state, county-level maps: project and sand resources
• State, county, project-level tables
– Volume requirement
– Available sand volumes
– 50-year sand balance
• Databases and web app
• Recommendations
ACTIONABLE ITEMS
30
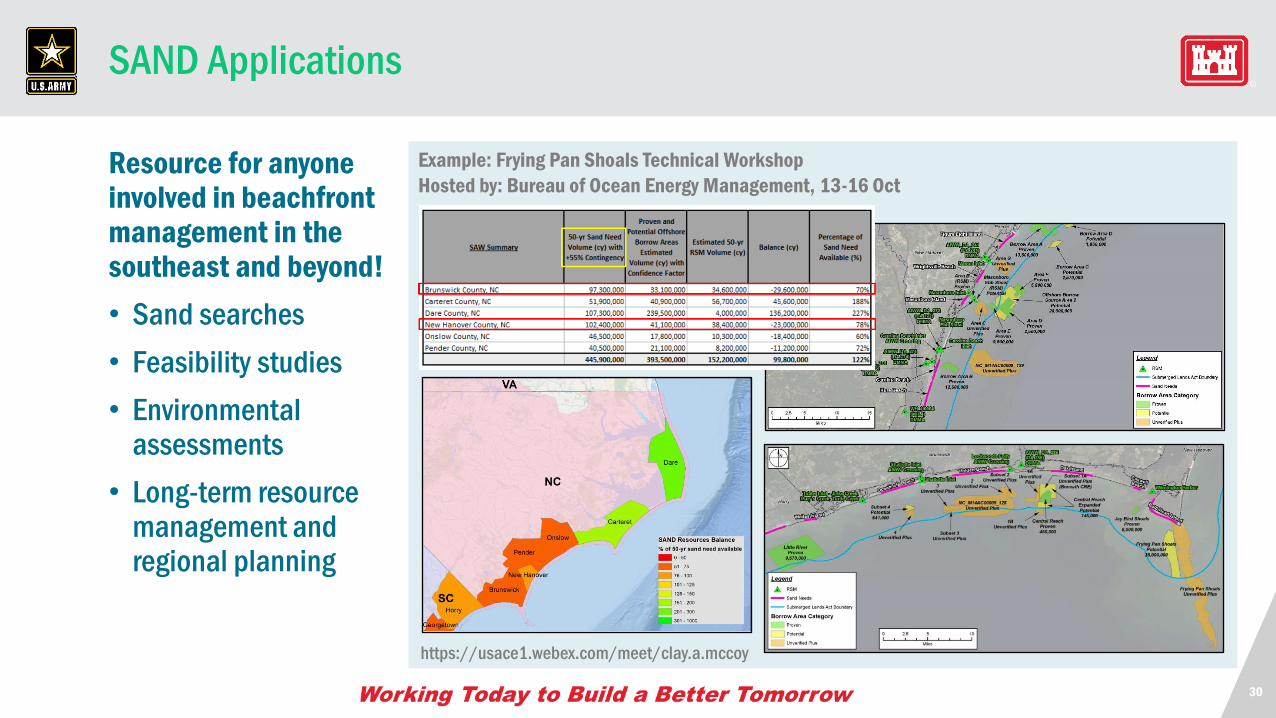
Example: Frying Pan Shoals Technical Workshop
Hosted by: Bureau of Ocean Energy Management, 13-16 Oct
https://usace1.webex.com/meet/clay.a.mccoy
SAND Applications
Resource for anyone involved in beachfront management in the southeast and beyond!
• Sand searches
• Feasibility studies
• Environmental assessments
• Long-term resource management and regional planning
QUESTIONS
32
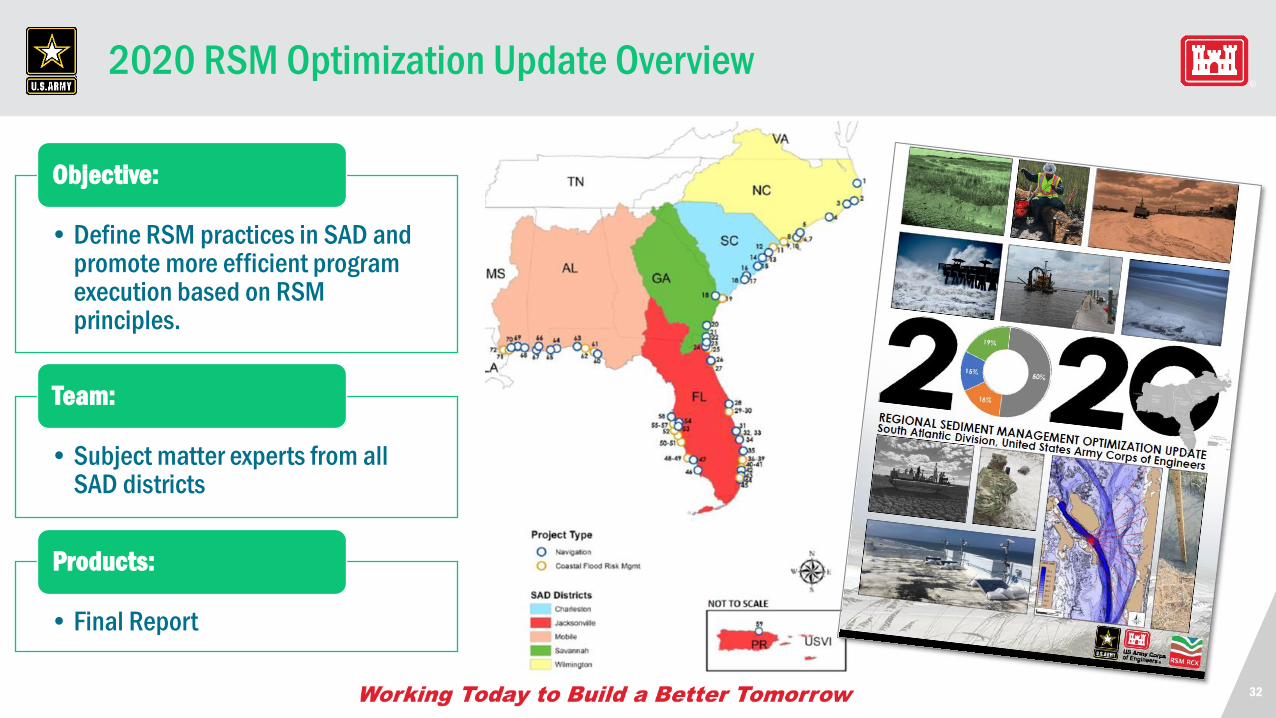
2020 RSM Optimization Update Overview
• Define RSM practices in SAD and promote more efficient program execution based on RSM principles.
Objective:
• Subject matter experts from all SAD districts
Team:
• Final Report
Products:
33
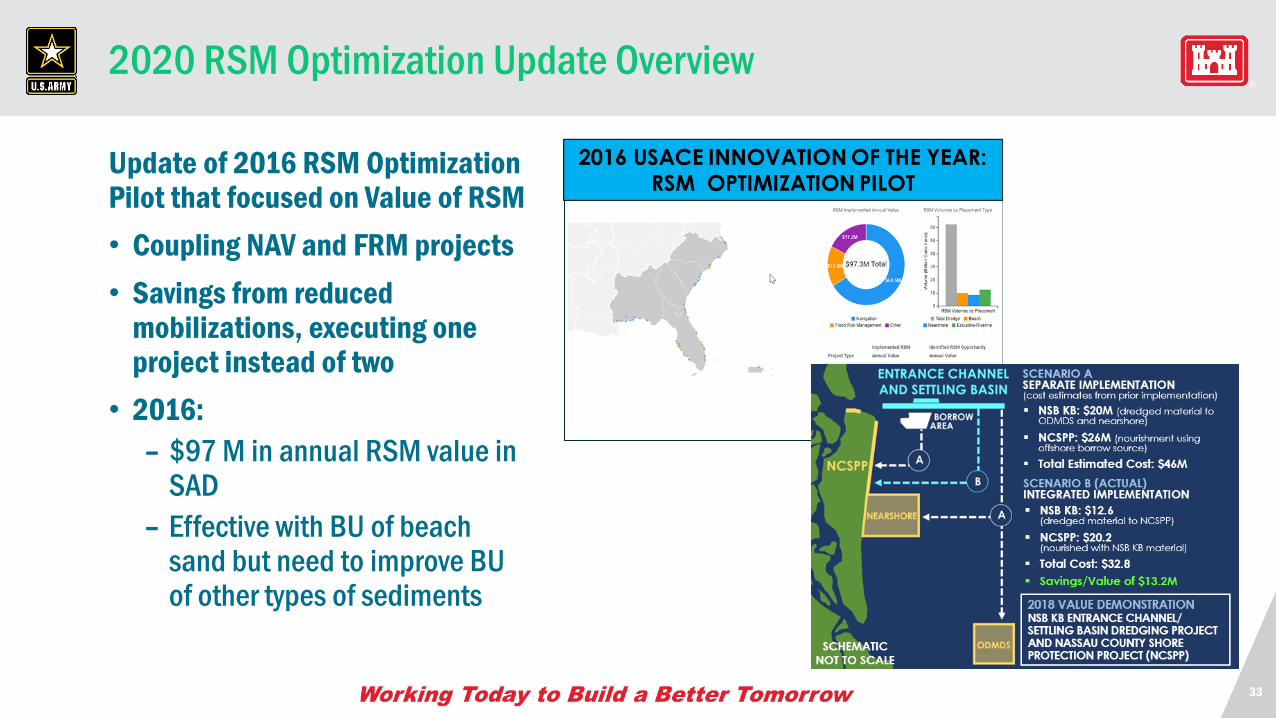
2020 RSM Optimization Update Overview
Update of 2016 RSM Optimization Pilot that focused on Value of RSM
• Coupling NAV and FRM projects
• Savings from reduced mobilizations, executing one project instead of two
• 2016:
– $97 M in annual RSM value in SAD
– Effective with BU of beach sand but need to improve BU of other types of sediments
34
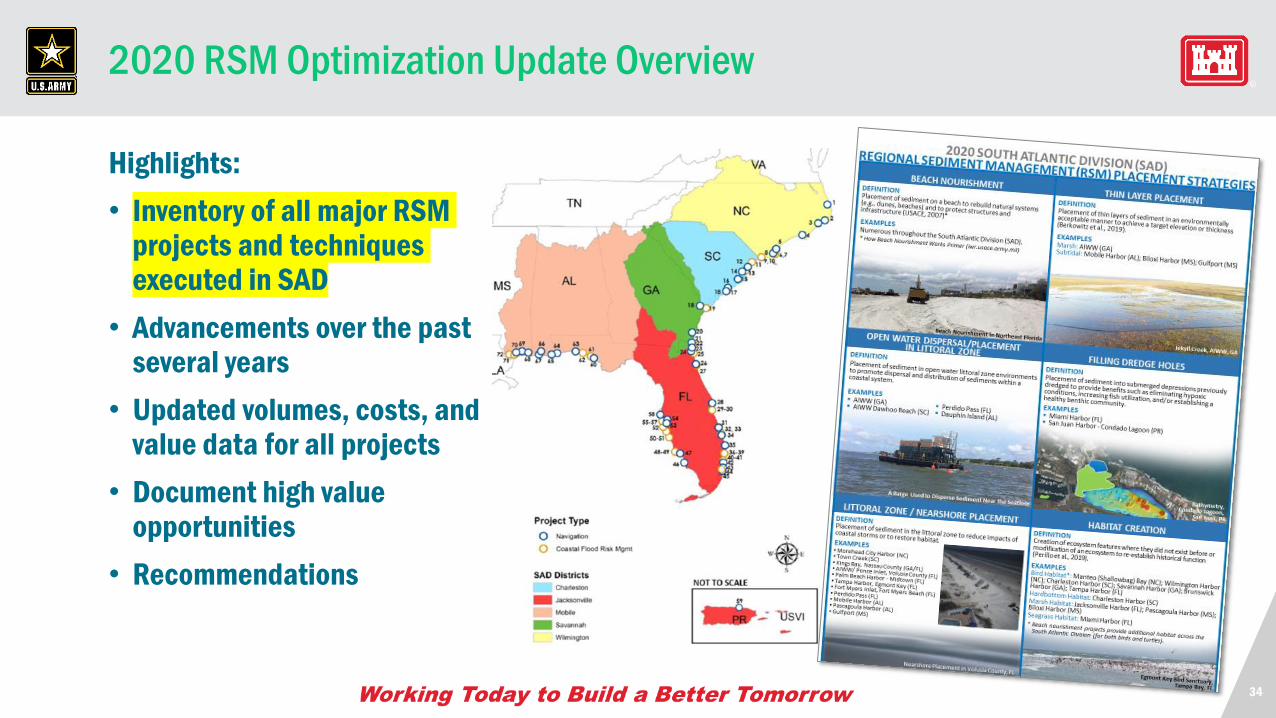
2020 RSM Optimization Update Overview
Highlights:
• Inventory of all major RSM projects and techniques executed in SAD
• Advancements over the past several years
• Updated volumes, costs, and value data for all projects
• Document high value opportunities
• Recommendations
35
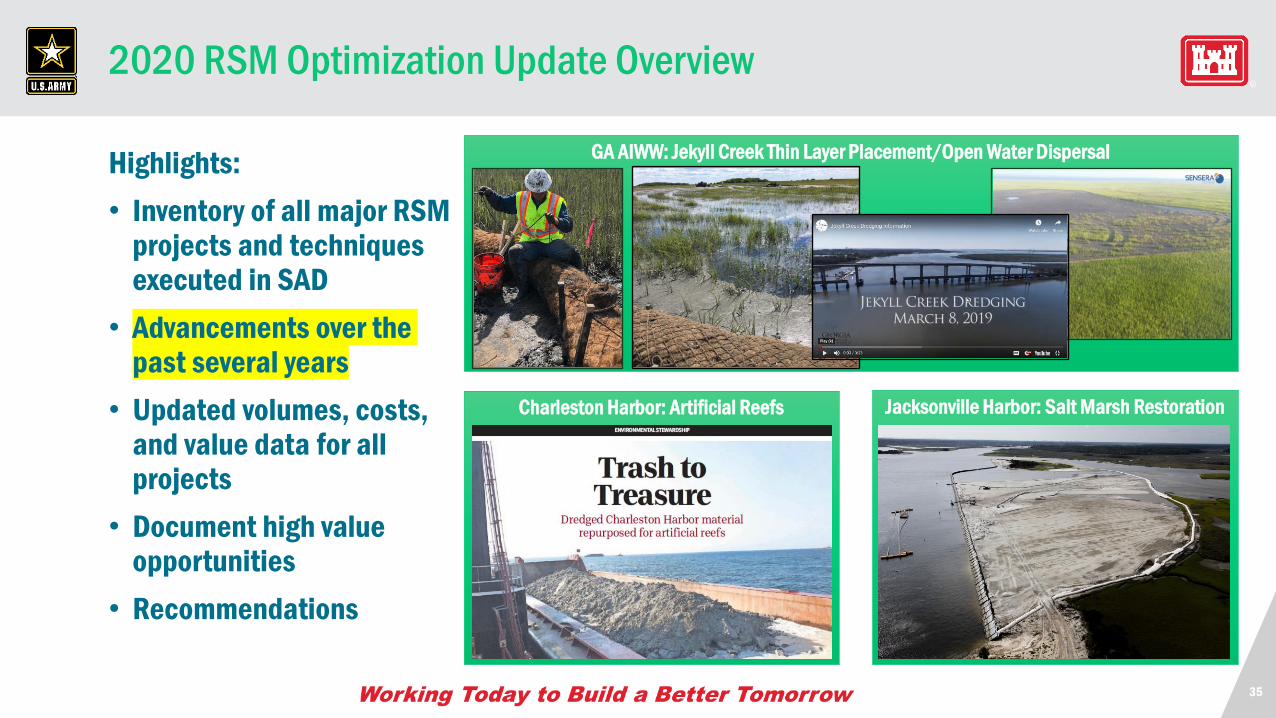
2020 RSM Optimization Update Overview
Highlights:
• Inventory of all major RSM projects and techniques executed in SAD
• Advancements over the past several years
• Updated volumes, costs, and value data for all projects
• Document high value opportunities
• Recommendations
GA AIWW: Jekyll Creek Thin Layer Placement/Open Water Dispersal
Charleston Harbor: Artificial Reefs Jacksonville Harbor: Salt Marsh Restoration
36
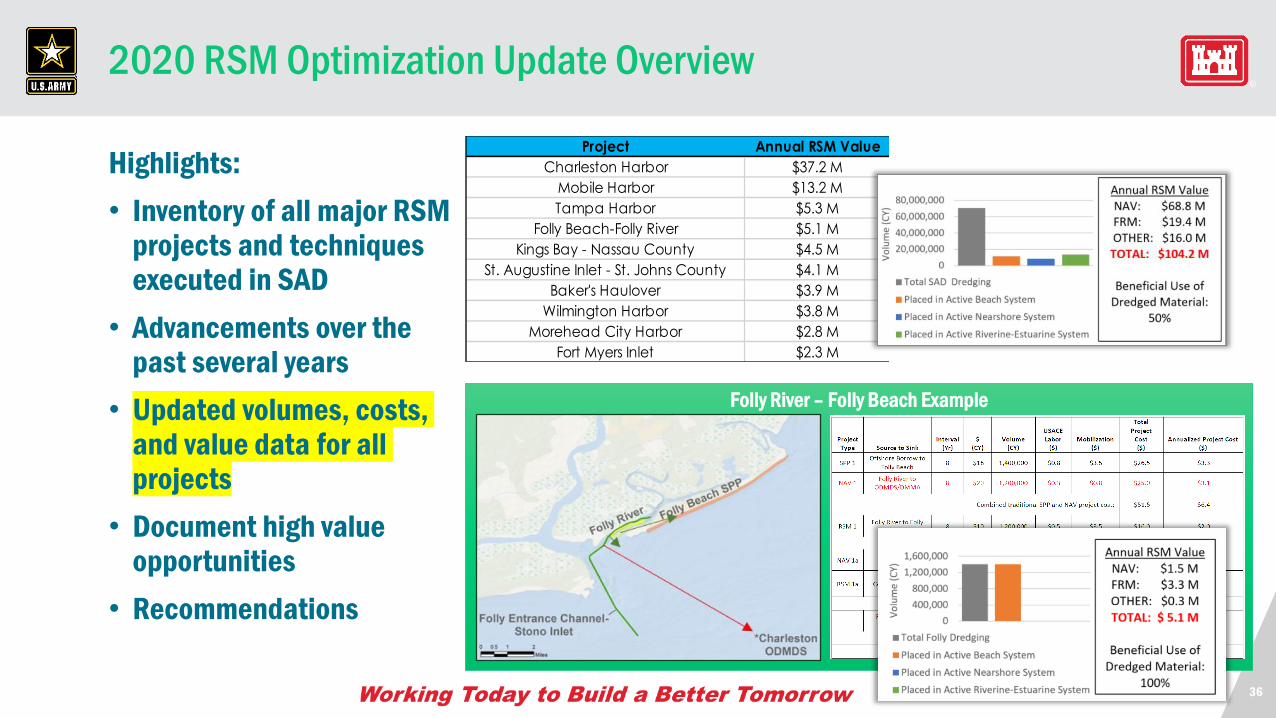
2020 RSM Optimization Update Overview
Highlights:
• Inventory of all major RSM projects and techniques executed in SAD
• Advancements over the past several years
• Updated volumes, costs, and value data for all projects
• Document high value opportunities
• Recommendations
Project Annual RSM Value
Charleston Harbor $37.2 M
Mobile Harbor $13.2 M
Tampa Harbor $5.3 M
Folly Beach-Folly River $5.1 M
Kings Bay - Nassau County $4.5 M
St. Augustine Inlet - St. Johns County $4.1 M
Baker's Haulover $3.9 M
Wilmington Harbor $3.8 M
Morehead City Harbor $2.8 M
Fort Myers Inlet $2.3 M
Folly River – Folly Beach Example
37
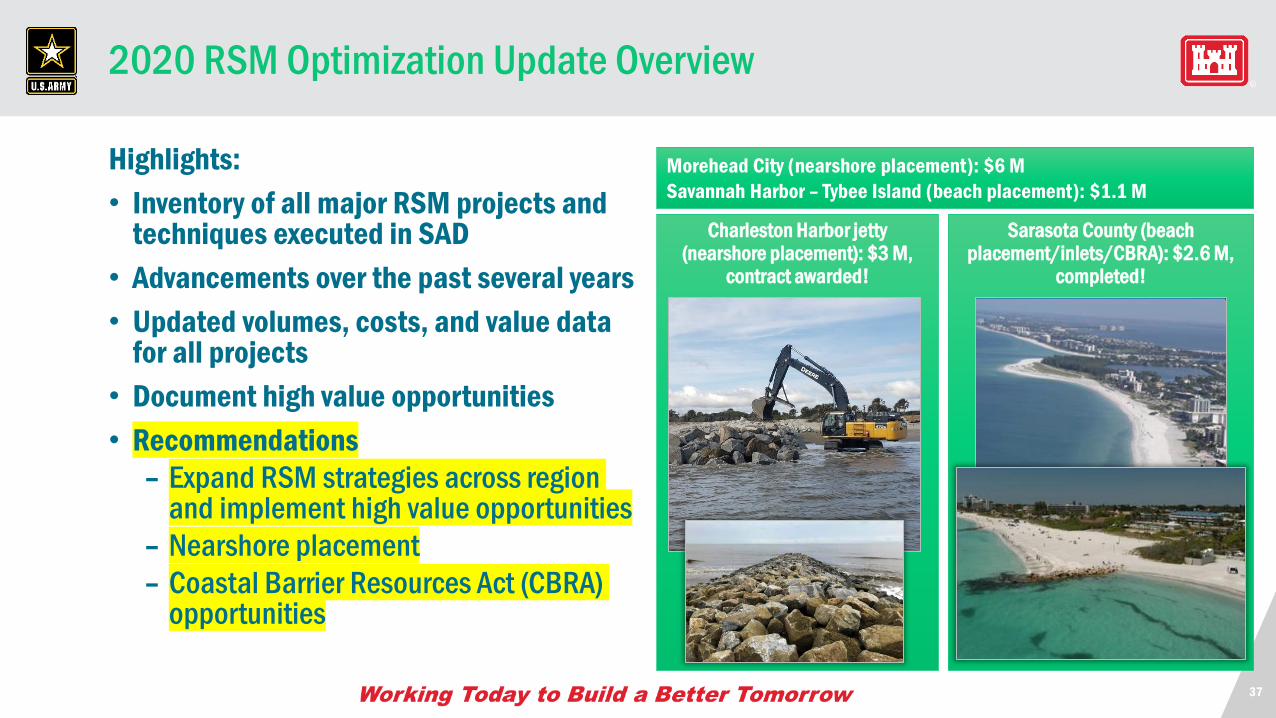
Sarasota County (beach placement/inlets/CBRA): $2.6 M,
completed!
Charleston Harbor jetty (nearshore placement): $3 M,
contract awarded!
2020 RSM Optimization Update Overview
Highlights:
• Inventory of all major RSM projects and techniques executed in SAD
• Advancements over the past several years
• Updated volumes, costs, and value data for all projects
• Document high value opportunities
• Recommendations
– Expand RSM strategies across region and implement high value opportunities
– Nearshore placement
– Coastal Barrier Resources Act (CBRA) opportunities
Morehead City (nearshore placement): $6 M
Savannah Harbor – Tybee Island (beach placement): $1.1 M

QUESTIONS
39
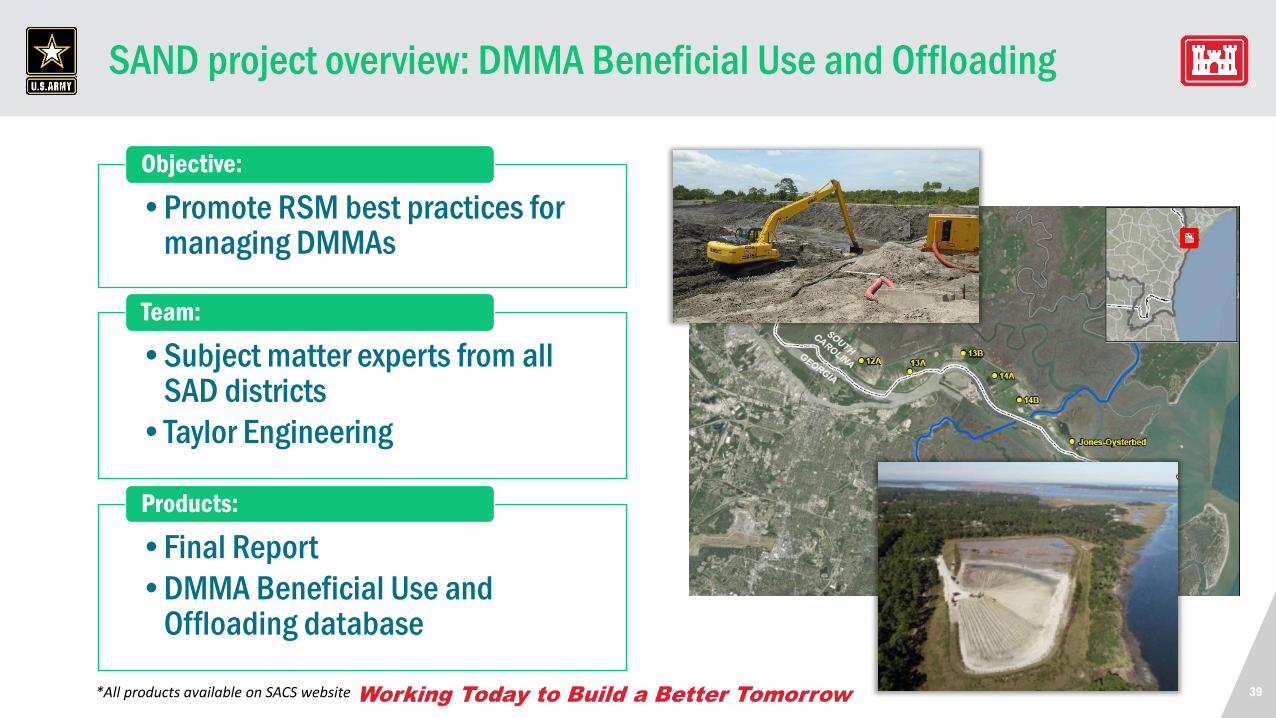
SAND project overview: DMMA Beneficial Use and Offloading
•Promote RSM best practices for managing DMMAs
Objective:
•Subject matter experts from all SAD districts
•Taylor Engineering
Team:
•Final Report
•DMMA Beneficial Use and Offloading database
Products:
*All products available on SACS website
40
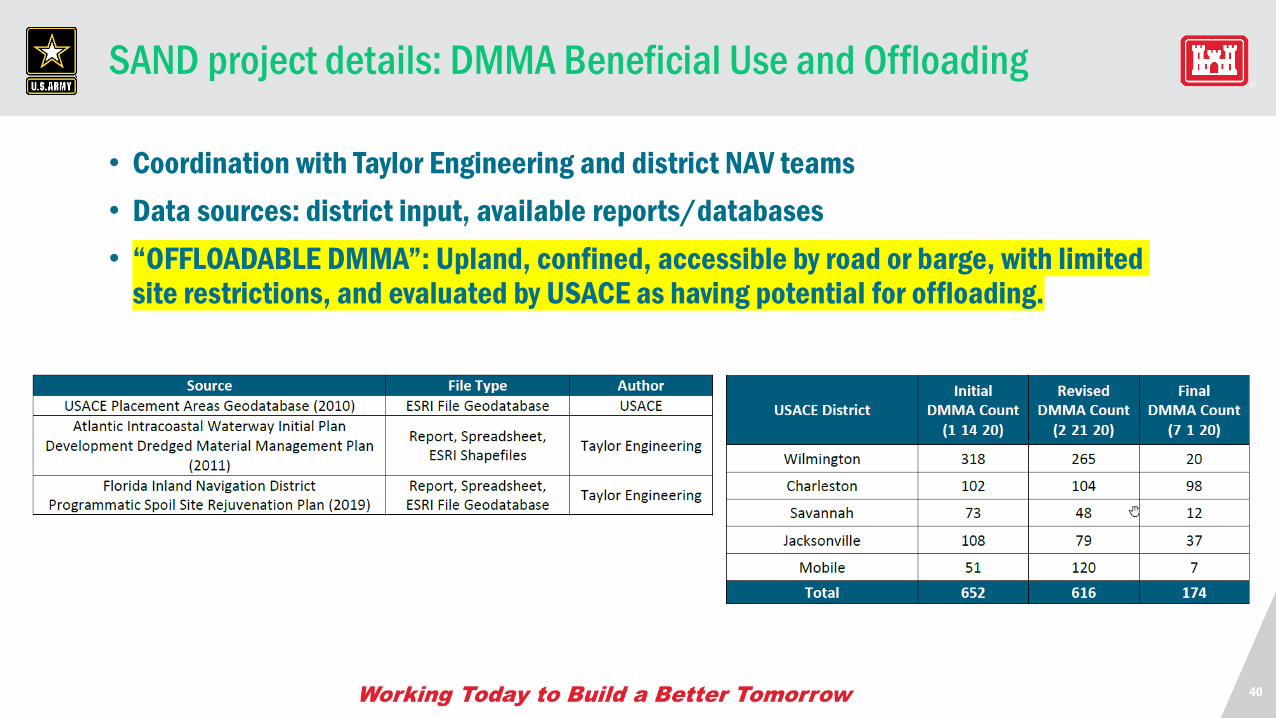
SAND project details: DMMA Beneficial Use and Offloading
• Coordination with Taylor Engineering and district NAV teams
• Data sources: district input, available reports/databases
• “OFFLOADABLE DMMA”: Upland, confined, accessible by road or barge, with limited site restrictions, and evaluated by USACE as having potential for offloading.
41
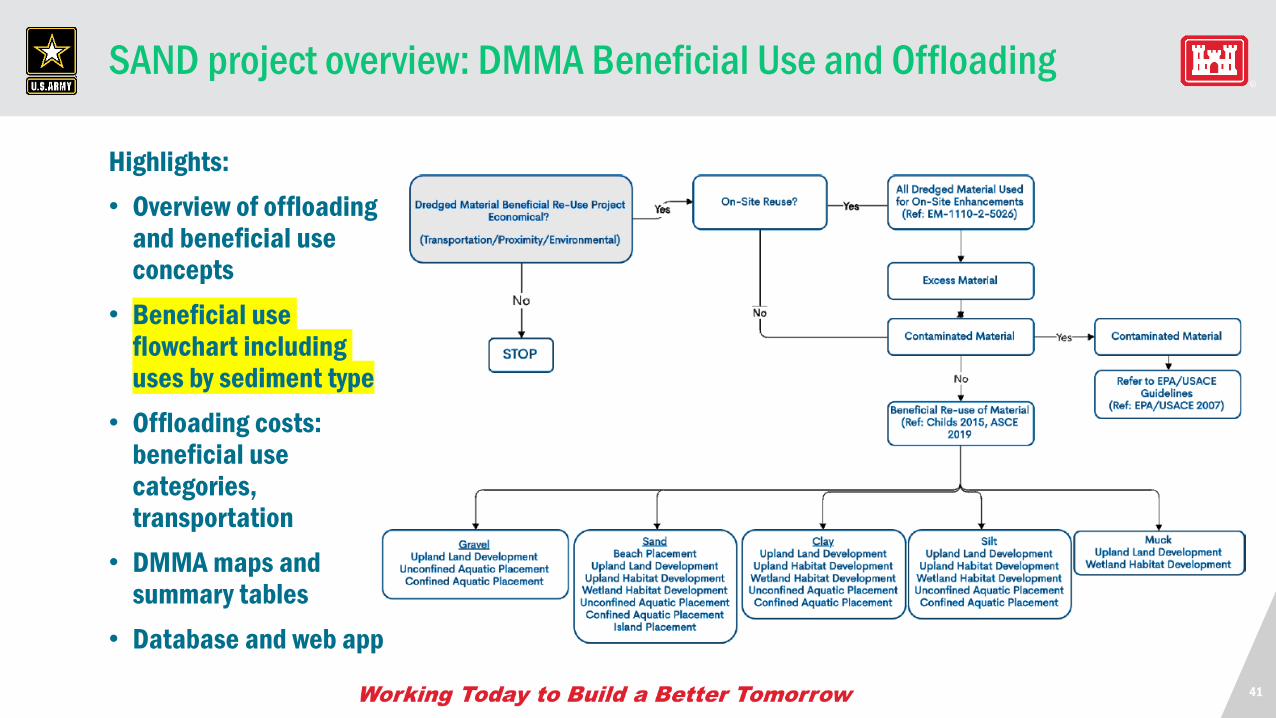
SAND project overview: DMMA Beneficial Use and Offloading
Highlights:
• Overview of offloading and beneficial use concepts
• Beneficial use flowchart including uses by sediment type
• Offloading costs: beneficial use categories, transportation
• DMMA maps and summary tables
• Database and web app
42
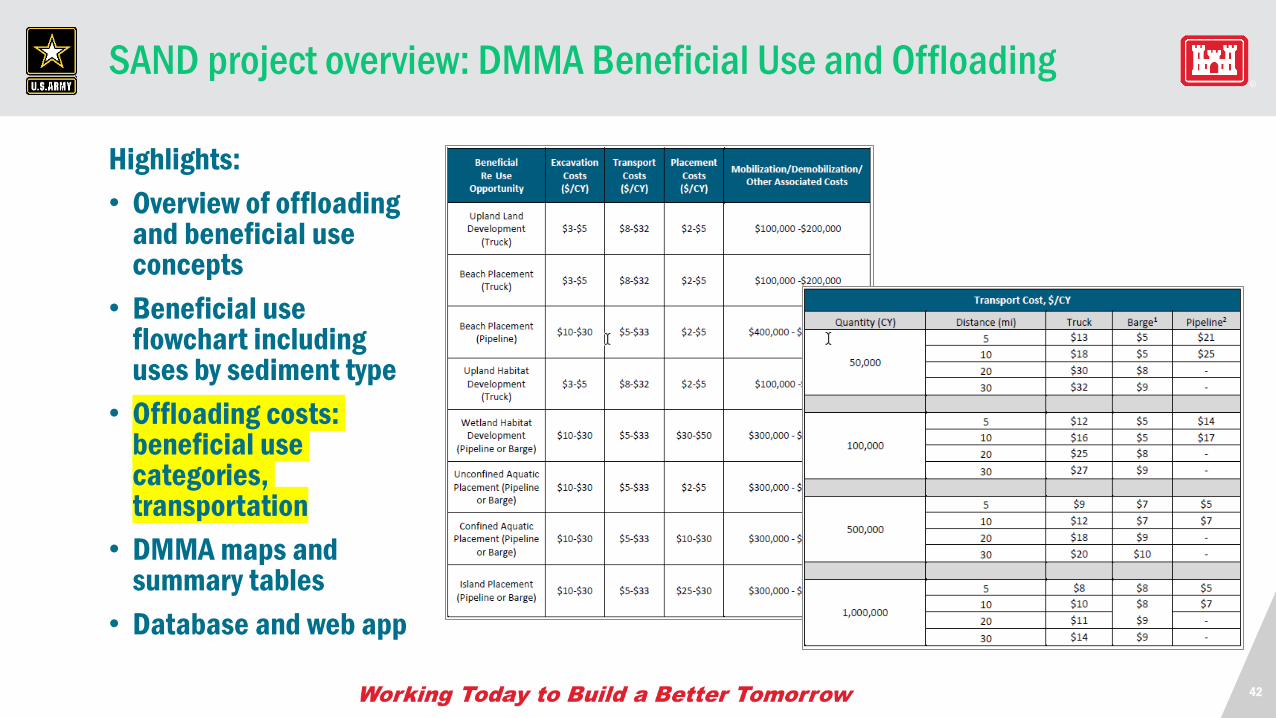
SAND project overview: DMMA Beneficial Use and Offloading
Highlights:
• Overview of offloading and beneficial use concepts
• Beneficial use flowchart including uses by sediment type
• Offloading costs: beneficial use categories, transportation
• DMMA maps and summary tables
• Database and web app
43
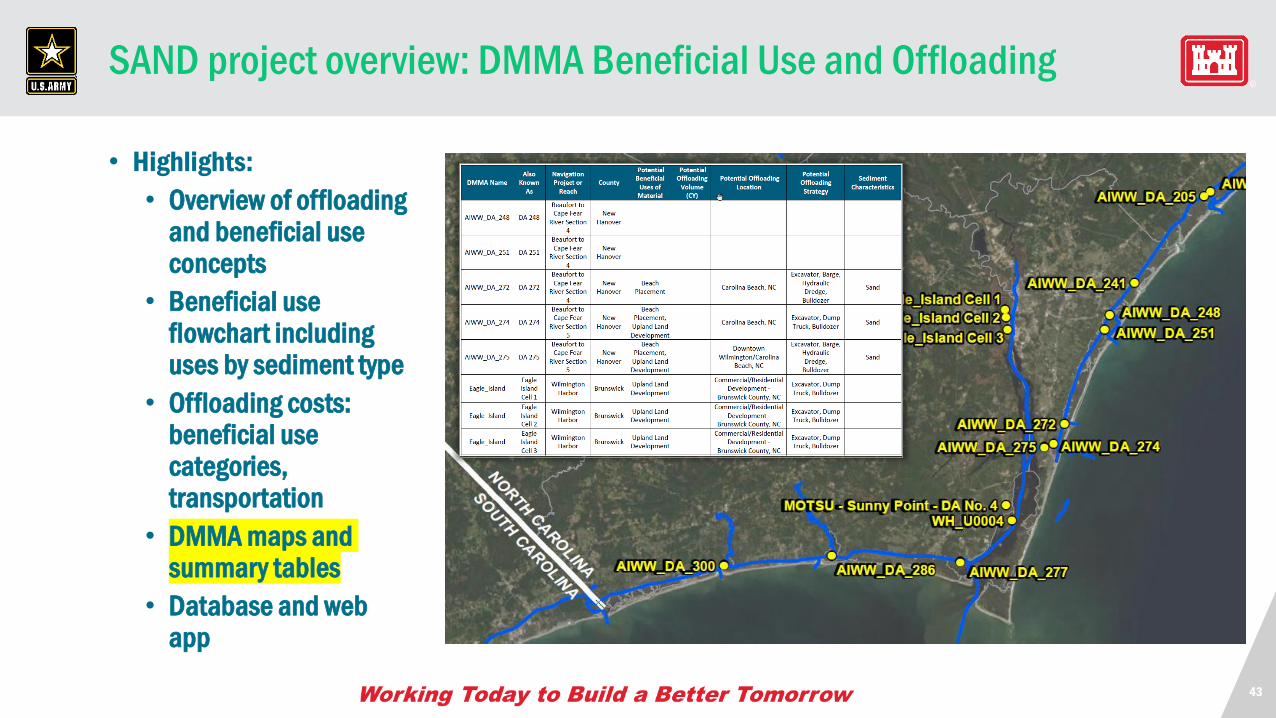
SAND project overview: DMMA Beneficial Use and Offloading
• Highlights:
• Overview of offloading and beneficial use concepts
• Beneficial use flowchart including uses by sediment type
• Offloading costs: beneficial use categories, transportation
• DMMA maps and summary tables
• Database and web app
44
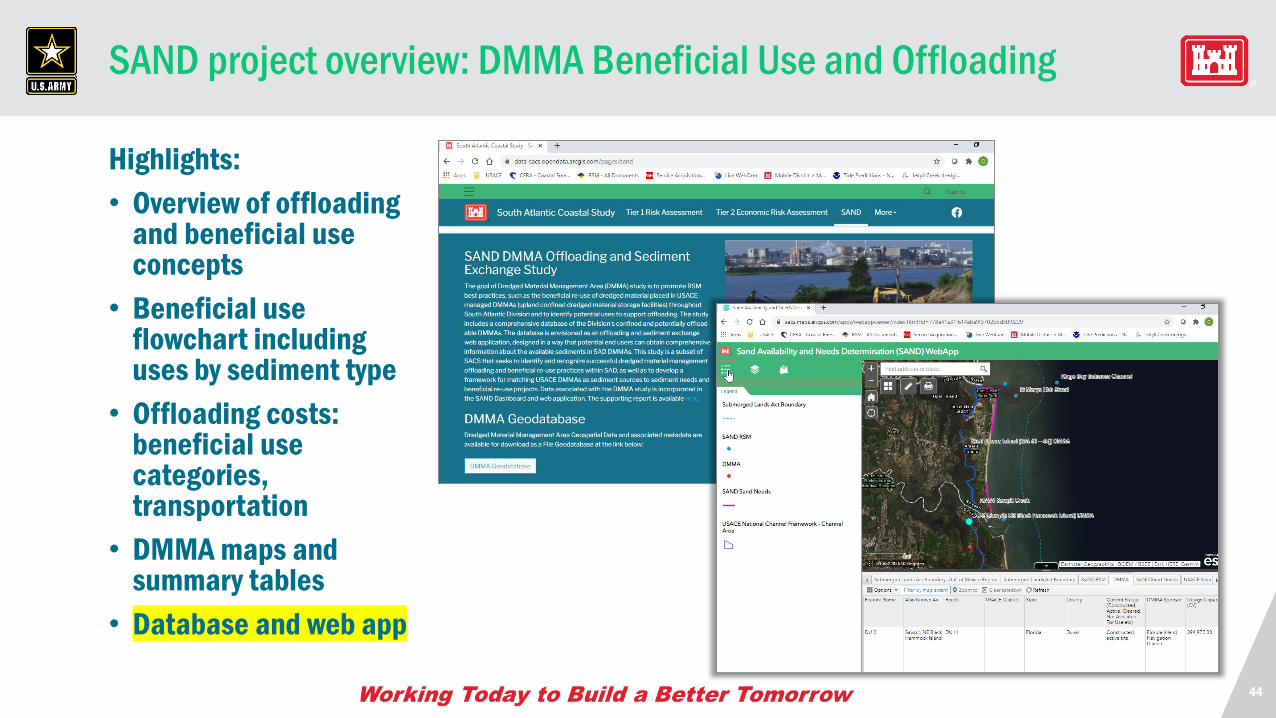
SAND project overview: DMMA Beneficial Use and Offloading
Highlights:
• Overview of offloading and beneficial use concepts
• Beneficial use flowchart including uses by sediment type
• Offloading costs: beneficial use categories, transportation
• DMMA maps and summary tables
• Database and web app
45
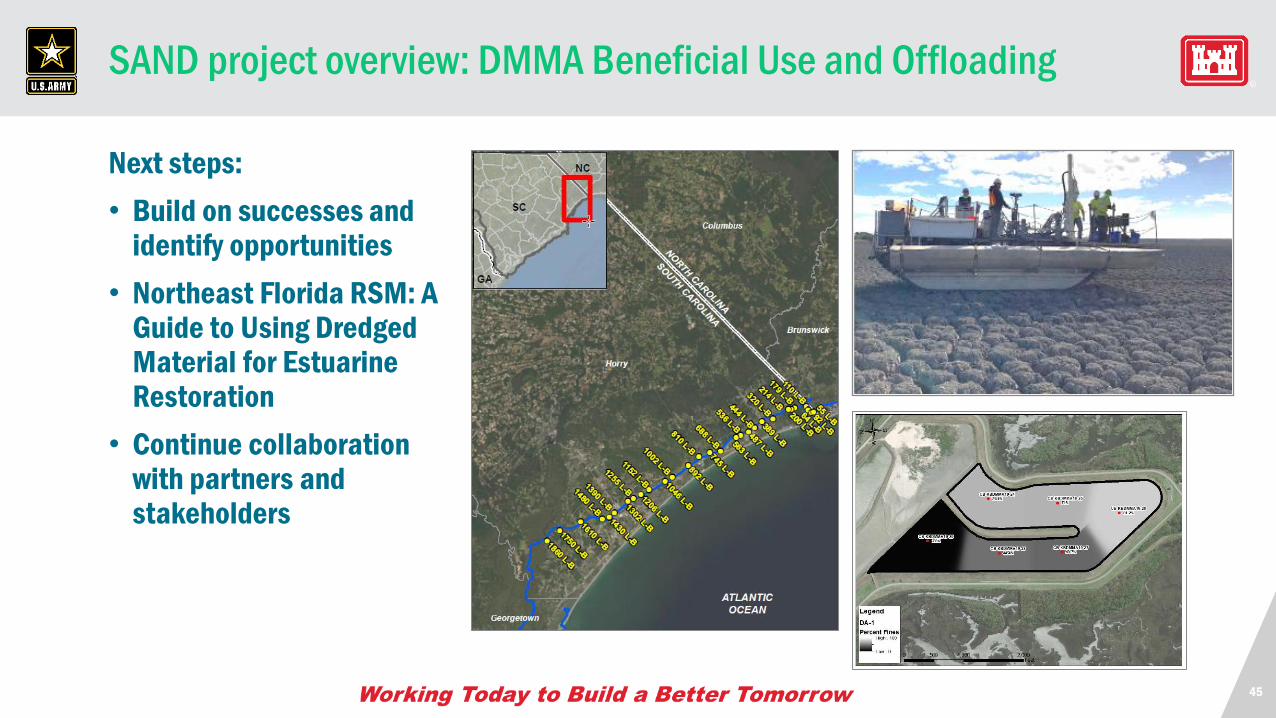
SAND project overview: DMMA Beneficial Use and Offloading
Next steps:
• Build on successes and identify opportunities
• Northeast Florida RSM: A Guide to Using Dredged Material for Estuarine Restoration
• Continue collaboration with partners and stakeholders

QUESTIONS
47
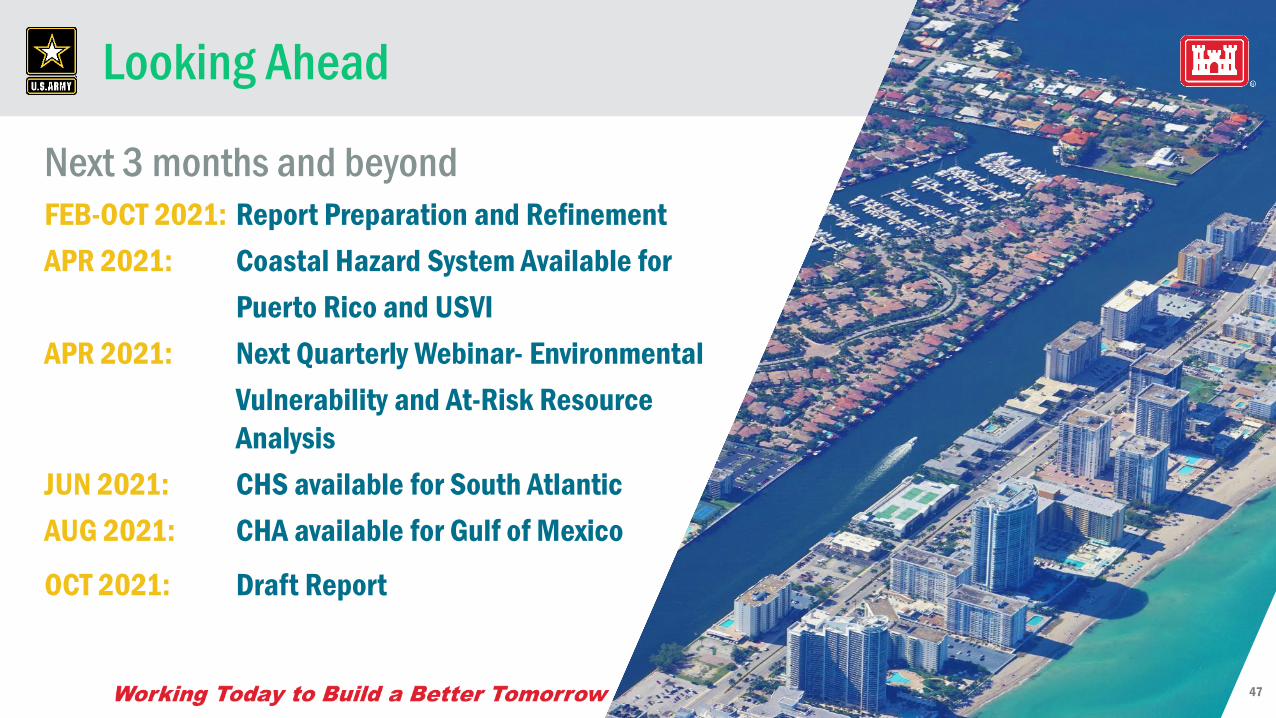
Looking Ahead
Next 3 months and beyond
FEB-OCT 2021: Report Preparation and Refinement
APR 2021: Coastal Hazard System Available for
Puerto Rico and USVI
APR 2021: Next Quarterly Webinar- Environmental
Vulnerability and At-Risk Resource
Analysis
JUN 2021: CHS available for South Atlantic
AUG 2021: CHA available for Gulf of Mexico
OCT 2021: Draft Report
Questions & Discussion
4949
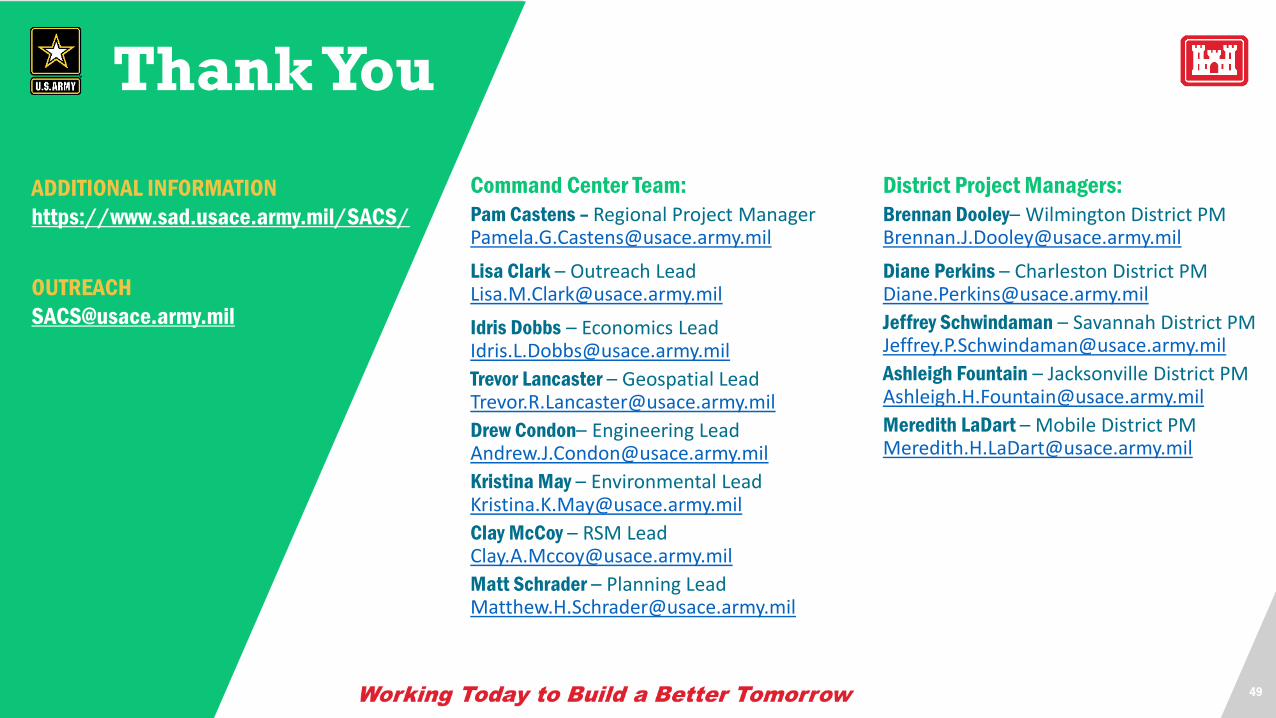
Thank You
ADDITIONAL INFORMATION
https://www.sad.usace.army.mil/SACS/
OUTREACH
Command Center Team:
Pam Castens – Regional Project [email protected]
Lisa Clark – Outreach [email protected]
Idris Dobbs – Economics [email protected]
Trevor Lancaster – Geospatial [email protected]
Drew Condon– Engineering [email protected]
Kristina May – Environmental [email protected]
Clay McCoy – RSM [email protected]
Matt Schrader – Planning [email protected]
District Project Managers:
Brennan Dooley– Wilmington District [email protected]
Diane Perkins – Charleston District [email protected]
Jeffrey Schwindaman – Savannah District [email protected]
Ashleigh Fountain – Jacksonville District [email protected]
Meredith LaDart – Mobile District [email protected]