south asia team excellence award competition asia team excellence award competition ... management...
TRANSCRIPT

1
1
South Asia Team Excellence Award Competition
3/10/2017
2000 ‘02 ‘04 ‘06 ‘08 ‘10 ‘13
Established first hospital
Organic growth through
expansion
Strengthened capabilities to
provide high-end care
Further Expansion in North India
Network of highly qualified medical
personnel
JV with Life Healthcare, South
Africa
2 3/10/2017
Tower Specialities:
Cancer
Neurosciences
Cardiac
Empanelled with CGHS, DGHS, ECHS, ESIC, major PSUs
Adherence to EWS beds
3
Bathinda
Shalimar Bagh
Patparganj
Dehradun Noida
G. Noida Gurgaon
Pitampura
Panchsheel
Saket Mohali
Vision To deliver International Class healthcare with a total service focus, by creating an institution committed to the highest standards of medical & service excellence, patient care, scientific knowledge and medical education
8 Super Speciality Hospitals
4 Multi Speciality Hospitals
4 Multi Specialty Centre
25 Clinics/ Implants
Sevabhav Excellence Credibility
Orthopaedics
Renal Sciences
MAMBS
3/10/2017
Outpatient transactions:
11,550
In-patient & Day Care Procedures:
421
Home Care visits: 185
Preventive Checks:
240
~ 2300 beds
2300 Doctors More than 2.2 million registered patients from 80
Countries
10,000 employees
3000 Nurses
4 3/10/2017

2
5
High end Cath Lab
Brain Suite
SPIDER Novalis LINAC
PET-CT Genomics
3/10/2017 6
Lean Six Sigma / MAXimizing Quality
Standardized Methodology For Continuous Improvement
Reward & Recognition
Quality And Service Delivery Linked To Career Progression
Standard Metrics SCORECARD
Customer, People, Process, Finance
Service Excellence To Be One Of India’s Most Admired Corporates For Service Excellence
Standardized Best Practices
Leadership, Planning, Customers, Measures, Employees. Processes
MAX Performance Excellence Framework
Communications
An
nu
al Assessm
ents
Cycles o
f Imp
rovem
ent Q
ual
ity
Co
un
cil
Gu
idan
ce &
Dir
ecti
on
3/10/2017
• Best Managed Healthcare Program (Health Insurance/TPA)”
7
• First in North India Hospital to get NABH
• FICCI Healthcare excellence awards in 2010,2012,2013,2015
• DL Shah National Award for Economics of Quality
• CII – IGBC (Indian Green Building Council);
• MHC receives LEED – GOLD
• Awarded for Operational Excellence in Healthcare Delivery and MSSH PPG has been awarded for Excellence in Environment Conservation.
3/10/2017 8
Section # 1
Project and Team Selection
3/10/2017

3
1.1.1 Who was responsible for selecting the project? (1/3)
MANAGEMENT TEAM - MEMBERS
9
Selection Review Project
Idea Approval of a
Project Task Force for
Project Implementation
Project Selection
Committee
Chief Executive Officer & Managing
Director
Chief Growth Officer & Sr.Director
Chief Technology Officer
Director- Operations
Chief Financial Officer
Chief People Officer
Sr.Vice President and Head Service
Excellence
3/10/2017
Operations Quality Council Management Committee Cross Functional Project
Team
Head Service Excellence & Customer Operation Head Information Technology Head Quality
MD & Chief Executive Officer Chief Growth Officer Chief People Officer Chief Financial Officer Director Operation
Identification Approval Team Selection
1.1.1 Who was responsible for selecting the project? (2/3)
Project Sponsor Vinita Bhasin
Project Champion Raghav Arora
Project Leader Srijib Banerjee
Cross functional Team members-25
Ap
pro
val
Max Group Vision
Service Excellence
Max Health care values
Seva Bhav, Excellence, Credibility
Project
Mission PRIDE : Front Office Transformation
Journey
10 3/10/2017
11
1.1.1
What background information of the company or those who selected the project is needed to better understand the context of the project ? (3/3)
“ IOMs do not get updated on time” “ Doctors do not come on time and we have to hear from customers” “ CGHS document scanning takes a lot of time” “ Long list of Discount drop downs”
“We do not get training but we are asked to do hopping between desks” “We have to extend shifts due to adhoc leaves of other employees, and no relieving. We have to take permission to go to washroom” “ We get low hike and supervise gives promotion to his favourites” “ Supervisor doesn’t take part in transaction” “ We do not get acknowledgement as FO” “ We have to do good for the fake currency from our own pocket – we are not trained“
“ IT support is weak and they do not resolve our problems quickly” “Every Saturday HIS goes down at peek hours” “ Printer is a big challenge and its not working most of the time”
“We do not have any dashboard to measure our performance” “ We are not measured fairly and no records of performance is ever shown while assessment “
People Engagement and Training
Process Challenges
Technology Support
Governance &
Assessment
c
Employee
Employee+ Customer
Customer
Employee
Impact
3/10/2017
1.2.1 How was the gap or opportunity brought to the attention of the project identification group ? (1/3)
12
Customer listening
Reading & listening of ~1000 voice of patient through survey Captured VoC from FGDs & service recovery call Customer complaint analysis
Employee listening
Met 250+ Front office employees & conducted FGDs One to one done with 60 supervisors
Process walk through
OPD, Admission, PHP, Discharge process walk through done On the job registration and billing done
Stakeholder listening
Met 15 unit heads, doctors and other stake holders Meeting & feedback captured from Sr. Management team members a a
Voice of clinicians
Organization
Performance
Voice of Custome
r
3/10/2017
4
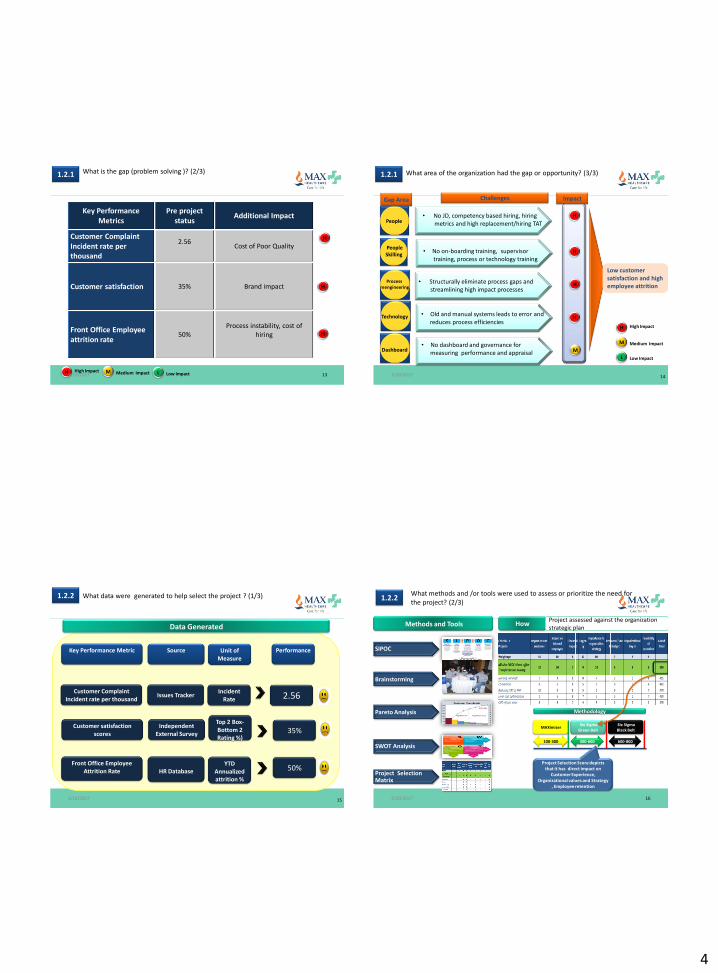
1.2.1 What is the gap (problem solving )? (2/3)
Key Performance Metrics
Pre project status
Additional Impact
Customer Complaint Incident rate per thousand
2.56
Cost of Poor Quality
Customer satisfaction 35% Brand impact
Front Office Employee attrition rate
50% Process instability, cost of
hiring
H
H
H
High Impact Medium Impact Low Impact H M L 13 3/10/2017
• No JD, competency based hiring, hiring metrics and high replacement/hiring TAT
1.2.1 What area of the organization had the gap or opportunity? (3/3)
14
• Structurally eliminate process gaps and streamlining high impact processes
Gap Area
Process reengineering
People
• No on-boarding training, supervisor training, process or technology training
People Skilling
• Old and manual systems leads to error and reduces process efficiencies
Technology
• No dashboard and governance for measuring performance and appraisal Dashboard
Challenges
H
H
H
Impact
H
M
Low customer satisfaction and high employee attrition
High Impact
Medium Impact
Low Impact
H
M
L
3/10/2017
1.2.2 What data were generated to help select the project ? (1/3)
15
Data Generated
Customer Complaint Incident rate per thousand
Customer satisfaction scores
Front Office Employee Attrition Rate
35%
2.56
50%
Issues Tracker
Independent External Survey
HR Database
Incident Rate
Top 2 Box- Bottom 2 Rating %)
YTD Annualized attrition %
Key Performance Metric Source Unit of Measure
Performance
3/10/2017 16
1.2.2 What methods and /or tools were used to assess or prioritize the need for the project? (2/3)
How Project assessed against the organization strategic plan
Six Sigma Black Belt
600-800 300-600
Six Sigma Green Belt
100-300
MAXimizer
Methodology
Project Selection Score depicts that it has direct impact on
Customer Experience, Organizational values and Strategy
, Employee retention
Methods and Tools
SIPOC
Brainstorming
Pareto Analysis
SWOT Analysis
Project Selection Matrix
3/10/2017

5
17
1.2.2 Why were these methods and/or tools used to select the project? (3/3)
Why
• Prioritize projects in terms of impact basis 80:20 principle
• Focus on critical five
• Gather all ideas and information from cross functional team to identify opportunities
• Visual tool for establishing the inter-linkages between departments
• Used to evaluate the strengths, weaknesses, opportunities and threats involved in the processes
• Weigh each potential project using impact criteria
Methods and Tools
SIPOC
Brainstorming
Pareto Analysis
SWOT Analysis
Project Selection Matrix
3/10/2017
1.2.3 What goals (organizational and/or local), performance measures, and /or strategies is the project expected to impact? (1/3)
18
At the project start
Max Health Care’s Vision
• Deliver international class healthcare with a service focus • Creating an institution committed to the highest standards of medical & service excellence, patient care, scientific knowledge, research and medical education
To be one of India’s most admired Corporate for Service Excellence
Max India’s Vision
High Customer complaints
Customer Satisfaction
Scores
High
Front Office Attrition Rate
High
3/10/2017
1.2.3 What is the relationship between the stated measures and perceived gap in 1.2.1? (2/3)
19
Perceived Gaps Stated Project Measures
1.2.1
High Customer complaints
Customer Satisfaction
Scores
High
Front Office Attrition Rate
High
No JD, competency based hiring, hiring metrics and high replacement/hiring TAT
No on-boarding training, supervisor training, process or technology training
Structurally eliminate process gaps and streamlining high impact processes
Old and manual systems leads to error and reduces process efficiencies
No dashboard and governance for measuring performance and appraisal
3/10/2017
1.2.3 What is the problem statement that expresses where the organization wants to be at the end of the project? (3/3)
20
Project Title : Mission PRIDE- Front Office Transformation Journey
Business Case Opportunity Statement
MHC has a vision of providing world class healthcare with Service Excellence being at the core of everything we do. Max health care have 12 hospital units and every month almost 1.5 lacs customer walks in to these units. Front office employee attrition brings instability in processes and patient experience, which is one of the critical outcome for the organization. Employee attrition is at 50% FY16 annualized and patient experience score(measured through IMRB) is at 35 (T2B-B2B) between Sept14 to Mar15. and complaint incident rate was 2.56 per thousand. Through this project, we want to eliminate reasons for low satisfaction of customer and retention of FO employees.
Pain :- Front office employee attrition is 50% and Patient experience score(measured through IMRB) is at 35 (T2B-B2B) and complaints incident rate per thousand is 2.56 Impact of pain in Rs. (or soft) :- 65% of the patient leaves
hospital with unhappy experience which can lead to
-Brand image loss
-Patient loss
-Revenue loss
Also 50% attrition leads to loss of hiring cost, training cost and
process instability
Goal Statement Project Scope
Metric Current
level
Goal / Target Target date
Process under Improvement : Patient Services at Front Office
and employee retention
In Scope :All service related patients at OPD, Admission and
Discharge of all 12 units of Max Healthcare and ~ 600
employees
Customer Experience Score (IMRB)
35 (T2B-B2B) 50 (T2B-B2B) 30-Dec-15
Customer complaint incident rate (per thousand)
2.56 10% improvement 30-Dec-15
Front office Employee Attrition Rate
50% 40% 30-Dec-15
Project Plan Team Selection
Phase Start End Remarks Sponsor :- Vinita Bhasin
Define 1-Mar-15 31-Mar-15 Champion :- Raghav Arora
Measure 01-Apri-15 30-April-15 Quality Head :- Pawan Datta
Improve 01-May-15 31-May-15 Project Leader : Pradeep Kumar
Analyze 1-Jun15 30-Jun-15
BB Mentor :- Puneet Bhatnagar
Control 01-Jul-15 31-Dec15 Team Member :- All FO heads, HSS, Suvendu, Vaibhav,
Mahua, Geetika V, Raghav A, Pradeep K Rajyashree
By the end of the project the company expects to have reduced the Customer
Issues by 10%, thereby increasing Customer Satisfaction from 35% to
50% . Also reducing Front office employee attrition from 50% to 40%
3/10/2017

6
Project Selection
Committee
SIPOC
Process Maps
and
Brainstorming
Identifying departments :- -Directly involved in processes -Indirectly involved, but are critical for success
-Identifying suppliers and customers of the process
-Identifying the service components of the process
- Identifying details of each process activity and departments responsible for them
- By considering the individual’s concern
1.3.1 How were the stakeholders groups identified? (1/2)
How
Tools Used
21
Stake holder groups
Management Committee
3/10/2017 Executor
•MD & Chief Executive Officer •Chief Growth Officer • Chief People Officer •Chief Financial Officer •Director Operation
•Head Service Excellence & Customer Operation •Head Information Technology •Head Quality
Project Sponsor Project Champion Project Leader Project Mentor ( Black Belt) Team Members from Front office team, IT, HR, Support service heads, Transformation office, Quality, Training
Influencer
1.3.1 What or who are stakeholder groups ? (2/2)
22
Patients and attendants
I
I
E
I
I E
Stake holder groups Designations Role
Management Committee
3/10/2017
1.3.2 What knowledge or skill sets were determined to be necessary for successful completion of the project? (1/2)
23
Determined Skill Sets
• Customer communication skills
• Technical knowledge
• Change management skills
•Quality tool know how
• Process domain knowledge
• Innovative thinking
• Problem solving & analytical skills
• Customer centricity
• Employee Engagement skill
• Training Skill
3/10/2017
1.3.2 To what extent did the existing stakeholder groups have the required knowledge or skills? ( 2/3) What additional knowledge and skills were brought in to make the project successful?( 3/3)
Additional Skills brought
24
None
•Lean Basics •Quality tools training •Six Sigma training •Team building workshop • Presentation & Communication skills
Change acceleration process training and champions training
Six Sigma Champions training Tollgate Reviews
• Customer centricity • Innovative thinking • Employee Engagement skill • Problem solving & analytical skills • Lean Six Sigma • Technical knowledge
Change Management
Awareness
Required skills
•MD & CEO Officer •Chief Growth Officer • Chief People Officer •Chief Financial Officer •Director Operation
•Head Service Excellence & Customer Operation •Head Information Technology •Head Quality
Project Sponsor Project Champion Project Leader Project Mentor ( Black Belt) Team Members from Front office team, IT, HR, Support service heads, Transformation office, Quality, Training
Patients and attendants
Stake holder groups Designations
3/10/2017
7
Generative
Degenerative
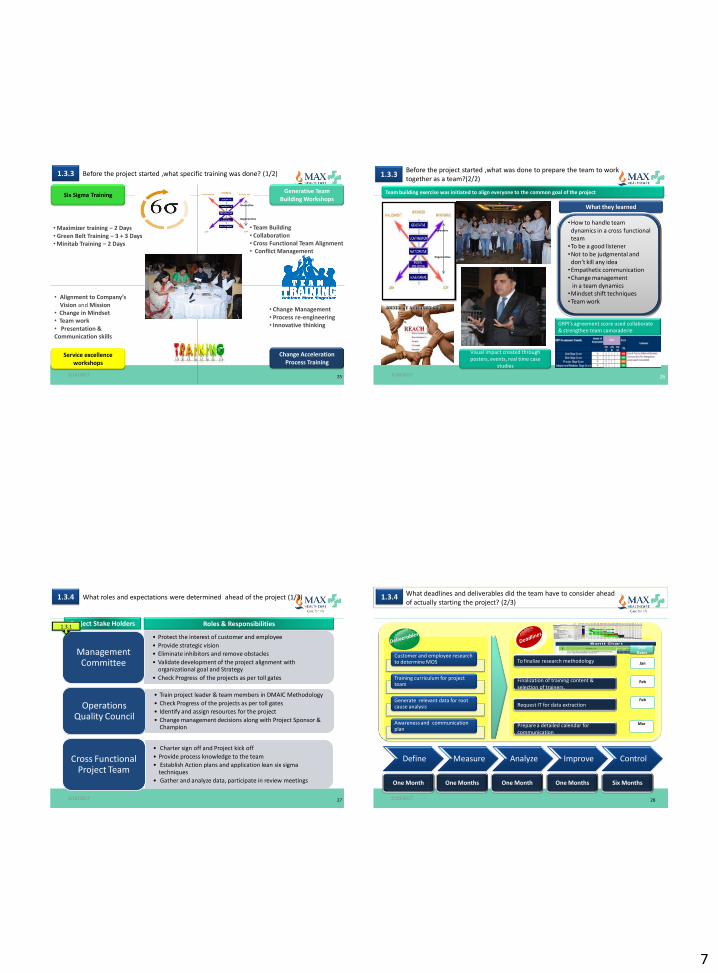
1.3.3 Before the project started ,what specific training was done? (1/2)
Six Sigma Training
Service excellence workshops
Change Acceleration Process Training
Generative Team Building Workshops
• Maximizer training – 2 Days • Green Belt Training – 3 + 3 Days • Minitab Training – 2 Days
• Change Management • Process re-engineering • Innovative thinking
• Alignment to Company’s Vision and Mission
• Change in Mindset • Team work • Presentation & Communication skills
25
• Team Building • Collaboration • Cross Functional Team Alignment • Conflict Management
3/10/2017
1.3.3 Before the project started ,what was done to prepare the team to work together as a team?(2/2)
26
26
Team building exercise was initiated to align everyone to the common goal of the project
Generative
Degenerative
Visual impact created through posters, events, real time case
studies
What they learned
•How to handle team dynamics in a cross functional team
•To be a good listener •Not to be judgmental and
don’t kill any idea •Empathetic communication •Change management in a team dynamics •Mindset shift techniques •Team work
GRPI’s agreement score used collaborate & strengthen team camaraderie
3/10/2017
1.3.4 What roles and expectations were determined ahead of the project (1/3)
27
• Protect the interest of customer and employee
• Provide strategic vision
• Eliminate inhibitors and remove obstacles
• Validate development of the project alignment with organizational goal and Strategy
• Check Progress of the projects as per toll gates
Management Committee
• Train project leader & team members in DMAIC Methodology
• Check Progress of the projects as per toll gates
• Identify and assign resources for the project
• Change management decisions along with Project Sponsor & Champion
Operations Quality Council
• Charter sign off and Project kick off
• Provide process knowledge to the team
• Establish Action plans and application lean six sigma techniques
• Gather and analyze data, participate in review meetings
Cross Functional Project Team
Project Stake Holders Roles & Responsibilities 1.3.1
3/10/2017
1.3.4 What deadlines and deliverables did the team have to consider ahead of actually starting the project? (2/3)
28
Customer and employee research to determine MOS
Training curriculum for project team
Generate relevant data for root cause analysis
Awareness and communication plan
To finalize research methodology
Finalization of training content & selection of trainers.
Request IT for data extraction
Prepare a detailed calendar for communication
Jan
Feb
Feb
Mar
Due Dates
Define Measure Analyze Improve Control
One Month One Months One Month One Months Six Months
3/10/2017
8
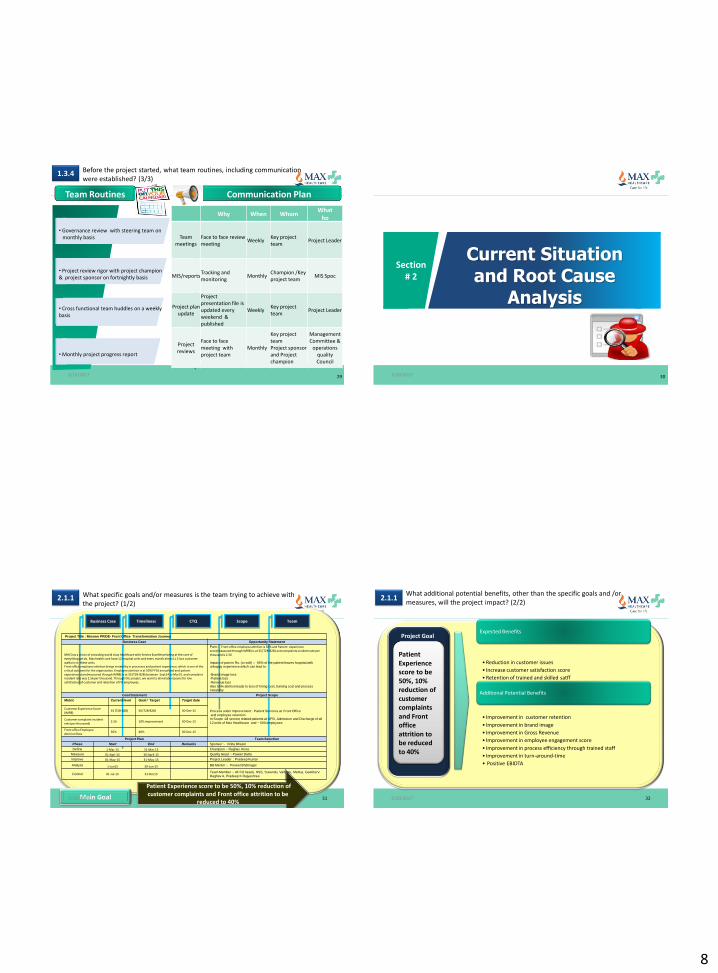
1.3.4 Before the project started, what team routines, including communication were established? (3/3)
29
• Governance review with steering team on monthly basis
• Project review rigor with project champion & project sponsor on fortnightly basis
• Cross functional team huddles on a weekly basis
• Monthly project progress report
Team Routines Communication Plan
Why When Whom What
ho
Team meetings
Face to face review meeting
Weekly Key project team
Project Leader
MIS/reports Tracking and monitoring
Monthly Champion /Key project team
MIS Spoc
Project plan update
Project presentation file is updated every weekend & published
Weekly Key project team
Project Leader
Project reviews
Face to face meeting with project team
Monthly
Key project team Project sponsor and Project champion
Management Committee &
operations quality Council
3/10/2017 30
Section # 2
Current Situation and Root Cause
Analysis
3/10/2017
31 Main Goal
Patient Experience score to be 50%, 10% reduction of customer complaints and Front office attrition to be
reduced to 40%
2.1.1 What specific goals and/or measures is the team trying to achieve with the project? (1/2)
Business Case Timeliness CTQ Scope Team
Project Title : Mission PRIDE- Front Office Transformation Journey
Business Case Opportunity Statement
MHC has a vision of providing world class healthcare with Service Excellence being at the core of everything we do. Max health care have 12 hospital units and every month almost 1.5 lacs customer walks in to these units. Front office employee attrition brings instability in processes and patient experience, which is one of the critical outcome for the organization. Employee attrition is at 50% FY16 annualized and patient experience score(measured through IMRB) is at 35 (T2B-B2B) between Sept14 to Mar15. and complaint incident rate was 2.56 per thousand. Through this project, we want to eliminate reasons for low satisfaction of customer and retention of FO employees.
Pain :- Front office employee attrition is 50% and Patient experience score(measured through IMRB) is at 35 (T2B-B2B) and complaints incident rate per thousand is 2.56
Impact of pain in Rs. (or soft) :- 65% of the patient leaves hospital with unhappy experience which can lead to
-Brand image loss -Patient loss
-Revenue loss
Also 50% attrition leads to loss of hiring cost, training cost and process instability
Goal Statement Project Scope
Metric Current level Goal / Target Target date
Process under Improvement : Patient Services at Front Office
and employee retention In Scope :All service related patients at OPD, Admission and Discharge of all
12 units of Max Healthcare and ~ 600 employees
Customer Experience Score (IMRB)
35 (T2B-B2B) 50 (T2B-B2B) 30-Dec-15
Customer complaint incident rate (per thousand)
2.56 10% improvement 30-Dec-15
Front office Employee Attrition Rate
50% 40% 30-Dec-15
Project Plan Team Selection
Phase Start End Remarks Sponsor :- Vinita Bhasin
Define 1-Mar-15 31-Mar-15 Champion :- Raghav Arora
Measure 01-Apri-15 30-April-15 Quality Head :- Pawan Datta
Improve 01-May-15 31-May-15 Project Leader : Pradeep Kumar
Analyze 1-Jun15 30-Jun-15 BB Mentor :- Puneet Bhatnagar
Control 01-Jul-15 31-Dec15 Team Member :- All FO heads, HSS, Suvendu, Vaibhav, Mahua, Geetika V,
Raghav A, Pradeep K Rajyashree
3/10/2017 32
Patient Experience score to be 50%, 10% reduction of customer complaints and Front office attrition to be reduced to 40%
Expected Benefits
• Reduction in customer issues
• Increase customer satisfaction score
• Retention of trained and skilled satff
Additional Potential Benefits
• Improvement in customer retention
• Improvement in brand image
• Improvement in Gross Revenue
• Improvement in employee engagement score
• Improvement in process efficiency through trained staff
• Improvement in turn-around-time
• Positive EBIDTA
2.1.1 What additional potential benefits, other than the specific goals and /or measures, will the project impact? (2/2)
Project Goal
3/10/2017

9
33
2.2.1 What methods and/or tools were used to identify possible root causes / improvement opportunity (ies)? (1/2)
DMAIC Methodology used
SIPOC and process mapping Pareto
Ishikawa
Affinity Diagram
VOC Collection through Survey
Analysis and Base lining of the Project CTQ
Identification of the Possible Root Causes
3/10/2017 34
2.2.1 How was the team prepared to use the methods and /or tools? Why were these methods and / or tools selected?(2/2)
Tools used How Why
Identify significant causes on 80:20 Principle
Generating ideas
Generate possible causes
Gathering Voice of Customer
Cross functional team meetings
Correlation with project CTQ along with the cross
functional team members
Focusing on main causes in cross functional Team
meetings
Third party survey interviews with customers
to capture feedback
Six Sigma tools Training
Facilitated by embedded Black Belt
3/10/2017
Customer issues trends Issues login & closure date HR exit Data and interview
of employee Survey results
2.2.2 What data was generated and how was the data analyzed to identify the possible root cause(s)/improvement opportunity(ies)? (1/2)
Pareto – By identifying most significant causes for top contributors to complaint, low satisfaction of customer employees Voice of Customer Survey – By Interview questionnaires to identify customer expectations and map them with process outcomes ( VOC to CTQ Mapping ) Control and Capability charts - We checked the process variations and it’s capability to deliver on customer expectations ( Affinity Diagram & Ishikawa – By grouping the possible root causes under various heads such as Process related issues, people and technology support etc
Data
Information Generated
Too
ls Use
d
How
35 3/10/2017
Sl No. Causes
1 Customer is not aware of the registration charges
2 Fake currency management policy
3 Complex estimation process
4 Long registration process
5 Manual discount process
6 Bed management is a tedious at the time of admission
7 No Communication process on new updates
8 No MIS on patient expérience
9 Low frequency of data sharing
10 No Dashboard for FO
11 Low focus on functional review
12 No Dissemination of experience score
13 No waiting area
14 No Queue manager
15 Floating counter unavailability
16 No proper stafff sitting area and drawers
17 No Cash counting machhine
2.2.2 What were the possible root cause(s) / improvement opportunity(ies)? (2/2)
1 • Process or policy related challenges
2 • Infrastructure and wait time
3 • Low on knowledge and soft skill
4 • Low People engagement
5 • Governance and Dashboard
6 • Technology Support
Issue categorization
36 3/10/2017
10
TOOLS
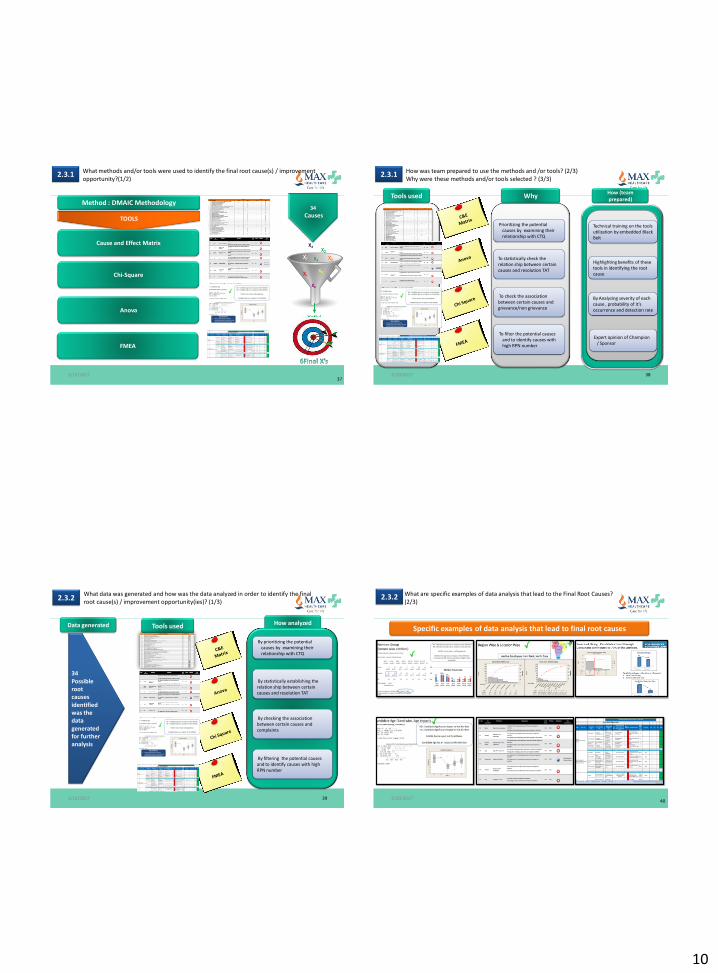
2.3.1 What methods and/or tools were used to identify the final root cause(s) / improvement opportunity?(1/2)
Method : DMAIC Methodology
37
Cause and Effect Matrix
Chi-Square
Anova
FMEA
34
Causes
3/10/2017 38
Tools used How (team prepared)
Why
2.3.1 How was team prepared to use the methods and /or tools? (2/3) Why were these methods and/or tools selected ? (3/3)
Prioritizing the potential causes by examining their relationship with CTQ
To statistically check the relation ship between certain causes and resolution TAT
To check the association between certain causes and grievance/non grievance
To filter the potential causes and to identify causes with high RPN number
•
Technical training on the tools utilization by embedded Black Belt
Highlighting benefits of these tools in identifying the root cause
By Analyzing severity of each cause , probability of it’s occurrence and detection rate
Expert opinion of Champion / Sponsor
3/10/2017
39
2.3.2 What data was generated and how was the data analyzed in order to identify the final root cause(s) / improvement opportunity(ies)? (1/3)
How analyzed
By prioritizing the potential causes by examining their relationship with CTQ
By statistically establishing the relation ship between certain causes and resolution TAT
By checking the association between certain causes and complaints
By filtering the potential causes and to identify causes with high RPN number
34 Possible root causes identified was the data generated for further analysis
Data generated Tools used
3/10/2017
2.3.2 What are specific examples of data analysis that lead to the Final Root Causes? (2/3)
40
Specific examples of data analysis that lead to final root causes
3/10/2017

11
2.3.2 What are specific examples of data analysis that lead to the Final Root Causes? (2/3)
41
External Customer In sighting : KJ Process
Open Ended Questionnaires
Customer Segments Identified Data Gathered in the form of Voice notes & affinity diagrams
Kano Diagram External Focus
3/10/2017 42
2.3.2 What was (were) the final root cause(s) / improvement opportunity(ies)? (3/3)
Sl No. X's Why1 Why2 Why3 Why4 Why5
X1 Process or policy related challenges
No adherence Manual process No standardization
Process not updated
Process 4 sheteer not available
X2 Infrastructure and wait time Customer gets frustrated
Chaos at front office
No lobby management
No sitting area and Queue management
NA
X3 Low on knowledge and soft skill Erroneous output Not aware of processes
No training need analysis
No focus on training
No employee training
X4 Low People engagement Low employee out put Low employee morale
No engagement No recognition platform
NA
X5 Governance and Dashboard No focus No goals No traction No Dashboard No governance
X6 Technology Support Low efficiency of systems
System upkeep is poor or low
No focus on System upkeep of FO
IT prioritize tickets as per Severity and FO priority is low
NA
Issues Final Root Cause
3/10/2017
2.3.3 How was (were) the final root cause(s)/improvement opportunity(ies) validated? (1/2)
43
How ?
Open ended questionnaire
Identified 11 High Impact X’s from CE
Matrix & collected
Historic data
Hypothesis testing through statistical tools
How?
Upcountry Locations have low lead generation
ratios. Tool : One way Annova
Assumption to be tested
External Focus
Conducted customer interviews
Analyzed the data / prepared Affinity
Diagrams
Use of kano model to classify customer needs
Conclusion : There was no significant variation in the lead generations ratios of
upcountry & city locations
Myth Buste
r
•One Way Annova •Chi SquareTest •2P test •Specialist Validation •Gemba
Tools for Validation Conclusion Basis P Value
Example
Statistical Tests
43 3/10/2017
2.3.3 What evidence showed that the final root cause(s) /improvement opportunity(ies)
were validated prior to solution development?(2/2) (2/2)
44
Specific examples of root cause validation that lead to solution development
Potential Causes Identified: 6 Validated Causes: 7
Analyze Phase Completion : 1st Aug’15 Improve Phase Start : 2nd August
Lead Conversion was higher in the branches where
ADMs followed the roster
Basis the test results
Roster was made mandatory in all
the offices
Internal Focus External Focus
Customer In sighting Conducted Using KJ Method
Evidence
Example
Evidence
KJ Insighiting completion : 30th July’15 Improvement idea generation Start : 1st Aug’14
Example Unmet Need :
Dialogue/ meeting with successful S2R
agents Solution
implemented after need identification : Preparation of roster
of S2R agents with ADMs
3/10/2017

12
2.4.1 How was the correctness of the initial project scope, deliverables, and timings verified? (1/4)
Project scope check
45
TOLL GATE CHECK LIST
Project Timelines
Check
3/10/2017
2.4.1 How were the stakeholders involved and/or communicated within the root cause opportunity phase of the project ? (2/4)
Stakeholder Involvement
46
1.3.1
Stakeholder Groups How Communication Mechanism
• Obtain voice of customers • One on one meetings, SMS, e-mailers
and letters
• Contributed their vision to overcome obstacles when they occurred
• Review the project tollgates
• Resource allocation • Compiled focus with information on
focused objectives • Clear roadblocks with project team
• Review the project tollgates fortnightly
• Contributed ideas for new development
• Brainstorming for the potential reason
• Mentor project team with DMAIC approach
• Weekly team meetings • Publishing MIS and reports
3/10/2017
What stakeholder resistance was identified and /or addressed in this phase of the project ?(3/4)
47
Potential Stakeholder
Impact Allegiance AIH LIH HIH MIH
Management Committee
Customer
Operations Quality Council
Cross Functional
project team
CEO
CGO
CPO
Patient / Attendant
HOD - SE
HOD - IT
HOD - Quality
Sponsor
Champion
Project Leader &
Team
L
H
M
M
M
H
H
H
H
H
H
Follower
Advocates
Indifferent
Follower
Follower
Advocates
Advocates
Advocates
Advocates
Advocates
Blockers
Resistance Encountered
Why Should I continue with Max health Care>
Budget Allocation for system development cost
Adaptability of the team to accept changes in their process How will the change impact the process?
Fear of change & perception of extra work Have we indentified the real cause? Are we equipped enough to bring changes?
3/10/2017
2.4.1 How was the appropriateness of the initial team membership and management routines confirmed?(4/4)
48
60 80
100
Define Measure
78 85
GRPI Score
Define
Measure
Executive Management Team
Senior Leadership Team
Operations Head
Monthly review
Monthly to Fortnightly
Weekly reviews
Management Routine Confirmation GRPI Management
• Persistency Management • Operations & Customer Service • Training • Distribution • Marketing • Information Technology • Finance
HR
Finance
SKILL SET MAPPING + TRAINING+ ENGAGEMENT
3/10/2017

13
49
Section # 3
Solution/ Improvement Development
3/10/2017 50
In addition to the in-house quality support, the team received external training which reinforced the tools & skills needed to perform their roles in the project & achieve the proposed objective
Solution Selection matrix :- Prioritizing the final solutions by examining their relationship with Time, Cost & CTQ Impact.
Benchmarking :- To compare Max Health Care’s processes with
industry bests and best practices from other companies
Brainstorming:- To list and discuss all possible solutions for each of the root cause identified.
Pugh Matrix:- To determine which potential solutions are more important or ‘better’ than others
Value Stream Mapping :- To identify non value added activities and quick practical and long term solutions
Pilot Testing:- To test and revise solutions before full scale
implementation.
How
Tools used
3.1.1 What methods and/or tools were used to identify the possible solution(s)? (1/3) Why were these methods and/or tools selected? (2/3) How was the team prepared to use the methods and/or tools? (3/3)
Generation of possible solutions Prioritization of possible solutions Validation of shortlisted solutions
WHY
3/10/2017
3.1.2 What data was generated and how was the data analyzed to determine the possible solution(s) / improvement(s)? (1/3)
51
Data snapshot
Possible solutions
• Brainstorming
• Best Practice capturing
• Benchmarking
Generation of Possible Solutions
• Multi voting
• Pilot Testing
• Customer feed back
• Core team’s review feedback
Validation of Possible Solutions
Sl No. Causes
1 Customer is not aware of the registration charges
2 Fake currency management policy
3 Complex estimation process
4 Long registration process
5 Manual discount process
6 Bed management is a tedious at the time of admission
7 No Communication process on new updates
8 No MIS on patient expérience
9 Low frequency of data sharing
10 No Dashboard for FO
11 Low focus on functional review
12 No Dissemination of experience score
13 No waiting area
14 No Queue manager
15 Floating counter unavailability
16 No proper staff sitting area and drawers
17 No Cash counting machine
3/10/2017
3. Low on knowledge and soft skill
2. Infrastructure and wait time
52
• New employee on-boaridng training • Technical training for front office employees • Leadership training for supervisors • Service protocol • Common service language
•Token system installation •Cash counting machine installation •Separate counter for Appointment •Separate and dedicated discharge customer •Queue manager
•Process wise SOP creation and roll out • Front office manual creation •Customer communication through electronic and mobile medium •Fake currency management •New Estimation and Bed Management process
Possible Solutions
3.1.2 What are the possible solution(s) / improvement(s)? (2/3)
32 Possible solutions
2.2.2 Issue categorization
1. Process or policy related challenges
3/10/2017

14
5. Governance and Dashboard
4. Low People engagement
53
•Front office dashboard •Front office ranking and unit ranking for competition • Monthly review with Supervisors • Monthly review with Sr. Management team
• Goal sheet creation • Designation revamping • Remuneration benchmarking • Internal Job Posting process rolling out for FO • Front Office Quarterly, Semi Annually and Annual RnR •Performance linked incentive scheme • Front office out door engagement •Friday fun and learning • New JD and Competency and re-engineering hiring process
Possible Solutions
3.1.2 What are the possible solution(s) / improvement(s)? (2/3) (Contd.)
32 Possible solutions
2.2.2
1
• Process or policy related challenges
2
• Infrastructure and wait time
3 • Low on knowledge
and soft skill
4
• Low People engagement
5
• Governance and Dashboard
6 • Technology Support
Issue categorization
6. Technology support
•Automation of discounts •Automatic clean up of master list • New Registration method •Mobile App and Website
3/10/2017
3.1.2 What evidence showed that the solutions(s) / improvement(s) identified were possible instead of final? (3/3)
Each of the 32 solutions were identified through brainstorming exercise (Step
1 Generation of Possible Solutions)
Brainstorming session with project team
Brainstorming session with management team and solution discussion
Customer research to understand what our customers expect
54 3/10/2017
3.2.1 What methods and/or tools were used to identify the final solution(s) / improvement(s)? (1/2
55
3.1.2 Selection Criteria
32 possible solutions CTQ Impact
Project Performance Indicator
Time Impact Time to implement
Cost Impact Cost of Implementation
Ease Simple to Implement
H High Impact
Medium Impact M L Low Impact
H
L
H
M
3/10/2017
3.2.1 How was the team prepared to use the methods and/or tools? Why were these methods and/or tools selected? (2/2)
56
Time Impact
Cost Impact
Ease
Why
Sigma Impact
To meet deadlines
To meet budgets
Implement-tion and
replication
Maximum impact on
CTQ
• Refresher training on
the tools utilization
• Highlighting benefits of these tools in identifying the root cause
• Team meetings and brainstorming sessions
• Analysis of stakeholder matrix
• Expert opinion of
Champion / Sponsor • War room set up where free flow of discussions can happen
3.1.2
3/10/2017
15
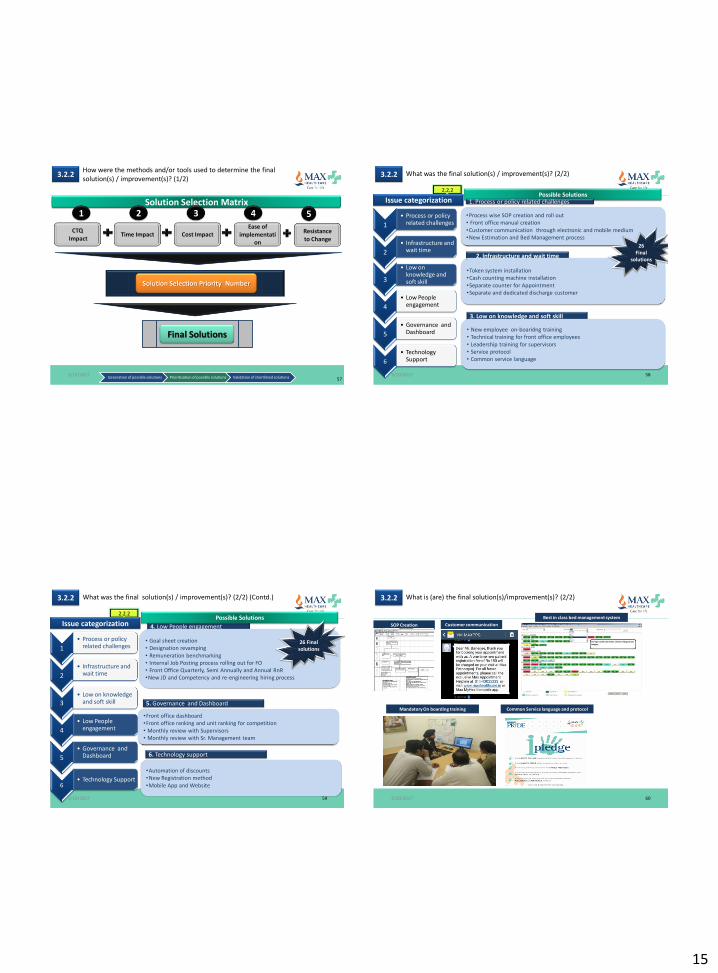
3.2.2 How were the methods and/or tools used to determine the final solution(s) / improvement(s)? (1/2)
57
Solution Selection Priority Number
Final Solutions
Solution Selection Matrix
Generation of possible solutions Prioritization of possible solutions Validation of shortlisted solutions
Time Impact Cost Impact Ease of
implementation
CTQ Impact
1 2 3 4
Resistance to Change
5
3/10/2017
3. Low on knowledge and soft skill
2. Infrastructure and wait time
58
• New employee on-boaridng training • Technical training for front office employees • Leadership training for supervisors • Service protocol • Common service language
•Token system installation •Cash counting machine installation •Separate counter for Appointment •Separate and dedicated discharge customer
•Process wise SOP creation and roll out • Front office manual creation •Customer communication through electronic and mobile medium •New Estimation and Bed Management process
Possible Solutions
3.2.2 What was the final solution(s) / improvement(s)? (2/2)
26 Final
solutions
2.2.2
1
• Process or policy related challenges
2
• Infrastructure and wait time
3
• Low on knowledge and soft skill
4
• Low People engagement
5
• Governance and Dashboard
6
• Technology Support
Issue categorization 1. Process or policy related challenges
3/10/2017
5. Governance and Dashboard
4. Low People engagement
59
•Front office dashboard •Front office ranking and unit ranking for competition • Monthly review with Supervisors • Monthly review with Sr. Management team
• Goal sheet creation • Designation revamping • Remuneration benchmarking • Internal Job Posting process rolling out for FO • Front Office Quarterly, Semi Annually and Annual RnR •New JD and Competency and re-engineering hiring process
Possible Solutions
3.2.2 What was the final solution(s) / improvement(s)? (2/2) (Contd.)
26 Final solutions
2.2.2
1
• Process or policy related challenges
2
• Infrastructure and wait time
3 • Low on knowledge
and soft skill
4
• Low People engagement
5
• Governance and Dashboard
6 • Technology Support
Issue categorization
6. Technology support
•Automation of discounts •New Registration method •Mobile App and Website
3/10/2017 60
3.2.2 What is (are) the final solution(s)/improvement(s)? (2/2)
SOP Creation
Best in class bed management system
Common Service language and protocol Mandatory On boarding training
Customer communication
3/10/2017

16
Potential solutions
Prioritized solutions
Pilot and implement
26Validated Solutions
Multi Voting
Failure Mode Effect
Analysis
Solution selection
matrix
3.2.3 How were the final solution(s)/improvement(s) validated? (1/2)
19 Final Solutions
Final solution validated through pilot testing ( Step 2 Validation / 3.1.2 )
How
Pilot Test
61
Since P value is less than 0.05 Hence the test proves there is a difference and solutions implemented has an impact
Generation of possible solutions Prioritization of possible solutions Validation of shortlisted solutions 3/10/2017
3.2.3 What evidence showed that validation was performed prior to implementation? (2/2)
62 3/10/2017
63
3.2.4
What additional potential benefits were anticipated from the final solution(s)/ improvements? (1/2)
Additional benefits Measure
Process Efficiency
Process efficiency
Revenue
Flagging
Revenue
Soft
Soft
Soft
Customer Retention
Trained staff
Gross revenue
Turn Around Time
Brand impact
EBIDTA
Employee engagement Score
Number of customer in a year (MRD reporting)
No.of Days
Financial reporting (US$)
% within 1 days
Independent Survey
Financial reporting (%)
HR reporting (%)
3/10/2017 64
3.2.4
Were the additional potential benefits anticipated prior to implementation ? (1/2)
Additional benefits Nature of Benefit
Process Efficiency
Process efficiency
Revenue
Flagging
Revenue
Soft
Soft
Soft
Customer Retention
Trained staff
Gross revenue
Turn Around Time
Brand impact
EBIDTA
Employee engagement Score
Anticipated
Anticipated
Anticipated
Anticipated
Anticipated
Not Anticipated
Not Anticipated
3/10/2017
17
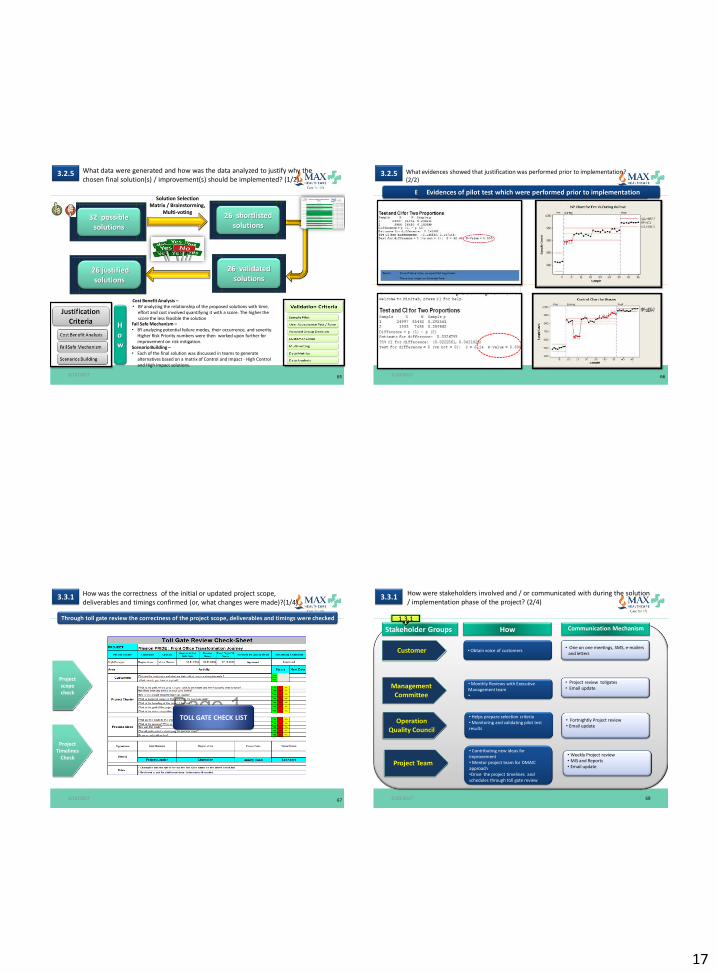
3.2.5 What data were generated and how was the data analyzed to justify why the chosen final solution(s) / improvement(s) should be implemented? (1/2)
32 possible solutions
26 shortlisted solutions
26 justified solutions
26 validated solutions
Solution Selection Matrix / Brainstorming,
Multi-voting
65
Cost Benefit Analysis – • BY analyzing the relationship of the proposed solutions with time,
effort and cost involved quantifying it with a score. The higher the score the less feasible the solution
Fail Safe Mechanism – • BY analyzing potential failure modes, their occurrence, and severity.
Higher Risk Priority numbers were then worked upon further for improvement on risk mitigation.
Scenario Building – • Each of the final solution was discussed in teams to generate
alternatives based on a matrix of Control and Impact - High Control and High Impact solutions.
How
3/10/2017
3.2.5 What evidences showed that justification was performed prior to implementation? (2/2)
66
Evidences of pilot test which were performed prior to implementation Evidences of pilot test which were performed prior to implementation
3/10/2017
3.3.1 How was the correctness of the initial or updated project scope, deliverables and timings confirmed (or, what changes were made)?(1/4)
Through toll gate review the correctness of the project scope, deliverables and timings were checked
67
Project scope check
TOLL GATE CHECK LIST
Project Timelines
Check
3/10/2017
3.3.1 How were stakeholders involved and / or communicated with during the solution / implementation phase of the project? (2/4)
68
Stakeholder Groups How
• Obtain voice of customers
1.3.1
Communication Mechanism
• One on one meetings, SMS, e-mailers and letters
• Monthly Reviews with Executive Management team •
• Project review tollgates • Email update
• Helps prepare selection criteria • Monitoring and validating pilot test results
• Fortnightly Project review • Email update
• Contributing new ideas for improvement • Mentor project team for DMAIC approach •Drive the project timelines and schedules through toll gate review •
• Weekly Project review • MIS and Reports • Email update
3/10/2017

18
3.3.1 What stakeholder resistance was identified and / or addressed in this phase of the project ?(3/4)
69
Stakeholder Groups Resistance
• Why should I visit your hospital again
1.3.1
Action
• Pilot runs to show benefits of policy
Budget allocation for high system development cost
• Benefit realized and costs spent was made part of the regular updates
Adaptability of the teams to accept changes in their respective process
• Team alignment done before initiating the project • Necessary R&Rs put in place for the project
• Fear of change & perception of
extra work. • Are we equipped enough to bring
change
• Tracking mechanism put in place
M
3/10/2017
How was the appropriateness of the initial or updated team membership and management routines confirmed? (or, what changes were made) (4/4)
3.3.1
70
Management routine confirmation
GRPI Management SKILL SET MAPPING + TRAINING+ ENGAGEMENT
Persistency Management Operations and Customer Service Training Distribution Marketing Information Technology Finance Legal Actuaries
Executive Management Team
Senior Leadership Team
Operations Head
Monthly review
Monthly to Fortnightly
Weekly reviews
3/10/2017
71
Section # 4
Implementation and Results Verification
3/10/2017
4.1.1 How were stakeholders involved in planning the solution / improvement implementation? (1/2)
72
How
• Listening to customers through our listening posts • Affirmative response to the process change
• Review and approval of strategic decisions • Continuous review of progress made on solution implementation • Driving Change management
• Providing expert advice • Facilitating cross functional group discussions and resolving inter-linkage issues • Review progress and monitoring of results
• PLAN-DO-CHECK-ACT • Improvise processes to deliver accurate results • Implementation of solutions • Internally review project progress weekly • Business analytics and validating improvement actions
•Head Service Excellence & Customer Operation •Head Information Technology •Head Quality
Project Sponsor Project Champion Project Leader Project Mentor ( Black Belt) Team Members from Front office team, IT, HR, Support service heads, Transformation office, Quality, Training
Patients Attendants
Stake holder groups
Designations
•MD & CEO Officer •Chief Growth Officer • Chief People Officer •Chief Financial Officer •Director Operation
3/10/2017
19
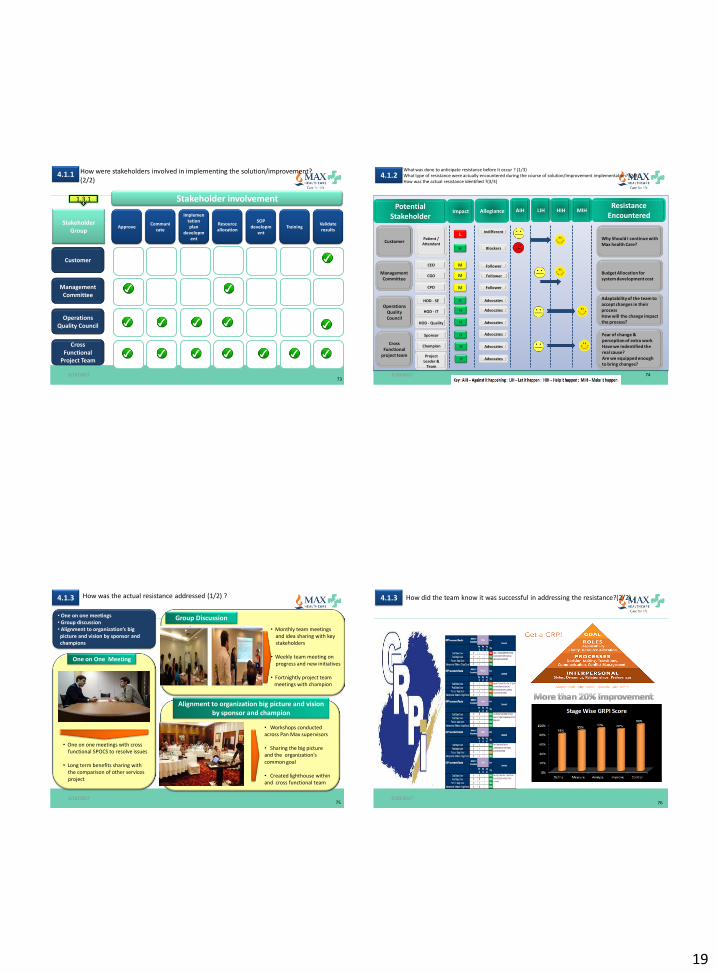
4.1.1 How were stakeholders involved in implementing the solution/improvement? (2/2)
Stakeholder involvement
Approve
Implementation plan
development
Resource allocation
SOP developm
ent Training
Validate results
Communicate
73
1.3.1
Stakeholder Group
Customer
Management Committee
Operations Quality Council
Cross Functional
Project Team
3/10/2017
Potential Stakeholder
Impact Allegiance AIH LIH HIH MIH
L
H
M
M
M
H
H
H
H
H
H
Follower
Advocates
Indifferent
Follower
Follower
Advocates
Advocates
Advocates
Advocates
Advocates
Blockers
Resistance Encountered
4.1.2 What was done to anticipate resistance before it occur ? (1/3) What type of resistance were actually encountered during the course of solution/Improvement implementation? (2/3) How was the actual resistance identified ?(3/3)
Why Should I continue with Max health Care?
Budget Allocation for system development cost
Adaptability of the team to accept changes in their process How will the change impact the process?
Fear of change & perception of extra work Have we indentified the real cause? Are we equipped enough to bring changes?
Management Committee
Customer
Operations Quality Council
Cross Functional
project team
CEO
CGO
CPO
Patient / Attendant
HOD - SE
HOD - IT
HOD - Quality
Sponsor
Champion
Project Leader &
Team
74 3/10/2017
4.1.3 How was the actual resistance addressed (1/2) ??(2/2)
o Resistance to possible changes in process.
o Built Customer Centric Culture Across the Organization.
o Distribution Alignment With Organizational Long Term Objectives
o One On One Meetings with Customers to Explain Benefits and Features of the Policy.
o Long Term Benefits Sharing with the comparison of other financial projects available.
• One on one meetings • Group discussion • Alignment to organization’s big picture and vision by sponsor and champions
One on One Meeting
Group Discussion
• One on one meetings with cross functional SPOCS to resolve issues • Long term benefits sharing with the comparison of other services project
• Monthly team meetings and idea sharing with key stakeholders • Weekly team meeting on progress and new initiatives • Fortnightly project team meetings with champion
Alignment to organization big picture and vision by sponsor and champion
• Workshops conducted across Pan Max supervisors • Sharing the big picture and the organization’s common goal • Created lighthouse within and cross functional team
75 3/10/2017
4.1.3 How did the team know it was successful in addressing the resistance?(2/2)
76 3/10/2017

20
4.1.4 What was the evidence of stakeholder buy in ?(1/2)
77
•MD & CEO Officer •Chief Growth Officer • Chief People Officer •Chief Financial Officer •Director Operation
•Head Service Excellence & Customer Operation •Head Information Technology •Head Quality
Project Sponsor Project Champion Project Leader Project Mentor ( Black Belt) Team Members from Front office team, IT, HR, Support service heads, Transformation office, Quality, Training
Who Stakeholder Groups
Patients Attendants
M
Degree of buy in High Acceptance - Accepts the Change - Does not accept the change
• Obtaining customer voice
• By obtaining approval at every stage
• By involving them in pilot and acceptance testing
• By involving them in development and implementation of solutions
• Developing and implementing the solutions
H
H
H
H M L
Acceptance Acceptance Assurance
3/10/2017
4.1.4 What evidence showed that buy-in was obtained prior to implementation(2/2))
78
Leader’s message on Service
Launch e-mail
Chairman’s message on Service Excellence
3/10/2017
79
• New Front Office competency based interview, JD created for hiring, IJP policy redesigned • New Designation and growth path created for FO • Goal sheet created and yearly/quarterly RnR launched • Performance linked incentive scheme created and rolled out • Hiring bench created for quick replacement
• Queue management – token system rolled • Fake currency management process rolled out • Emergency grace period process rolled out • Grooming and disciplinary process rolled out • Service protocol and pledge rolled out
Gap Area
Process reengineering
People
• New on-boarding training program for new joinees started (for 5 days) • Technical training, certification and promotion licked training program launched • Mindset , motivational and supervisor training done • Critical situation handling training done a
People Skilling
• New patient registration module created • New estimation module created • New bed-management module created • On the spot customer feedback capturing started through tab and sms
Technology
• Front office dashboard created with unit level and Front office head level ranking • Daily MIS at unit and supervisor level created • Attrition and engagement survey done
Dashboard
Solution Implemented
H
H
H
Impact
H
M
High Impact Medium Impact Low Impact H M L
4.2.1 What process(es) or system(s) were changed or created to implement the solution / improvement? (1/2)
3/10/2017
New estimation module rolled out after making technology and process changes
Automatic logic based Estimation
module
4.2.1 What systems were changed or created to measure and manage the performance of the implementation? (2/2)
80 3/10/2017

21
4.2.1 What systems were changed or created to measure and manage the performance of the implementation? (2/2) contd..
New registration module rolled out with only mandatory field . Field reduced from 26 to 9 mandatory fields only
81 3/10/2017
4.2.1 What systems were changed or created to measure and manage the performance of the implementation? (2/2) contd….
82 3/10/2017
4.2.1 What systems were changed or created to measure and manage the performance of the implementation? (2/2) contd….
New bed management module created - which shows the cockpit view of complete hospital and assignment of bed, patient details
83 3/10/2017
4.2.1 What systems were changed or created to measure and manage the performance of the implementation? (2/2) contd….
Web based Customer
Satisfaction Scores started
84 3/10/2017

22
35%
46% 47% 50% 51%
FY15 Q1 FY16 Q2 FY16 Q3 FY16 Q4 FY16
Customer Exprience Score
Customer Experience Score (IMRB) - Trend
4.3.1 What were the results? How did the results compare to the specific project goals/measures from Item (2.1.1)?(1/4)
CTQ 1 : Customer Experience Score. Target : 50% T2B-B2B
85
During Project Post Project Pre Project
3/10/2017
2.56
2.07
1.30 1.07
0.81
FY15 Q1 FY16 Q2 FY16 Q3 FY16 Q4 FY16
Customer Issues
Customer Complaint Incident rate per thousand - Trend
86
4.3.1 What were the results? ( Contd..) How did the results compare to the specific project goals/measures from Item (2.1.1)?(2/4)
CTQ 2 : Customer complaint incident rate (per thousand). Target 10% improvement from baseline of 2.56
During Project Post Project Pre Project
3/10/2017
50%
41% 46%
31% 35%
FY15 Q1 FY16 Q2 FY16 Q3 FY16 Q4 FY16
Front office Employee Attrition
Front office Employee Attrition Rate (trend)
87
4.3.1 What were the results? ( Contd..) How did the results compare to the specific project goals/measures from Item (2.1.1)?(3/4)
CTQ 3 : Front office Employee Attrition Rate. . Target : 40%
During Project Post Project Pre Project
3/10/2017
4.3.1 What were the results? How did the results compare to the specific project goals/measures from Item (2.1.1)?(4/4)
88
Health Care Summit and Award : Best in Patient Experience
Best healthcare Brand : Best in Class
Special Category award in Customer Category Project : Max Group of companies
3/10/2017
23
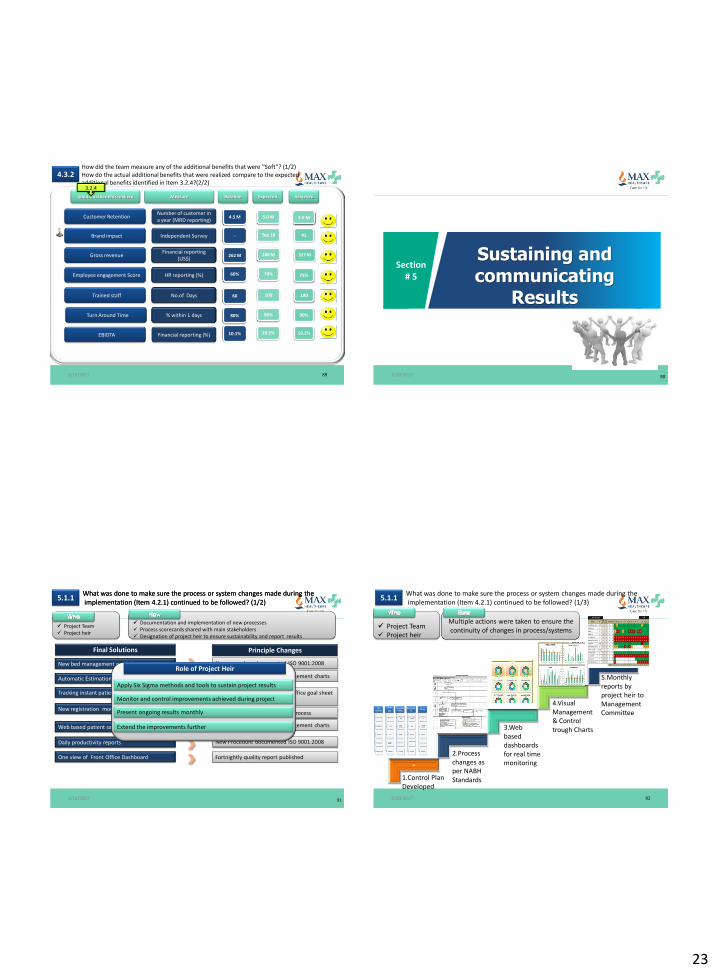
89
4.3.2 How did the team measure any of the additional benefits that were "Soft”? (1/2) How do the actual additional benefits that were realized compare to the expected additional benefits identified in Item 3.2.4?(2/2)
Additional benefits realized Measure Baseline Expected Achieved
4.5 M 5.0 M
Top 10 #1
70% 75%
3.2.4
Customer Retention
Trained staff
Gross revenue
Turn Around Time
Number of customer in a year (MRD reporting)
No.of Days
Financial reporting (US$)
Brand impact
% within 1 days
Independent Survey
EBIDTA Financial reporting (%)
Employee engagement Score HR reporting (%)
5.5 M
-
60%
300 M 327 M 262 M
100 180 60
10.2% 10.2% 10.1%
90% 90% 80%
3/10/2017 90
Section # 5
Sustaining and communicating
Results
3/10/2017
5.1.1 What was done to make sure the process or system changes made during the implementation (Item 4.2.1) continued to be followed? (1/2)
5.1.1 What was done to make sure the process or system changes made during the implementation (Item 4.2.1) continued to be followed? (1/2)
91
Project Team Project heir
Documentation and implementation of new processes Process scorecards shared with main stakeholders Designation of project heir to ensure sustainability and report results
Final Solutions
New bed management module
Automatic Estimation Tagging Module
Tracking instant patient feedbacks through
New registration module
Web based patient satisfaction scores
Daily productivity reports
Principle Changes
One view of Front Office Dashboard
New procedure documented ISO 9001:2008
Key indicators included in management charts
Key Metric introduced in front office goal sheet across all levels
Established procedure for new process
Key indicators included in management charts
New Procedure documented ISO 9001:2008
Fortnightly quality report published
Role of Project Heir
Apply Six Sigma methods and tools to sustain project results
Monitor and control improvements achieved during project
Present ongoing results monthly
Extend the improvements further
3/10/2017
z
1.Control Plan Developed
2.Process changes as per NABH Standards
3.Web based dashboards for real time monitoring
4.Visual Management & Control trough Charts
5.Monthly reports by project heir to Management Committee
Project Team Project heir
Multiple actions were taken to ensure the continuity of changes in process/systems
5.1.1 What was done to make sure the process or system changes made during the implementation (Item 4.2.1) continued to be followed? (1/3)
92 3/10/2017

24
5.1.1 What evidence showed that this became part of the organization’s culture /operating strategy ? (2/2)
93
It became organization’s culture
How it became the organization's culture?
• Process circulars through a centralized process control unit • Documenting of processes • ISO certification of processes • New letter • Sharing best practice on knowledge portal “Max Spirit”
3/10/2017
Project Team Project heir
Dash Boards & Control Charts
5.1.2 What was done to make sure the benefits obtained from the implementation (Item 4.2.1) were maintained?(1/2)
Measurement & Control system designed for the projects
Process/System Changes 4.2.1
Dashboards & Control charts
Customer Issues
Attrition
Customer experience
Process Efficiencies
Regular reinforcement leader’s message and email campaigns
94 3/10/2017
95
5.1.2 What evidence showed that this became part of the organization’s culture/ Operating strategy?(2/2)
3/10/2017
Meeting with Teams Project closing meeting with cross functional project team
Meeting with Stakeholders Meeting with operations quality council to share the
results & introduce the project heir
Formal project Closure Closing presentation to operations quality council &
management committee
Updating all employees Publication through internal communication channels ( Emails, Intranet, News Letters , Posters and Standees)
Communicate !! Communicate !! Communicate!!
5.2.1 How did the team communicate the results to the various stakeholder group?
96 3/10/2017
25
97
Key Message
3/10/2017
Thank You !!
98 3/10/2017