south africa citrus semi-annual report gain publications/citrus semi... · south africa`s...
TRANSCRIPT
THIS REPORT CONTAINS ASSESSMENTS OF COMMODITY AND TRADE ISSUES MADE BY
USDA STAFF AND NOT NECESSARILY STATEMENTS OF OFFICIAL U.S. GOVERNMENT
POLICY
Date:
GAIN Report Number:
Approved By:
Prepared By:
Report Highlights:
South Africa`s production of grapefruit, oranges and lemons/limes is estimated to increase in the
2017/18 MY, based on the growth in area planted and on the normal weather conditions in the main
growing regions of Limpopo, Eastern Cape and Mpumalanga. The drought conditions in the Western
Cape are expected to result in a decrease in the production of tangerines/mandarins. However, duty free
exports of tangerines/mandarins to the United States under the African Growth Opportunity Act
(AGOA) are expected to continue their strong annual growth.
Wellington Sikuka
Kyle Bonsu
Strong Growth of South African Soft Citrus Exports to the
United States Continues
Citrus Semi-annual
South Africa - Republic of
6/20/2018
Required Report - public distribution

Page 2
Commodities:
Exchange rate: Rand/US$ Exchange = 13
Marketing Year (MY) – January to December
MT – Metric Tons
Executive Summary
Post estimates that the production of grapefruit will increase by 5 percent to 370,000 MT in the 2017/18
MY, due to the rise in area plated and on the normal weather conditions in the main growing regions of
Limpopo and Mpumalanga. Grapefruit exports are estimated to increase by 4 percent to 240,000 MT in
the 2017/18 MY, based on the increase in production, strong demand in Asia and some countries in the
European Union, and the year to date exports up to April 2018.
The production of oranges is estimated to increase by 8 percent to 1.47 Million MT in the 2017/18 MY,
due to normal rainfall, and an increase in area planted in the main growing regions of Limpopo, Eastern
Cape and Mpumalanga, which account for about 82 percent of the total orange production. Exports of
oranges are estimated to increase by 4 percent to 1.22 Million MT in the 2017/18 MY, based on the
increase in production, growth in demand from China and Hong Kong, and South Africa`s successful
efforts in addressing the Citrus Black Spot (CBS) challenges in the EU market.
The production of tangerines/mandarins is estimated to decrease by 2 percent to 255,000 MT in the
2017/18 MY, mainly due to the impact of the drought which resulted in lower yields in the predominant
production region of the Western Cape. The South African 2017/18 MY exports of
tangerines/mandarins is estimated to increase by 5 percent to 220,000 MT, based on the industry
strategy of prioritizing export markets over domestic markets and the strong demand for soft citrus in
global markets.
The production of lemons/limes is estimated to increase by 7 percent to 460,000 MT in the 2017/18 MY,
due to the increase in area planted, new orchards coming full production, normal weather conditions in
the main production areas of Eastern Cape and Limpopo, which account for about 80 percent of the
production. The exports of lemons and limes is estimated to increase by 7 percent to 320,000 MT in the
2017/18 MY, based on the increase in production and growth in demand from the Middle East and
Asian markets.
Orange Juice
Lemons, Fresh
Tangerines/Mandarins, Fresh
Oranges, Fresh
Grapefruit, Fresh
Citrus, Other, Fresh

Page 3
Background
Citrus in South Africa is grown across the country mainly in the Limpopo, Eastern Cape, Western Cape,
Mpumalanga, Kwa Zulu Natal, Northern Cape and North West provinces. Figure 1 below shows the
map of the citrus growing areas in South Africa. A total of 74,902 hectares was planted to citrus in
South Africa in the 2016/17 MY. The Limpopo province is the largest citrus production area accounting
for 43 percent of the total area planted, followed by the Eastern Cape (27 percent), Western Cape (17
percent), Mpumalanga (8 percent), Kwa Zulu Natal (2 percent), Northern Cape (2 percent), and North
West (less than 1 percent). The Western Cape and Eastern Cape have a cooler climate, which is suited
for the production of the navel oranges, lemons, limes, and mandarins/tangarines (soft citrus). The
Mpumalanga, Limpopo and KwaZulu-Natal provinces have a warmer climate which is better suited to
the production of grapefruit and valencia oranges.
Figure 1: Citrus Growing Areas in South Africa.
Source: Citrus Growers Association (CGA)
Figure 2 shows that while oranges are the biggest citrus type produced in South Africa and account for
about 58 percent of the total citrus area planted, there has been notable growth in the area planted to soft
citrus and lemons/limes.
Figure 2: Area Planted by Citrus Type

Page 4
Source: CGA
Table 1 shows the most common citrus varieties planted in South Africa. In 2016, the tango citrus
variety, which was developed by the University of California Riverside, was granted the plant breeders
right in South Africa and is expected to offer competition to the Nardocott variety.
Table 1: Citrus Varieties
Citrus Variety
Grape fruit Star Ruby, Marsh, Rose, Flame, Nelspruit Ruby (Nelruby), Flamingo
Oranges Valencias - Delta, Midknight, Turkey (Juvalle), Oukloon (Olinda, Late), Du Roi,
Benny.
Navels - Palmer, Bahianinha, Washington, Robyn, Navelina, Lane Late, Newhall,
Cambria, Cara Cara, Rustenburg, Autumn Gold
Mandarins/
Tangarines
Clementine - Nules, Marisol, SRA, Oroval, Esbal, Clemenpons, Oronules.
Mandarin – Tango, Nadorcott (Afourer), Nova, Or (Orri), Minneola, Mor ,
B17, Tambor , Naartjie, Thoro Temple, Sonet, B24 (African Sunset)
Satsuma - Miho Wase, Owari, Kuno, Miyagawa Wase, Okitsu Wase, Aoshima.
Lemons/Lime Eureka, Eureka SL, Lisbon, Limoneira, Genoa
Source: CGA
Table 2: South Africa Harvest Period for Citrus
Citrus Harvest Period
Marsh Grapefruit April to June
Star Ruby Grapefruit April to September
Navel Oranges June to July
Valencia Oranges July to September
Mandarins/Tangarines July to August
Lemons/Lime July to September
Source: CGA

Page 5
Grapefruit, Fresh
Production
Post estimates that the production of grapefruit will increase by 5 percent to 370,000 MT in the 2017/18
MY, from 354,000 MT in the 2016/17 MY. This is due to the rise in area planted and on the normal
weather conditions in the main growing regions of Limpopo and Mpumalanga. The increase was
partially offset by hail damage in the Mpumalanga region. The 2016/17 MY production of grapefruit
was revised downward based on final industry data. Limpopo is the leading growing region for
grapefruit accounting for at least 59 percent of the total production, followed by Mpumalanga (22
percent), Kwa-Zulu Natal (10 percent), Northern Cape (6 percent) and the Western Cape (less than 1
percent). The predominant variety produced is the Star Ruby accounting for 84 percent of the
production due to its high global demand, followed by the Marsh variety at 13 percent. Other grapefruit
varieties produced in small volumes include Rose, Redheart, Pomelit, Ja Shaddock, Flame, and Fe
1(Jackson).
Figure 3 below illustrates that the area planted to grapefruit is estimated to increase by 7 percent to
7,900 ha in the 2017/18 MY, from 7,393 ha in the 2016/17 MY. This is due to the industry responding
to the increasing global market demand and prices for grapefruit in the past two seasons.
Figure 3: Area Planted to Grapefruit
*Estimate.
Source: CGA
Consumption
Post estimates that grapefruit consumption in South Africa will rise to 7,000 MT in the 2017/18 MY,
from 6,000 MT in the 2016/17 MY. This is due to the increase in production, and to the growth in
demand driven by the perceived health benefits or trend of grapefruit in the domestic market. The fresh
Page 6
grapefruit per capita consumption in South Africa is still relatively low at below 1 kg per annum because
the majority of the population has not acquired the taste for grapefruit.
Processing
Post estimates that the grapefruit delivered for processing will increase by 8 percent to 127,000 MT in
the 2017/18 MY, from 118,000 MT in the 2016/17 MY, based on the increase in production. The
2016/17 MY grapefruit delivered for processing was revised downwards based on the lower production
and updated industry figures. Grapefruit is processed to juice, the majority of which is exported to
Europe. The left-over pulp following commercial juice extraction is an important source of grapefruit
oil which is used as a flavoring agent in many soft drinks. The inner peel is a source of pectin and citric
acid, which are both used by the food industry to preserve fruits, jams, and marmalades. Naringin is
also extracted from grapefruit peel, and gives tonic-water its distinctive bitter flavor. The grapefruit peel
oil is used in scented fragrances.
Exports
Post estimates that grapefruit exports will increase by 4 percent to 240,000 MT in the 2017/18 MY, from
230,663 MT in the 2016/17 MY. This is due to the increase in production, strong demand in global
markets especially Asia and some countries in the European Union, and the year to date exports up to
April 2018. The 2016/17 MY exports of grapefruit were slightly revised downward based on final
Global Trade Atlas figures.
Although South Africa has a free trade agreement with the Europe Union which allows duty free access
for its citrus exports, it continues to face challenges due to Citrus Black Spot (CBS) in the European
Union (EU) market. In October 2017, South Africa suspended its exports of grapefruit to Europe in
order to minimize the risks of further CBS interceptions which could have jeopardized South Africa’s
market access to the European Union. Industry estimates that it is costing South Africa almost R1
Billion (US$77 Million) to address and comply with the CBS requirements in the EU market. There is
also a growing emphasis to increase exports to the Middle East and Africa markets. While total volumes
are still low, grapefruit exports to the United States have been growing exponentially by an average of
65% per annum in the past five years, from 76 MT in the 2012/13 MY, to 4,293 MT in the 2016/17 MY.
Grapefruit exports to the United States are expected to continue growing based on the continuation of
duty free access through the African Growth and Opportunity Act (AGOA).
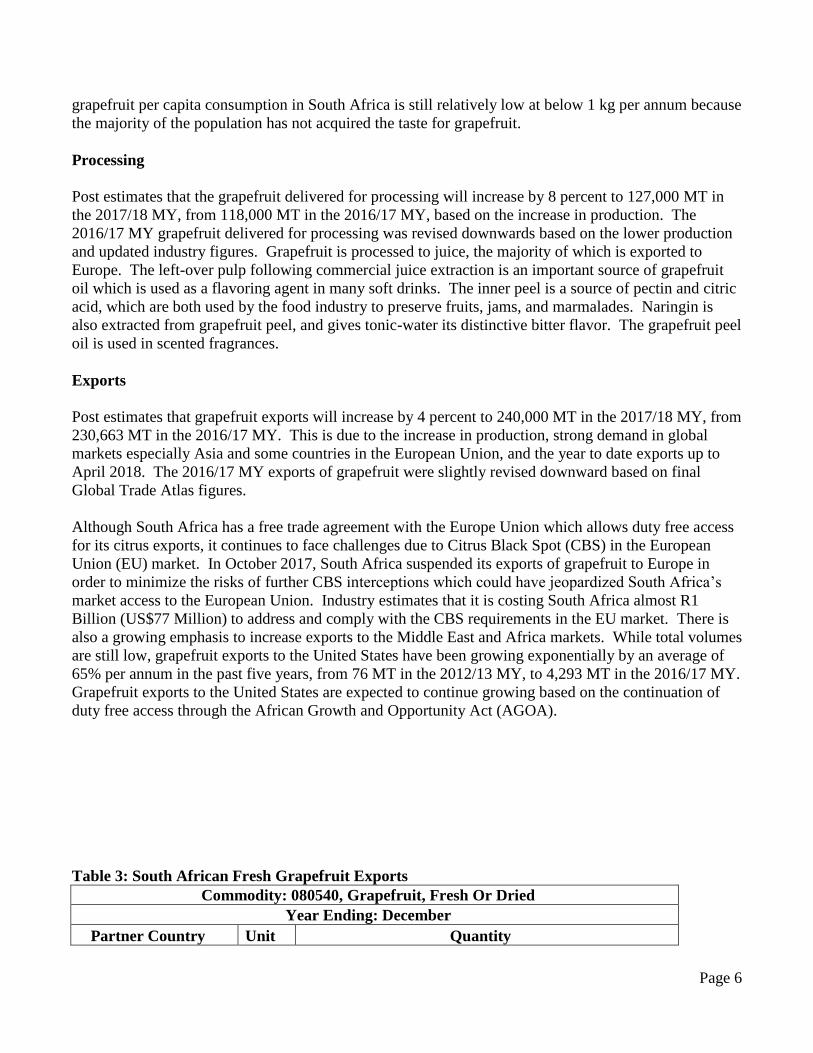
Table 3: South African Fresh Grapefruit Exports
Commodity: 080540, Grapefruit, Fresh Or Dried
Year Ending: December
Partner Country Unit Quantity

Page 7
2014 2015 2016 2017 2018*
World MT 217,194 220,262 202,501 230,663 9,429
Netherlands MT 49,169 53,256 59,220 63,870 4,720
Japan MT 48,222 44,802 31,155 39,505 26
China MT 14,029 19,971 17,462 20,254 297
Russia MT 18,008 18,020 15,835 19,215 387
United Kingdom MT 9,812 11,415 9,946 11,990 472
Korea South MT 5,928 9,032 9,738 10,532 73
Italy MT 10,073 11,976 9,365 9,532 1,010
Hong Kong MT 4,517 5,034 5,850 7,266 771
Canada MT 8,783 7,126 5,022 6,658 67
Portugal MT 2,979 4,367 6,008 6,232 97
Swaziland MT 15,908 3,576 3,228 4,462 31
United States MT 1,052 1,803 3,736 4,293 0
United Arab Emirates MT 4,807 4,625 4,239 3,966 595
Taiwan MT 3,350 2,802 2,012 3,344 89
France MT 4,198 5,816 3,183 3,251 0
Germany MT 1,378 1,819 5,015 2,386 26
Ukraine MT 1,268 1,123 1,016 1,494 0
Greece MT 1,116 1,318 1,127 1,326 113
Vietnam MT 411 69 431 919 65
Sweden MT 530 888 767 872 0
Bulgaria MT 336 754 534 830 0
Kuwait MT 335 816 321 774 0
Lithuania MT 821 1,011 877 773 22
Singapore MT 834 988 824 765 93
*Exports up to April 2018.
Source: Global Trade Atlas (GTA)
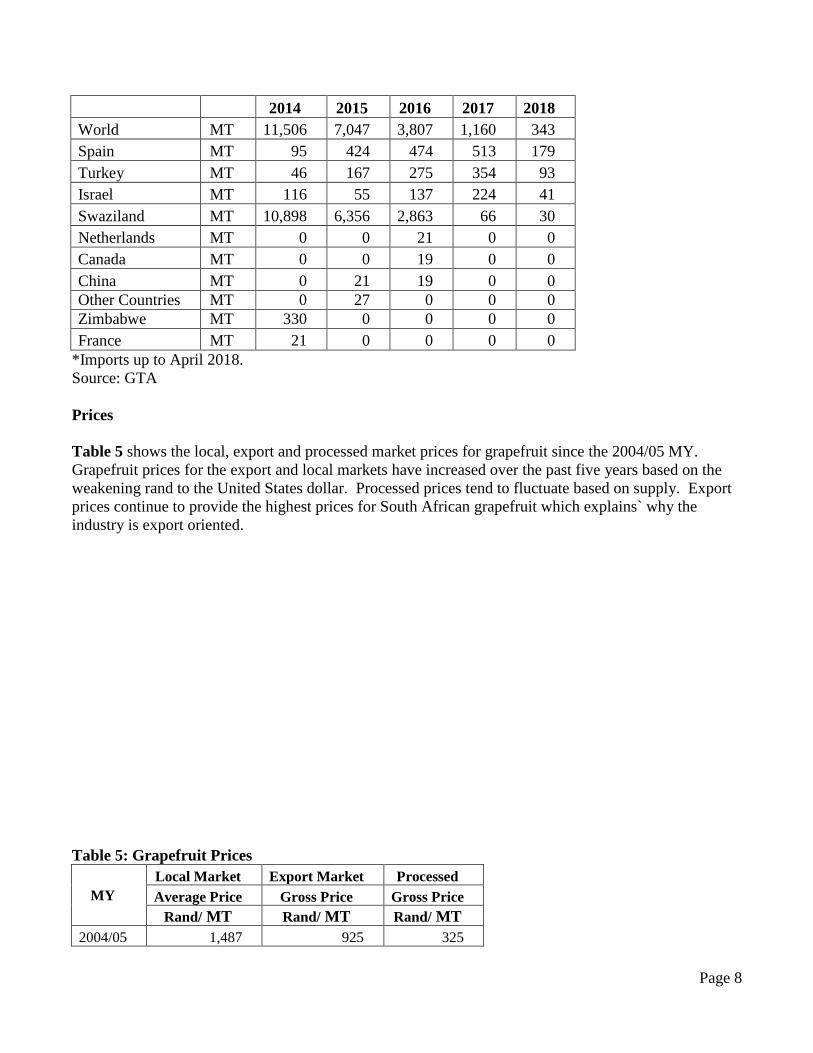
Imports
South Africa is not a major importer of grapefruit. Imports mainly originate from Swaziland, Spain,
Turkey and Israel to fill the small demand gap towards the end of the season. The increase in local
production over the past five years has resulted in a steady decline in grapefruit imports.
Table 4: South African Fresh Grapefruit Imports
South Africa Import Statistics
Commodity: 080540, Grapefruit, Fresh Or Dried
Year Ending: December
Partner Country Unit Quantity
Page 8
2014 2015 2016 2017 2018
World MT 11,506 7,047 3,807 1,160 343
Spain MT 95 424 474 513 179
Turkey MT 46 167 275 354 93
Israel MT 116 55 137 224 41
Swaziland MT 10,898 6,356 2,863 66 30
Netherlands MT 0 0 21 0 0
Canada MT 0 0 19 0 0
China MT 0 21 19 0 0
Other Countries MT 0 27 0 0 0
Zimbabwe MT 330 0 0 0 0
France MT 21 0 0 0 0
*Imports up to April 2018.
Source: GTA
Prices
Table 5 shows the local, export and processed market prices for grapefruit since the 2004/05 MY.
Grapefruit prices for the export and local markets have increased over the past five years based on the
weakening rand to the United States dollar. Processed prices tend to fluctuate based on supply. Export
prices continue to provide the highest prices for South African grapefruit which explains` why the
industry is export oriented.
Table 5: Grapefruit Prices
MY
Local Market Export Market Processed
Average Price Gross Price Gross Price
Rand/ MT Rand/ MT Rand/ MT
2004/05 1,487 925 325
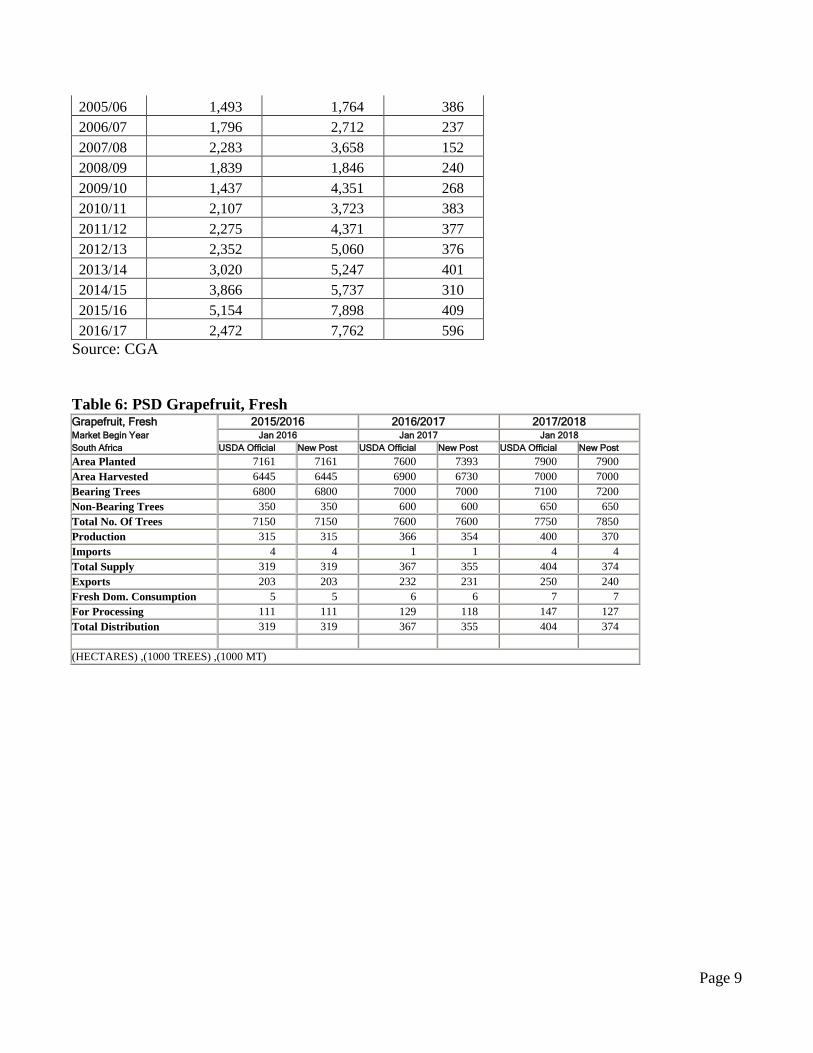
Page 9
2005/06 1,493 1,764 386
2006/07 1,796 2,712 237
2007/08 2,283 3,658 152
2008/09 1,839 1,846 240
2009/10 1,437 4,351 268
2010/11 2,107 3,723 383
2011/12 2,275 4,371 377
2012/13 2,352 5,060 376
2013/14 3,020 5,247 401
2014/15 3,866 5,737 310
2015/16 5,154 7,898 409
2016/17 2,472 7,762 596
Source: CGA
Table 6: PSD Grapefruit, Fresh Grapefruit, Fresh 2015/2016 2016/2017 2017/2018 Market Begin Year Jan 2016 Jan 2017 Jan 2018
South Africa USDA Official New Post USDA Official New Post USDA Official New Post
Area Planted 7161 7161 7600 7393 7900 7900
Area Harvested 6445 6445 6900 6730 7000 7000
Bearing Trees 6800 6800 7000 7000 7100 7200
Non-Bearing Trees 350 350 600 600 650 650
Total No. Of Trees 7150 7150 7600 7600 7750 7850
Production 315 315 366 354 400 370
Imports 4 4 1 1 4 4
Total Supply 319 319 367 355 404 374
Exports 203 203 232 231 250 240
Fresh Dom. Consumption 5 5 6 6 7 7
For Processing 111 111 129 118 147 127
Total Distribution 319 319 367 355 404 374
(HECTARES) ,(1000 TREES) ,(1000 MT)

Page 10
Oranges, Fresh
Production
The production of oranges is estimated to increase by 8 percent to 1.47 Million MT in the 2017/18 MY,
from about 1.36 Million MT in the 2016/17 MY. This is due to normal rainfall, and an increase in area
planted in the main growing regions of Limpopo, Eastern Cape and Mpumalanga, which account for
about 82 percent of the total orange production. These increases were partially offset by hail damage in
the Mpumalanga region and the drought conditions in the Western Cape growing region. The Western
Cape accounts for about 15 percent of the total orange production, and is undergoing a severe drought.
As a result, dam levels are less than 30 percent in the 2017/18 MY.
The area planted with oranges is estimated to grow marginally by about 3 percent to 44,000 hectares
(ha) in the 2017/18 MY, from 42,711 hectares (ha) in the 2016/17 MY, based on the increases in area
planted to seedless orange varieties, especially in the Limpopo region. This rise was partially offset by
the industry shift from orange production to soft citrus in the Western Cape. Valencia’s account for
about 61 percent of the total area planted to oranges, and navels account for 39 percent. Figure 4 below
shows the trend in the area planted to oranges since 2007.
Figure 4: Area Planted to Oranges
*Estimate.
Source: CGA
Consumption
Post estimates that the 2017/18 MY consumption of oranges will increase by 1 percent to 72,000 MT,
from 71,000 MT in the 2016/17 MY, based on the growth in production. Fresh oranges are the most
popular citrus consumed in South Africa with a per capita consumption of about 1.5 kg per annum.

Page 11
Exports
The export of oranges is estimated to increase by 4 percent to 1.22 Million MT in the 2017/18 MY, from
1.17 Million MT in the 2016/17 MY, based on the increase in production, growth in demand from China
and Hong Kong, and South Africa`s successful efforts in addressing the CBS challenges in the EU
market. South Africa prioritizes supplying export markets, and the surplus oranges are supplied to the
domestic fresh and processed markets. The EU remains South Africa’s largest export market for
oranges, accounting for approximately 40 percent of the total export market. However, exports to Asia
and the Middle East have grown steadily over the years due to the focus being placed by industry in
growing these markets. Exports to the United States are expected to continue growing based on the duty
free access under the African Growth and Opportunity Act (AGOA). A gradual shift from oranges to
soft citrus exports is expected, as South African farmers supplying the United States market have been
switching their orchards from oranges to soft citrus in response to market preferences and the higher
premium received in the United States market.
Table 7: South African Fresh Orange Exports
South Africa Export Statistics
Commodity: 080510, Oranges, Fresh
Year Ending: December
Partner Country Unit
Quantity
2014 2015 2016 2017 2018*
World MT 1,142,642 1,159,430 1,063,855 1,170,575 3,649
Netherlands MT 206,059 231,979 221,672 258,478 24
United Arab Emirates MT 120,911 116,097 99,483 86,155 277
Saudi Arabia MT 92,796 86,906 93,219 81,541 95
Russia MT 126,192 89,439 68,247 79,242 276
China MT 33,998 44,269 48,643 78,291 0
United Kingdom MT 66,546 67,296 60,153 73,361 28
Hong Kong MT 34,556 43,448 49,893 69,031 3
Portugal MT 39,918 54,840 57,873 67,515 0
Bangladesh MT 39,999 38,861 32,603 45,517 0
United States MT 39,225 44,721 40,416 39,837 0
Italy MT 36,151 36,362 33,518 38,038 0
Canada MT 33,943 37,875 32,507 31,857 51
Malaysia MT 28,581 28,214 28,936 28,211 0
Kuwait MT 51,347 47,246 25,943 23,238 0
Singapore MT 12,294 11,335 9,083 12,475 0
India MT 4,721 11,128 4,266 11,474 0
Oman MT 8,186 7,511 5,266 11,247 0
Germany MT 4,070 3,556 10,796 10,705 2
Qatar MT 6,963 6,713 4,123 8,916 0
Bahrain MT 4,062 4,614 4,810 8,833 0
France MT 17,841 25,589 16,949 6,728 0
Page 12
Sweden MT 4,908 7,008 7,046 6,496 0
Mozambique MT 6,832 11,318 4,487 5,340 277
*Exports up to April 2018
Source: GTA
Imports
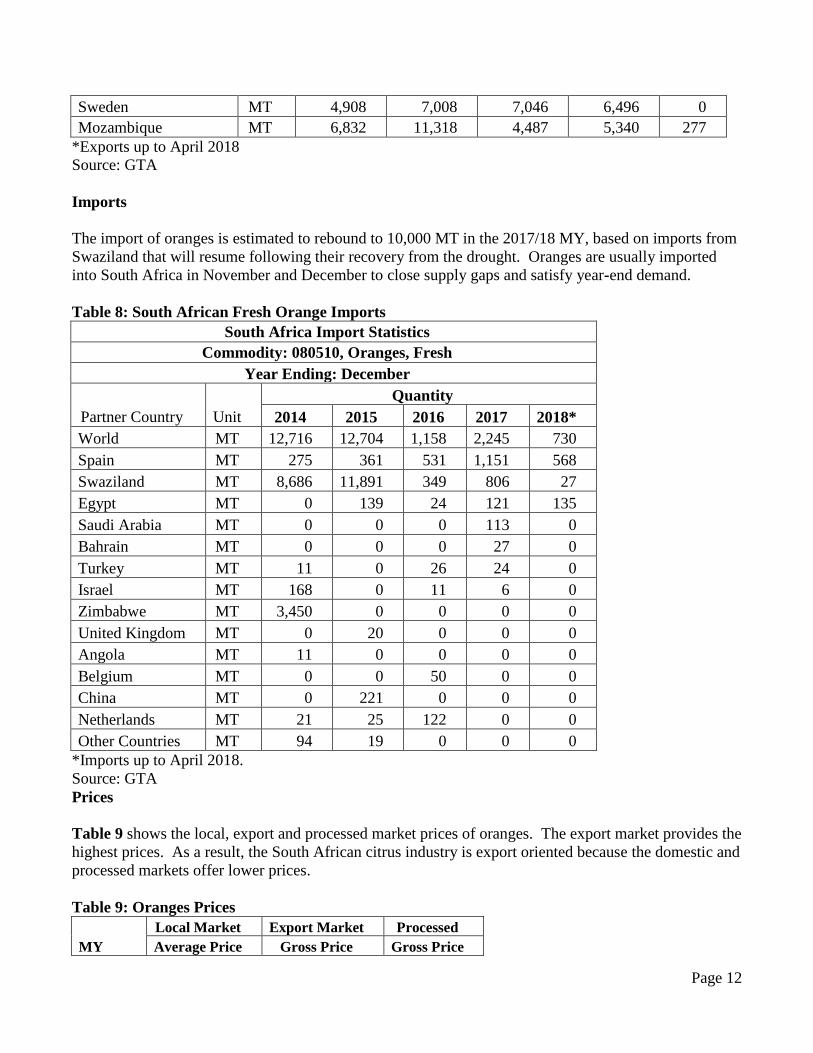
The import of oranges is estimated to rebound to 10,000 MT in the 2017/18 MY, based on imports from
Swaziland that will resume following their recovery from the drought. Oranges are usually imported
into South Africa in November and December to close supply gaps and satisfy year-end demand.
Table 8: South African Fresh Orange Imports
South Africa Import Statistics
Commodity: 080510, Oranges, Fresh
Year Ending: December
Partner Country Unit
Quantity
2014 2015 2016 2017 2018*
World MT 12,716 12,704 1,158 2,245 730
Spain MT 275 361 531 1,151 568
Swaziland MT 8,686 11,891 349 806 27
Egypt MT 0 139 24 121 135
Saudi Arabia MT 0 0 0 113 0
Bahrain MT 0 0 0 27 0
Turkey MT 11 0 26 24 0
Israel MT 168 0 11 6 0
Zimbabwe MT 3,450 0 0 0 0
United Kingdom MT 0 20 0 0 0
Angola MT 11 0 0 0 0
Belgium MT 0 0 50 0 0
China MT 0 221 0 0 0
Netherlands MT 21 25 122 0 0
Other Countries MT 94 19 0 0 0
*Imports up to April 2018.
Source: GTA
Prices
Table 9 shows the local, export and processed market prices of oranges. The export market provides the
highest prices. As a result, the South African citrus industry is export oriented because the domestic and
processed markets offer lower prices.
Table 9: Oranges Prices
MY
Local Market Export Market Processed
Average Price Gross Price Gross Price

Page 13
Rand/ MT Rand/ MT Rand/ MT
2003/04 1,090 2,425 274
2004/05 1,111 1,580 229
2005/06 1,025 1,843 301
2006/07 1,278 2,832 354
2007/08 1,430 3,443 419
2008/09 1,483 3,235 268
2009/10 1,599 4,043 349
2010/11 1,762 4,691 529
2011/12 1,895 4,318 564
2012/13 2,054 4,975 591
2013/14 2,230 5,781 618
2014/15 2,535 6,576 652
2015/16 3,799 8,570 1,002
2016/17 3,604 8,656 1,069
Source: CGA
Table 10: PSD Oranges, Fresh Oranges, Fresh 2015/2016 2016/2017 2017/2018 Market Begin Year Jan 2016 Jan 2017 Jan 2018
South Africa USDA Official New Post USDA Official New Post USDA Official New Post
Area Planted 41956 41956 42100 42711 42500 44000
Area Harvested 34000 34000 35600 36500 37000 38000
Bearing Trees 37800 37800 38000 38000 38300 38300
Non-Bearing Trees 3900 3900 4000 4000 4100 4100
Total No. Of Trees 41700 41700 42000 42000 42400 42400
Production 1275 1275 1400 1363 1430 1470
Imports 1 1 3 2 10 10
Total Supply 1276 1276 1403 1365 1440 1480
Exports 1064 1064 1170 1171 1180 1220
Fresh Dom. Consumption 70 70 72 71 75 72
For Processing 142 142 161 123 185 188
Total Distribution 1276 1276 1403 1365 1440 1480
(HECTARES) ,(1000 TREES) ,(1000 MT)
Page 14
Tangerines/Mandarins (Soft Citrus), Fresh
Production
The production of tangerines/mandarins is estimated to decrease by 2 percent to 255,000 MT in the
2017/18 MY, from 261,046 MT in the 2016/17 MY. This is due to the impact of the drought, which
resulted in lower yields in the Western Cape, partially offset by increases in production in other growing
regions such as the Eastern Cape, Limpopo and Mpumalanga. About 42 percent of
tangerines/mandarins are produced in the Western Cape, followed by 31 percent in the Eastern Cape and
21 percent in Limpopo. The Western Cape is a winter rainfall region and is currently undergoing a
severe drought. The below average rainfall received in 2017 and the low dam levels (about thirty
percent) in the Western Cape will severely impact the availability of irrigation water in the 2017/18 MY.
In the short term, farmers in the Western Cape are expected to prioritize irrigation of higher yielding
varieties and orchards, while the remaining orchards would be irrigated just to keep the trees alive.
There are also indications that some farmers cut down some trees to reduce costs and uprooted older
orchards.
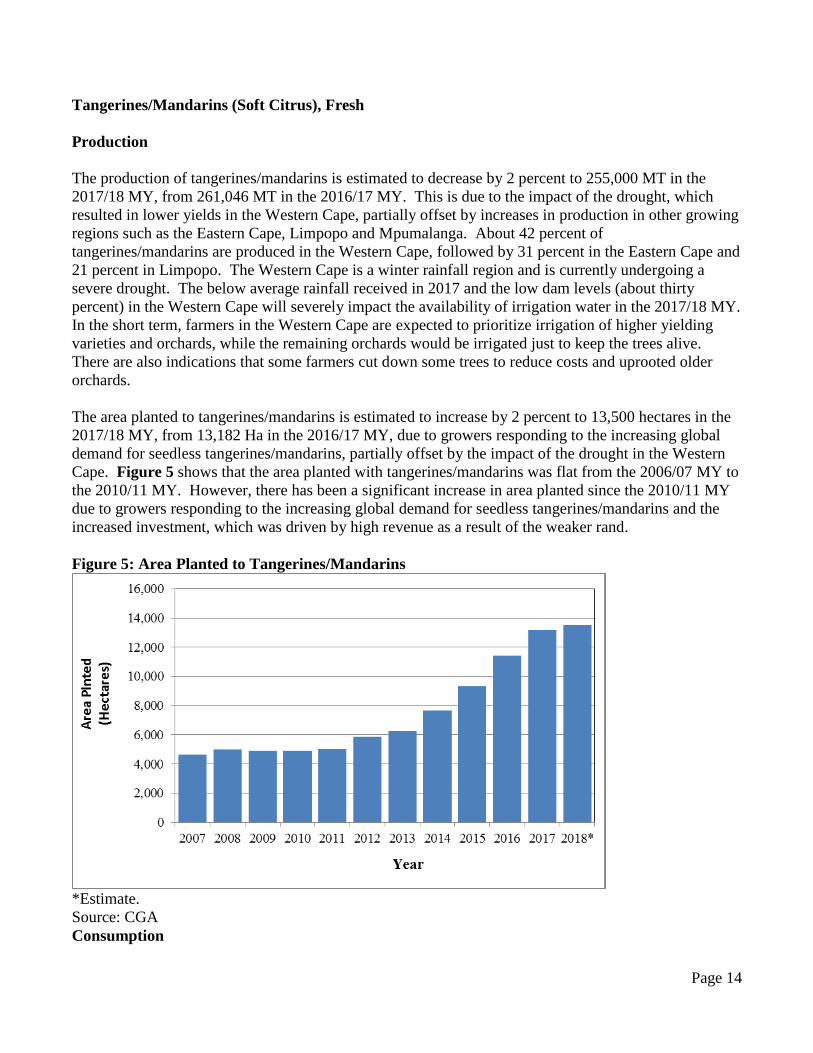
The area planted to tangerines/mandarins is estimated to increase by 2 percent to 13,500 hectares in the
2017/18 MY, from 13,182 Ha in the 2016/17 MY, due to growers responding to the increasing global
demand for seedless tangerines/mandarins, partially offset by the impact of the drought in the Western
Cape. Figure 5 shows that the area planted with tangerines/mandarins was flat from the 2006/07 MY to
the 2010/11 MY. However, there has been a significant increase in area planted since the 2010/11 MY
due to growers responding to the increasing global demand for seedless tangerines/mandarins and the
increased investment, which was driven by high revenue as a result of the weaker rand.
Figure 5: Area Planted to Tangerines/Mandarins
*Estimate.
Source: CGA
Consumption

Page 15
The consumption of tangerines/mandarins is estimated to decrease by 7 percent to 26,000 MT in the
2017/18 MY, from 28,000 MT in the 2016/17 MY, due to the decrease in production and the industry
strategy of prioritizing export markets.
Exports
Despite the decrease in production, the exports of tangerines/mandarins is estimated to increase by 5
percent to 220,000 MT in the 2017/18 MY, from 209,801 MT in the 2016/17 MY, due to the industry
strategy of prioritizing export markets over domestic markets. Demand for tangerines/mandarins
remains strong in the export markets. Exports to the United States under the AGOA have grown by an
average of 15 percent per year over the past four seasons, from 7,443 MT in the 2013/14 MY, to 11,180
MT in the 2016/17 MY. Tangerines/mandarins are not impacted by South Africa’s CBS challenges in
the EU market.
Table 11: South African Fresh Tangerines/Mandarins Exports
South Africa Export Statistics
Commodity: Tangerines/mandarins , Tangerines/mandarins (080520, 080521, 080522, 080529)
Year Ending: December
Partner Country Unit
Quantity
2014 2015 2016 2017 2018*
World MT 153,213 156,589 189,601 209,801 22,707
United Kingdom MT 52,507 61,307 66,152 63,212 8,292
Netherlands MT 30,146 32,022 47,254 49,705 5,809
Russia MT 11,227 14,468 14,200 20,222 6,338
Hong Kong MT 8,215 4,573 9,228 12,309 129
United States MT 7,443 8,638 10,287 11,180 105
United Arab Emirates MT 9,854 7,126 6,732 8,038 527
Canada MT 7,368 6,208 6,729 8,035 223
Ireland MT 3,799 3,742 5,637 5,044 956
Portugal MT 852 1,102 2,412 4,347 0
Bosnia & Herzegovina MT 0 96 969 3,004 0
China MT 71 421 777 2,257 0
Saudi Arabia MT 3,231 1,911 2,335 2,170 24
Bangladesh MT 1,471 247 1,216 2,129 0
Vietnam MT 1,003 1,036 984 1,952 0
Malaysia MT 2,751 1,416 1,385 1,602 0
Mauritius MT 1,137 1,128 1,219 1,494 5
Germany MT 1,120 2,057 1,559 1,459 0
*Exports up to April 2018.
Source: GTA
Imports
Page 16
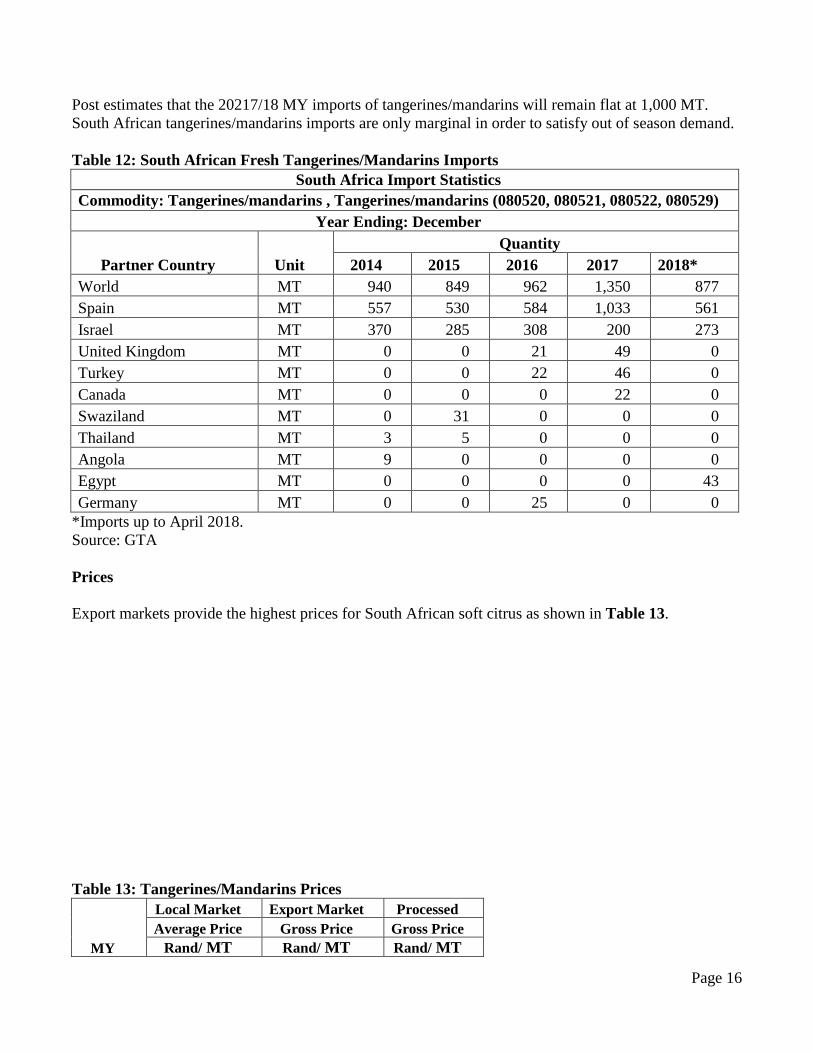
Post estimates that the 20217/18 MY imports of tangerines/mandarins will remain flat at 1,000 MT.
South African tangerines/mandarins imports are only marginal in order to satisfy out of season demand.
Table 12: South African Fresh Tangerines/Mandarins Imports
South Africa Import Statistics
Commodity: Tangerines/mandarins , Tangerines/mandarins (080520, 080521, 080522, 080529)
Year Ending: December
Partner Country Unit
Quantity
2014 2015 2016 2017 2018*
World MT 940 849 962 1,350 877
Spain MT 557 530 584 1,033 561
Israel MT 370 285 308 200 273
United Kingdom MT 0 0 21 49 0
Turkey MT 0 0 22 46 0
Canada MT 0 0 0 22 0
Swaziland MT 0 31 0 0 0
Thailand MT 3 5 0 0 0
Angola MT 9 0 0 0 0
Egypt MT 0 0 0 0 43
Germany MT 0 0 25 0 0
*Imports up to April 2018.
Source: GTA
Prices
Export markets provide the highest prices for South African soft citrus as shown in Table 13.
Table 13: Tangerines/Mandarins Prices
MY
Local Market Export Market Processed
Average Price Gross Price Gross Price
Rand/ MT Rand/ MT Rand/ MT
Page 17
2003/04 1,705 3,638 251
2004/05 1,279 3,977 165
2005/06 2,133 4,423 188
2006/07 2,543 3,758 214
2007/08 3,038 4,965 367
2008/09 3,042 4,635 275
2009/10 3,805 5,618 214
2010/11 4,091 5,637 315
2011/12 3,760 7,133 419
2012/13 5,159 8,542 334
2013/14 5,442 10,004 465
2014/15 5,606 11,392 391
2015/16 6,785 14,242 532
2016/17 6,037 13,489 614
Source: CGA
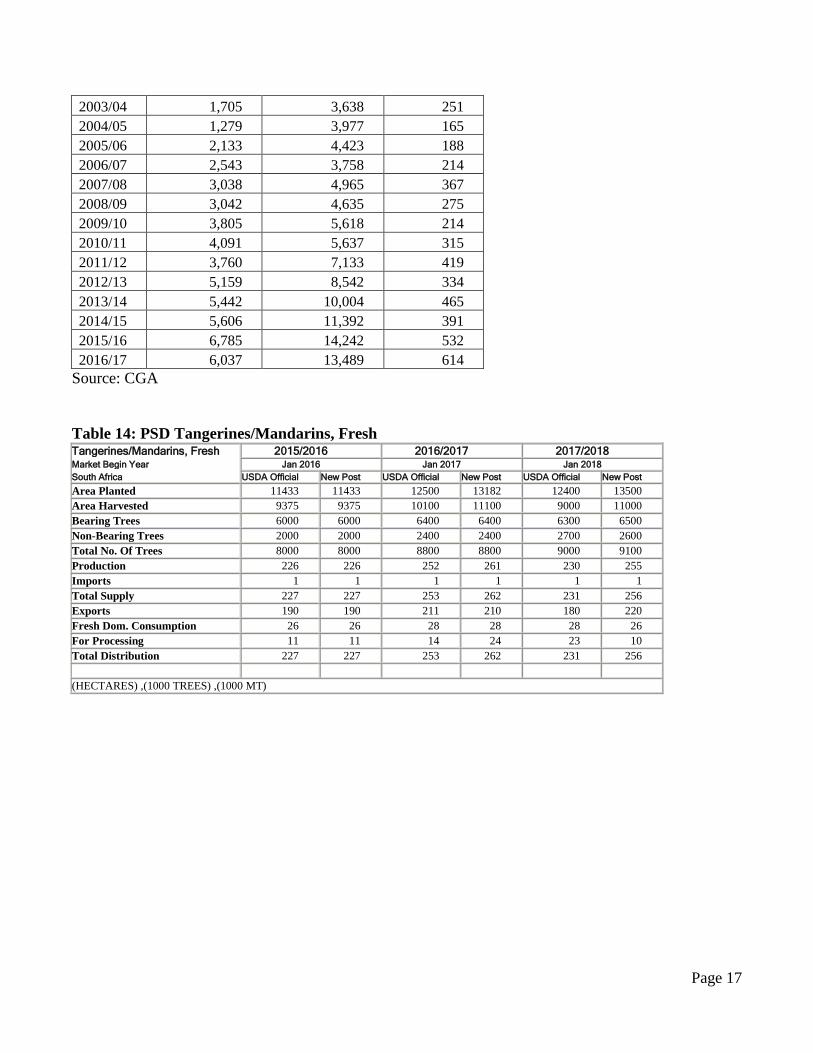
Table 14: PSD Tangerines/Mandarins, Fresh Tangerines/Mandarins, Fresh 2015/2016 2016/2017 2017/2018 Market Begin Year Jan 2016 Jan 2017 Jan 2018
South Africa USDA Official New Post USDA Official New Post USDA Official New Post
Area Planted 11433 11433 12500 13182 12400 13500
Area Harvested 9375 9375 10100 11100 9000 11000
Bearing Trees 6000 6000 6400 6400 6300 6500
Non-Bearing Trees 2000 2000 2400 2400 2700 2600
Total No. Of Trees 8000 8000 8800 8800 9000 9100
Production 226 226 252 261 230 255
Imports 1 1 1 1 1 1
Total Supply 227 227 253 262 231 256
Exports 190 190 211 210 180 220
Fresh Dom. Consumption 26 26 28 28 28 26
For Processing 11 11 14 24 23 10
Total Distribution 227 227 253 262 231 256
(HECTARES) ,(1000 TREES) ,(1000 MT)

Page 18
Lemons/Limes, Fresh
Production
The production of lemons/limes is estimated to increase by 7 percent to 460,000 MT in the 2017/18 MY,
from 430,305 MT in the 2016/17 MY. This is due to the increase in area planted, new orchards coming
to full production, and normal weather conditions in the main production areas of Eastern Cape and
Limpopo, which account for about 80 percent of the production. These increases are forecast to be
partially offset by the lower production in the drought stricken production areas in the Western Cape,
which produces about ten percent of the total lemons/limes. The most popular variety of lemons planted
in South Africa is the Eureka accounting for about 83 percent of the area planted, followed by Lisbon (9
percent), Limoneira 8A (4 percent), and Genoa (3 percent).
Figure 6 shows that the area planted with lemons/limes was initially flat from the 2006/07 MY to the
2009/10 MY. However, similar to tangerines/mandarins, the area planted increased gradually from
4,667 hectares in the 2010/11 MY, to an estimated 12,100 hectares in the 2017/18 MY, in response to
growth in demand and higher prices in the export market.
Figure 6: Area Planted to Lemons/ Lime
*Estimate.
Source: CGA
Consumption

Page 19
The domestic consumption of lemons is estimated to increase by 6 percent to 18,000 MT in the 2017/18
MY, from 17,289 MT in the 2016/17 MY, based on the growth in production. Lemon juice is used as
flavoring for poultry and fish dishes, and a flavor agent in cakes, tarts, biscuits, candies, ice creams and
salad dressings. In the beverage industry lemons/limes are used to make lemonade, smoothies and
liquors. In the cleaning industry, lemon juice is used as a degreaser and disinfectant, due to its high
concentration of citric acid which can inhibit the proliferation of some molds and bacteria.
Exports
The exports of lemons and limes is estimated to increase by 7 percent to 320,000 MT in the 2017/18
MY, from 299,260 MT in the 2016/17 MY, based on the increase in production and growth in demand
from the Middle East and Asian markets. The European Union still remains the main export market for
South African lemons and limes.
Table 15: South African Fresh Lemons/Limes Exports
South Africa Export Statistics
Commodity: 080550, Lemons And Limes, Fresh Or Dried
Year Ending: December
Partner Country Unit Quantity
2014 2015 2016 2017 2018*
World MT 219,456 246,294 236,867 299,260 44,073
United Arab Emirates MT 40,202 48,747 49,116 52,510 10,178
Netherlands MT 22,288 23,735 33,941 33,986 1,009
Saudi Arabia MT 19,801 25,812 28,952 31,925 8,603
Russia MT 30,679 31,440 18,019 30,483 6,799
Hong Kong MT 31,000 20,474 15,372 26,039 3,828
United Kingdom MT 12,564 16,174 20,428 22,702 443
Kuwait MT 7,337 12,465 14,540 18,915 1,302
Canada MT 9,471 10,636 9,224 12,454 1,591
Italy MT 5,589 5,122 8,656 10,455 607
Malaysia MT 6,575 7,006 6,857 8,382 2,241
Vietnam MT 1,535 4,000 2,944 6,209 292
Portugal MT 829 1,572 3,308 5,880 0
Singapore MT 3,964 7,724 3,826 4,053 1,114
Bahrain MT 2,026 2,920 2,993 3,463 872
Qatar MT 2,098 3,218 1,768 3,449 1,146
Iraq MT 0 0 0 2,599 531
Oman MT 576 548 608 2,345 1,742
France MT 540 690 771 2,183 27
Germany MT 5,776 7,310 2,975 2,105 28
Greece MT 1,146 1,101 1,135 1,639 108

Page 20
Azerbaijan MT 629 1,011 147 1,481 87
Ukraine MT 3,313 2,944 988 1,434 180
Georgia MT 963 2,970 2,198 1,420 28
Japan MT 499 375 552 1,235 0
Indonesia MT 517 51 674 1,097 29
Sweden MT 277 552 279 1,067 0
Ireland MT 447 562 451 1,056 77
*Exports up to April 2018.
Source: GTA
Imports
Post estimates that the 2017/18 MY imports of lemons/limes will remain flat due to the available
domestic production which sufficiently meets the local demand. Imports are minimal from Spain,
Swaziland Brazil.
Table 16: South African Fresh Lemons/Limes Imports
South Africa Import Statistics
Commodity: 080550, Lemons And Limes, Fresh Or Dried
Year Ending: December
Partner Country Unit
Quantity
2014 2015 2016 2017 2018*
World MT 676 422 448 487 336
Spain MT 399 206 155 181 97
Swaziland MT 24 34 24 138 150
Brazil MT 162 138 128 102 25
United Kingdom MT 0 0 0 34 0
Turkey MT 29 44 91 29 64
Other Countries NES MT 4 0 0 3 0
United Arab Emirates MT 0 0 52 0 0
Angola MT 5 0 0 0 0
Egypt MT 1 0 0 0 0
France MT 0 1 0 0 0
Namibia MT 30 0 0 0 0
Russia MT 25 0 0 0 0
*Imports up to April 2018.
Source: GTA
Prices

Page 21
Export markets provide the highest prices for South African lemons/limes as shown in Table 17.
Table 17: Lemons/Limes Prices
MY
Local Market Export Market Processed
Average Price Gross Price Gross Price
Rand/ MT Rand/ MT Rand/ MT
2004/05 1,692 1,476 258
2005/06 1,753 2,478 178
2006/07 2,460 3,238 396
2007/08 3,105 3,961 611
2008/09 3,346 2,120 542
2009/10 3,940 5,329 731
2010/11 3,489 5,426 982
2011/12 4,291 5,426 720
2012/13 5,668 6,994 596
2013/14 6,619 11,058 1,288
2014/15 7,453 12,340 1,378
2015/16 7,697 16,483 1,842
2016/17 7,445 13,289 1,657
Source: CGA
Table 18: PSD Lemons/Limes, Fresh Lemons/Limes, Fresh 2015/2016 2016/2017 2017/2018 Market Begin Year Jan 2016 Jan 2017 Jan 2018
South Africa USDA Official New Post USDA Official New Post USDA Official New Post
Area Planted 9485 9485 11000 11710 11500 12100
Area Harvested 7967 7967 8900 9700 9200 10000
Bearing Trees 5700 5700 6200 6200 6300 6400
Non-Bearing Trees 2000 2000 2000 2100 2100 2200
Total No. Of Trees 7700 7700 8200 8300 8400 8600
Production 308 308 397 430 420 460
Imports 1 1 1 1 1 1
Total Supply 309 309 398 431 421 461
Exports 237 237 300 299 310 320
Fresh Dom. Consumption 16 16 17 17 18 18
For Processing 56 56 81 115 93 123
Total Distribution 309 309 398 431 421 461
(HECTARES) ,(1000 TREES) ,(1000 MT)

Page 22
Orange Juice
Production
The production of orange juice is estimated to significantly increase to 30,000 MT in the 2017/18 MY,
from 19,367 MT in the 2016/17 MY. This is due to the increase in the quantity of fresh oranges
delivered for processing and the higher juice extraction achieved as a result of the better quality of
oranges.
Industry coordinated statistics for orange juice are largely unavailable in South Africa. The production,
consumption and stock levels represent Posts` forecast based on information derived from various
sources, contacts and calculations of extractions from fresh oranges delivered for processing.
Consumption
The domestic consumption of orange juice is estimated to significantly increase to 6,000 MT in the
2017/18 MY, from 4,600 MT in the 2016/17 MY, based on the increase in production and supply
availability. The relatively high food price inflation has resulted in restricted growth in the domestic
consumption of fresh fruit juices especially the one hundred percent fruit juice, and the shift in demand
to orange juice concentrates.
Export
Post estimates that the 2017/18 MY exports of orange juice will increase by 3 percent to 28,500 MT,
from 27,742 MT in the 2016/17 MY, based on the available supply, increase in production and the year
to date exports up to April 2018. The 2016/17 MY exports of orange juice were revised upwards to
27,742 MT, based on final GTA data. Post adjusted the orange juice export data to the equivalent of 65
Degrees Brix based on the respective conversion factors shown on the export tables below. Degrees
Brix represents the strength of the juice based on the sugar content. Thus, 65 Degrees Brix means that
the orange juice has at least 65 grams of sucrose per 100 grams of orange juice.
Producers in South Africa prefer to export fresh oranges rather than to sell to processors as export prices
are eight times higher than prices achieved from processors. Netherlands, Botswana, Mozambique,
Mauritius, Zambia and Zimbabwe are the biggest markets for South African orange juice exports.
Table 19: South African Orange Juice Exports – HS200919
South Africa Export Statistics
Commodity: 200919, Orange Juice, Other Than Frozen, Whether Or Not Sweetened

Page 23
Year Ending: December
Partner Country Unit
Quantity
2014 2015 2016 2017 2018*
World MT 30,419 37,297 30,649 23,722 8,424
Botswana MT 5,632 7,065 7,228 6,530 3,176
Namibia MT 1,969 3,208 4,936 4,562 1,454
Swaziland MT 2,554 3,229 3,464 3,008 1,016
Zimbabwe MT 3,408 3,516 1,920 2,536 956
Lesotho MT 1,812 2,512 1,893 1,341 380
Zambia MT 1,312 1,372 1,014 1,258 242
Mozambique MT 1,974 2,893 1,320 871 255
Ethiopia MT 68 1,061 789 665 182
Netherlands MT 7,768 7,230 3,534 377 326
Malawi MT 62 91 290 342 122
Italy MT 330 507 533 196 122
Angola MT 272 176 83 187 1
*Exports up to April 2018.
Source: GTA and Post adjustments to 65 Degrees Brix (Conversion Factor 1.02).
Table 20: South African Orange Juice Exports – HS200911
South Africa Export Statistics
Commodity: 200911, Orange Juice, Frozen, Whether Or Not Sweetened
Year Ending: December
Partner Country Unit
Quantity
2014 2015 2016 2017 2018*
World MT 7,176 6,242 3,766 3,496 1,049
Netherlands MT 4,646 4,669 2,361 2,659 789
Botswana MT 382 373 553 328 79
India MT 159 0 126 133 0
Hong Kong MT 0 0 0 78 0
United Kingdom MT 0 31 60 70 14
Spain MT 580 89 68 68 98
United States MT 171 0 0 51 0
Mauritius MT 63 38 0 33 0
*Exports up to April 2018.
Source: GTA and Post adjustments to 65 Degrees Brix (Conversion Factor 1.00).
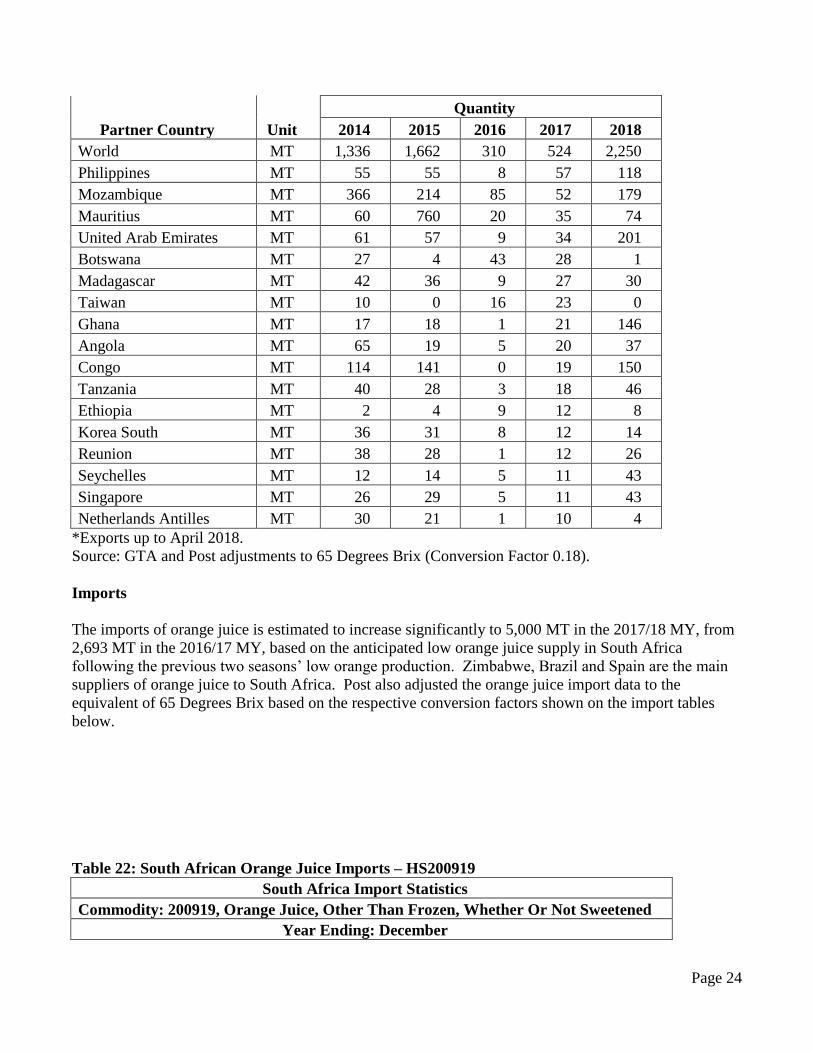
Table 21: South African Orange Juice Exports – HS200912
South Africa Export Statistics
Commodity: 200912, Orange Juice, Not Frozen, Of A Brix Value Not Exceeding 20
Year Ending: December
Page 24
Partner Country Unit
Quantity
2014 2015 2016 2017 2018
World MT 1,336 1,662 310 524 2,250
Philippines MT 55 55 8 57 118
Mozambique MT 366 214 85 52 179
Mauritius MT 60 760 20 35 74
United Arab Emirates MT 61 57 9 34 201
Botswana MT 27 4 43 28 1
Madagascar MT 42 36 9 27 30
Taiwan MT 10 0 16 23 0
Ghana MT 17 18 1 21 146
Angola MT 65 19 5 20 37
Congo MT 114 141 0 19 150
Tanzania MT 40 28 3 18 46
Ethiopia MT 2 4 9 12 8
Korea South MT 36 31 8 12 14
Reunion MT 38 28 1 12 26
Seychelles MT 12 14 5 11 43
Singapore MT 26 29 5 11 43
Netherlands Antilles MT 30 21 1 10 4
*Exports up to April 2018.
Source: GTA and Post adjustments to 65 Degrees Brix (Conversion Factor 0.18).
Imports
The imports of orange juice is estimated to increase significantly to 5,000 MT in the 2017/18 MY, from
2,693 MT in the 2016/17 MY, based on the anticipated low orange juice supply in South Africa
following the previous two seasons’ low orange production. Zimbabwe, Brazil and Spain are the main
suppliers of orange juice to South Africa. Post also adjusted the orange juice import data to the
equivalent of 65 Degrees Brix based on the respective conversion factors shown on the import tables
below.
Table 22: South African Orange Juice Imports – HS200919
South Africa Import Statistics
Commodity: 200919, Orange Juice, Other Than Frozen, Whether Or Not Sweetened
Year Ending: December

Page 25
Partner Country Unit
Quantity
2014 2015 2016 2017 2018*
World MT 179 1,307 1,043 2,168 288
Zimbabwe MT 18 706 692 771 0
Brazil MT 0 0 232 642 203
Spain MT 0 0 0 450 65
Swaziland MT 4 2 0 161 0
United Arab Emirates MT 1 428 47 0 0
Pakistan MT 0 28 5 29 4
Botswana MT 0 0 4 19 1
Mexico MT 0 0 0 17 0
Portugal MT 27 18 22 14 5
Other Countries MT 128 119 40 63 10
*Imports up to April 2018.
Source: GTA and Post adjustments to 65 Degrees Brix (Conversion Factor 1.02).
Table 23: South African Orange Juice Imports – HS200911
South Africa Import Statistics
Commodity: 200911, Orange Juice, Frozen, Whether Or Not Sweetened
Year Ending: December
Partner Country Unit
Quantity
2014 2015 2016 2017 2018*
World MT 0 0 51 514 0
Argentina MT 0 0 0 422 0
Brazil MT 0 0 51 73 0
Israel MT 0 0 0 19 0
*Imports up to April 2018.
Source: GTA and Post adjustments to 65 Degrees Brix (Conversion Factor 1.00).
Table 24: South African Orange Juice Imports – HS200912
South Africa Import Statistics
Commodity: 200912, Orange Juice, Not Frozen, Of A Brix Value Not Exceeding 20
Year Ending: December
Partner Country Unit Quantity
2014 2015 2016 2017 2018*

Page 26
World MT 0 0 5 11 3
Other Countries NES MT 0 0 0 11 0
Vietnam MT 0 0 0 0 3
Zimbabwe MT 0 0 5 0 0
*Imports up to April 2018.
Source: GTA and Post adjustments to 65 Degrees Brix (Conversion Factor 0.18).
Table 25: PSD Orange Juice Orange Juice 2015/2016 2016/2017 2017/2018 Market Begin Year Dec 2016 Dec 2017 Dec 2018
South Africa USDA Official New Post USDA Official New Post USDA Official New Post
Deliv. To Processors 142000 142000 161000 123000 185000 188000
Beginning Stocks 29003 29003 8679 10539 3179 257
Production 19317 21177 22000 19367 26000 30000
Imports 1101 1101 2700 2693 5000 5000
Total Supply 49421 51281 33379 32599 34179 35257
Exports 34742 34742 24000 27742 25500 28500
Domestic Consumption 6000 6000 6200 4600 6400 6000
Ending Stocks 8679 10539 3179 257 2279 757
Total Distribution 49421 51281 33379 32599 34179 35257
(MT)

Page 27
Policies and Regulations:
United States Cold Sterilization Protocol
The Western Cape Province is the only growing region in South Africa authorized to export citrus to the
United States under the cold treatment schedule to address False Codling Moth (FCM). The United
States Animal Plant Health Inspection Service (APHIS) has reduced the cold treatment schedule from 24
to 22 days, which has been hugely beneficial to South Africa in terms of reducing shipping costs and in
reducing fruit loss from cold damage. Exports to the United States are through the ports of Newark,
Philadelphia, Houston and New Orleans.
South African Citrus Exports from Citrus Black Spot (CBS) Areas to the United States
Currently, South Africa can only export citrus to the United States from official CBS free areas. The
CBS free areas are found in the Western Cape and Northern Cape, as well as relevant districts of the
Free State and North West Provinces. On August, 28, 2014, APHIS issued a notice proposing to amend
the fruits and vegetables regulations to allow the import of several varieties of fresh citrus fruit, as well
as Citrus hybrids, into the United States from areas in the Republic of South Africa where citrus black
spot has been known to occur. The regulation would authorize imports on condition of satisfying certain
systems and SPS treatment procedures. This proposal can be found on the following link;
http://www.regulations.gov/#!documentDetail;D=APHIS-2014-0015-0001. The deadline for submitting
comments closed on October, 27, 2014. The final regulation is still to be finalized.
Citrus Black Spot Challenges in the European Union Market
South Africa still faces challenges in the European Union (EU) market as a result of the stringent CBS
requirements, and normally voluntarily suspends citrus exports to the EU every season to avoid any
further interceptions of fruit with CBS. For example, in October 2017, South Africa voluntarily
suspended citrus exports to the EU, as a precaution and risk mitigation measure to prevent a ban on
citrus exports to the EU. Complying with the EU requirements for CBS costs the industry a lot of
money, constrains the already limited government capacity and the scientific basis for these measures
have been questioned. In addition, Argentina and Uruguay are reported to have higher CBS
interceptions than South Africa. Thus South Africa considers these EU measures an unnecessary
technical trade barrier. Industry estimates that the cost of complying with the EU CBS requirements is
around R1 Billion (US$77 Million) and may not be sustainable in the long run.
South Africa Fresh Produce Importers Association
The Fresh Produce Importers Association assists members with the importation of fresh fruit and
vegetables in South Africa. Information on their members, contact details and services they provide can
be obtained from the following website link, http://www.fpia.co.za/contact-us/ .
Custom Duties

Page 28
United States citrus exports face a 4 percent customs duty in South Africa. Table 26 reflects the
applicable custom duties when exporting citrus to South Africa
Table 26: Custom Duties Applicable to Exports to South Africa
HS Code Article description Unit Rate of Duty
General EU EFTA SADC MERCOSUR
08.05 Citrus fruit, fresh or dried:
0805.10 Oranges
0805.10.10 Fresh kg 4% free 4% free 4%
0805.10.90 Other kg 4% free 4% free 4%
0805.2 Mandarins (including tangerines and satsumas); clementines, wilkings and similar citrus
hybrids:
0805.21 Mandarins (including tangerines and satsumas)
0805.21.10 Fresh kg 4% free 4% free 4%
0805.21.90 Other kg 4% free 4% free 4%
0805.22 Clementines:
0805.22.10 Fresh kg 4% free 4% free 4%
0805.22.90 Other kg 4% free 4% free 4%
0805.29 Other:
0805.29.10 Fresh kg 4% free 4% free 4%
0805.29.90 Other kg 4% free 4% free 4%
0805.40 Grapefruit, including pomelos:
0805.40.10 Fresh kg 4% free 4% free 4%
0805.40.90 Other kg 4% free 4% free 4%
0805.50 Lemons (CitrusLimon, Citrus Limonium) and limes (Citrus aurantifolia, Citrus latifolia):
0805.50.10 Fresh kg 4% free 4% free 4%
0805.50.90 Other kg 4% free 4% free 4%
0805.90 Other:
0805.90.10 Fresh kg 4% free 4% free 4%
0805.90.90 Other kg 4% free 4% free 4%
2009.1 Orange juice
2009.11 Frozen kg 25% free 25% free 25%
2009.12 Not frozen, of Brix
value not exceeding 20 kg 25% free 25% free 25%
2009.19 Other kg 25% free 25% free 25%
Source: South African Revenue Services (SARS)
South African Import Regulation

Page 29
The following links provide useful resources and regulations pertaining to importing fruit into South
Africa:
Export Procedures to South Africa
http://www.nda.agric.za/doaDev/sideMenu/plantHealth/docs/importProcedure.pdf.
Maximum Residue Limits
http://www.nda.agric.za/doaDev/sideMenu/foodSafety/doc/South%20African%20Citrus%20MRLs%20
2013.pdf
Agriculture Product Standards Act No 119 of 1990
http://www.nda.agric.za/doaDev/sideMenu/Food%20Import%20&%20Export%20Standard/docs/Agric
%20Product%20Standards%20Act%20No%20119%20%20of%201990.pdf
Agricultural Pests Amendment Act, 9 of 1992
http://www.nda.agric.za/doaDev/sideMenu/APIS/doc/Agricultural%20Pests%20Act.pdf