sources of organic carbon supporting the food web of an arid zone
TRANSCRIPT

Sources of organic carbon supporting the food web of an aridzone floodplain river
Author
Bunn, Stuart, Davies, Peter, Winning, Michelle
Published
2003
Journal Title
Freshwater Biology
DOI
https://doi.org/10.1046/j.1365-2427.2003.01031.x
Copyright Statement
© 2003 Blackwell Publishing. The attached file is reproduced here in accordance with thecopyright policy of the publisher. The definitive version is available at [www.blackwell-synergy.com.]
Downloaded from
http://hdl.handle.net/10072/6035
Link to published version
http://www.wiley.com/bw/journal.asp?ref=0046-5070
Griffith Research Online
https://research-repository.griffith.edu.au

Food webs in arid zone rivers
1
Sources of organic carbon supporting the food web of an arid zone
floodplain river
STUART E. BUNNa,b, PETER M. DAVIESc AND MICHELLE WINNINGa
aCooperative Research Centre for Freshwater Ecology,
Centre for Catchment and In-Stream Research,
Faculty of Environmental Sciences, Griffith University,
Nathan, Queensland, Australia 4111.
bCorresponding author
(ph: 07 3875 7407; fax: 07 3875 7615; email: [email protected])
cCentre of Excellence in Natural Resource Management,
The University of Western Australia,
Albany, Western Australia 6330.
Key words: primary production, stable isotope analysis, phytoplankton, cyanobacteria,
waterholes, dryland rivers

Food webs in arid zone rivers
2
SUMMARY
1. Many Australian inland rivers are characterised by vast floodplains with a network of
anastomosing channels that interconnect only during unpredictable flooding. For
much of the time, however, rivers are reduced to a string of disconnected and highly
turbid waterholes. Given these features, we predicted that aquatic primary
production would be light limited and the riverine food web would be dependent on
terrestrial carbon from floodplain exchanges and direct riparian inputs.
2. To test these predictions, we measured rates of benthic primary production and
respiration and sampled primary sources of organic carbon and consumers for stable
isotope analysis in several river waterholes at four locations in the Cooper Creek
system in central Australia.
3. A conspicuous band of filamentous algae was observed along the shallow littoral
zone of the larger waterholes. Despite the high turbidity, benthic gross primary
production in this narrow zone was very high (1.7 –3.6 g C m-2 day-1), about two
orders of magnitude greater than that measured in the main channel.
4. Stable carbon isotope analysis confirmed that this “bath-tub ring” of algae was the
major source of energy for aquatic consumers, ultimately supporting large
populations of crustaceans and fish. Variation in the stable carbon and nitrogen
isotope signatures of consumers suggests that plankton was the other major primary
source.
5. Existing ecosystem models of large rivers often emphasize the importance of
longitudinal or lateral inputs of terrestrial organic matter as a source of organic
carbon for aquatic consumers. Our data suggest that, despite the presence of large

Food webs in arid zone rivers
3
amounts of terrestrial carbon, there was no evidence of it being a significant
contributor to the aquatic food web in this floodplain river system.
Introduction
Aquatic invertebrates, fish and other consumers in small forested streams are considered
to be strongly dependent on inputs of carbon and nutrients from the surrounding
catchment, especially from the fringing riparian zone (Cummins, 1974; Vannote et al.,
1980; Gregory et al., 1991). In-stream primary production is often limited by shading
from the dense riparian canopy (Feminella, Power & Resh, 1989; Boston & Hill, 1991)
and, with some exceptions (e.g. Rosenfeld & Roff, 1992; Bunn, Davies & Mosisch,
1999), contributes little to the stream food web. In more sparsely vegetated biomes and
in larger streams and rivers, however, this direct riparian regulation of in-stream primary
production is markedly reduced and aquatic plants may provide an important source of
organic carbon for consumers (Finlay, 2001).
In the case of larger river systems, however, our understanding of these fundamental
ecosystem processes is poor in comparison to their small forest stream counterparts
(Johnson, Richardson & Naimo, 1995). Current models of large river ecosystem
function vary considerably in their predictions of the relative importance of terrestrial
and in-stream production to aquatic food webs. The river continuum concept (RCC)
(Vannote et al., 1980) emphasizes the importance of terrestrial carbon and nutrients
“leaked” from upstream processes to the structure and function of lowland river reaches.
Middle-order reaches, where the direct effects of riparian shading are diminished, may
have an increased dependence on in-stream primary production. However, fine

Food webs in arid zone rivers
4
particulate organic matter is thought to be the principal carbon source supporting food
webs in downstream reaches, and much of this is considered to be derived from upstream
processing. Direct inputs of leaf litter and other coarse particulate organic matter from
adjacent riparian vegetation are thought to be minor and, in larger rivers, in-stream
primary production is limited by turbidity and light attenuation associated with depth
(Vannote et al., 1980).
In contrast, the flood-pulse concept (FPC) (Junk, Bayley & Sparks, 1989; Bayley,
1995) emphasizes the importance of lateral river-floodplain exchanges and proposes that
riverine food webs are more dependent on production derived from the floodplain than
on organic matter transported from tributaries upstream. During floods, aquatic animals
migrate out onto the floodplain and exploit newly available habitats and their resources.
As the floodwaters recede, carbon and nutrients together with newly produced animal
biomass are returned to the main river channel (Johnson et al., 1995).
The riverine productivity model (RPM) provides an alternative view of ecosystem
function in large rivers (Thorp & Delong, 1994), and highlights the importance of local
in-stream production (phytoplankton, benthic algae, and other aquatic plants) and, to a
lesser extent, direct inputs of organic matter from the adjacent riparian zone. Thorp and
Delong (1994) further argue that the previous two models of large river ecosystems
underestimate the role of autochthonous sources and have over-emphasized the relative
importance of terrestrial organic matter from both headwater streams (RCC) and
floodplains (FPC). Although the RPM was originally proposed for highly regulated
river systems that have been effectively isolated from their floodplains, Thorp and
Delong (in press) propose that this model may also be more broadly applicable to
unregulated, floodplain rivers.

Food webs in arid zone rivers
5
Many large inland rivers in Australia feature extensive floodplains and a network of
anastomosing channels and distributaries that provide a far greater terrestrial-water
interface than would occur with a single large channel (Walker, Sheldon & Puckridge,
1995). The rivers have highly variable and unpredictable flow regimes (Puckridge et al.,
1998; Thoms & Sheldon, 2000) and, when they do flow, often occupy vast floodplains
(Graetz, 1980). Perhaps not surprisingly, the FPC has been thought to provide an
appropriate framework for understanding ecosystem processes in these rivers (Walker et
al., 1995). However, although renowned for episodic floods, these dryland rivers (sensu
Davies et al., 1995) exist for much of the time as a string of disconnected and highly
turbid waterholes that act as refugia for aquatic organisms and other wildlife dependent
on permanent water (Morton, Short & Baker, 1995; Bunn & Davies, 1999). The river
water remains highly turbid, even during the long periods between flood flows.
Given these features, we predicted that the aquatic food web of dryland rivers would
be dependent on energy and nutrients derived from extensive floodplain exchange during
floods, and by continual input from riparian vegetation along the vast network of
channels during the dry. We also predicted that aquatic plant production should be
limited by low light penetration in the highly turbid water and thus make only a minor
contribution to the aquatic food web. To test these predictions, we measured rates of
benthic primary production and respiration and sampled primary sources of organic
carbon and consumers for stable isotope analysis in several waterholes at four locations
within the Cooper Creek system in central Australia.

Food webs in arid zone rivers
6
Methods
Study sites
Cooper Creek, formed by the confluence of the Thomson and Barcoo rivers, is the one of
the major rivers of the Lake Eyre Basin in central Australia, draining an area of
approximately 296,000 km2, from the Great Dividing Range in Queensland to Lake Eyre
in South Australia (Anon., 1998; Fig. 1). The catchment lies in the arid region of
Australia and much of the area receives less than 400 mm average annual rainfall (Anon.,
1998). Although rainfall in this region is generally associated with summer monsoons, it
has a very high inter-annual variability and the Cooper has one of the most variable and
unpredictable flow regimes of any river in the world of comparable size (Knighton &
Nanson, 1994; Puckridge et al., 1998; Knighton & Nanson, 2001). The average annual
discharge at Windorah is approximately 3.3 million ML. However, in the 50 years of
flow records from 1939 –1988 there have been significant periods of no flow, with the
longest in 1951/52 lasting 21 months, and several floods with the largest discharge in
1974 of more than 23 million ML (Anon., 1998).
Like most dryland rivers in this region, the Cooper catchment is characterised by a
network of anastomosing channels and distributaries that interconnect only during
episodic floods and approximately 35% of the catchment is considered to be floodplain
(Graetz, 1980; Gibling, Nanson & Maroulis, 1998). These floods can cover tens of
thousands of square kilometers and take many weeks to travel down the extensive
floodplain system of channels and wetlands. For example, the April 1990 flood
inundated some 26,000 km2 downstream of the junction of the Thomson and Barcoo
rivers (Anon., 1998). Mean annual evaporation exceeds 3 m and, together with
transpiration and groundwater recharge, result in substantial transmission losses below

Food webs in arid zone rivers
7
Windorah that can account for more than two thirds of the discharge by the time it
reaches Innamincka, on the South Australian border (Fig. 1; Anon., 1998).
Floodplain vegetation in these areas consists of short grass and forb associations and
lignum associations (Boyland, 1984; Capon, 1998). Woody vegetation (river red gum
Eucalyptus camaldulensis, coolibah E. coolibah, and melaleucas Melaleuca linariifolia)
is mostly confined to a narrow riparian fringe slightly elevated above the floodplain and
often only a few trees in width. The banks are generally steep and the water surface
during the extended dry periods is generally several metres lower than the riparian zone.
Depending on channel orientation (largely north/south), there can be considerable
shading of the waterhole by the banks and vegetation during the early morning and late
afternoon.
Three sites were chosen at each of four study locations on the Cooper Creek and its
major tributaries (Table 1, Fig. 1). Three waterholes were sampled on Kyabra Creek,
one of the major eastern tributaries of the Cooper, at One-mile waterhole (ID46),
Springfield homestead waterhole (ID47) and Moonbang Creek (ID48), a small tributary
of Kyabra Creek. The large Murken waterhole (ID49) on the Cooper main channel near
Windorah was sampled together with an adjoining waterhole on a small distributary
(ID50). A third site was sampled on the nearby Mayfield homestead waterhole (ID51).
Two sites were sampled on the large Tanbar waterhole, at the homestead (ID52) and
bottom crossing (ID53), and a third site was sampled on a small waterhole on one of the
nearby distributary channels (ID54). Three waterholes were also sampled on the Barcoo
River in the Barcoo-Welford National Park, at Rosehill (ID55), the shearing shed (ID56),
and homestead (ID57) (Table 1, Fig. 1).

Food webs in arid zone rivers
8
All sites were sampled during a no-flow period in May 1997 and the sites at
Mayfield and Kyabra were also sampled during similar no-flow conditions in September
1996. A small flood event occurred between these sample times, in February/March
1997 (Qmax = 1302 m3 s-1 on the Thomson River at Longreach, Station 003202A).
However, with the exception of one other small flood (Qmax = 1196 m3 s-1) in March
1994, little flow occurred between the sampling period and the last floods in April 1990
(Qmax = 8115 m3 s-1) and February 1991 (Qmax = 4096 m3 s-1) (Queensland Department of
Natural Resources and Mines, unpublished flow data).
Only the largest of the waterholes (Tanbar, Springfield homestead, and Murken)
retain permanent water for many years without flow, though even these have been
known to dry to a few shallow pools after extended dry periods. The small distributary
sites adjoining Murken waterhole (ID50) and Tanbar waterhole (ID54), and particularly
Moonbang Creek (ID48) were the most ephemeral of the waterholes sampled. All have
been completely dry on more than one occasion since our sampling began in 1996.
Turbidity was consistently high at all sites during the dry with Secchi depths of
ranging from 6 cm (Murken) to 15 cm (Tanbar). High turbidity is a characteristic feature
of these systems with average Secchi values of 5 to 6 cm recorded throughout the Cooper
(Bailey, 2001). Salinities are generally low with recorded conductivities ranging from
49-305 μS cm-1 at 25C (mean 119) for the Thomson River and 43.5-827 μS cm-1 (mean
205) for the Barcoo River (Bailey, 2001).
Benthic metabolism
Benthic gross primary production (GPP) and respiration (R24) were measured at each site
by monitoring dissolved oxygen within in situ perspex chambers over 24 hours (e.g. Bott

Food webs in arid zone rivers
9
et al., 1978, Bunn et al. 1999). Open-bottom perspex chambers (diameter = 29.5 cm,
height = 35 cm) were sealed by pushing at least 10 cm into the soft substrate. All
chambers had a central port for the polarographic oxygen sensor (TPS model 601) and
side ports for a 12V recirculating pump. Dissolved oxygen and temperature within each
chamber was monitored electronically over at least 24 h at 10-minute intervals and stored
in a data logger (Wesdata model 389). These data were converted into units of carbon
assuming a photosynthetic quotient of one (Lambert, 1984; Bender et al., 1987) and 1
mg O2 = 0.375 mg C. After the end of the measurement period, the volume of water
enclosed by each chamber was measured in situ to determine absolute rates of
metabolism.
Rates of benthic metabolism were determined for two major habitats; the shallow
littoral zone with a visible band of benthic algae and the deeper (>35 cm) main channel.
Where possible at littoral sites, the chambers were pushed deep into the substrate so that
measurements were made in as shallow water as possible. The mean depth of the littoral
samples was 18 cm (SEM = 2.6 cm). Replicate chambers were deployed in each habitat
at each site and time, however, in some instances data from one of the replicates was lost
due to logger or pump failure. The proportion of each habitat was estimated for several
transects across the channel at each site. Mean values of GPP and P/R were scaled-up to
overall waterhole values by determining the proportional representation of each habitat
(littoral or channel).
Dissolved oxygen and temperature were also measured at 10 minute intervals in the
surface water, mid-channel at each site over the same 24 hr period using a TPS (model
601) polarographic oxygen sensor and a data logger (Wesdata model 389).
Food webs in arid zone rivers
10
Differences in benthic metabolism at each area, season and habitat were tested by a
three-way ANOVA. Data were, where necessary, transformed prior to analyses and the
magnitude of treatment effects was calculated to determine the relative importance (as a
percentage) of the significant main effects (Winer, 1971).
Collection of primary sources and consumers
Major primary sources of organic carbon (terrestrial and aquatic) were collected from
each site and, in the case of the Mayfield sites only, on both occasions. Newly abscised
leaves from the major riparian trees (mostly Eucalyptus camaldulensis and E. coolibah)
were collected by hand. Samples of benthic detritus were collected with a kick net and
wet-sieved into fine (250 m –1 mm) and coarse (> 1mm) particulate organic matter
(FPOM and CPOM) fractions. Benthic algal samples were collected from the shallow
littoral margins, either directly off the mud surface or from woody debris. Because of
the high suspended sediment and presence of other organic debris it was not possible to
obtain samples of phytoplankton.
The waterholes teemed with snails (Viviparidae: Notopala sublineata), large
shrimps (Palaemonidae: Macrobrachium australiense) and crayfish (Parastacidae:
Cherax destructor). We sampled these conspicuous consumers with a small seine net
and benthic traps. However, very few aquatic insects were found, even using a kick-net
(250 m mesh). Those collected included odonate larvae (mainly Gomphidae), beetles
(Dytiscidae) and, in some leaf packs, chironomid larvae (Chironominae). We also
collected freshwater clams (Corbiculinidae: Corbiculina) and mussels (Hyriidae:
Velesunio spp) by hand. Zooplankton (mostly calanoid copepods) was sampled at dusk
by towing a 250 m plankton net across the surface of the waterhole.

Food webs in arid zone rivers
11
Several species of native fish (bony bream Nematalosa erebi, rainbowfish
Melanotaenia splendida tatei, smelt Retropinna semoni, yellowbelly Macquaria sp.,
Barcoo grunter Scortum barcoo, glass perchlet Ambassis mulleri, catfish Neosilurus
argenteus and N. hyrtlii, spangled perch Leiopotherapon unicolor, gudgeons
Hypseleotris spp.) and one introduced species (Gambusia affinis) were collected by seine
net. Small samples of shell were removed from two turtles (Emydeura macquarii)
caught in September 1996 and the animals returned alive to the waterholes.
Where possible, three replicate samples of each source and consumer were collected
from each site. Animal and plant samples were refrigerated immediately and then frozen
as soon as possible and stored for isotope analysis.
Sample preparation and analysis
Primary sources were rinsed in distilled water in the laboratory and oven-dried at 60C
for 36-48 h. The dried material was then ground to a powder-like consistency in a ring
grinder.
Macrobrachium exoskeletons and mollusc shells were removed to prevent possible
contamination from non-dietary carbonates. The digestive tracts of Macrobrachium
were also removed as they could represent a significant source of contamination from
unassimilated material. Samples of Cherax muscle tissue were taken from crayfish
claws or, in the case of smaller individuals, from the tail. Half of each zooplankton
sample collected was treated in 10% HCl for approximately two hours to remove
carbonates from exoskeletons for 13C analysis. The remaining sample was not treated
in acid and was used for 15N analysis (Bunn, Loneragan & Kempster, 1995). Aquatic
Food webs in arid zone rivers
12
insects were prepared whole and pooled for each site. Macrobrachium, snail and clam
samples were also pooled for each site (8 - 30 individuals).
Samples of muscle tissue were filleted from each fish, in each case recording total
body length. Most fish samples analyzed were from single individuals, however, in the
case of small specimens, a few individuals (2-15) were pooled. Samples of liver and
bone were also removed from eight of the larger predatory fish (four yellowbelly
Macquaria and four spangled perch Leiopotherapon) to examine possible temporal
changes in isotope ratios associated with shifts in diet (Hesslein, Hallard & Ramlal,
1993). All animal samples were oven-dried at 60C for 24 h and ground by hand with a
mortar and pestle.
Dried, ground samples were oxidized at high temperature and the resultant CO2 and
N2 were analyzed for %C, %N and stable isotope ratios with a continuous-flow isotope-
ratio mass spectrometer (Europa Tracermass and Roboprep, Crewe, England). Ratios of
13C/12C and 15N/14N were expressed as the relative per mil (‰) difference between the
sample and conventional standards (PDB carbonate and N2 in air) where:
X = (Rsample/Rstandard– 1) x 1000 (‰)
Where X = 13C or 15N and R = 13C/12C or 15N/14N.
Measurement precision was approximately 0.1 and 0.3 ‰ for 13C/12C and 15N/14N,
respectively.
Simple relationships between δ13C and δ15N signatures of fish, and between stable
isotope signatures and fish size were examined using Pearson correlations. Where
possible, a three-source mixing model using δ13C and δ15N signatures of CPOM,
plankton and benthic algae was used to estimate their relative importance to major
consumers (Phillips, 2001; Phillips & Gregg, 2001). At most sites, however, a two-

Food webs in arid zone rivers
13
source linear mixing model based on δ13C signatures of CPOM and benthic algae was
used (Bunn, Davies & Kellaway, 1997; Phillips, 2001).
Results
Production and respiration
The shallow littoral margins of the larger waterholes were characterised by a
conspicuous, albeit, restricted band of epipelic filamentous algae, composed largely of
blue-green algae (Schizothrix), green algae (Spirogyra and Oedogonium), and some
diatoms (e.g. Navicula, Melosira). This algal zone had consistently high rates of both
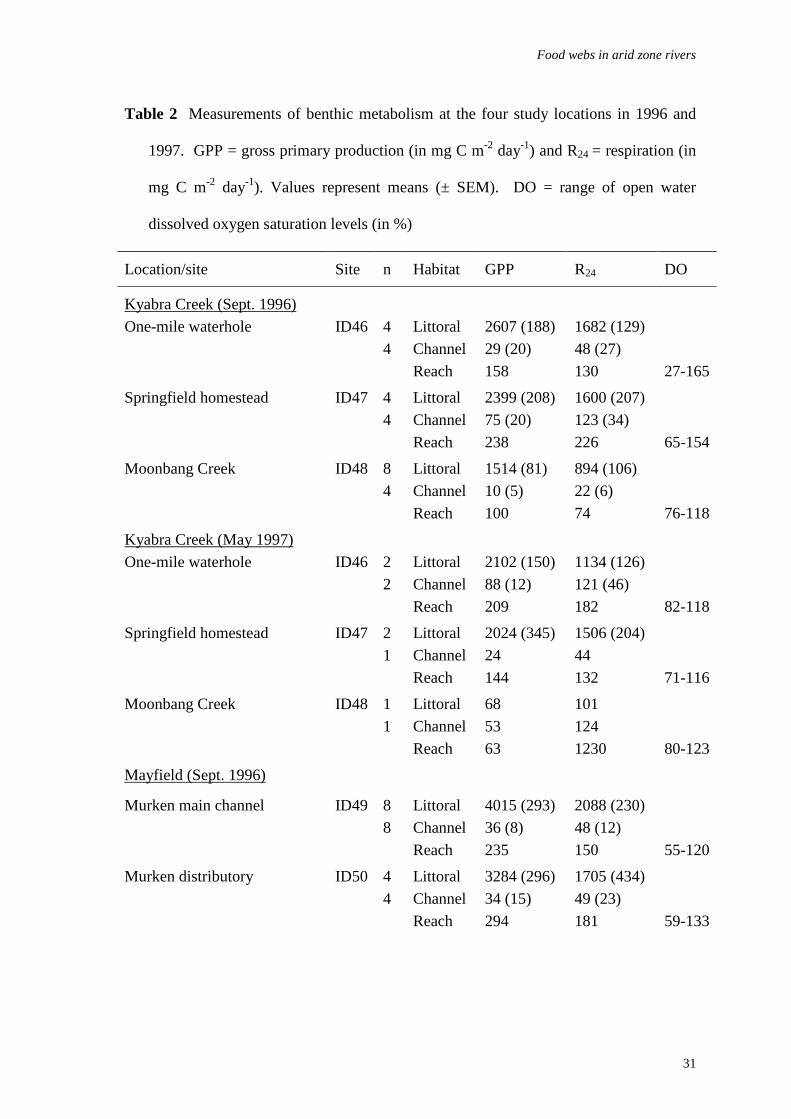
gross primary production (GPP) and respiration (R24) (Table 2). The high rates of R24 are
undoubtedly the result of high algal respiration, rather than from decomposition of
terrestrial organic matter, given the observed strong relationship between GPP and R24
(r2 = 0.87, p < 0.001).
In contrast, benthic production and respiration in the deeper channels were both
low (< 90 mg C m2 day-1) (Table 2). The P/R ratios (GPP: R24) showed that the littoral
region of the waterholes was a major producer of carbon (i.e. P/R>1) whereas the mid-
channel habitat was a net consumer (P/R<1). Even though the shallow littoral zone of
the permanent waterholes represented between 4 % (Tanbar) and 8 % (Barcoo) of the
total benthic habitat, primary production was so high that almost all of the waterholes
were producers of organic carbon. There was little inter-annual or site differences in
benthic metabolism and by far the most variation in the ANOVA model was explained
by habitat differences (Table 3).

Food webs in arid zone rivers
14
Stable isotope analysis of the food web
Benthic algae were consistently more 13C-enriched than any other primary sources,
though showed considerable variability across the sites (-14.5 to -24.2 ‰, Table 4).
Mean 13C values for benthic algae at the Mayfield sites were also slightly less enriched
in the May 1997 sampling period compared to September 1996. Because of this
variability, and the potential flow-on effects to the food web, comparisons of source and
consumer signatures were only relevant within each site and sampling time. For this
reason, all isotope data are presented for each site within location (Tables 4 and 5) and
data from only one site per location has been plotted (Figure 2). In the latter, stable
isotope values for primary sources are shown as boxes delineated by 1 SE around the
mean and consumers are shown as individual values or as means 1 SE, where n = 3.
Samples of benthic coarse particulate organic matter (CPOM) had similar mean 13C
values (-26.8 to -32.7‰) to leaves collected from riparian trees (-26.6 to -31.6 ‰) and
showed less variability in 15N values (Tables 4 & 5). Benthic fine particulate organic
matter (FPOM), however, was typically 3-6 ‰ more 13C-enriched than CPOM,
suggesting a potential contribution of algal carbon (Table 4, Fig. 2).
Zooplankton samples were also relatively 13C-depleted compared with benthic algae
with similar values to terrestrial organic matter (Table 4) but were more 15N-enriched,
considerably so at some sites (e.g. Mayfield and Barcoo-Welford, Table 5).
Unfortunately, no plankton samples were collected at the Kyabra sites.
Mussels and clams had carbon isotope signatures consistent with either a terrestrial
carbon or plankton source (Table 4, Fig. 2), but were considerably 15N-depleted in
comparison to the latter (Table 5). Although snails at Murken waterhole had carbon and
nitrogen isotope signatures consistent with a benthic algal source in September 1996

Food webs in arid zone rivers
15
(Tables 4 & 5), this was not the case in May 1997 (Figure 2b). However, other
conspicuous invertebrate consumers, such as shrimp (Macrobrachium) and crayfish
(Cherax), had 13C values similar to benthic algae at all sites (Fig. 2, Table 4). The
single pooled sample of chironomid larvae collected from leaf packs in Murken
waterhole showed the most unusual carbon isotope signature of any of the consumers
and was substantially more 13C-depleted than any of the measured primary sources (13C
= -54.7 ‰).
Of the fish, Barcoo grunter (Scortum), spangled perch (Leiopotherapon),
yellowbelly (Macquaria) and catfish (Neosilurus) had relatively 13C-enriched mean
carbon isotope signatures, consistent with an ultimate dietary source of benthic algae
(Fig.2, Table 4). Similarly, the two samples of turtle shell (Emydeura) also reflect a
long-term feeding history on a 13C-enriched diet (Table 4). Other species of fish had
carbon and nitrogen isotope values intermediate between the plankton and benthic algal
signatures. Bony bream (Nematalosa) were consistently the most 13C-depleted of the
fish collected.
Liver and bone samples of predatory fish (Macquaria and Leiopotherapon) were
13C-depleted compared with muscle tissue (1.8 0.5 ‰ and 1.5 0.2 ‰, respectively).
However, stable nitrogen isotope signatures of liver and bone samples showed no
obvious difference to muscle tissue (0.2 0.3 ‰ depletion and 0.4 0.2 ‰ enrichment,
respectively).
Relationships between stable carbon isotope values of consumers and primary sources
If benthic algae were an important source of organic carbon for the aquatic food web, we
would expect the variability in 13C values of consumers to track the observed variability

Food webs in arid zone rivers
16
in algal signatures. This was certainly the case for Macrobrachium where approximately
60% of the observed spatial and temporal variation in 13C values was explained by
variation in algal 13C values (r = 0.77, p < 0.001). A similar result was observed for
predatory insects (r = 0.82, p = 0.012) and, to a lesser extent, rainbow fish (r = 0.46, p =
0.045) and crayfish (r = 0.44, p = 0.058). It is worth noting that there was comparatively
little spatial or temporal variation in the carbon isotope values of terrestrial sources of
organic carbon (leaves and CPOM) and no significant relationships were observed with
the 13C values of any consumer.
Relationships between stable carbon and nitrogen isotope values of consumers
Most species of fish showed a significant negative relationship between δ13C and δ15N
values (Table 6). In other words, 13C-depleted individuals were also 15N-enriched, and
were more similar to zooplankton isotope signatures than to CPOM or FPOM (Fig. 2).
One possible explanation for this pattern is that it is size related and the 13C-depleted
individuals were also larger and feeding higher in the food web (hence the elevated δ15N
values). This was not the case, however, and only one species (Retropinna) showed a
positive relationship between body size and δ15N values (Table 6). Of particular interest,
was the observed negative relationship between δ15N values and body size for bony
bream (Nematalosa), which suggests that larger individuals of this species were feeding
lower in the food web. Larger individuals of this species and rainbowfish (Melanotaenia)
also tended to be more 13C-enriched (Table 6).

Food webs in arid zone rivers
17
Contribution of benthic algal carbon to consumer biomass
Estimates derived from the mixing models suggest an important contribution of benthic
algal carbon to the biomass of most consumers, irrespective of whether the second
primary source endpoint was zooplankton or terrestrial organic matter (Table 7). On
average, most consumers derived at least 50% of their biomass from benthic algae and
several species derived more than 70% across the study sites. The most notable
exception was bony bream (Nematalosa) which, on average, derived only 25% of its
biomass carbon from benthic algal sources. It is worth noting that the estimated
contribution of algal carbon to consumer biomass in Murken sites was lower in
September 1996 compared with May 1997 (Table 7).
At those sites where it was possible to estimate the relative contributions of all three
sources, using 13C and δ15N values, it was apparent that terrestrial organic carbon was
the other major contributor to the isotope signatures of crayfish (Cherax), shrimp
(Macrobrachium) and catfish (Neosilurus spp). In contrast, zooplankton was the other
major contributor to the diets of predatory fish, especially spangled perch
(Leiopotherapon), Barcoo grunter (Scortum), yellowbelly (Macquaria), rainbowfish
(Melanotaenia) and smelt (Retropinna). The isotope signatures of bony bream
(Nematalosa) appeared to reflect a more even contribution of the three sources.
Discussion
Productivity of waterholes
Despite the extremely high natural turbidity, rates of benthic primary production along
the littoral margins of waterholes of the Cooper Creek system were among the highest
recorded for streams and rivers (Davies 1994; Bunn et al., 1997; Lamberti & Steinman,
Food webs in arid zone rivers
18
1997). Similar high rates have been observed in other desert systems with sparse
riparian cover (e.g. Lamberti & Steinman, 1997; Mulholland et al., 2001), but were
unexpected in systems characterised by such high turbidity. The 13C-enriched carbon
isotope signatures of benthic algae, a likely consequence of carbon limitation, are also
indicative of the high rates of primary production (Hicks, 1997; Finlay, 2001). Benthic
primary production was, however, clearly light limited to a narrow littoral band with
very low rates recorded in the deeper water. Marked diel variation in dissolved oxygen
saturation in the open surface water also suggests high rates of phytoplankton
production, though this was not directly measured. Even without factoring in this
pelagic component, habitat-weighted estimates of whole system metabolism based on
littoral and deeper channel measurements of benthic GPP and R24 suggest that almost all
waterholes were autotrophic.
Role of benthic algae in the food web
Despite its limited extent, this ‘bathtub ring’ of benthic algae was clearly the most
important source of organic carbon for consumers in waterholes. Many consumers had
13C-enriched isotope signatures reflecting a major contribution of this source to their
biomass carbon. Furthermore, isotope signatures of some abundant consumers,
particularly Macrobrachium, tracked observed spatial and temporal variability in benthic
algal carbon signatures. Although the utility of carbon isotope tracing techniques has
been questioned in the study of freshwater ecosystems because of the lack of a single
consistent algal endpoint value (France, 1996), such relationships between consumers
and algal isotope values provide compelling evidence of the importance of this source
(Finlay, 2001). This is especially true when it is clear that similar relationships do not
exist for other potential primary sources.

Food webs in arid zone rivers
19
The small differences observed between the stable isotope signatures of slow to fast
turnover tissues (bone, muscle, liver) in predatory fish are more likely to reflect
differences in tissue composition (e.g. lipid concentrations) rather than changes in diet
isotope signatures over time (Hesslein et al., 1993). For example, the observed
difference between liver and muscle tissue is similar to that observed in fish reared on
commercial feed (Pinnegar & Polunin, 1999). If anything, we would expect slow
turnover tissue samples of fish caught in May 1997 to be more 13C-enriched, given the
higher 13C values for algae and consumers in September 1996 at the Murken waterhole.
It is also worth noting that the two samples of turtle shell also reflect a long-term feeding
history on a 13C-enriched source.
Importance of other primary sources
Carbon isotope data alone could not resolve the identity of the other major primary
source that contributes to the biomass carbon of consumers with intermediate isotope
values. The 13C values of terrestrial organic matter (CPOM and riparian leaves) were
too similar to those presumed for phytoplankton. Nitrogen isotope signatures were,
however, useful given the marked difference in 15N values between these sources. Most
predatory fish showed a strong negative relationship between 13C and 15N values,
implying that those with 13C-depleted signatures were more 15N-enriched, consistent with
a 15N-enriched plankton endpoint. Estimates derived from the three-source mixing
model, using 13C and 15N data (Phillips & Gregg, 2001), also support this view.
Furthermore, conventional diet analysis of fish subsequently collected from these
waterholes confirms a significant contribution of zooplankton (especially calanoid
copepods) to the diet of predatory fish species (unpublished data).

Food webs in arid zone rivers
20
It is interesting to note that the size-related shifts in 13C and 15N values of bony
bream (Nematalosa), reflect a decreased dependence on plankton and a greater
dependence on benthic algae and terrestrial detritus as they get larger. Dietary studies of
this widespread and abundant species have previously suggested such a shift from
planktivory to benthic detrital feeding (Allen, 1989). Similarly, rainbowfish
(Melanotaenia) appear to shift to feeding from plankton to benthic sources as they get
larger.
Due to the high concentrations of suspended sediment, we were unable to filter and
isolate samples of phytoplankton and, as a consequence, were unable to identify the
ultimate carbon source for zooplankton. We assume that phytoplankton were the likely
source for several reasons. The surface water of waterholes in the mid channel was
often supersaturated in dissolved oxygen during the day and O2-depleted during the late
evening, suggesting high rates of primary production in the water column that cannot be
attributed to the narrow benthic algal zone alone. Conspicuous blooms of phytoplankton
also have been observed on the water surface of waterholes on occasions when there was
little wind.
Despite the extensive riparian interface along the network of anastomosing channels
and distributaries and the renowned floods that inundate vast floodplains, terrestrial
carbon did not make an important contribution to the food web in the waterholes.
Although it was the likely other endpoint for crayfish (Cherax), shrimp
(Macrobrachium) and catfish (Neosilurus), the mixing model data suggest only about
20% of the biomass carbon of these species was of terrestrial origin. The relative high
15N values of the former two groups suggest that this contribution could be of animal
origin rather than directly from leaf litter inputs. More sedentary primary consumers,

Food webs in arid zone rivers
21
such as mussels (Velesunio) and clams (Corbiculina) were the only taxa with isotope
signatures consistent with a terrestrial (C3) source.
There is also evidence that some organic carbon from riparian leaf litter makes its
way into the aquatic food web via methanogenic and methanotrophic bacteria. The
extremely 13C-depleted values for chironomid larvae (13C = -54.7 ‰) collected from
benthic leaf packs in Murken waterhole can only have arisen through assimilation of
methanotrophic bacteria (see Bunn & Boon, 1993; Jones et al. 1999; Kiyashko, Narita &
Wada, 2001). This cannot be a major microbial pathway, however, because no higher
order consumers show 13C-depletion beyond that of terrestrial organic matter and
plankton.
Models of ecosystem processes in large rivers
These findings are clearly not consistent with predictions of two of the previously
proposed ecosystem models of large rivers. There is no evidence of a strong dependence
of the aquatic food web on direct riparian inputs to waterholes or from the many
thousands of kilometers of small distributaries and anabranch channels upstream, as
might be predicted by RCC (Vannote et al., 1980). Furthermore, despite the high
turbidity in the waterholes, autotrophic production was still very high.
Similarly, episodic floods may re-distribute large amounts of terrestrial organic
matter between the floodplain and the channels but this material does not find its way
into the aquatic food web, as would be predicted by the FPC (Junk et al. 1989). This is
not to say that floods are unimportant to other aspects of aquatic ecosystem function (e.g.
the supply and mobilization of nutrients), the provision of extensive wetland habitat for
waterbirds or to recruitment and dynamics of populations of fish and invertebrates

Food webs in arid zone rivers
22
(Walker et al., 1995; Kingsford, Curtin & Porter, 1999; Puckridge, 1999; Roshier,
Robertson & Kingsford, 2002).
There is a growing body of evidence that microalgae are major drivers of aquatic
food webs in large floodplain river systems, despite their apparently minor contribution
to the total organic carbon pool compared with aquatic macrophytes and terrestrial
sources (Forsberg et al., 1993; Hamilton, Lewis, & Sippel 1992; Thorp et al., 1998;
Benedito-Cecilio et al., 2000; Lewis et al., 2001; Thorp & Delong, in press). Previous
models of ecosystem processes in large rivers have understated this component of the
system and instead over-emphasized the potential importance of longitudinal and lateral
inputs of terrestrial carbon. Factors that influence the distribution, composition and
production of microalgae (e.g. flow regulation, nutrients, light, toxic metals, herbicides,
stock trampling) are likely to have a much greater impact on the food web of large river
ecosystems than variations in the terrestrial carbon pool. These findings have important
implications for the way in which we manage and protect large river ecosystems.
Acknowledgments
None of the work presented here would have been possible without the support and
hospitality of the Windorah community. In particular, we wish to thank Dr Bob Morrish
for his original invitation to visit the Cooper and take part in a workshop on the likely
consequences of a controversial proposal to irrigate cotton. Sandy Kidd, Bill Scott and
Bob Morrish kindly allowed us to work on their properties and provided a wealth of
information on the local waterholes and flow history of the Cooper. The Queensland
Environmental Protection Agency gave us permission to access sites located in Welford
National Park and permits to collect. We thank Peter Fielder and the Queensland

Food webs in arid zone rivers
23
Department of Natural Resources and Mines Flow data for the provision of unpublished
flow data for the Thomson and Barcoo Rivers. Chris Marshall and Bronwen Morrish
provided assistance in the field, Sam Capon assisted with the preparation of the map of
our sites and Thorsten Mosisch identified the algal samples. Fiona Balcombe, Christine
Fellows, Stephen Hamilton and Fran Sheldon provided comments on early drafts of this
manuscript. This project was funded by a grant from Land and Water Australia (GRU17)
to SB as part of the National Riparian Lands Program.
References
Allen G.R. (1989) Freshwater Fishes of Australia. Neptune City: T.F.H. Publications.
Anon. (1998) Draft Water Management Plan for Cooper Creek - Information paper.
Department of Natural Resources Queensland. pp 57. ISBN 07242 7278.
Bailey V. (2001) Western streams water quality monitoring project. Department of Natural
Resources and Mines, Queensland, Australia. pp 42. ISBN 0 7345 1798 X.
Bayley P.B. (1995) Understanding large river-floodplain ecosystems. Bioscience, 45, 153-
158.
Bender M., Grande K., Johnson K., Marra J., Williams P.J.L., Sieburth J., Pilson M.,
Langdon C., Hitchcock G., Orchardo J., Hunt C., Donaghay P. & Heinemann K.
(1987) A comparison of four methods for determining planktonic community
production. Limnology and Oceanography, 32, 1085-1098.
Benedito-Cecilio E., Araujo-Lima C.A.R.M., Forsberg B.R., Bittencourt M.M. &
Martinelli L.C. (2000) Carbon sources of Amazonian fisheries. Fisheries
Management and Ecology, 7, 305-315.
Food webs in arid zone rivers
24
Boston H.L. & Hill W.R. (1991) Photosynthesis-light relations of stream periphyton
communities. Limnology and Oceanography, 36, 644-656.
Bott T.L., Brock J.J., Cushing C.E., Gregory S.V., King D. & Petersen R.C. (1978) A
comparison of methods for measuring primary productivity and community
respiration in streams. Hydrobiologia, 60, 3-12.
Boyland D.E. (1984) Vegetation Survey of South West Queensland. Botany Bulletin No.
4, Queensland Herbarium.
Bunn S.E. & Boon P.I. (1993) What sources of organic carbon drive food webs in
billabongs? A study based on stable isotope analysis. Oecologia, 96, 85-94.
Bunn S.E. & Davies P.M. (1999) Aquatic food webs in turbid, arid zone rivers:
Preliminary data from Cooper Creek, Queensland. In: Free-flowing river: the
ecology of the Paroo River (Ed. R.T. Kingsford), pp 67-76. New South Wales
National Parks and Wildlife Service, Sydney. ISBN 0 7313 6022 2.
Bunn S.E., Loneragan N.R. & Kempster M.A. (1995) Effects of acid washing on stable
isotope ratios of C and N in seagrass and penaeid shrimp: implications for food web
studies using multiple stable isotopes. Limnology and Oceanography, 40, 622-625.
Bunn S.E., Davies P.M. & Kellaway D.M. (1997) Contributions of sugar cane and
invasive pasture grass to the aquatic food web of a tropical lowland stream. Marine
and Freshwater Research, 48, 173-179.
Bunn S.E., Davies P.M., & Mosisch T.D. (1999) Ecosystem measures of river health and
their response to riparian and catchment degradation. Freshwater Biology, 41, 333-
345.
Capon S.J. (1998) Zonation of Floodplain Vegetation on a Flood Frequency Gradient In
a Variable, Arid-zone Catchment. Honours Dissertation, Faculty of Environmental
Sciences, Griffith University, Queensland, Australia.

Food webs in arid zone rivers
25
Cummins K.W. (1974) Structure and function of stream ecosystems. Bioscience, 24,
631- 641.
Davies B.R., Thoms M.C., Walker K.F., O’Keefe J.H. & Gore J.A. (1995) Dryland
rivers: their ecology, conservation and management. In: The Rivers Handbook, Vol.
2 (Eds P. Calow & G.E. Petts), pp. 484-511. Blackwell Scientific, Oxford.
Davies P.M. (1994) Ecosystem ecology of upland streams of the northern jarrah forest,
Western Australia. Unpublished PhD thesis, Department of Zoology, The University
of Western Australia. pp 236.
Feminella J.W., Power M.E. & Resh V.H. (1989) Periphyton responses to invertebrate
grazing and riparian canopy in three northern California coastal streams. Freshwater
Biology, 22, 445-457.
Finlay J.C. (2001) Stable-carbon-isotope ratios of river biota: implications for energy
flow in lotic food webs. Ecology, 82, 1052-1064.
Forsberg B.R., Araujo-Lima C.A.R.M., Martinelli L.A., Victoria R.L. & Bonassi J.A.
(1993) Autotrophic carbon sources for fish of the central amazon. Ecology, 74, 643-
652.
France R.L. (1996) Carbon-13 conundrums: limitations and cautions in the use of stable
isotope analysis in stream ecotonal research. Canadian Journal of Fisheries and
Aquatic Sciences, 53, 1916-1919.
Gibling M.R., Nanson G.C. & Maroulis J.C. (1998) Anastomosing river sedimentation in
the channel country of central Australia. Sedimentology, 45, 595-619.
Graetz R.D. (1980) The potential applications of LANDSAT imagery to land resource
management in the Channel Country. CSIRO Division of Land Resources
Management, Perth, Western Australia. Technical Memo 80/2.
Gregory S.V., Swanson F.J., McKee W.A. & Cummins K.W. (1991) An ecosystem
perspective of riparian zones. Bioscience, 41, 540-551.

Food webs in arid zone rivers
26
Hamilton S.K., Lewis W.M.J. & Sippel S.J. (1992) Energy sources for aquatic animals in
the Orinoco River floodplain: evidence from stable isotopes. Oecologia, 89, 324-
330.
Hesslein R.H., Hallard K.A. & Ramlal P. (1993) Replacement of sulfur, carbon, and
nitrogen in tissue of growing broad whitefish (Coregonus nasus) in response to a
change in diet traced by 34S, 13C, and 15N. Canadian Journal of Fisheries and
Aquatic Sciences, 50, 2071-2076.
Hicks B.J. (1997) Food webs in forest and pasture streams in the Waikato region, New
Zealand: a study based on analyses of stable isotope of carbon and nitrogen, and fish
gut contents. New Zealand Journal of Marine and Freshwater Research, 31, 651-
664.
Johnson B.L., Richardson W.B. & Naimo T.J. (1995) Past, present, and future concepts
in large river ecology. Bioscience, 45, 134-141.
Jones R.I., Grey J., Sleep D. & Arvola L. (1999) Stable isotope analysis of zooplankton
carbon nutrition in humic lakes. Oikos, 86, 97-104.
Junk W.J., Bayley P.B. & Sparks R.E. (1989) The flood pulse concept in river-floodplain
systems. In: Proceedings of the international large river symposium. (Ed. D.P.
Dodge) Canadian Special Publications Fisheries and Aquatic Sciences, 106, 110-
127.
Kingsford R.T., Curtin A.L. & Porter J.L. (1999) Water flows on Cooper Creek
determine ‘boom’ and ‘bust’ periods for waterbirds. Biological Conservation, 88,
231-248.

Food webs in arid zone rivers
27
Kiyashko S.I., Narita T. & Wada E. (2001) Contribution of methanotrophs to freshwater
macroinvertebrates: evidence from stable isotope ratios. Aquatic Microbial
Ecology, 24, 203-207.
Knighton A.D. & Nanson G.C. (1994) Flow transmission along an arid zone
anastomosing river, Cooper Creek, Australia. Hydrological Processes, 8, 137-154.
Knighton A.D. & Nanson G.C. (2001) An event-based approach to the hydrology of arid
zone rivers in the Channel Country of Australia. Journal of Hydrology, 254, 102-
123.
Lambert W. (1984) The measurement of respiration. In: A Manual on Methods for the
Assessment of Secondary Productivity in Fresh Waters. Second Edition. (Eds J.A.
Downing and F.H. Rigler), pp 413-468. IBP Handbook 17, Blackwell Scientific
Publications, Oxford.
Lamberti G.A. & Steinman A.D. (1997) A comparison of primary production in stream
ecosystems. Journal of the North American Benthological Society, 16, 95-103.
Lewis W.M., Hamilton S.K., Rodríguez M.A., Saunders III J.F. & Lasi M.A. (2001)
Foodweb analysis of the Orinoco floodplain based on production estimates and
stable isotope data. Journal of the North American Benthological Society, 20, 241-
254.
Morton S.J., Short J. & Baker R.D. (1995) Refugia for Biological Diversity in Arid and
Semi-Arid Australia. Biodiversity Series, Paper No. 4. Report to the Biodiversity
Unit of the Department of Environment, Sport and Territories. Canberra, Australia.
Mulholland P.J., Fellows C.S., Tank J.L., Grimm N.B., Webster J.R., Hamilton S.K.,
Martí E., Ashkenas L., Bowden W.B., Dodds W.K., McDowell W.H., Paul M.J. &
Peterson B.J. (2001) Inter-biome comparison of factors controlling stream
metabolism. Freshwater Biology, 46, 1503-1517.

Food webs in arid zone rivers
28
Phillips D.L. (2001) Mixing models in analyses of diet using multiple stable isotopes: a
critique. Oecologia, 127, 166-170.
Phillips D.L. & Gregg J.W. (2001) Uncertainty in source partitioning using stable
isotopes. Oecologia, 127, 171-179.
Pinnegar J.K. & Polunin N.V.C. (1999) Differential fractionation of 13C and 15N
among fish tissues: implications for the study of trophic interactions. Functional
Ecology, 13, 225-231.
Puckridge J.T. (1999) The role of hydrology in the biology of dryland rivers. In: Free-
flowing river: the ecology of the Paroo River (Ed. R.T. Kingsford), pp 97-112. New
South Wales National Parks and Wildlife Service, Sydney. ISBN 0 7313 6022 2.
Puckridge J.T., Sheldon F., Walker K.F. & Boulton A.J. (1998) Flow variability and the
ecology of large rivers. Marine and Freshwater Research, 49, 55-72.
Rosenfeld J.S. & Roff J.C. (1992) Examination of the carbon base in southern Ontario
streams using stable isotopes. Journal of the North American Benthological Society,
11, 1-10.
Roshier D.A., Robertson A.I. & Kingsford, R.T. (2002) Responses of waterbirds to
flooding in an arid region of Australia and implications for conservation, Biological
Conservation, 106, 399-411.
Thorp J.H. & Delong M.D. (1994) The riverine productivity model: an heuristic view of
carbon sources and organic matter processing in large river ecosystems. Oikos, 70,
305-308.
Thorp J.H. & Delong M.D. (in press) Dominance of autochthonous autotrophic carbon in
food webs in heterotrophic rivers. Oikos

Food webs in arid zone rivers
29
Thorp J.H., Delong M.D., Greenwood K.S. & Casper A.F. (1998) Isotopic analysis of
three food web theories in constricted and floodplain regions of a large river.
Oecologia, 117, 551-563.
Thoms M.C. & Sheldon F. (2000) Water resource development and hydrological change
in a large dryland river: The Barwon-Darling River, Australia. Journal of
Hydrology, 228, 10-21.
Vannote R.L., Minshall G.W., Cummins K.W., Sedell J.R. & Cushing C.E. (1980) The
river continuum concept. Canadian Journal of Fisheries and Aquatic Sciences, 37,
130-137.
Walker K.F., Sheldon F. & Puckridge J.T. (1995) An ecological perspective on large
dryland rivers. Regulated Rivers: Research and Management, 11, 85-104.
Winer B.J. (1971) Statistical Principles in Experimental Design. Second Edition.
McGraw Hill, Tokyo.

Food webs in arid zone rivers
30
Table 1 Locations of the study sites sampled in the Cooper Creek catchment, in
September 1996 and May 1997. Waterhole widths, taken at each site, and total
lengths are also included
Location/site Site Latitude Longitude Length
(km)
Width
(m)
Kyabra Creek
One-mile waterhole ID46 S 25º50.4 E 143º03.0 1.1 60
Springfield homestead ID47 S 25º49.2 E 143º02.4 2.5 70
Moonbang Creek ID48 S 25º52.5 E 143º04.3 0.6 15
Mayfield
Murken main channel ID49 S 25º25.2 E 142º44.1 4.3 90
Murken distributary ID50 S 25º25.8 E 142º43.8 0.8 20
Mayfield waterhole ID51 S 25º26.4 E 142º43.2 0.6 35
Tanbar
Tanbar homestead ID52 S 25º50.4 E 141º54.6 9.0 210
Tanbar bottom crossing ID53 S 25º52.2 E 141º52.8 9.0 80
Tanbar distributary ID54 S 25º49.2 E 141º58.2 1.4 80
Barcoo-Welford
Rosehill waterhole ID55 S 25º10.8 E 143º15.6 4.5 80
Shearing shed ID56 S 25º11.4 E 143º12.0 4.6 100
Barcoo homestead ID57 S 25º10.8 E 143º20.4 1.7 70
Food webs in arid zone rivers
31
Table 2 Measurements of benthic metabolism at the four study locations in 1996 and
1997. GPP = gross primary production (in mg C m-2 day-1) and R24 = respiration (in
mg C m-2 day-1). Values represent means (± SEM). DO = range of open water
dissolved oxygen saturation levels (in %)
Location/site Site n Habitat GPP R24 DO
Kyabra Creek (Sept. 1996)One-mile waterhole ID46 4 Littoral 2607 (188) 1682 (129)
4 Channel 29 (20) 48 (27)Reach 158 130 27-165
Springfield homestead ID47 4 Littoral 2399 (208) 1600 (207)4 Channel 75 (20) 123 (34)
Reach 238 226 65-154
Moonbang Creek ID48 8 Littoral 1514 (81) 894 (106)4 Channel 10 (5) 22 (6)
Reach 100 74 76-118
Kyabra Creek (May 1997)One-mile waterhole ID46 2 Littoral 2102 (150) 1134 (126)
2 Channel 88 (12) 121 (46)Reach 209 182 82-118
Springfield homestead ID47 2 Littoral 2024 (345) 1506 (204)1 Channel 24 44
Reach 144 132 71-116
Moonbang Creek ID48 1 Littoral 68 1011 Channel 53 124
Reach 63 1230 80-123
Mayfield (Sept. 1996)
Murken main channel ID49 8 Littoral 4015 (293) 2088 (230)8 Channel 36 (8) 48 (12)
Reach 235 150 55-120
Murken distributory ID50 4 Littoral 3284 (296) 1705 (434)4 Channel 34 (15) 49 (23)
Reach 294 181 59-133

Food webs in arid zone rivers
32
Mayfield (May 1997)
Murken main channel ID49 4 Littoral 2584 (560) 1555 (306)4 Channel 34 (6) 47 (8)
Reach 162 122 55-120
Murken distributary ID50 2 Littoral 2512 (44) 1617 (167)2 Channel 17 (5) 54 (9)
Reach 142 132 25-195
Mayfield waterhole ID51 1 Littoral 3457 24621 Channel 67 89
Reach 238 208 48-124
Tanbar (May 1997)
Tanbar homestead ID52 1 Littoral 2836 21021 Channel 42 49
Reach 154 131 57-121
Tanbar bottom crossing ID53 1 Littoral 1322 13311 Channel 15 30
Reach 80 95 76-118
Tanbar distributory ID54 1 Littoral 2202 16341 Channel 45 52
Reach 153 131 80-127
Barcoo-Welford (May 1997)
Rosehill waterhole ID55 1 Littoral 1860 10281 Channel 40 62
Reach 131 110 67-115
Shearing shed ID56 1 Littoral 1550 9851 Channel 26 49
Reach 102 96 70-119
Barcoo Homestead ID57 1 Littoral 1669 885Channel 19 40Reach 151 108 58-137

Food webs in arid zone rivers
33
Table 3 Three-way ANOVA on GPP, R24 and P/R by location (n = 4), year (n = 2) and
habitat (n = 2). GPP and R24 data were normalized by log (ln) transformation and
P/R data were arcsine transformed. *** p<0.001, ** p<0.01, * p<0.05. The
magnitude of treatment effects is shown as a percentage
Parameter Ln (GPP) Ln (R24) Arcsine P/R
Habitat (H) 52.5*** (56%) 55.8*** (62%) 49.5*** (51%)
Location (L) 16.7* (4%) 12.6 (2%) 11.7 (2%)
Year (Y) 49.6* (5%) 19.9 (3%) 17.6 (3%)
H*L 5.4 (<1%) 5.1 (<1%) 5.9 (<1%)
L*Y 5.6 (<1%) 5.0 (<1%) 5.7 (<1%)
L*H 7.1 (<1%) 6.6 (<1%) 4.8 (<1%)
H*L*Y 1.2 (<1%) 1.1 (<1%) 1.3 (<1%)
Residual 0.8 (33%) 0.7 (31%) 0.9 (42%)

Food webs in arid zone rivers
34
Table 4 Stable carbon isotope ratios (‰) of sources and consumers from three sites at each of four locations in the Cooper Creek system.
Mean values (1 SE, n = 3 to 5 samples) or individual values are presented (where n < 3). Data from sites indicated with an asterisk are
plotted in Fig 2. (Turtle from Kyabra Creek was collected in September 1996)
Mayfield 1996 Mayfield 1997 Tanbar 1997 Kyabra Creek 1997 Barcoo-Welford 1997Sample type ID49 ID50 ID51 ID49* ID50 ID51 ID52* ID53 ID54 ID46 ID47* ID48 ID55 ID56* ID57
Riparian vegetation -28.5(0.2)
-26.6 -28.9(0.2)
-29.7(0.5)
-31.6(0.5)
-29.3(0.5)
-27.0(2.3)
-27.8(1.7)
-28.7(0.4)
-29.8(0.4)
-28.6(0.2)
-28.8(0.8)
-27.0(1.2)
-27.9(0.9)
-28.0(2.1)
CPOM -26.8(0.1)
-27.0(0.5)
-26.8(0.2)
-32.6(0.4)
-29.5(0.1)
-27.8(0.1)
-28.8(0.5)
-28.4(0.2)
-29.3(0.5)
-28.8(0.5)
-32.7(0.9)
-29.5(0.8)
-30.4(0.8)
-32.5(0.9)
-31.9(0.9)
FPOM -26.3(0.1)
-26.2(0.3)
-25.6(0.3)
-25.9(0.2)
-26.6(0.1)
-25.4(0.5)
-26.0(0.1)
-24.7(0.2)
-25.8(0.1)
-26.2(0.1)
-26.4(0.2)
-25.7(0.3)
-23.9(0.1)
-25.8(0.1)
-25.1(0.6)
Littoral algae -16.0(0.8)
-19.0(0.8)
-14.5(0.1)
-18.9(0.5)
-18.9(0.6)
-17.0(1.6)
-22.5(1.3)
-22.1 -20.5(0.2)
- -24.0(1.4)
-24.2(0.1)
- -17.7(1.1)
-19.3(0.3)
Zooplankton - - - -28.5(0.7)
- - -30.7(0.3)
-31.1 -27.2(0.7)
- - - - -34.2(0.4)
-
Notopala -15.4(0.1)
-18.5(1.0)
-23.4-23.6
-25.5-27.2
-26.1-28.8
-26.2 - - - -26.9-26.7
-24.3-25.1
- - - -
Velesunio - - - -30.9 -30.4 - - - - -27.5(0.1)
-27.8 - - - -
Corbiculina - - - - -32.1 - - - - -28.5 -29.0 - - - -
Chironomidae -54.7
Invertebrate predators - -21.4 -22.0 - - - -26.8 -25.9 - -24.4 -25.3 -25.4 - - -22.9

Food webs in arid zone rivers
35
Macrobrachium -18.7(0.5)
-19.6(0.8)
-18.0(0.3)
-19.6-21.2
-20.6(0.1)
-20.6(0.4)
-22.4-23.7
-22.0-24.2
-22.8(0.8)
-23.2(0.3)
-22.0(0.3)
-25.5(0.5)
-21.3-19.8
-23.6(0.2)
-21.3(0.6)
Cherax -21.4-20.7
-20.6-20.5
-19.2 - - - - - - -23.1(0.5)
-22.0;-21.3
-23.8(0.2)
- -23.9(0.5)
-22.3(0.5)
Nematalosa -26.8 - -25.7 -24.9(1.0)
-25.1(1.5)
-24.8(1.0)
-27.1-26.7
-28.7-26.4
-27.6(1.1)
-27.5(0.2)
-30.3(0.4)
-30.9(1.3)
-24.7(2.3)
Leiopotherapon - - - -21.0-19.5
-21.0-22.1
-20.6 - - - -24.2(0.6)
-21.3 -23.1(0.5)
- -23.1(0.3)
-
Melanotaenia - -24.1 - -22.3-22.1
-21.6-19.7
-20.2 -21.8-21.5
-23.3(0.5)
-22.5(0.2)
-22.5-22.6
-23.4 -22.9 - -24.4 -22.3
Ambassis - - - - -23.9 - - - - -24.9-26.5
-25.2 -28.4 - -26.0-25.6
-26.0(0.2)
Neosilurus spp. - - - -22.5(0.5)
-21.3(1.2)
-23.4-21.4
-24.0-19.0
-21.7 -19.9 - -23.4-21.6
-27.3 - - -
Retropinna -24.7-24.9
-24.4-24.7
-23.9-24.5
-19.9 - - - -26.2-25.8
-25.7 -25.2-25.2
-25.7 -25.7-25.9
- -26.8 -
Macquaria -26.5-19.3
-21.5-21.7
-24.3-26.2
-20.8(0.5)
-20.1-21.7
- -20.2-21.4
- - - -25.2 -28.2 - -23.0-23.5
-
Scortum -23.2 -23.0 -26.1 -22.2(2.5)
-21.8 -21.3-23.1
-21.3(1.2)
-22.3(0.6)
-20.8-21.8
- - - - - -
Hypseleotris -23.3-22.3
-21.3(0.5)
-21.3-21.5
- - - - - - -25.0-25.2
-25.7(0.3)
- - -29.4-27.5
-26.5-24.9
Gambusia -21.3 - - - - - -24.0-24.4
-23.8(0.4)
- - - - - -19.8 -21.6
Emydeura -22.4 -19.3

Food webs in arid zone rivers
36
Table 5 Stable nitrogen isotope ratios (‰) of sources and consumers from three sites at each of four locations in the Cooper Creek system.
Other details as per Table 4
Mayfield 1996 Mayfield 1997 Tanbar 1997 Kyabra Creek 1997 Barcoo-Welford 1997
Sample type ID49 ID50 ID51 ID49* ID50 ID51 ID52* ID53 ID54 ID46 ID47* ID48 ID55 ID56* ID57
Riparian vegetation 7.0(0.8)
7.7 4.1(0.9)
10.0(2.7)
9.8(3.0)
8.7(2.1)
7.7(3.0)
11.5(1.5)
8.2(0.9)
2.7(1.4)
4.3(1.6)
9.6(2.4)
5.5(2.2)
11.2(0.8)
7.7(0.8)
CPOM 7.2(0.2)
7.6(0.4)
8.1(0.4)
7.7(0.8)
7.5(0.4)
7.3(0.9)
7.9(0.8)
9.9(0.4)
6.9(0.6)
8.4(0.4)
8.9(0.4)
6.1(0.3)
8.8(0.3)
8.9(0.5)
7.3(0.4)
FPOM 6.2(0.4)
7.6(0.3)
7.5(0.4)
7.7(0.5)
7.5(0.5)
7.6(1.4)
8.7(0.2)
8.6(0.8)
8.0(1.0)
7.0(0.3)
7.6(0.4)
5.1(0.4)
8.2(0.9)
9.7(0.8)
8.6(0.9)
Littoral algae 7.8(0.4)
8.6(0.7)
8.9(0.2)
6.4(0.3)
6.9(0.7)
5.9(0.6)
4.9(1.1)
7.8 6.5(0.7)
- 9.4(0.4)
9.6(1.4)
- 11.2(1.9)
9.6(0.3)
Zooplankton - - - 17.3(1.3)
- - 12.5(0.5)
10.7 10.7(0.4)
- - - - 14.8(0.4)
-
Notopala 8.5(0.1)
9.4(0.2)
9.09.2
9.812.5
9.911.5
11.0 - - - 9.98.4
9.511.1
- - - -
Velesunio - - - 12.7 12.0 - - - - 9.5(0.3)
11.6 - - - -
Corbiculina - - - - 12.6 - - - - 8.9 11.5 - - - -
Chironomidae 12.6
Invertebrate predators - 9.7 12.2 - - - 6.6 6.6 - 9.2 10.1 9.2 - - 9.4

Food webs in arid zone rivers
37
Macrobrachium 12.9(0.2)
12.6(0.4)
12.1(0.1)
12.913.2
13.2(0.3)
14.2(0.2)
10.110.9
9.910.7
10.4(0.2)
12.2(0.1)
13.3(0.2)
12.1(0.4)
14.914.6
12.5(0.2)
11.9(0.2)
Cherax 11.512.2
11.613.0
12.3 - - - - - - 11.0(0.4)
12.611.5
12.0(1.1)
- 11.7(0.3)
11.0(0.7)
Nematalosa 14.2 - 14.3 11.6(1.4)
12.0(1.9)
10.1(0.8)
8.49.5
10.09.7
11.2(1.1)
13.3(0.3)
12.9(0.4)
12.9(0.3)
10.8(0.3)
Leiopotherapon - - - 11.18.6
12.314.3
8.8 - - - 13.7(0.2)
11.5 13.6(0.4)
- 13.7(0.2)
-
Melanotaenia - 12.2 - 12.212.1
12.510.3
8.4 9.59.5
9.9(0.6)
10.5(0.5)
11.511.7
12.4 12.3 - 13.0 12.1
Ambassis - - - - 12.6 - - - - 11.6 12.7 14.4 - 12.312.9
12.0(0.2)
Neosilurus spp. - - - 9.5(0.8)
10.1(1.7)
8.78.3
9.97.1
9.1 7.4 - 12.311.2
13.0 - - -
Retropinna 14.614.9
14.313.4
15.014.8
8.4 - - - 12.112.1
12.2 13.813.7
14.4 13.814.4
- 12.8 -
Macquaria 15.315.1
14.113.2
14.715.2
12.2(0.7)
10.611.0
- 11.912.2
- - - 13.9 14.2 - 15.615.0
-
Scortum 13.1 13.3 14.2 8.4(1.0)
11.9 11.411.7
9.9(1.2)
10.7(0.8)
7.28.3
- - - - - -
Hypseleotris 14.413.4
14.1(0.2)
13.914.4
- - - - - - 12.312.6
13.3(0.1)
- - 12.112.5
11.812.2
Gambusia 14.8 - - - - - 10.110.0
10.8(0.2)
- - - - - 14.4 13.6
Emydeura 15.0 14.5

Food webs in arid zone rivers
38
Table 6 Pearson correlation coefficients and associated levels of significance for
relationships between stable carbon and nitrogen isotope values (‰) of fish, and
isotope values (δ13C, δ15N) and fish size (cm). *p < 0.05, **p < 0.01, ***p < 0.001,
n = sample size
13C vs 15N Size vs 13C Size vs 15NFish species
n r r r
Ambassis 10 -0.58* 0.24 0.43
Nematalosa 26 -0.51** 0.43* -0.58**
Leiopotherapon 18 -0.77*** -0.01 0.31
Retropinna 10 -0.78** -0.48 0.66*
Macquaria 11 -0.64* 0.28 0.16
Neosilurus 16 -0.63** -0.11 0.49*
Scortum 14 -0.48* 0.18 0.01
Hypseleotris 9 0.33 0.37 0.08
Melanotaenia 17 -0.32 0.61** -0.11
All fish 134 -0.45*** - -

Food webs in arid zone rivers
39
Table 7 Percent benthic algal contribution to consumer diets at four locations in the
Cooper Creek catchment using either a two-source mixing model (δ13C, CPOM) or
three-source model (δ13C and δ15N, CPOM and plankton). Fractionation coefficients
used were adjusted for estimated trophic position ( a = 0.2 and 1.5 ‰, b = 0.3 and 3.0
‰, c = 0.4 and 4.5 ‰, for δ13C and δ15N, respectively). The range of values
represents variation among sites and mean values (and 1 SE) have been calculated
using the estimated benthic algal contribution at each site
Consumer Murken1996
Murken1997
Tanbar KyabraCreek
Barcoo-Welford
Mean %(1 SE)
Notopala a 29-100 13-44 - 90 - 56 (15)
Macrobrachium b 69-88 64-87 62-89 70-100 58-82 78 (4)
Cherax b 51-76 - - 100 56-74 82 (11)
Predatory insects 37-66 - 27-35 70-82 69 55 (8)
Nematalosa b 0-8 25-54 0-43 0-56 9-55 25 (7)
Leiopotherapon c - 62-88 100 61-65 80 (6)
Melanotaenia c 30 62-80 64-100 100 52-73 75 (6)
Ambassis c - 49 - 13-82 43-44 46 (11)
Neosilurus c - 46-74 100 34-100 - 78 (9)
Retropinna c 15-25 85-90 16-53 62-76 36-42 43 (9)
Macquaria c 11-62 76-83 100 17-82 60-64 56 (10)
Scortum c 2-44 48-73 82-100 - - 60 (11)
Hypseleotris c 33-66 - - 76 24-46 48 (8)
Gambusia c 46 - 66-78 - 79-85 68 (6)

Food webs in arid zone rivers
40
Fig. 1 Map of the Cooper Creek catchment showing study sites. Location and site
names are as in Table 1.
Fig. 2 13C and 15N values of primary sources and consumers from one site at each of
four locations within the Cooper Creek catchment in October 1997: (a) Springfield
homestead (ID47), Kyabra Creek; (b) Murken waterhole (ID49), Mayfield; (c) Tanbar
waterhole (ID52), Tanbar; and (d) Shearing shed waterhole (ID56), Barcoo-Welford.
Potential primary sources are plotted as boxes + 1 SE about the mean, where n = 3
samples. Consumers plotted are: insect predators (Anisoptera and Dytiscidae),
snails (Notopala), mussels (Velesunio), shrimps (Macrobrachium),crayfish
(Cherax), and fish (Nematalosa, Leiopotherapon, Melanotaenia, Ambassis,
Neosilurus, Retropinna, Macquaria). Means are plotted with 1 SE as boxes for
sources and bars for consumers, where n = 3 to 5 samples.

Food webs in arid zone rivers
41
3030 0 60 km
Tanbar Springfield
Mayfield
Welford NP
Thomson River
Barcoo River
Windorah
Lake Eyre
CooperCreek

Food webs in arid zone rivers
42
4
6
8
10
12
14
16
18
CPOMFPOM
Algae
(a)
-35 -30 -25 -20 -154
6
8
10
12
14
16
18
CPOM FPOM
Algae
Zooplankton
(c)
13C (‰)
15 N
(‰)
Zooplankton
CPOM FPOMAlgae
(b)
-30 -25 -20 -15
CPOMFPOM Algae
Zooplankton
(d)