arid zone hydrology recent developmentsunesdoc.unesco.org/images/0000/000031/003121eo.pdfarid zone...
TRANSCRIPT

ARID ZONE HYDROLOGY
RECENT DEVELOPMENTS
’ by H: SCH0:ELLER
Professor of hydrogeology and Geology in the Bordeaux Faculty of Science
U N E S C O

ARID ZONE RESEARCH-XI1 ARID ZONE HYDROLOGY RECENT DEVELOPMENTS

In the same series:
I. Reviews of Research on Arid Zone Hydrology. 11. Proceedings of the Ankara Symposium on And Zone Hydrology. 111. Directory of Institutions Engaged in Arid Zone Research (in English only). IV. Utilization of Saline Water, Reviews of Research. V. Plani Ecology, Proceedings of the Montpellier SymposiumlEcologie vdgaale, actes du collogue
de Montpellier. VI. Plant Ecology, Reviews of Research/&dogie vdgdtale, compte rendu de recherches. VII. Wind and Solar Energy, Proceedings of the New Delhi SymposiumlEnergie solaire et hlienne,
actes du colloque de New DelhilEnergia solar y iolica, Actas del coloquio celebrado en N m a Delhi.
VIII. Human and Animal Ecology, Reviews of ResearchlEcologie humaine e6 animale. compte rendu de recherches.
IX. Guide Book to Research Data for Arid Zone Development. X. Climatology, Reviews of Research. XI. Climatology and Microclimatology, Proceedings of the Canberra SymposiurnlClimacologie
ei microclimatologie, actes du collogue de Canberra. XII. Arid Zone Hydrology. Recent Developments.
Since 1955 the reviews of research have been published with yellow covers. and the proceed- ings of symposia with grey covers.

Published in 4959 by the United Nations Edmatwnal, Scientijic and Cultural Organisation
Place de Fontenoy, Paris-P Rinted by Imprimerie Chaix
@ Uneaco 1959 Printed in fianca NS. 58/11I. 16/A

F O R E W O R D
NESCO’S Arid Zone programme, drawn up in 1951, was raised to the status of a major project at the ninth Session of the General Conference in 1956. While the U change has brought a substantial increase in the resources granted to the Orga-
nizathn for the promotion of arid zone research specijically by direct support for certain institutions in the region extending from North Africa to the Middle East and South- East Asia, the collection and dissemination of scientijic information provided by studies en arid zone problems remain essential objects.
Eleven volumes have so far been published in the Unesco Arid Zone Research series. They include digests of research on particular subjects such as hydrology, plant ecology, utilization of saline waters, human and animal ecology, and climatology, and the pro- ceedings of symposia on the same subjects arranged under the programme. The present volume is the jirst of a slightly different type of publication in the series
to consist either of sequels bringing existing digests up to date, or of monographs on research in certain jields of special importance but where the extent of the work done does not war- rant fuller treatment.
Since the issue of Reviews of Research on Arid Zone Hydrology and of the Proceed- ings of the Ankara Symposium, there has been considerable progress in hydrology in general and hydrogeology in particular in such branches as the utilization of groundwater, its geochemistry, the utilization of radioactive tracers, etc. Professor Schoeller has agreed, in the presea volume, to discuss the advances and to provide full bibliographical data on the zoritings published since 4952.
In presenting this work to hydrologists and other researchers concerned with arid zone problems, the Unesco Secretariat takes this opportunity of expressing its gratitude to the author and to all those who have supplied him with new information.
C O N T E N T S
Introduction . . . . . . . . . . . . . . CHAPTER I . General remarks on the formation of groundwater reservaland their replenishment and on groundwater resources in arid zones . . Water balance in aquifers . . . . . . . . . . . . Factors operative in the formation of groundwater reserves in and zones . . Groundwater resources . . . . . . . . . . . . .
Natural yield . . . . . . . . . . . . . . Retarded discharge . . . . . . . . . . . . Secular reserves . . . . . . . . . . . . . Usable resources . . . . . . . . . . . . .
Aasessment of natural water resources of very large areas . . .
CHAPTER I1 . Groundwater prospecting and development in arid zones . The situation in the intake area . . . . . . . . . . Effects of water extraction by wells and boring8 . . . . . . . Permissible extraction of sub-surface water. safe yields . . . . .
Withdrawals from permanent storage . . . . . . . . Tapping the 'through-put'-i.e. natural yield-of aquifers . . . Location of web . . . . . . . . . . . . . Relationship between discharge through wells and boring8 and the natural dis- charge of a&Xers . . . . . . . . . . . .
Model water supply and drainage appreciation for an arid region . Critical factors . . . . . . . . . . . Priorities . . . . . . . . . . . . .
Water supply and drainage . . . . . . . . Development of groundwater concentrations and springs . . Utilisation of mountain and submontane groundwater . .
Water storage . . . . . . . . . . . .
. . . .
. . . .
. . . .
. . . .
. . . .
. . . .
. . . .
. . . . CHAPTER I11 . Calculation of permeability and transmissibility from pumping tests by non-equilibrium formulae . . . . . . . . . . Theis's formula . . . . . . . . . . . . . . . . 'Approximate calculation method . . . . . . . . . . . . Boulton's method for wells in water-table aquifers . . . . . . . .
Numerical determination of V . . . . . . . . . . . . Calculationof draw-downin thepumped well . . . . . . . . .
11
13 13 15 21 22 22 22 22 23
24 25 25 27 27 27 28
28 31 32 33 33 34 34 35
36 36 39 41 43 44

Methods allowing for the delayed discharge. representing the balance of the specific yield in free water.tables. or caused by leakance in the case of captive aquifers .
Boulton's method . . . . . . . . . . . . . . . Hantush's method . . . . . . . . . . . . . .
The stage of equilibrium . . . . . . . . . . . . Non-equilibrium (transitory) stage . . . . . . . . . .
CHAPTER IV . Geochemistry of groundwater . . . . . . . . Dissolution . . . . . . . . . . . . . . . . . Water from the main types of rock . . . . . . . . . . . .
In calcareous terrains . . . . . . . . . . . . . . In gypsum and saliferous formations . . . . . . . . . . . Water in contact with marls and clays . . . . . . . . . . Water from sands and ordinary sandstones . . . . . . . . . Water from purely siliceous sands and sandstones . . . . . . . . Water in contact with organic matter . . . . . . . . . . Granite and gneiss . . . . . . . . . . . . . . . Basalts . . . . . . . . . . . . . . . . .
Modifying phenomena . . . . . . . . . . . . . . Reductions . . . . . . . . . . . . . . . . Base exchanges . . . . . . . . . . . . . . . Concentration . . . . . . . . . . . . . . .
Presentation of analyses . . . . . . . . . . . . . . Absolute values and products . . . . . . . . . . . . Relative values . . . . . . . . . . . . . . . Graphs and tables . . . . . . . . . . . . . . .
Collins's comparative table . . . . . . . . . . . The semi-logarithmic graph . . . . . . . . . . . .
The chemical composition of the water in underground strata . . . . . . The progressive changes in chemical composition within a single groundwater body Zonations reflected in the chemical composition of groundwater . . . . . . .
Geological zonation . . . . . . . . . . . . . . Vertical zonation . . . . . . . . . . . . . . . Zonation by climate . . . . . . . . . . . . . . Dry residue . . . . . . . . . . . . . . . Bicarbonates . . . . . . . . . . . . . . . SO, and C1 . . . . . . . . . . . . . . . Ca, Mg. N a . . . . . . . . . . . . . . .
Kounine on the chemistry of water in deserts . . . . . . . . . . Siline-Bektchourine on the build-up of the chemical content of groundwater in arid regions . . . . . . . . . . . . . . . . . .
Stage 1 . . . . . . . . . . . . . . . . . Stage 2 . . . . . . . . . . . . . . . . . Stage 3 . . . . . . . . . . . . . . . . . .
Some general geochemical features of deserts and semi.deserts . . . . . .
CHAPTER V . Typrs of tTacu. microcirculation of water in aquifers. radioactive tracers . . . . . . . . . . . . . . . .
Characteristics of an ideal tracer . . . . . . . . . . . . The varieties of non-radioactive tracer . . . . . . . . . . .
Solid tracers . . . . . . . . . . . . . . . . Soluble chemical tracers . . . . . . . . . . . . . Tracer dyes . . . . . . . . . . . . . . . .
Circulation of water in rocks . . . . . . . . . . . . . The variety of trajectories . . . . . . . . . . . . . The general trajectory . . . . . . . . . . . . . .
44 44 47 50 50
54 54 56 56 57 57 58 58 58 59 59 60 60 61 63 68 68 68 69 69 69 72 73 74 74 74 76 77 77 79 79 80
80 83 83 83 83
85
85 86 86 86 87 89 89 90
Deviant trajectories . . . . . . . . . . . . . . Direct trajectories . . . . . . . . . . . . . . .
Turbulent flow trajectories . . . . . . . . . . . . Laminar flow trajectory in a capillary . . . . . . . . . . Trajectory in a sand of unlimited lateral dimensions . . . . . . .
Adsorption and retention of tracers . . . . . . . . . . . . Methods of injecting tracers into aquifers . . . . . . . . . .
Constant input dilution evaluation method . . . . . . . . . Constant input velocity determination method . . . . . . . . Single-shot injection methods . . . . . . . . . . . .
N o adsorption . . . . . . . . . . . . . . . Multiple peaks . . . . . . . . . . . . . . . Adsorption occurring . . . . . . . . . . . . .
Carriers . . . . . . . . . . . . . . . . . . The w e of radioactive tracers . . . . . . . . . . . . .
Usable radioactive tracers . . . . . . . . . . . . .
p and y radiation emitters . . . . . . . . . . . . Isotopes liable to adsorption or to react with water or to rocks . . . . Isotopes not readily adsorbable . . . . . . . . . . .
Methods for the use of radioactive tracers . . . . . . . . . . Experiments in which radioactive tracers have been used . . . . . .
The California Research Laboratory Test . . . . . . . . . Serre-Ponqon Test (France) . . . . . . . . . . . . Tests at Cauterets and Luz (France) . . . . . . . . . . Tests in the pctroliferous formations in Oklahoma (Nowata County) and Kansas (Anderson County), U.S.A. . . . . . . . . . . . Wadi Raiyan test, Libyan Desert . . . . . . . . . . . Research on hydrological balances . . . . . . . . . .
Pure p emitters . . . . . . . . . . . . . .
90 90 90 91 92 94 96 96 97 97 98 98 99 99 99 101 101 102 102 102 104 106 107 108 108
109 112 112
I N T R O D U C T I O N
ATER, especially groundwater, is the key to life in semi-arid and and zonea. There is no question but that in these areas the role of hydrology in particular is W vital and without it all other arid zone research would be pointless.
Since the Ankara symposium in 1952 the discipline has progressed rapidly in every conceivable direction and in all countries. It is impossible to cover all that has been done in a few pages: there is too much
of it and too m any domains are involved; the likely result would be no more than a series of unrewarding thumb-nail sketches. These considerations have led the writer to confine his attention solely to those
questions which are new, least known or previously most seriously neglected. Many subjects, often important, have been deliberately left alone. One such is evapotranspir- ation, which is still too much in its infancy. It is of course a calculable factor in the overall hydrological balance say of entire river basins, but how are w e to determine its significance in the inventories of the separate groundwater concentrations, all of which are different ?
Chapter I deals with one of the basic problems of arid zone hydrology-the circum- stances determining the formation of bodies of groundwater, their replenishment and the water resources they represent.
Chapter I1 covers groundwater prospecting and development, the first being a genuine scientific operation while the second is impossible without a general study of the region where the groundwater is located and detailed study of special points. These are not tasks to be ventured on casually without a definite programme.
Chapter I11 discusses certain new methods for determining the transmissibility of aquifers. Calculating the yield of aquifers is one of the essential tasks of arid zone hydrogeology but to arrive at the yield the permeability or more accurately the trans- missibility of the aquifers themselves must be known. Undoubtedly one of the best methods for determining transmissibility is from the non-equilibrium discharge of wells and borings. These methods are little known outside the United States of America but could be of immense usefulness.
Chapter IV gives a ge*ral outline of the geochemistry of groundwater, which is of particular importance in arid zones since mineralization and aridity go hand in hand. It shows what gives the water its chemical composition and the changes which occur in stored groundwater, in contact with rocks and through climatic factors.
Lastly, Chapter V deals with the utilization of tracers and particularly radioactive 11

Arid zone hydrology
tracers to determine the direction and velocity of groundwater flow. Three radio- active tracers, brome-82, iodine-131 and tritium, present unquestionable advantages, but a need is becoming felt for tracers with half lives neither of a few days like iodine-131 nor of several years like tritium but of weeks or months. Use of tracers requires a deeper knowledge of the microcirculation of water in rocks. Something on this question has therefore been included.
12

C H A P T E R I
General remarks on the formation of groundwater reserves and their replenishment
and on groundwater resources in arid zones
This chapter gives digests of selected publications on the formation of groundwater reserves and their replenishment and on groundwater resources in arid zones. They have been picked from the numerous studies published in all parts of the world on the criteria firstly of their general relevance and secondly of their special importance for arid regions. A number of conventional studies have been deliberately omitted.
W A T E R BALANCE IN AQUIFERS
The groundwater balance is still usually a nagging question mark in hydrogeology. Yet it is of the first importance since the practical aim of hydrogeology is, finally, to determine the groundwater refiources available for use. It is for that reason that an account of the work of M. A. Velikanovl and B. I. Kudelin [19, 20Ia is called for here. The groundwater balance has an obvious connexion with the water balance which
can be worked out for a river basin, say for one year, and which should incorporate all the variations inherently likely to affect the position. The fluvial water balance covers rainfall, x, and stream run-off, y. The latter however
can be further broken down into above-ground run-off, yr-i.e., surface drainage- and underground run-off, y., from the free groundwater. In addition to the foregoing elements, it is advisable to allow for evaporation,
z (less condensation), and for a value, U, summating all variations in the water reserves, positive or negative, e.g., increase or decrease of the snow-cap, rise or fall of the free water-table, of water levels in rivers, lakes, etc.
However, river basins do not necessarily overlie hydrogeological systems coter- minous with them. Phreatic groundwater reservoirs under an adjacent basin m a y drain into that being surveyed and vice versa, and examples are known to the writer, though it must be admitted that they are not frequent.
The phenomenon is m u c h more common in the case of non-phreatic groundwater at shallow depths and accordingly allowance must be made for the flow of ground- water to or from the basin under study and adjacent basins by including a value f U)#, the plus sign representing outflow from the basin under study to adjacent basins and the minus sign inflow to the first from the second.
1. M. A. Velikanov. Hydrogblagie de la terre, 1948. 2. The figures in brackets refer to the bibliography. page 116.
13

Arid wne hydrology
If there are no deep-lying artesian concentrations, the balance is written:
x = yr +r, + z + 21 + ws On the other hand, if the water balance is worked out for a long period of years, the positive and negative variations end by cancelling out, which considerably simplifies the calculation of the overall water balance by avoiding major uncertainties. The overall water balance should therefore be worked out by taking the average of n years. In that case
and w e get
with % = Yor + Y O 8 + 20 + W",
Y o = Yor + Yo. yo being the total run-off of the stream.
It will happen fairly frequently that w, is negligible but failure to include it auto- matically would be a grave error. It must be checked every time: the extent to which one basin gets its water supplies from groundwater in another is often very large and this frequently occurs in limestone areas, for instance.
Thus the source of the Garonne has its recharge area not on the French but on the Spanish side of the watershed. There is yet another complication. There are cases of river basins with deep-lying
artesian water replenished from and discharging into that basin exclusively. But this water belongs to a hydrological cycle of far greater duration than that of the artesian water at shallow depths, often running to tens or even hundreds of thousands of years. Thus, despite the small area of the Aquitaine basin, the writer has calculated from the permeability and the inclination of the piezometric surface that the time taken for water to pass right through the aquifer is between 25,000 and 30,000 years and water leaving the aquifer today entered it in the W u r m s epoch. Between that epoch and our own there must have been immense fluctuations in the rainfall and logically we should reckon in all of these and all the variations in the artesian discharge. In the case of what is called the Albian artesian horizon in the Sahara, calculations on the same lines put the time taken for water to cover a distance of 300 kilometres at between 500,000 and over a million years. In such cases the balance ought not to be calculated on the basis of an antecedent period of n years, but of a value, N, of geolo- gical time many times greater.
Phreatic and shallow artesian formations are elements in a circulatory system constituting a cycle of brief duration. Deep artesian water, on the other hand, obeys another regimen extending backwards to a much remoter period measurable by the yardstick not of short-term climatic oscillations but of geological change. Obviously, then, separate water balances need to be worked out for these two categories of sub- surface water. The two regimes must be fundamentally independent.
W e thus have to reckon in ya, the artesian run-off, and the variation (xu - %)Sa of the past rainfall on the artesian intake area giving rise to the run-off.
Furthermore, a basin m a y either get artesian water from or lose it to a neighbour- ing basin. We must therefore include the quantity & w,. This gives us the following equation:
z + (.a - 4% = Yr + Ys + Y a + * 21 f w, f wa 14

Formation and replenishment of groundwater reseivea
If w e take a geological number of years, N
And by taking the means over N years we get: 21 = Yl, + R a + Y1a + 21 f W l U f W1s
If there is no communication between one basin and another then
or .I = R I + YIS + YlO + 21
x, = Yl + 21 The foregoing equations should always be taken into consideration when a time, N, of geological magnitude is used. In actual fact however the circulation regime of deep artesian water must be relatively constant. With discharge determined by the differ- ence of elevation between the zone of replenishment and the zones of discharge, and aquifers which are always of great length, it can be reckoned that velocity (i.e., rate of passage through unit cross-sectional area) will be low, due to the feeble gra- dient of the piezometric surface and there will be overspilling at the recharge out- Cropping6 of the aquifer. The amounts of water in the aquifer and discharged from it will therefore remain the same respectively. That being so, it is no longer necessary to take the general mean for a time N but that for the much shorter time n will suffice. In other words the following equation can be used:
xo = Yor + YO8 + Yoa + 20 zt W o a & W O 5 If there is no communication between basins, then
or xo = Yor + YO8 + Yoa + 20
zo = Yo + 20
FACTORS OPERATIVE IN THE FORMATION OF G R O U N D W A T E R RESERVES IN ARID ZONES
Below are outlined, with the present writer’s own amplifications, the general ideas developed by Kunin 1221 on the factors operative in the formation of groundwater reserves in deserts. As far as the first aquifer is concerned, the passage of the water to and into it and its other characteristics are determined essentially by the geogra- phical conditions. As the depth of the horizon increases, the geographical influence becomes progres-
sively slighter, and hence with deep-lying captive water with recharge areas far outaide the desert and travelling underground to it, only minimal desert influences, if any at all, are apparent in either regimen, chemical composition or any other particular. A good example of this is the reservoir in the Lower Continental Cretaceous horizon of the Sahara, known as the Albian formation, which is fed from well outside the desert in the Atlas range. It follows that, to understand the hydrogeological characteristics peculiar to deserts,
our attention must be directed primarily to the groundwater on which the geological conditions exert an influence; as Kunin indicates, that influence is of great practical significance as in many cases any other groundwater present is inaccessible. There are, however, exceptions to the rule: for instance, over most of the Sahara, it is in fact the groundwater at great depths which can most easily be tapped.
15

Arid zone hydrology
Kunin points out that in practice, and speaking very generally, there is no particular which distinguishes deep-lying groundwater from shallow, in other words that which has been affected by dcscrt conditions from that which has not. Obviously, the explanation is that the phenomena are much more complex than
seems to be the case at first sight-a warning to be repeated time and time again in hydrogeology. As w e shall see in the geochemical section of this paper, the chemical concentration in groundwater tends to rise as the depth below the soil surface increases and the deep-lying water in desert regions includes some very highly mineralized types. There is no means of identifying the operative cause of high mineralization, as the chemical characteristics ultimately become the same in every case. In the alluvial plains, consisting of thick deposits of mixed sand and clay sediments,
only the uppermost free formations, usually overlapping, can be regarded as ‘upper horizon’ groundwater. In sub-montane areas, the upper water-bearing horizons com- prehend a whole succession of aquifers, beginning in the eroded uplands and ending in local artesian basins. Thus the distinction between ‘shallow’ and ‘deep-lying’ groundwater is made in
terms of structural, lithological and geomorphological idiosyncrasies. The operative factors in groundwater replenishment in deserts differ widely from
those in all other climatic regions. The difference is determined by the degree to which the individual items on the receipts side of the hydrological balance sheet count towards groundwater replenishment. Thus direct infiltration of rainfall bulks larger in stony deserts than elsewhere but becomes practically nil in argillaceous desert. On the fringes of sand and clay deserts, inhltrations from temporary lakes gain in importance while in sandy deserts accumulated condensations of atmospheric moisture become a leading item. Finally, again from the point of view of the groundwater balance, the outgoings
side in deserts is quite distinctive, as it is in arid regions in general. In contradistinc- tion to non-arid areas, the loss by evaporation from the surface of the water-table via the capillary fringe, which-Kunin asserts-occurs at all depths, following loss of water vapour from the soil to the atmosphere by transpiration, becomes a factor of considerable importance. By way of dustration, Kunin discusses the deserts of Central Asia, where he dis-
tinguishes two geological types: (a) alluvial piedmont plains, usually located in zones of subsidence, below mountains or in marginal table-lands; (b) tectonic plains usually abutting on table-lands. The first type is marked by extremely thick accumulations of uncoagulated sedi-
mentary matter in which phreatic groundwater is found over extensive areas. Zones of replenishment are usually at a considerable distance and salinity is high. Local replenishments play a minimal part in the water balance but from the utilitarian angle they are of special importance as they produce perched bodies of sweet water in regions where the bulk of the water is saline. The second type, the tectonic plain, is distinguished by a complex stratification
of consolidated marine or metamorphic rocks containing numerous water-bearing horizons structurally similar and of small area. The local replenishments are by far the most important with only moderate supplies from a distance. The chemical compo- sition of the water varies widely. It is proposed to adopt N. K. Ghirski’s [17] division of desert and semi-desert ground-
water into two major groups: 1. Water which has infiltrated where desert and semi-desert conditions obtain. 2. Water of which the bulk infiltrates in adjacent non-desert areas and reaches the
Considering more particularly the operative agencies in groundwater recharge actuat- ing in desert areas [17, 291, there are three possibilities: condensation of atmospheric
16
desert or semi-desert area by way of permeable strata.

Formation and replenishment of groundwater reserves
humidity, rainfall, and infiltration of surface water-from perennial streams, lakes, and intermittent streams.
Condensation is an insignificant factor in groundwater recharge. It undoubtedly occurs to some extent in sandstones, fissured rocks, compact porous rocks and boulder or pebble formations, but even under the most favourable geological conditions the amount of water it yields, according to She-Bektchourine and Plotnikov [29], would appear to be the equivalent of no more than about 4-8 mm. of rainfall, and Ghirski [17] himself concedes that replenishment by condensation can be discounted for all prac- tical purposes.
The explanation, as I have myself indicated [27], lies in the part played by the difference in the vapour pressure of atmospheric and soil air respectively. The most favourable conditions for condensation occur in summer when there is an appreciable nocturnal heat-loss from the soil down to the neutral temperature zone so that the relative vapour pressure of the soil air is at its lowest. However, in arid regions- e.g., Tunisia-soil air vapour pressure is only lower than that of the atmosphere on very few days of the year except near the sea. Ghirski's arguments reach the same conclusion.
Even if, under the most favourable conditions, some condensation takes place in the uppermost level of soil, because of the dryness of the air the water thus condensed will be returned to the atmosphere within a very brief space. Good examples of this phenomenon are provided in desert sand-dunes, e.g., in the Sahara, where in winter the radiation of heat during the night chills the soil sufficiently for condensation to take place and moisten a layer of from a few millimetres to one centimetre in thickness. The moisture evaporates during the first few hours of daylight. 1
Replenishment by rainfall is a significant item only in Northern Hemisphere arid regions where the main rainfall, occurring in winter, coincides with the period of grea- test general humidity. In arid regions with a summer rainy season of exiguous preci- pitations, losses by evaporation reduce the groundwater increment practically to zero. In any event, as I have shown, the factor finally determining the value of rainfall
for groundwater replenishment is the nature of the rock formations. When rain falls on bare surfaces of fissured rock-which are to be found in deserts and semi-deserts -there is no loss by evapotranspiration and fresh supplies of sweet water reach the water-table.
If the permea- bility is fairly high, the water infiltrates rapidly and becomes more or less safe from loss by evaporation ; when permeability is very low, the water lingers in the soil near the surface and is lost entirely by evaporation.
Over and above the phenomena just discussed, other factors to be taken into account (Ghirski) are water movements in the soil in the vapour phase. In summer, when the temperature of the soil surface is at maximum, water vapour moves down from the lower surface of the moist layer of soil created by rain towards the zone of constant temperature, as a result of which the water m a y in due course reach the aquifer. In winter the vapour movement is in the reverse direction. If over the year the amount of water descending exceeds the amount ascending,
the soil moisture from rainfall will provide an addition of sweet water for the phreatic reservoirs. If the quantities are reversed, there will be a net loss of water by evapor- ation from the soil, which will become charged with salts. We have only exiguous data on the importance of rainfall as a replenishment factor.
Discounting the influence of vegetation, it is almost entirely dependent on the nature of the soil and rock formation. Ghirski [17] calculated the amount of direct recharge by rainfall in the regions studied by him as equivalent to 1-2 mm. of rain.
However, with rainfall on true porous rock, infiltration is less easy.
1. H. Scbder, 'L'hydrog6ologie d'une partie de la v d 6 e de la Saoura et d u Grand Erg occidental', Bull. Soc. gkol. (5). t. 15, 1945, p. 563-85.
2 17

Arid zone hydrology
Replenishment by intermittent streams may, in some if not most instances, exceed direct recharge by rain in truly desert areas. The water m a y come either from ordinary freshets filling the dry stream beds or
from floodwater overflowing from them. It is not proposed to linger over the subject of infdtration from freshets, which is
determined essentially by the lithological nature of the stream bed and bank and by the height and duration of the discharge, though it is a fact that under favourable conditions (high permeability, a big head of water and prolonged flow), a large quantity of water can reach the aquifers particularly where shrub vegetation along the stream is scanty so that the amounts lost again by evapotranspiration are negligible.
Floods from the overflow of intermittent streams-wadis-and overland run-off accumulating in natural depressions probably provide a large proportion of the recharge for desert groundwater reservoirs. Ghirski [17] reckons that their contribution amounts to as much as 10 mm. per year against the equivalent of 1 or 2 mm. which he will accept as the direct recharge by rainfall. Similarly, Dubief [14], discussing the Sahara, concludes: ‘Only from that proportion of rainfall evacuated as run-off, with consequent concentration in limited zones in appreciable depth and for a fair space of time, can there be deep infiltration which will replenish the desert water-table.’
Obviously, too, the process depends for its effectiveness on the nature of the terrain. If the permeability is adequate the great bulk of the water indtrated reaches the aquifers, but if permeability is low it is lost again by evaporation with a consequent increase in the salts in the soil.
However, it should not be concluded that groundwater in deserts is replenished exclusively by run-off. If there is enough rainfall and the terrain is sufficiently per- meable, there will, in fact, be direct recharge by precipitation. T o take an example, this is the only explanation of h o w the groundwater in the Western Grand Erg, near Beni Abbes in the Sahara, is fed and of the extremely low salt content (300 mg./litre) of the water.’
Recharge from permanent streams and irrigation works must obviously be taken into consideration when it occurs, as in Egypt and in Central Asia and Kazakstan in the Union of Soviet Socialist Republics [29]. Here irrigation brings about the form- ation of sweet water mounds surmounting the water-table proper but when irrigation is discontinued, the mound flattens out and the underlying saline water soon reappears. As w e shall see again in the chapter on geochemistry, the crucial factor affecting
the replenishment of groundwater concentrations, in combination with low rainfall, is evapotranspiration, which creates a field moisture deficiency in the zone of evapor- ation. As J. Tixeront [30] points out, w e do not possess adequate data on field moisture
deficiency in arid soils. In Tunisia there is a great difference in this connexion between regions with rainfall
above and below 200 mm. per year respectively. In the Oued el K6bir region (annual rainfall 500 mm.) the soil is saturated when
rainfall reaches about 100 mm. In the Sfax region, rainfall reaches 200 mm. In some places there are considerable
depths of soil and the effects of evaporation m a y be felt far down in it which can cause substantial field moisture deficiencies. It should be added that the value of the field moisture deficiency is definitely affected
not only by the evapotranspiration factor but also by the nature of the soil formation. In the Oued el K6bir (Tunisia) region they are mainly clay schists, whereas in the Sfax area sandy formations are a major element. In areas with rainfall below 200 mm. and particularly in deserts, field capacity m a y
1. H. Schdler, Ioc. cit.
18
Formation and replenishment of groundwater reserves
be very low as a result of the slowing down of the processes of soil formation for lack of water ; in fact the bedrock is exposed over vast areas. This turns out very well with limestones and consolidated rock with fissures into which rainfall can sink and be safe from evaporation. This situation is not quite the same with unconsolidated sand formations or clays, which have a high field capacity in themselves, where mere evaporation can cause extremely serious field moisture deficiencies which must be made good before any infiltration down to the water-tables can take place. The chemical composition of the groundwater, in either case, squares with the phenomena described. Thus in the Beni Abbes region of the Western Sahara, water emerging from the
Ordovicien quartzites contains 900 mg. of salts to the litre, of which from 190-320 mg. to the litre are chloride, whereas the water from the unconsolidated Quaternary depo- sits contains a total of 5-7 g. of salts per litre and above, with a chloride content of 18-250 mg. per litre and over.1 In regions with annual precipitations of less than 200 mm., the amounts of rain are
so small that it normally falls on non-saturated ground. However, there are very few stream beds, even in mid-desert in which there is no water movement for years on end, and it must therefore be conceded that either soil saturation has nevertheless been achieved in limit areas of the basin to produce a freshet, or that the main factor in causing the run-off was the intensity of the rainfall, which is in fact the determinant in many cases. Dubief, indeed, maintains that a freshet will occur in the central Sahara when a fall of rain exceeds 5 mm. and its intensity 0.5 mm. This suggests the need to distinguish between two sorts of run-off, i.e., two sorts
of temporary excess over retention capacity, saturation run-off resulting from satur- ation of the soil after prolonged rain and intensity run-off when the rainfall is too intense for the soil's infiltration capacity; both expressions are used by J. Tixeront.
Hence, rainwater cannot infiltrate except in certain cases, when the field moisture deficiency is not too great and when the rain infiltrating is not merely sufficient to make it good. It can thus be seen that in semi-arid and a fortiori in arid regions, there m a y be periodical interruptions in groundwater recharge. Thus there m a y even be several years on end in which only small quantities of rain
can infiltrate, and none of it reach the water-table, either because the showers are too light or because the field moisture deficiency is too great. In that case less goes into the aquifers than flows out, and they empty just as a surface reservoir would do without adequate replenishment. Generally speaking the emptying rate can be expressed by the equation
(1)
p being the groundwater discharge at time t, po the discharge at time to and C the replenishment. The height of the water-table can be related to the discharge by a simple formula
and its variations are accordingly expressed by an equation comparable to 1 above. It is precisely the wide intervals between the periods when the conditions for ground-
water recharge are present and the comparative brevity of those periods which distin- guishes the arid zones.
During these periods, the water sinks below the evapotranspiration zone, and thence easily percolates the rest of the zone of aeration to reach the groundwater, causing the water-table and consequently the discharge to rise sharply.
(q - c) = (qo - c)e-@-Q
This period of replenishment is succeeded by another period of water loss. The process cannot be better illustrated than by the attached graph of the variations
in the water level of a well in the Grambalia Plain in Tunisia (fig. 1).
1. Schoeller. unpublished observations.
19

Arid row hydrolagy
8
1945 1946 1947 1948 1949 195@ 1951 1952 1953 1954 Years.
0 Observed depth. ~ Observed movement. - - - - Aasumed movement. FIG. 1. Displacement of water surface at Larue Well (Tixeront [29J)
In actual practice the picture is not always so clear cut. Undoubtedly, in unconsolidated formations, the period of no recharge m a y be very
long owing to the high field moisture deficiency, but in fissured consolidated rocks they are much shorter, and correspond almost exactly to the periods of rainfall, with evapotranspiration only the most minor factor.
Thus in arid regions it is only in certain years that groundwater in non-fissured aquifers is replenished and there is even more reason to expect the same conditions in the desert. However, with heavily fissured rocks, the recharge situation is easier. To sum up, there is a progressive shift from conditions of almost continuous reple-
nishment in rainy zones to conditions first of periodical and finally of completely irregular recharge in arid regions. But this shift is subject always to the nature of the terrain: the deeper the zone
of aeration, and the lower its permeability, the less marked is the tendency to discon- tinuous recharge.
Even when there are no breaks in the annual replenishment of aquifers, as is possible with extremely fissured formations in arid zones and the rule for all formations in the rainy regions, there are nevertheless periodical variations in the rate of recharge. They mainly follow the fluctuations in climatic conditions, rainfall and evapotranspi- ration, which themselves to some extent exhibit a periodical pattern.
The relationship between the periodicity patterns of recharge to discharge from the aquifers has been worked out by J. and G. Tison [58, 59 and 56, 57 respectively]. Suppose an aquifer’s recharge fluctuate according to a regular cycle with C the rate
of input expressible sinusoidally as:
(1) 2TCt C = C, + e, sin - t0
C, being the mean input rate and c, half the amplitude of an oscillation of period to. The relation of the outflow, q, to the water level is expressed by the equation
m, being the effective porosity, i.e., the storage coefficient and p a constant, assuming naturally, that w e are dealing with a body of groundwater of great length in which dhldx remains constant. We thus get:
C=q+Sm,z dh and C = q + - - s 4 P clt
20

Formation and replenishment of groundwater r8sdntBd
Equations 1 and 2 give us:
q + ; 2 = c m + ( q + - - ; :)_ sin- . 2;t
which gives us, integrated,
q = C, + qm sin . (2r - - - ',) + ( q o - ~ c , + q , to
7 is the time-lag. t0 2xs 2x tOP
7 = - arctg - The usual value of 7 for very lengthy bodies of groundwater is shown to equal one
quarter of the period. In the special case of oscillations, the interval between an oscillation in recharge and the corresponding oscillation in the water-table is about three months.
qo is instantaneous initial input; q m th0 demi-amplitude of the discharge; S p = 3 is the angular coefficient of the variation of discharge with the height
the extent of the groundwater formation;
rndh of the water-table and the effective porosity of the aquifer.
It will be noted that equation 4 comprises three terms: 1. The h s t term, C,, represents the mean flow.
2?a 2. The second term, q m sin (y - - - 'T) 3 can be obtained by offsetting C, sin -
tD by a time value T (the time-lag), and by reducing the ordinates in the ratio a (the damping factor).
3. The thud term, po - C, + q, sin is mainly significant when a water-
table has been lowered appreciably below its natural equilibrium stage. If a time sufficiently long after the draw-down is taken, this term disappears for all practical purposes. As it denotes an exponential decrease in the discharge and an exponen- tial lowering of the water-table, it represents the rate of exhaustion of the ground reservoir mentioned earlier. W e have thus:
to being here the time of commencement.
G R O U N D W A T ER RESOURCES
As has already been pointed out, the practical purpose of hydrogeology is to as~eaa the total available water resources in a region and determine h o w they can be deve- loped.
However, as far as groundwater resources are concerned discrimination must be exercised as they are not identical in type or origin and cannot all be treated in the same way. In papers by N. A. Plotnikovl and Bogomolov and Plotnikov [6] groundwater
1. N. A. Plotnikov. G. N. Bogomolov. G. M. Kernenski, 'Classification of Groundwater Resources for Total Supply and Methods of Calculation' in: Siline-Bektchourine, Special Geology. Mdoscow. Gosgeolizdat, 1946.
21
Arid zone hydrology
supplies are classified under four heads: natural yield resources, retarded discharge resources, secular reserves and usable resources.
Natural yield is the spontaneous discharge of a groundwater reservoir in the untapped state.
There are two types of practical procedure for arriving at the discharge: 1. By Darcy’s law from the movement of the water in the actual reservoir by deter-
mining either the gradient and the Darcy coefficient or the field velocity sub-surface water and the porosity.
2. From borings and wells, by determining either the coefficient of permeability by Thiem’s method (or preferably Theis’s method) and the hydraulic gradient, or the unit discharge of the aquifer by calculation of the radius of influence.
Retarded discharge resources. By this term Plotnikov means all those quantities of water accumulating in the water-bearing horizon during recharge periods, e.g., in spring after the melting of the snows, or when there are heavy falls of rain. The retarded discharge resources are held in the zone of natural oscillation of the phreatic surface. If W, is the volume of the thickness of earth between the highest and lowest levels
of the water-table and p the effective porosity, the retarded discharge resources are given by the equation
Q, = P W D
Secular reserves. These consist of the amount of water in the aquifer below the zone of oscillation of the water-table or, in the case of confined aquifers, of the total amount of water in the horizon. They are the amount of water which could be obtained by draining the aquifer dry.
Taking p as the free porosity and V as the volume of a confined aquifer or the volume of the saturated section of a surface aquifer the long-term reserve is represented by
Q = pV.
Usable resources. These are the quantities of water obtainable for supply purposes from water-bearing horizons by extraction installations. To calculate the usable resources QI the natural yield Qo above the extraction
perimeter is determined and also the plan Qn of the natural yield passing below the extraction perimeter, when
Q1 = Q6 - Qn For confined water, the Russians use the method of ‘regional cones of depression’,
a term introduced by Plotnikov. H e considers that in the majority of cases drops ill artesian pressure are the result of water extraction from a series of regional borings- hence regional water extraction and regional cones of depression or draw-downs.
The depth and shape of a regional cone of depression are determined not only by the amount of water extracted but also by the surfaces of the zones where the borings are made. According to Plotnikov the greatest draw-down takes place in the central area of
an artesian region of water extraction and m a y be determined by the equation
Q. S=- 1000
in which S is the regional draw-down in metres at the central point of the regional devclop- ment;
22

Formatwn and replenishment of groundwater reserves
Q is the regional discharge of artesian water in cubic metres per day; and U is the specific regional depression, i.e. the lowering of the water level per 1,000 cubic metres per day of water extracted over the whole region.
Working from the earlier equation this gives us: 1000 s Q=-
U
ASSESSMENT OF NATURAL W A T E R RESOURCES OF Y E R Y LARGE AREAS
Of all the types of water resources enumerated, the most important is the natural yield. In a permanent cycle of groundwater movement and replenishment, only this element should be taken into account in reckoning the usable resources. Kudelin [19, 20, 211 has laid down some principles for its calculation on a regional basis. The methods of hydrogeological prospection and localized testing used for calculating
the natural yield of restricted areas are not readily applicable in determining the natu- ral yield of an extensive territory.
The best method is to take the stream hydrographs and effect a break-down to determine what proportion of the stream discharge is supplied by underground run-off, the latter representing the groundwater resources of the basin. This procedure has given satisfactory results in the Union of Soviet Socialist Repub-
lics. Thereafter the groundwater balance equations dealt with above are applied. With these methods maps can be plotted of the long-term water balance for exten-
sive regions. Obviously the special structural and hydrogeological features should also be taken into account as pointers. Such maps would comprise not three isopleths (as on modern maps) but five:
Precipitations X,. Run-off Y,. Evaporation Z,. Infiltration to deep-lying aquifers + W,. Artesian run-off (recharge to streams) in a river basin - W,.
While these methods give a regional estimate of water resources not only for free but also for artesian formations, they clearly do not obviate the necessity of detailed hydrogeological prospection and experiment, for which they are no sort of substitute when it is a matter of resolving problem8 of local water supplies.
23

C H A P T E R I 1
Groundwater prospecting and development in arid zones
Finding and using groundwater reservoirs which discharge through springs presents no difficulty from the point of view of hydrodynamics and the process of harnessing these consists simply in improving the points of egress of the water. This m a y often be difficult technically but it rarely gives rise to any dislocation of the general hydraulic syatem within the reservoir. The position is not the same when subsurface water is extracted by wells or borings.
In that case consideration must be given to all the essential factors affecting the degree of disorganization of the reservoir’s regimen and arising from water extraction at points which are not after all points of natural discharge. A knowledge of all these factors is of primary importance for interpreting water-table levels noted after the start of extraction from wells or borings and for estimating future developments.
It will emerge from what follows that the key factors determining the effect of well extraction are: (a) the characteristics of the replenishment supplies; (b) the distance of wells from the recharge zone; (c) the distance of wells from the natural discharge zone ; (a) the character of each well’s cone of depression. Only that groundwater which is in motion is of practical importance. An aquifer
in which there is no movement can be dismissed from consideration since absence of movement means that there is no recharge and ultimately exploiting this water would simply amount to using up a non-replaceable reserve.
Hence the gradient of the piezometric surface is of considerable importance, as much so as the permeability or transmissibility of the aquifer, and both factors- gradient and transmissibility/permeability-are given equal weight in Darcy’s formula. The velocities most usually recorded are from a few dozen to a few hundred metree
per year in phreatic formations; in some artesian reservoirs, they are in most casea lower still and by a considerable amount, e.g., two to three metres per year in the Palaeocene sands of the Aquitaine basin and half a metre per year in the so-called Albian horizon in the Sahara. A further consideration also needs to be allowed for, namely the disturbance of the
groundwater regimen by: (a) oscillations arising from the seasonal variations in recharge; (b) oscillations of long duration due to the alternation of series of dry and wet years; (c) oscillations of duration measurable on the geological time-scale, such as those which affected the Quaternary formations.
Other short-term disturbances due to variations in atmospheric pressure, earth tides or any other cause, with no effect on the question of recharge, will be disregarded.
Subject to the significant fluctuations mentioned, it can be taken that groundwater
24

Groundauater prospecting and development
reservoirs are more or less in dynamic equilibrium, i.c. they discharge as much water as they receive. Any alteration in groundwater discharge by well extraction, or in replenishment
by recharge or evapotranspiration, will interfere with the natural cycle of movement in the aquifer.
Extra withdrawals of groundwater from ‘improved’ springs or wells will either reduce the flow from the other points of natural discharge or will necessitate an increase in the supplies to the aquifer. Any decrease or increase in inflow will produce a cor- responding decrease or increase in the discharge at the natural outlets.
THE SITUATION IN THE INTAKE AREA
The regular replenishment m a y derive from: rainfall, influent streamwater, or water of infiltration arriving indirectly from another aquifer. In the normal way insufficient allowance is made for the third form of recharge.
However, it cannot be left out of consideration, particularly when extraction lowers the piezometric surface of the groundwater. It occurs if the aquifer tapped has others alongside, above or below it and in contact with it over a certain area, when the loss of head in it reacts on these and causes them to discharge water into it. Even when a subjacent or supejacent aquifer is separated from that being tapped by an imper- meable stratum, the loss of head causes water to sweat through the positive or nega- tive confining bed. However low the latter’s permeability, the amount of additional water thus reaching the tapped reservoir m a y be a far from negligible fraction of its replenishment supplies since the yield per unit area must be multiplied by the total surface of the confining bed.
T w o types of replenishment situation require to be contemplated: 1. The intensity of the annual or seasonal phenomena effecting the recharge is such
that the quantities of water available in a given period exceed what the aquifer can absorb in that period: having filled up completely, it accordingly overflows, to form boggy patches at intake areas and resurgent overflow springs elsewhere. It is thus possible to raise the discharge of the aquifer by tapping it lower down,
i.e., the extraction of groundwater can be increased beyond the amount of the natural terminal discharge.
2. The intensity of the seasonal or annual replenishment phenomena is such that quantities are below what the aquifer can absorb. In this case a hydrodynamic eqdibrium is created by the gradient of the piezometric surface decreasing so that the discharge equals the recharge.
The actual replenishment here is a function of the amount of rainfall reaching the soil or seepage from streams, to its rate of descent through the soil after inatration and to the extent of the soil moisture deficiency caused by evapotranspiration. In this case it is impossible to raise discharge above its original figure unless the
amounts of water reaching the intake area can be increased. Any natural increase in discharge could only come about through the loss of head in the aquifer tapped causing an inflow from another aquifer or seepage through the confining strata.
EFFECTS OF W A T E X EXTRACTION B Y W E L L S A N D BORINGS
W h e n water is pumped from a well or discharges from an artesian boring, a cone of depression is created which spreads-be it remembered-to the outer limits of the aquifer. However, there is a lapse of time before the limits are reached. Theis’s equation,
25

Arid wone hydrology
with A the draw-down in metres at any point, Q the yield of the well in cubic metres per occond, and T the coefficient of transmissibility in cubic metres per second per metre, demonstrates that during the transitional period in which the cone is still spreading outwards, its horizontal dimensions are independent of the yield extracted. If the yield is doubled, the draw-down at any point is doubled. But there is no corresponding increase in the cone’s diameter, its spread being determined exclusively by the properties of the aquifer and by the time factor.
It is extremely important to bear in mind that, while the cone of depression is still spreading, that is to say, until the limits of the aqui€er are reached, no new water cycle equilibrium-i.e., balance between inflow and outflow-becomes established for the groundwater outside the cone of depression. All that is actually happening is that withdrawals are being made from the aquifer’s
water reserves. The new equilibrium only occurs when the cone of depression reaches the zones of recharge and natural discharge.
The speed of propagation of the cone is inversely proportionate to the coefficient of storage capacity, S. In free groundwater, S = n x 10-1, usuallycorresponding, broadly speaking, to the specific yield. The spread of the cone is then very slow and a long time is required for it to reach the edges of the aquifer. Only after this lapse of time can the groundwater achieve its new equilibrium. In confined formations the coefficient of storage capacity no longer corresponds
to the specific yield but to the aquifer’s compressibility and to the dilatation of the water. This means that the values of S are always extremely small, in the neighbour- hood of 10-3, 10-4 or 10-5. Hence the cone extends very rapidly, anything from 100 to 10,000 times faster than with free groundwater, and very quickly attains the limits of the aquifer, enabling the new equilibrium to be reached comparatively early and a new circulation regime to take shape.
It will be helpful, at this point, to give an idea of the rates of propagation of cones of depression. In an unconfined aquifer of transmissibility T = 1.25 x m.31sec. andstorage
coefficient 0.2, the spread of the cone for time elapsed as shown in the ‘free ground- water’ column below, gives a very slow rate of travel. On the other hand, in a confined horizon of transmissibility T = 1.25 x 10⁻³ m.a/sec. and storage Coefficient S = 1 x lo-‘ the rate of spread of the cone is m u c h higher.
Spread of the cone of depression in metres:
1 min. 1 hr. 1 day 10 daya 100 rluys 1 000 days
Free groundwater 0.91 7.11 34.8 110 348 1100 Confined horizon 41 318 1558 4930 15580 49300
Modifications in the cone of depression take place both when it reaches the recharge zone, when it is affected by the inflow of water at the point, and on reaching the zone of discharge, through the stoppage or decrease of flow from the natural outlets. If the rate of pumping does not exceed the rate of recharge or the rate of flow of
water out of the aqui€er, the cone will become stable concurrently with the attainment of the new water balance in the aquifer.
If the pumping rate is higher than this, the volume of groundwater shrinks; the piezometric surface sinks steadily lower and the wells or borings begin to draw on the accumulated reserves which are of only limited duration.
26

Groundwater prospecting and development
PERMISSIBLE EXTRACTION OF SUBSURFACE WATER, SAFE YIELDS
The question thus arises as to what quantities of subsurface water it is proper to extract and what is the m a x i m u m quantity, the ‘safe yield’, above which there would be a risk of draining the aquifer dry. As has been pointed out, when water is extracted from underground reservoirs by
wells or borings, the initial withdrawals amount to inroads on the accumulated reserves and only thereafter is a proportion of the normal flow through the aquifer captured. W e should therefore consider first the question of the preliminary withdrawals of water from permanent storage and then that of normal exploitation on a sustained yield basis.
Withdrawals from Permanent Storage
The position differs according as the formation is phreatic or confined. In a confined formation, the loss in permanent storage is represented by the initial
drop in pressure plus the effect of compression of the aquifer through an increase in the effective pressure of the overburden on the confining stratum corresponding to the internal pressure loss. However, as rock is relatively incompressible, the loss due to the second factor is minimal. On the other hand, the high speed of propaga- tion of the depression cone means that only a short time is required to exhaust the reserve.
Nevertheless the amount of water thus released is not as negligible as might be thought at first sight. Supposing the storage coefficient to be 10-4, a pressure drop of 10 m. of water will give a volume of 10-3 m.s or 1 litre/m.s of the water-bearing SUI- face, say 1,000,000 m.3 for a normal formation with a surface area of 1,000 km.2. Sprea- ding these withdrawals over a year would give a yield of 2,700 m.a/day or 310 litreslsec. With phreatic formations the amount of water lost to the reserves is consideribly
greater as it equals the effective porosity multiplied by the volume of that part of the aquifer lying between the new and old piezometric surfaces. The storage coeffi- cient based on effective porosity m a y easily reach 0.20 and even with a phreatic forma- tion one tenth the size of the artesian formation instanced, say 100 km.2, lowering the piezometric surface by no more than 3 m. will mean a loss of 60,000,000 m.3 of water from the permanent storage.
However as the cone of depression only propagates very slowly, the withdrawals from the reserve supplies are spread over a long period without appreciably affecting the general groundwater regime.
Tapping the ‘ Throughput’-i.e., Natural Yield-of Aquifers
It follows from the foregoing that the stage at which the drawings are on the ‘through- put’ proper of the formation is reached early with artesian horizons but only very slowly (often many years later) with phreatic water.
The fact of getting an initial bonus of extractible water must not be allowed to engender false ideas about the subsequent possibilities of the reservoir: the position is simply that a substantial non-replaceable reserve has been expended. This aspect of the problem of groundwater exploitation cannot be too strongly stressed.
Once the new regimen has reached stability, no amount can be extracted from the formation in excess of its normal flow.
The safe yield must therefore be determined, which is in fact the normal flow of the reservoir. It is difficult to arrive at this from the area of the recharge surfaces, which can never be determined direct with sufficient precision; accordingly the best method of estimating the flow is from the gradient of the piezometric surface, and transmissi- bility and width of flow cross-section of the aquifer which are more readily calculable.
27

Arid wne hydrology
However, there are two types of normal flow to be taken into consideration: 1. The original discharge, before any artificial abstraction of water. 2. The ‘post-tapping’ discharge, which m a y be greater than the original discharge as
a result: (a) of increased infiltration in the recharge area of water-if any-formerly lost by overflow run-off in that area; (b) of the lowering of the piezometric surface eliminating the losses by evapotranspiration which occurred when the original water-table was near enough to the soil surface for water to be extracted in sub- stantial quantities by plant roots; (c) of the increased pressure difference between the exploited horizon and its neighbours created by the reduction of pressure in the former causing an inflow of water from those connected with it and in addition lateral seepage from parallel beds and seepage through upper or lower confining strata.
Thus it is sometimes advantageous to plan for the extraction of more water from an seer than its original discharge, so as to recover the quantities which might other- wise be lost by resurgent overflow and by evaporation and to draw on neighbouring horizons for extra water.
Obviously, however, the safe yield must be recalculated on the new basis so that it is not exceeded.
Locaion of Wells
The remaining question for consideration is that of the best arrangements for exploit- ing the underground reservoir.
Clearly, the first factor to be taken into consideration is the rate of pumping, but subject to that there is everything to be said for dispersing the extraction points so as to avoid concentrating draw-down too exclusively in a single area: it needs to be spread as widely as possible. Next, the extraction points should be aligned transver- sely over a cross-section of the formation in preference to positioning along the axis of water movement. The whole breadth of the aquifer must be drawn on. Again, the extraction areas should preferably be in or near the places where the aquifer outcrops or comes near to the surface. Examples are: recharge areas with resurgent overflow -when extraction enables the water wasted in this way and by evapotranspiration to be retained in the aquifer; areas where the aquifer breaks the surface-when the depression spring flow and evapotranspiration losses are recovered; and areas where the aquifer rises near enough to the soil surface for there to be recoverable losses by evapotranspiration.
Thus, aa w e have seen, there are ways of acting on the economy of an underground reservoir to get the m a x i mum yield from it. Arising, incidentally, out of this, it might seem that if groundwater extraction by wells or borings equals the input from the recharge area, the aquder below the zone of extraction will dry out; but observation has shown that discharge through wells does not stop discharge from the natural outlets.
Relaionship between Discharge through Wells and Borings and the Natural Discharge of Aquifers
One of the most important tasks of hydrogeology is to ascertain the relationship borne by discharge through wells and borings to the spontaneous discharge of water- bearing horizons. There is more to the latters’ exploitation than sinking a well or borehole haphazard and extracting whatever water it will yield. It is advisable to h d out the amount of water a horizon will yield and the m a x i m u m extraction which can be effected without the risk of draining the aquifer dry.
In the case of a body of groundwater in which there is no movement, the problem

Groundwater prospecting and development
is simple: w e are then dealing merely with an underground reservoir without inflow. The maximum quantity of water withdrawable will be the volume of gravitational water calculated from the measured dimensions of the aquifer. It m a y be remarked that the amount is often enormous and much larger than the first rough initial estimate suggests. It is always worth while making a few very simple calculations. For ins- tance, an aquifer 10 m. thick, with a surface area of 10 km.a-which is not averyhigh figure-and a specific yield of 0.2, would give a total of 20,000,000 m.3 of water or 10 litres/sec. for 63 years. However, prudence suggests not depleting an asset which should be kept for an
emergency; the drawings should be made not on the reserves but on the natural yield, which is given by the rate of flow of the aquifer.
Whereas any body of subsurface water in which there is no movementnecessarily has a horizontal piezometric surface, in those discharging and receiving recharge (i.e., in movement) the surface slopes. When pumping is carried on, a cone, or more accurately a zone, of depression, is
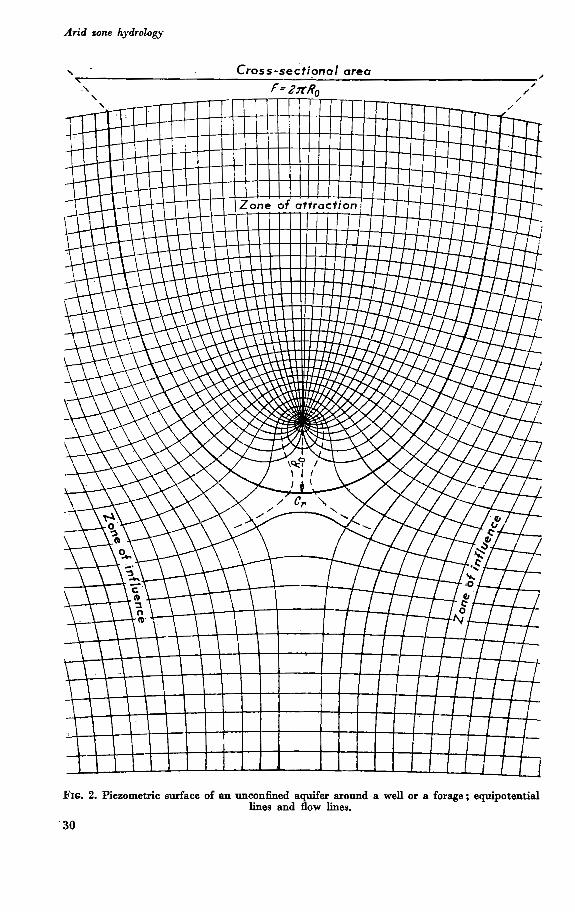
created around the well or boring. With phreatic groundwater, there is actual lowering of the water-table, whereas in confined water only the piezometric surface is lowered. However (fig. 2), in either case, a cone, or zone, of attraction is distinguishable com- prising all that part of the aquifer in which the percolations are diverted towards the boring or well. This being so, the cone, or zone, of attraction will have an attraction radius and an
attraction or intake periphery. Outside the zone of attraction is another zone of the formation, in which the percolations are deflected by the suction of the well or boring but are not captured by it: this will be known as the cone or zone of influence or reaction.
Finally the term ‘imaginary’ radius is here used to signify a radius reproducing the hydraulics of the radius of influence.
The part of the subsurface percolations extracted by a given well [67] or boring is that passing through a cross-sectional area of the aquifer of breadth E’. If i is the gradient of the piezometric surface, KT the transmissibility of the aquifer and q the yield of the well, the well’s ‘extraction frontage’, F, is given by the equation
The yield of an ordinary well is given by the equation
H2 - ha R,InR, = ~ 2Hi With this last equation it is possible, without knowing the permeability, to deter-
mine the imaginary radius of the well, when P can be worked with equation 3 and K or T with equation 1. If the total breadth L of the aquifer is known, it follows that the total discharge
of the formation is given by the equation
In the case of a confined a+er the yield of a boring ie given by the equation Q = TiL
A InRf/r
h RrlnR, = -
q = 2xKH - and we thus get
1
29
Arid zone hydrology
\ Cross -sectiono I area \ / .\ I
FIG. 2. Piezometric surface of an unconfined aquifer around a well or a forage; equipotential lines and flow lines.
30

Groundwater prospecting and development
It is possible in the same manner to determine the imaginary radius R,, the extraction frontage P, the permeability K or the transmissibility T and from them the total discharge of the formation. The writer [68] has himself used this method to investigate the relationship of the
yield of borings to recharge for the subsurface water in the Palaeocene sands of the Aquitaine basin. The extraction frontage of each well or boring is above it. Clearly therefore it will
be advantageous, as already mentioned, to position the borings in such a way that their extraction frontages run end to end over the whole width of the extraction zone and do not overlap. The above method makes it possible, as we have seen, to adjust the extractions
from wells and borings to the natural discharge of aquifers. The extraction figures thus calculated are equivalent to the natural discharge, i.e.,
the natural surplus of the formation, supplied by yearly recharge. In actual practice it is possible in very many cases to extract larger quantities without exhausting the aquifer. When water is pumped from an underground storage system, the latter is reduced over an increasingly extensive area radiating from the boring, and eventually involving more or less the whole area of the groundwater surface if the extractions approximate to the natural discharge. This creates a difference of head, or increases any existing difference, between the pumped aquifer and adjacent formations, resulting in its receiving additional supplies by discharge from these, with a further supplement in the shape of seepage through the confining strata from subjacent or superjacent water-bearing horizons. Next the lowering of the piezometric level in the recharge zone will stop resurgent overflow and concurrently will assist infiltration by partly preventing the evapotranspiration of the recovered supplies which would have run to waste. Finally, in m a n y instances water will be recovered which normally escapes through the springs when aquifers emerge above the soil surface. All these items added together give us what might be called an artificial supple-
mentary recharge by drainage. However, striking the correct balance between natural, plus artificial supplementary,
recharge and economic yield remains a difficult task. Accordingly, when balance sheets are to be drawn up for groundwater development,
all the considerations set out above must be taken into account. It will be clear that preparing the inventory is not as simple a matter as it might have been thought at hst.
This represents a positive gain in resources.
M O D E L W A T E R SUPPLY A N D DRAINAGE APPRECIATION FOR A N ARID REGION
There is no universal blue-print, applicable to all regions, for the preparation of regional water inventories and the investigation of availabilities and drainage requirements. Each region presents an individual problem and the procedure appropriate depends not only on the geographical, geological and hydrological conditions but also on the object in view.
However it is worth quoting a hypothetical example, which very frequently fits the case in practice.
It is given in a very thought-provoking article by Loehnberg [65] on the conditions governing the utilization of water supplies in a common type of semi-arid region. He takes an imaginary region of plain country bordered by mountains with foothills
along the base of the chain, the mountains being of moderately permeable rock, with a comparatively pronounced plainwards dip. The plain itself is argillaceous, consist- ing of detrital soil, underlain by clays, marls and shales, and the foothills are formed
31

A d wn e hydrology
from coarse debris which builds the fans protruding from the massif. The boundary line between mountains and plain m a y be a simple or compound fault or just a stra- tigraphical unconformity. The assumed rainfall is about 300 mm. in the plains and 600 mm. in the mountains. It is compressed into a period of 3 to 5 months and the result will be periodic strong
surface run-off, flooding and swamp conditions developing particularly in the lower levels. Oversaturated patches dry out during the rainless summer months, but are liable to persist on heavy soils.
The run-off is divisible into three categories according to volume and duration: (a) short and sudden floods directly caused by concentrated heavy rainfall; (b) run-off following prolonged precipitation, resulting from direct rainfall as well as from short- term subsoil storage (seepage, increases in yield of small and large springs); (c) run- off traceable to prolonged rainfall but having its immediate origin in the retarded flow from the major springs after the filling up of the principal aqufer. The springs fall into three groups: (a) mountain springs, due to favourable local
tectonic and lithological conditions; (b) foothill springs emerging at the contact bet- ween hill and valley formations; (c) springs in the foreland and the plain emerging from a fan or, in the lower part of the plain, along a terrace near the contact of debris and the less permeable valley N. The types of groundwater which m a y be expected are: (a) in the moderately per-
meable formations of the mountain area; (b) in the valley fills and outwash fans; (c) in very slow circulation in the argdlaceous sediments of the low-lying part of the plain.
Marshy areas in the mountains are confined to the neighbourhood of seeps and springs, as also in the higher-lying part of the plain as a result of the loose texture of the subsoil. On the edge of the argdlaceous formations large patches of marsh occur in conjunc-
tion with depression springs. In the lowest part of the plain, of clay and marl compo- sition, the marshes are extensive and the conditions persist with only minor variations of intensity on a permanent footing. Quite obviously, as has been said already, Loehnberg’s stipulated conditions are
not found in their entirety in all semi-arid areas. For instance, there m a y be no folding in the mountain strata. But this does not greatly modify the hydrogeological condi- tions. A mountain chain (with folding strata) m a y (and indeed very frequently does) have foothills below it in which the stratification is horizontal and runs on well into the plain.
Most important of all, the plain itself m a y consist not of relatively argillaceous but of extremely permeable sandy and other sediments of great thickness, which drastically alters Loehnberg’s premises. Plains of this type are extremely frequent in arid areas.
Lastly, the substratum of the alluvial formations m a y include more or less permeable water-bearing horizons getting their replenishment from the uplands and containing artesian water often at high pressure. Thus in a plain of this type attention will have to be directed to the possibilities as regards artesian as well as phreatic subsurface water.
Nevertheless, if Loehnberg’s arguments are not directly applicable to all arid coun- tries, they do afford extremely useful and valuable pointers on how to prospect for and develop groundwater in semi-arid regions.
Critical Factors
For optimum area development, advantage must be taken of all water resources and the maximum acreage of suitable land must be brought under cultivation. Hence: (a) all possible water supplies should be impounded so that maximum quantities
32
Groundwater prospecting and development
m a y be conserved for use during the dry season; (b) all marshy conditions shodd be avoided, whether caused by flow from terminal springs or depression springs when the piezometric surface cuts the soil surface, by overland flow, by rainfall or by the rise of the water-table in winter. However the circumstances of prospecting and development m a y be opposite: 1. Work, for harnessing springs and handling their water at the lower end of a moun-
tain valley m a y prove redundant as a result of the subsequent or concurrent har- nessing of springs higher up the valley, particularly if the lower-valley springs are mere resurgences of those ‘up-stream’.
2. W o r k on and in connexion with springs in the plain on the upstream edge of the thick argillaceous fill is wasted in part when the flow from the springs is cut off or reduced by wells tapping the aquifer above or below them.
3. Flood control considerations suggest the deepening and straightening of the beds of wadis, but later on the consideration of making the most of the floodwater will require a reduction of gradients and lengthening of the distance travelled by the water to encourage intiltrations for the replenishment of the groundwater.
4. As with springs, water extraction from wells located at different elevations on the plain is liable to bring about a drop in the piezometric surface necessitating costly alterations to the pumping equipment, conduits and reservoirs.
5. The relative quantities of fossil and cyclic ground water cannot always be deter- mined before the start of regular extraction from artesian or driven wells. It is therefore extremely difficult in the developmental phase to work out the eafe yields and new stable levels of the underground reservoirs. Wells which were ori- ginally satisfactmy will in many cases no longer be so and a further difficulty will be that the ratio of the optimum mean yield at the end of the rainy aeason tothat at the end of the dry season can only be established after prolonged experience.
6. The drainage canals initially dug to shallow or medium depths will become in- adequate when the water-table sinks as a result of continued extraczion.
Obviously some of these complications can be planned for, but several irreconcilables still remain: (a) it would be desirable to take advantage of the winter surpluses of s d c e run-off and groundwater; but the very high rate of evaporation in summer is a stmng argument against impounding the surpluses in costly open reservoirs; (b) to eliminate waterlogging on heavy soils equally saturated in winter and summer, it w o d d seem necessary to draw off water from such areas throughout year and more especially in winter, but this would amount to wasting water. The only satis- factory solution in either case would be to create stocks of water in undexground reservoirs.
Priorities
The foregoing leads on to the relative priorities to be accorded to the considerations operative in prospection and development.
Water supply and drainage. It must first be definitely accepted that water supply takes precedence over drainage. The reasons are the following: 1. Under semi-arid conditions, irrigation is the prime factor in any extension of agri-
culture. If the area is dependent on rainfall alone, the greater part of it lies fallow during almost the whole of the dry season whereas irrigation increases the value of a given parcel several times.
2. In semi-arid areas, water requirements for irrigation are generally in excess of the resources readily accessible in summer.
3 33
Arid zone hydrology
3. All withdrawals of water for domestic use or agriculture are tantamount to drainage to the extent that they reduce the amount of water moving down to the heavy soil areas.
In view of the many uncertainties involved and of the fact that it is to some extent a function of normal spring discharge and underground run-off, flood control-in so far as it involves engineering works-should, like drainage, be relegated to a later phase. The utilization (and storage) of spring water and of groundwater for irrigation, especially if consumption continues during the wet season, lowers the water-table, allows additional quantities to infiltrate and effects a corresponding reduction in the volume of flood water. Thus increased exploitation of springs and groundwater is in itself a first step in
flood control and the rehabilitation of marshes.
Development of groundwater concentrations and springs. The next point to be laid down is that direct exploitation of groundwater reservoirs should be given priority over the harnessing of springs. Springs are either the normal discharge from the aquifer or overflows from it and optimum extraction of water by wells will cause a temporary or permanent drop in the water-table or piezometric surface which will have the effect of reducing and even in certain extreme cases cutting off the flow from the springs. However, the principle of priority for direct withdrawals from the underground
reservoir over the harnessing of springs should not be followed blindly: allowance must be made for the disparate hydrogeological conditions encountered respectively in the mountains, in the plain and in the intermediate zones. Mountain or hill areas contain several aquifers and because of the great differences
in altitude between the recharge areas and evacuation points there is often a high pressure gradient. In addition water-tables and piezometric surfaces lie at great depths, so that it is difficult to draw on the supplies otherwise than by harnessing springs- resurgent, overflow or discharge, the latter marking the end of the aquifer and receiv- ing some of the water, perhaps, from higher areas. But, in addition to what Loehnberg tells us we need to consider the case of a plain
made up of ultra-permeable formations. In this instance there are no longer overflow springs in the higher-lying part of the plain. In contrast to Loehnberg’s imaginary situation, the piezometric surface lies deep down and rises increasingly near the soil surface ‘downstream’. Hence the harnessing of the reservoirs by wells or borings can proceed without
regard to the question of capturing springs: either there will be no springs or they will be unconnected with groundwater being tapped. Another possibility to be borne in mind is that a plain will have deep-lying water
horizons the tapping of which m a y have no effect on the water situation higher up. However, this can only be confirmed by a thorough hydrogeological survey.
Utilization of mountain and submontane groundwater. The preferred area for wells and hydraulic works drawing on subsurface water should be the submontane tract, for the following reasons: 1. It constitutes the main groundwater reservoir of the region. At lower elevation-
the groundwater cannot be harnessed as the high clay content and low permeas bility of the formations lower down the plain make it impossible to extract the water in them; and while there is groundwater higher up, in the hills, such of it as is not discharged from springs or lost from paludal seeps reaches the submontane reservoir in due course.
2. Drilling and pumping cost less in the submontane tract and the water is easily routed thence to the consuming areas.
34

Groundwater prospecting and development
3. The abstraction of water in the submontane tract directly reduces the water reach- ing the saturated areas in the plain and is more effective for the purpose than similar operations in the hill country.
However, we also have to reckon with the possibility of the plain being permeable and then the best place to work the groundwater will not be the submontane tract but the lower-lying areas where the water is nearer the surface and the soils are more suitable for irrigation.
Since these regions receive part at least of their water from the upstream aquifers in the hills, it m a y be wondered whether it is not worth making further wells and boreholes there and in fact, it is often a sound policy. Lowering the water-table assists increased groundwater storage during the rainy season by preventing run-off from overflow in the recharge area or from resurgent springs. The winter run-off and, inci- dentally, water loss is reduced correspondingly and the quantity saved is available for use during dry periods. Moreover, it pays to build up groundwater reserves up- stream rather than downstream, particularly if downstream the water-table rises too near the soil and tends to form marshes. The point at which work should be begun on the mountain groundwater will depend
entirely on the degree of connexion between these hydrogeological systems and those in the foothills; in most cases they are completely independent. The correct sequence for developing the individual springs and water horizons in the mountains is deter- mined by how they are connected among themselves.
W A T E R STORAGE
In rainy seasons there is a surplus of water which it is quite obviously advantageous to conserve until the dry period during which needs are greatest.
Underground reservoirs, particularly in arid or semi-arid regions, are indisputably far superior to the surface type.
They avoid losses by evaporation, which are often heavy in dry areas (from 0.8 to 3 m. over free water surfaces). They are usually less costly and are less vulnerable to the effects of earthquakes,
military operations, etc. Suitable sites for constructing them are more numerous and often more extensive
than those for surface dams. Nevertheless they have certain obvious disadvantages: planning and construction are more difficult than with an open-air dam, and designed capacities harder to calculate and achieve though ever greater progress is being made.
Secondly, recovery of the water in an underground reservoir involves an expen- diture of power whereas in an open-air d a m the water runs off by gravity.
35

C H A P T E R I 1 1
Calculation of permeability and transmissibility from pumping tests by non-equilibrium formulae
The calculation of groundwater discharge is one of the essential tasks of hyhogeology in arid regions but is impossible to execute unless the permeability, or preferabk the transmissibility, of the aquifers has previousIy been ascertained. Permeability, w e know, can be determined in the laboratory by granulometric me-
thods or better still by permeameter readings. However, to measure the permeability of a whole horizon and not simply of samples there is no substitute for pumping tests or wells or borings. The Dupuit-Thiem method needs no introduction and the writer has himseu suggested a method, discussed on a later page, for calculating permea- bility simply from the observed water level decIine in the boring, the corresponding yie€d and the hydraulic gradient.
Nevertheless, a prerepuisite in either case is that a new #post-pumping’ equilibrium state has been reached by the hydraulic system and this is a very slow business, espe- cially with unconfined groundwater. Hence the non-equilibrium method, initiated by Theis, is far preferable though unfortunateIy still unknown in many parts of the world. This method, which is applicabIe both to confined and phreatic horizons, condi-
tionally, in the latter case, on ignoring the points in the well’s immediate neighbourhood, is accordingly outlined below, followed by an account of the methods of Bodton and Eantush, which allow for the amount of water seeping through the positive confinmg bed.
THEIS’S FORMULA^
The non-equilibrium formula gives the steady yield in cubic metres per second of a well or boring as a function of the transmissibility T (in cubic metres per second) and of the lowering A (in metres) of the piezometric level in the aquifer at the time t (se- conds). This time is measured from the beginning of steady yield of pumping. The lowering A is observed at distance R (metres) from the well or boring. The yield q is steady. It will be recalled that the transmissibility T is the product of the coeffi- cient of permeability K in cubic metres per second multiplied by E, the thickness of
1. C. V. Theis, ‘The Relation between the Lowering of the Piezometric Surface and the Rate and Duration of Discharge of a Well using Groundwater Storage’, Transactions of rhe American Geophysicnl Union. 46th Annual Meeting. 1935, pages 519-24. - ‘The Signification and Nature of the Cone of Depression in Groundwater Bodies’. Ecommic Geology, vol. 33, no. 8, 1938. pages 889-900. L K. Weneel. Melhoda of Determining Permnbility of Water-bearing Mnlerinls. U.S. Geological Survey, Wale? Supply
Paper 857. 1942.

Calculation of permeability and transmissibility
the aqui€er, i.e., T = K x e. Hence, if i be the gradient of the piezometric surface, the discharge Q per metre of frontage = Ti. The basic equation is:
R*S U = - 4Tt
in which S is the storage coefficient. In a confined aquifer, S is the volume of water released from a vertical column of water-bearing material of height equal to the thick- ness E of the aquifer with a base 1-metre square for a reduction of pressurecorres- ponding to a 1-metre loss of head. This volume of water is released as a result of the pressure of the overlying strata
and the expansion of the water due to the lowering of pressure within the aquifer. The coefficient S is of the order of 10-4 to 10-6. For phreatic groundwater S, it is equal to the specific yield, i.e., the volume of water yielded by gravity drainage from the saturated rock. S is expressed as a decimal fraction. We then have:
U2 U3 U4 JA W(u) = - 0.577216 - In U + U - - + - - - 2.2! 3.3! 4.4! 4rI
and hence
(3) 0.0797 A=- T a w 4
UTt s = 0.004 - RZ
(4.)
0)
The values of W(u) as U varies, can be found from tables (Wenzel, after Theis, 1942) or from a log-log graph (Theis). Transmissibility m a y be determined in either of two ways: either by observing the variations of the draw-down, A, as a function of the time in a single piezometric tube and plotting the curve of log A for the well for values of log lit, or by noting the drawdown A at the same time for each of an array of pie- zometric tubes at a distance R from the pumping well. Log A is then plotted for each well as a function of log R*/t. In either case the graph is plotted on transparent paper scaled identically with
that used for the log W(u)-log U graph, and each time the result is a curve which is simply a section of the log W(u) curve for values of log U.
The log A-log Ra/t (or log Ailog l/t) graph is then superimposed on the logW(u)-lcg U graph, there being only one possible position. An arbitrary value of A is selected on the curve on the transparent paper and the W(u) and U co-ordinates corresponding to this position of A are noted from the matching curve on the under- sheet. The resultant values of A and W(u) are then inserted in equation 4, to give T.
After this, S (coefficient of storage) is calculated by introducing the U and T values into equation 5. In most cases, it is preferable to use the log A-log RZ/t equation based on the reading of a number of piezometers at the same moment rather than the log &log l/t equation reflecting the readings of a single piezometer at successive points in time. The former gives a more general value of T and S. This method can be used both for artesian formations and for free water-tables
provided the observations are not made too near the well where the vertical component in the water movement is particularly important. This is a factor which Theis's equa- tion does not allow for.
37

Arid zone hydrology
I1
5
I
I,!
3.1
I.!
1
1.1 - - 3 E
1
0.9
0.8
0.7
0.b
0.5
0.4
0.3
0.1
0.1
~ 0.0003-
I I
I E 1 0.02 0.03 0.04 0.0s 0.06 0.07 O.OBO.OPO.1
U
FIG. 3. Theis curve.
U
0.3 0.1 0.5 0.b I
1
0.8 0.V I
No method is of unlimited applicability and it is necessary to bear constantly in mind the assumptions on which any method was designed.
Thus Theis’s formula presupposes that: (a) the aquifer is homogeneous and isotropic; (b) it is of infinite areal extent; (c) the discharging well penetrates the full thickness of the aquifer; (d) T is constant at all places and at all times; (e) the radius of the well is extremely small; (f) there is instantaneous evacuation of the water from the aquifer in the part where the draw-down occurs. The errors arising where assumptions (c)- (e)are not confirmed are normally insigni-
ficant, as is also the case if the aquifer is only of relatively great, but not infinite, areal extent. In any case, the formula remains accurate throughout that part of the pumping time before the, cone of depression reaches the lateral boundaries of the aquifer. Errors mainly derive, with free water-tables, from the appreciable time taken for
the water to leave the aquifer and are proportionate to the reluctance of the water- bearing material to release its water, i.e., to the smallness of the pores.
38

Calculation of permeability and transmissibility
Theis and Brown [lo21 have designed a slide-rule and Remson and V a n Hylckama [98] have worked out nomographs for easy working of the calculations involved in Theis's method without recourse to graphs.
APPR 0x1 MATE CAL c ULATI o N METHOD]
After pumping has been continued for a sufficient time, the alternate series in equa- tions l and 2 becomes negligible in the relation to the logarithm and the constant term. This simplifies the equation and a 'short-cut7 method becomes usable after a suffi- cient period-not less than 48 hours-of pumping at a constant rate. At that point, equations 1 and 2 can be rewritten:
(6)
(7)
2.25Tt
Thereafter, any one of several procedures can be adopted:
3.
The draw-down A can be observed, at the same point of time, in several piezo- metric tubes. Then t is fixed and equation 6 can be written:
dA 2.303q -=- d(1ogR) 2xT
whence
0.376 TI-
d log R d(A /Q)
A/q is then plotted as function of log R, (fig. 4) and T is got from this. The draw-down A is observed in a single piezometric tube at successive points in time, so that R is fixed. Equation 6 then gives us:
dA 2.303q d(1ogt) 4xT !I -=-
thereupon
A/q as a function of log t (fig. 5) is then plotted and T can be calculated from the rectilinear asymptotic part of the graph. This graph can be used direct on the discharge well of radius of influence r.
Draw-down A/q in a number of wells is observed simultaneously at successive times t. The wells are located at varying distances from the pumping well. We know that:
1. 11. M. Coolwr. G. E. Jacob, 'A Generalized Graphical Method for Evaluating Formation Constants and Summarizing Well-
C. E. Jacob, 'Flow of Groundwater' in Rouse Hun~er Engineering Hydrarrlics, New York. John Wiley and Sons. 1950.
E. de Gelis [go].
field History', Transaddiona of the American Geophysical Union. vol. 27. no. 4. 1946. pages 526-34.
pages 321-86.
39

Arid zow hydrology
log R.
FIG. 4. AJq-log R curve.
logt
FIG. 5. A/q-log t curve.
R2 FIG. 6. A/q-log - curve.
t
40

Calculation of permeability and transmissibility
Ra The values of A/q for each well are then plotted as a function of log - (i.e., for t
constant R). The values of A/q obtained for the different wells at the same timet should be in a straight line. One thus obtains a synthetic chart giving the mean of the permeabilities at the various locations of the wells at various times.
Obviously the points for each individual well are given a distinctive symbol. From the rectilinear portion of the resultant curve, T can be determined as already described. The straight asymptote cuts the time axis at a point given by the equation
The equation
Ra 2.25T log - - . t o s Tt Ra ’ S = 2.25-’
is thus easily worked after calculation of T. The Theis method is directly applicable to wells in artesian aquifers when no account
need be taken of seepage through the aquiclude. However, with wells in water-table aquifers Jacob points out that there are certain limitations. If the draw-down in the well pumped is less than 2 per cent of the thickness of the aquifer, the foregoing calcul- ations of S are not hopelessly falsified by the fact of time being needed for the exhaus- tion of the water in the cone to take place. The errors arising can be corrected as fol- lows: T is first determined from either equation 8 or equation 9. Next, equation 6 is used
to calculate the value of S for different times t and different values of A, and S is a h calculated for various values of R. This gives us values as functions of t, and to arrive at S w e extrapolate up to very high values of t. If Ae/2H (H being the thickness of the aquifer) is subtracted from the observed
values of A, more precise values of T are secured and the values of S are nearer the true ones. Perfect correspondence is secured if A > 0.25 H provided that S is every- where the same.
BOULTON’S METHOD FOR WELLS IN WATER-TABLE AQUIFERS
As we have seen, Theis’s exponential integral is not applicable to free surface water- tables, as a result of the fact that near wells there is a vertical component for which no allowance is made in Theis’s formula. Nevertheless, that formula can be used if
Kt Tt r = - = - > 5 SH SHa
Boulton [87] gives a method whereby the integral can be employed even for points in the neighbourhood of the well. It involves very heavy pumping, with draw-down nearly to the impermeable substratum. For it to be usable, the following conditions must be fulfilled: 1. The aquifer must be homogeneous and isotropic, extend right down to theimper-
meable substratum and be of infinite lateral extension, while the impermeable substratum must be horizontal.
2. The well must be perfect, i.e., extend right down to the impermeable substratum. 3. The storage coefficient must be constant. 4. Flow must conform to Darcy’s law and permeability be constant. 5. The piezometric surface of the water-table must be horizontal before pumping.
There must be no rainfall recharge of the water- table in the neighbourhood of the well.
41

Arid zone hydrology
6. Pumping must be at a constant rate of discharge from the instant t = 0. Boulton gives the following formula for the draw-down:
where @ is the pressure plus the potential at every point in the saturated portion of the
aquifer. P @ = - + Z Y
J, the Bessel function of the first kind of zero order; R the horizontal distance from the axis of the well; K the coefficient of permeability; z the level of the water-table at distance R; S the storage coefficient.
representing the specific weight of the water;
For working the calculations it is convenient to introduce the non-dimensional quan- tities:
R Kt q = - and T = - H SH
By adopting ?. = SH as the variable, w e get
A being the draw-down at point R.
missibility T = KH, the foregoing equation becomes: Designating the definite integral by V (p, t) and introducing the coefficient of trans-
4 2xT A = - V(~,T) (4)
which is the equation suggested by Boulton for the draw-down of the water-table. W h e n the r factor-and hence also t-is sufficiently great, h can be substituted
for tanh h in equation 3 without appreciable change in the value of the integral. Using Weber's first integral w e then show that:
or
Ei is the exponential integral used by Theis in W(u) = - Ei (- U). Xi is a correcting term which is small when T is great. Thus the exponential integral
is applicable to free water-tables when the pumping times used for the calculation are exclusively of adequate length. No tables are as yet in existence for the V-function in equation 4; but the rudiments
of such a table appear below (Table 3). For small values of T, T < 0.05, the V-function is given approximately by the equa-
tion
lf7+XO P (7) 1 V (p,r) = sinh-' - + sinh-lz - sinh-l - P P
X, being a correcting factor which is small when r itself is small. This gives us
P + sinh-' 2 - sinh-' -
2xKl P 42

Calculation of permeability and trammissibili6y
1 being the height of water in the well when q = 0 in the case of an aquifer of unlimited height.
Numerical Determination of V
The values of V are determined by finding the values of Xo for the smaller and of XI for the greater values of T by quadrature. The values of V can be determined from equations 7 and 5 by using the published
sinh-' x and Ei (- x) tables. The intermediate values of Xo and XI can be determined from the tables by linear
interpolation. For V the interpolation is more difficult. The values of V are then carried to equation 4 which gives T as a function of A
and q from a piezometer.
TABLE 1. Value of X, (p, T)
T p = O . O p = O . Z p-0.4 ~ ~ 0 . 6 p z 0 . 8 p = 1 . 0 p = 1 . 5
0.05 0.0150 0.0143 0.0125 0.0101 0.0077 0.0056 0.0021 0.20 0.0564 0.0541 0.0480 0.0398 0.0312 0.0234 0.0099
TABLE 2. Values of X, (p, T)
1.00 0.1810 0.1747 0.1575 0.1331 0.1057 0.0787 0.0250 5.00 0.0344 0.0343 0.0338 0.0330 0.0320 0.0306 0.0264
TABLE 3. Values of V (p, 7)
T p = 0.2 p = 0.4 p = 0.6 p = 0.8 p = 1.0 p = 1.5
0.05 0.214 0.092 0.051 0.032 0.021 0.008 0.20 0.756 0.358 0.207 0.132 0.088 0.035 1.00 1.844 0.183 0.826 0.599 0.443 0.220 5.00 2.785 2.096 1.696 1.416 1.203 0.832
It can be seen from Table 1 that for values of T 7 0.05, the error in the calculatioa 4 of A does not exceed 6 cm. when - = 10, if X, is left out of account. 2XT
Table 2 shows that, for a value of T = 5, the error in the calculation of A using
Finally, to calculate the draw-down A, equation 4 is used: the exponential integral in lieu of V does not exceed 3 per cent.
!7 2xT A zz - V(~,T)
1. With values of T < 0.05, V (p, T) is calculated from the equation 1 1 + T V (p,~) = sinh-1 - -1 sinh-'2 - sinh-1 - P P P
43

Arid zone hydrology
But the corrections made by Boulton’s graph (fig. 7) d be added to the value. of A (draw-down) in equation 4.
2. With values of 0.05 < T < 5, V (p, 7) is calculated from Table 3 and the values are carried into equation 4.
3. With values of T > 5, V (p, T) is calculated from the equation
v (p,.) = - - Ec - - 2 .( 1;) and the result is carried into equation 4. A must however be corrected by adding the values given in Boulton’s graph (fig. 8).
It should be pointed out that this method makes the determination of transmissibility no easier.
Calculation of Draw-down in the Pumped Tell
The calculation of the level in the pumped well itself should be made from the equation
9 A =(-In ep, + rn) - 2xT
Where r
P w =- H r being the radius of the well, H the thickness of the aquifer and m a value to be taken from the following table of the variations of the values of rn with those of T.
TABLE 4
T m
0.05 1.00 1.00 5.00
- 0.043 + 0.087 + 0.512 + 1.228
M E T H O D S ALLOWING FOR T H E D E L A Y E D DISCHARGE, REPRESENTING T H E BALANCE OF T H E SPECIFIC YIELD IN FREE WATER-TABLES, O R CAUSED B Y LEAKANCE IN T E E CASE OF CAPTIVE AQUIPERS
In the foregoing formulae, no allowance is made for the delayed discharge produced, in the case of pumped wells in water-table aquifers, by gravity drainage from the part of the aquifer lying above the depression cone, or, with confined aquifers, by leak- ance through the confining strata as a result of the drop of pressure around the borehole.
Admittedly, with phreatic groundwater, the delayed discharge is not an important factor when the aquifer consists of sands and gravels which drain out veryrapidly, and Boulton contends that with sands from 0.15 to 0.85 mm. diameter or, obviously, coarser, it m a y be neglected.
Boulton’s Method
An initial study of the question has been made by Boulton [88], in which two cases are discussed:
44
i
-rr* _I

Calculation of permeability and transmissibility
- 40 - 35 -3@
- 25 - 20 -15
-10
Curve rw/Zhe hw/he Q/khe
U
2 I - 5
3 0 A .- g
- 0
j t 5 E 0
C t10
+15 F D
+20
+25
+30
U
0,1 a,3 0,5 1 8 0 p (logarithmic scale)
FIG. 7. Curves for correcting drawdown of free surface when T < 0.05.
p (logarithmic scale) FIG. E. Curve for correcting drawdown of €ree surface when 7 >5.
45
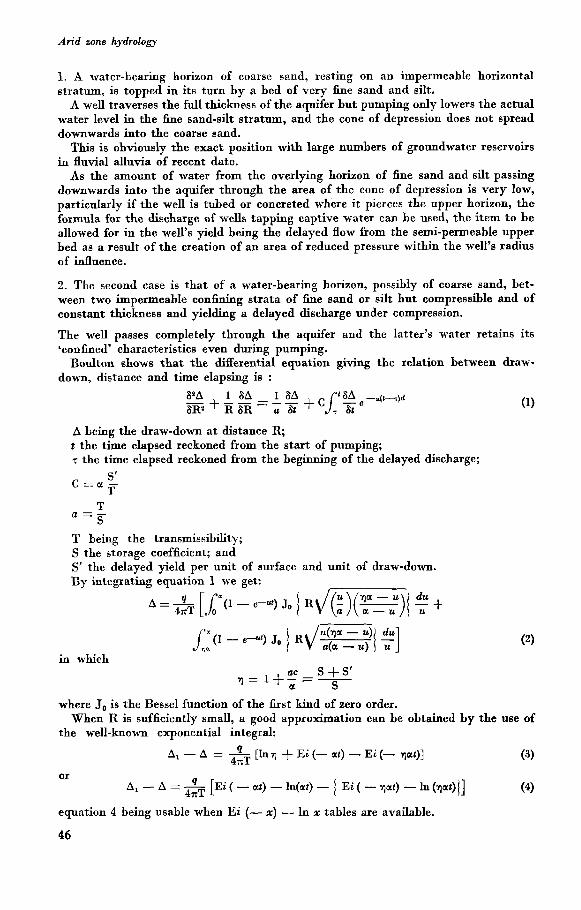
Arid zone hydrology
1. A water-bearing horizon of coarse sand, resting on an impermeable horizontal stratum, is topped in its turn by a bed of very fine sand and silt. A well traverses the full thickness of the aquifer but pumping only lowers the actual
water level in the fine sand-silt stratum, and the cone of depression does not spread downwards into the coarse sand. This is obviously the exact position with large numbers of groundwater reservoirs
in fluvial alluvia of recent date. As the amount of water from the overlying horizon of fine sand and silt passing
downwards into the aquifer through the area of the cone of depression is very low, particularly if the well is tubed or concreted where it pierces the upper horizon, the formula for the discharge of wells tapping captive water can be med, the item to be allowed for in the well's yield being the delayed flow from the semi-permeable upper bed as a result of the creation of an area of reduced pressure within the well's radius of influence.
2. The second case is that of a water-bearing horizon, possibly of coarse sand, bet- ween two impermeable confining strata of h e sand or silt but compressible and of constant thickness and yielding a delayed discharge under compression.
The well passes completely through the aquifer and the latter's water retains its konfined' characteristics even during pumping. Boulton shows that the differential equation giving the relation between draw-
down, distance and time elapsing is : P A 1 6A 1 8A 6Rz R 6R -+--=-- a + CL': e -U('-+
A being the draw-down at distance R; t the time elapsed reckoned from the start of pumping; z the time elapsed reckoned from the beginning of the delayed discharge;
S' c = a - T
T S a = -
T being the transmissibility; S the storage coefficient; and S' the delayed yield per unit of aurface and unit of draw-down.
.~
By integrating equation 1 we get: A = p [ ~ = ( 1 - e-ut) Jo 1 .\/(:)(->I qa - U + 4,xT o a - U
in which ac - S + S' q = 1 + - - - U S
where Jo is the Bessel function of the first kind of zero order.
the well-known exponential integral: When R is sufficiently small, a good approximation can be obtained by the use of
(3) 4 4xT A, - A = - [Inq + Ei(- at) - Ei(- qat)]
or
equation 4 being usable when Ei (- x) - In x tables are available. 46
Calculation of permeability and transmissibility
AI - A is the correction to be deducted from the draw-down given by Theis’s formula, from using T and S. The real drawdown is then obtained by allowance for the delayed yield.
s +S’ q=- S
T o resolve the equation, the first step is to apply Theis’s equation for obtaining the transmissibility T, and S.
However, the values of S reached by Theis’s equation m a y vary from one point to the next or even with the relative passage of time, as this equation makes no allow- ance for leakance s’. Accordingly, the ‘Theis’ coefficient of transmissibility, which normally varies from
point to point, is retained and to get S w e use the coefficient obtained by prolonged pumping which is introduced into equations 3 and 4 above.
Next, equation 3 or 4 is worked for trial values of U and q until the values of A thus arrived at correspond to the observed values of A for the several values of t (time).
S‘ S With 7, - is thus obtained.
S‘ . With a the value C = a - 18 calcdated. T However, before accepting these values of a, q and a, they should be introduced
into equation 2 and the integral calculated using the data for the highest vaIues of R at which a draw-down has been observed. Boulton’s method thus gives the leakance S’.
Hantush’s Method
Further research on accretions by leakance during pumping has been carried out by Hantush [94]. Take the case of a body of groundwater which can be considered as of infinite areal
extent and constant thickness and stored in a completely elastic aquifer, with leak- ance from semi-impermeable confining beds above and below proportionate to any reduction of level.
Given a well drawing on this aquifer at a constant rate, Hantush and Jacob [92, 931 have worked out the following equations for the draw-down at the non-equilibrium stage:
( 1 4
(1 6)
in which:
Ra Tt !I=--- 4BBu - SB’
A being the draw-down, q the yield of the well, T the transmissibility,
47

Arid zone hydrology
hooeoomoom
NOC~O-V~-V)-
~~NNN----- --oooooooo
v-hvnc-hmv~ -0mm~o10~1v~
," vmnPINN----
--000000;16 0000000000
ocloooooooo
......................................

Calculation of permeability and transmissibility
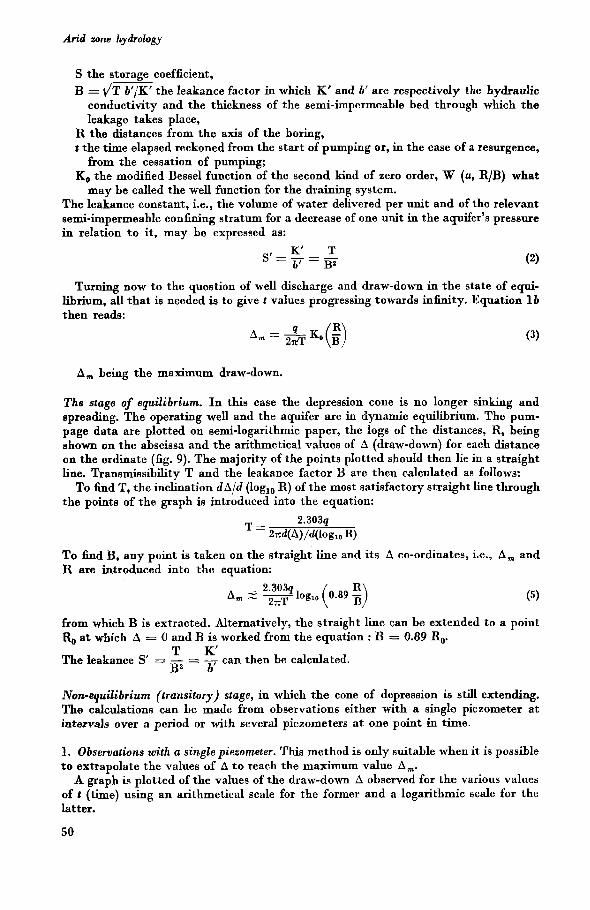
Arid hy&ology
S the storage coefficient, B = dT b'/K' the leakance factor in which K' and b' are respectively the hydraulic
conductivity and the thickness of the semi-impermeable bed through which the leakage takes place,
R the distances from the axis of the boring, t the time elapsed reckoned from the start of pumping or, in the case of a resurgence,
KO the modified Bessel function of the second kind of zero order, W (U, R/B) what
The leakance constant, i.e., the volume of water delivered per unit and of the relevant semi-impermeable confining stratum for a decrease of one unit in the aquifer's pressure in relation to it, m a y be expressed as:
from the cessation of pumping;
m a y be called the well function for the draining system.
Turning now to the question of well discharge and draw-down in the state of equi- librium, all that is needed is to give t values progressing towards inihity. Equation 1 b then reads:
A m - - L K ( Z ) 2xT B, t 3)
A, being the maximum draw-down.
The stage of equilibrium. In this case the depression cone is no longer sinking and spreading. The operating well and the aquifer are in dynamic equilibrium. The pum- page data are plotted on semi-logarithmic paper, the logs of the distances, R, being shown on the abscissa and the arithmetical values of A (draw-down) for each distance on the ordinate (fig. 9). The majority of the points plotted should then lie in a straight line. Transmissibility T and the leakance factor B are then calculated as follows: To find T, the inclination dA/d (logl, R) of the most satisfactory straight line through
the points of the graph is introduced into the equation:
To 6nd B, any point is taken on the straight line and its A co-ordinates, i.e., A, and R are introduced into the equation:
A, 5 2.303q - log,, (0.89 ;) 2xT (5)
from which B is extracted. Alternatively, the straight line can be extended to a point R, at which A = 0 and B is worked from the equation : 3 = 0.89 R,. The leakance S' = - = - can then be calculated. T K'
B2 b'
Non-equilibrium (transitory) stage, in which the cone of depression is still extending. The calculations can be made from observations either with a single piezometer at intervals over a period or with several piezometers at one point in time.
1. Observations with a single piezometer. This method is only suitable when it is possible to extrapolate the values of A to reach the maximum value A,. A graph is plotted of the values of the draw-down A observed for the various values
oft (time) using an arithmetical scale for the former and a logarithmic scale for the latter.
50

Calculation of permeability and transmiasibiliry
The curve shown in Fig. 10 is then traced and exhibits a point of inflexion at
At the point of inflexion, the gradient mi of the curve is R
mi=- B 2.3036 e-- 4'ZT
and likewise
(7)
ti being the corresponding time.
inflexion is: Finally the relation between the draw-down Ai and the gradient mi at the point of
(9) R
(a) is calculated from equation 9.
T o do this (i) Ai is first calculated by extrapolation of the curve to arrive at the maxi- m u m draw-down A,,, the answer being
Alternatively the value of Ai at the point of inflexion is read from the graph. (ii) Con- currently the related time value t, is noted from the graph. (%) The gradient m, of the curve at the point of inflexion is then calculated. (iv) A, and mi are then introduced
into equation 9 above and R/B is calculated from the table of the function e(;) KO (E) (b) B is calculated from R/B and R. (c) T is calculated by introducing the values of q, Ai, mi and K/B either into the equa-
tion 2.3036 -(+)
md=-e 4xT or into
(d) S is calculated by introducing T, ti, R and R/B into equation 8 which can also be written:
(e) Finally, the leakance S' is calculated:
When the various values thus calculated are inserted into equation 1 we should get the draw-downs actually observed on the ground, though this does not always happen. The coefficients worked out in the manner described above are inserted in equation 1. Sometimes the value A,,, is badly extrapolated, in which case this and mi must be
adjusted.
2. Observations with several piezometers. First and foremost the observations and calculations outlined in the preceding paragraph can be made with each piezometer.
51

Arid zone hydrology
FIG. 9. Graph ehowing A-log R p equilibrium conditions.
FIG. 10. Graph showing A-log I fop non-equilibrium conditions with one single piezometer.
I logr
FIG. 11. Graph showing A-log t for non-equilibrium conditions with several piezometers.
FIG. 12. Graph showing R-log mi.
52

Culculution of permeability and transmissibility
Values of T, B, S, and K’/b’ are thus obtained for each and the most suitable values selected. An obvious prcrequisite for this method is that m a x i mum draw-down A,,, be obtain-
able by extrapolation. With the method which follows this is not necessary, and all that is required is
that in the semi-logarithmic curve A-log t (fig. 11) the part of the rectilinear section corresponding to the point of inflexion be of adequate length. Observations from at least two piezometers are needed. The procedure is then as follows:
(a) For each piezometer the curve A-log t is plotted on the same semi-logarithmic paper.
(b) The value of B
for each piezometer. T o do this: (i) the
= 4- is calculated from the equation B = 0.434 [dR/d(logl, mi)] (1 0)
gradient m, of the rectilinear section of the A-log t curve for each piezometer is calculated; (ii) a curve is plotted on semi-logarithmic co-ordinate paper from the mi values scaled on a logarithmic abscissa and the distance R of the piezometers to which they relate on an arithmetical ordinate (Fig. 12). The result should be a straight line since
(11) 2 303q 4xT R = 2.303B [lOg10- - log,, 4
The gradient at d R/d(logIo m,) is calculated and inserted in the above equation 10. (c) The transmissibility T is calculated from the equation
2.303q T=- 4xmi,
m,,, is the value of m, when R = 0. This value is determined from the graph log mi - R by extending the straight line to the point where R = 0.
(d) leakance S’ is then calculated: K’ T S’=--- b’ - B9
(e) The storage coefficient S is calculated from equation 8 which gives:
This leaves t, still to be calculated.
equation 6: For each piezometer, A, is calculated by inserting the values of 4, T, R, B, in
A. ’- - J-K~(:) 4xT
Then Ai is carried to the graph of the appropriate piezometer, from which t, can
W e thus have the values of S for each piezometer and strike the average. be obtained.
53

C H A P T E R I V
Geochemistry of groundwater
The geochemistry of groundwater is of considerable importance in hydrogeology, particularly in arid regions. Finding water is not everything; the water has to be fit for use, and in and zones
groundwater is very frequently saline. Hence in m a n y cases the key factor is no longer quantity but quality. A knowledge of the laws of groundwater geochemistry is therefore important to
throw light on the chemical composition of supplies and the causes of salinity. It also affords invaluable information on groundwater storage conditions and movement. There is of course an abundance of studies of the chemistry of water but few of
them deal with the geochemical phenomena as such. In the present paper only a general outline can be given, merely touching on the
problems involved. The main question is to k n o w h o w groundwater acquires its chemical compoeition,
and what change m a y come about in it. There is no doubt that the initial dissolution of salts occurs in the topsoil which
is itself only the end product of the action of infiltrating water on rocks. During percolation through the zone of aeration there is little chance of any changes
in composition taking place, owing to the speed of the water's passage through it; but in the underground reservoirs water movement is usually very slow and there is time for the reactions between water and rocks to reach a much more advanced stage.
Further, secondary phenomena such as base exchanges and mineral concentration m a y occur and completely change the characteristics of the water.
DIS s OLUTION 1 [164]
Groundwater gets its mineral solutes primarily from its attack on the upper level of the topsoil mother rock; the thickness of the layer of decomposition varies according to the geological formation and the climate and in certain cases amounts to no more than a mere corrosion surface. However, the phenomena of mineralization are complex, for in the zone of evapotranspiration downward water movement towards the aquifer is the result of infiltration and evapotranspiration and it is the resultant of this res- pective associated chemical phenomena-dissolution and precipitation-which deter- mines the composition of the water of infiltration finally reaching the aquifer.
1. H. Schoeller, Courr d'hydrogdologie, Paris, Institut Franpeis du Pdtrole, 1949, 1 vol. 364 psges.
54

Geochemistry of groundwaier
In temperate climates the chemical phenomena occurring in the soil are mainly dissolution in the A horizon and some dissolution, but also precipitation, in the B horizon. Obviously the main attack on mineral elements takes place in the zone of decomposition, with the precipitations in the B horizon to be reckoned, from the point of view of their permanent effect, as no more than a transitory phenomenon in the dynamic equilibrium. In the and zones in general, and deserts in particular, the main attack on mineral
elements is still in the upper layer of the mother rock, but the transitory phenomena of precipitation of minerals in the soil acquire much more importance owing to the higher degree of evapotranspiration and lower rainfall.
However, the aridity m a y be so great, particularly in deserts, that on certain form- ations such as unfissured limestones, vegetation cannot take root and create soil. The water’s attack on the mother rock is then limited by the almost entire absence
of the principal agent of decomposition, the carbon dioxide produced in and by a living topsoil. Immediately it enters the soil, water picks up N,, O,, H,, He, CO,, and NH,. Study
of the respective solubility of these gases shows: (i) that the majority of the commonest gases in contact with water, N,, 0,, H,, and He, are of approximately equal solubility with the highest degree no more than double the lowest; (ii) that with certain other very common gases, CO,, H,S, and NH,, solubility is very m u c h higher, from 40 to 200 times the minimum, even 60,000 times in the case of NH,. In the soil and in the zone of decomposition of the mother rock, certain elements
are in any case soluble by water, e.g. NaC1, gypsum CaSO, (2H,O), anhydrite CaSO,, limestone CaCO,, dolomites and calcareous dolomites (CaMg)CO,, etc., though not all equally so, their respective coefficients of solubility being as follows:
g,/kg. of solution at 1OoC g./kg. of solution at l0OC
CaCO, 0.014
Na,CO, 107 NaHCO, 15.8 CaSO, 1.926
MgCO, 0.1 236
394 349 263
82.5
In actual practice the essential factor in the dissolution of minerals in the soil and the zone of decomposition is chemical action including the following forms: 1. Hydration, e.g. of biotite, of anhydrite and of haematite. 2. Hydrolysis, particularly with the silicates. 3. Oxidation of sulphides, oxygen-short oxides, ferric manganese, etc., in which
connexion it should be noted that the oxidation of sulphides produces sulphuric acid, a powerful corrosive. Oxldation is m a x i m u m nearest the atmospheric air whence the oxygen is derived,
i.e. in the upper part of the soil. In most cases the oxygen cannot penetrate very deeply as it is gradually consumed in its descent and there is thus no decrease in the bedrock‘s reducing properties.
4. Chemical attack. The principal agent of chemical change acting on the minerals present is undoubtedly carbonic acid gas. Only a very small proportion of the CO, at work comes from the CO, dissolved by rain from atmospheric air, in which, at 0.0003, the pressure of the gas is only sufficient to dissolve 50 mg. of C0,Ca. In actual fact almost all the CO, acting on earth formations comes from the soil air when the combined yield from the biological and chemical combustion of the organic matter in the soil, from the respiration of plant roots and from various living organisms of the topsoil creates CO, pressure of from 0.001 to 0.01. To this must be added the further amounts deriving from the action of the soil’s organic
55
Arid zone hydrology
acids, sulphuric acid produced by the oxidation of sulphides and nitric acid formed in the course of the nitrification process.
In normal groundwater, the NCO, content varies between 180 and 550 mg./litre and rarely exceeds 600 mg./litre. Thc usual values arc between 180 and 360 mg., i.e. corresponds to CO, pressures comparable to those in cultivable soils.
It is the carbonic acid gas which is the active agent in the decomposition of rocks, though the part played by sulphuric acid, nitric acid and the organic acids mentioned earlier is not negligble. The action of carbonic acid gas on limestone can be expressed by the following equa-
tion:
in which 6 is the CO, pressure; U the coefficient of dissolution of the free CO, in the water, [HZCO3] is the concentration in mols of free CO, dissolved in the water in equi- librium with the solution of [HCO; ] and [ea++]; [HCO; 1, [Ca] are the concentration in mols, k,, k,, and k, are respectively the first and second dissociation constants of carbonic acid and the solubility product of CaCO,.
The decomposition of silicates is also ultimately due more or less directly to the action of carbonic acid gas. Admittedly there is initially a true dissoluiion of silicates but the chief factor deter-
mining the extent of the attack is the acidity or high alkalinity of the water and the acidity of water is fundamentally due to carboiiic acid gas. For orthoclase the process could be expressed:
8 H,O + K[MSi,O,] - K+ + 3Si4f + AI'+ + 16 OH- AI3+ + 3 OH- + Al(OH), Si4+ + 3 OH- + SiO, + 3 H+ SiOF + H,O -+ SiO, + 2 OH-
The aluminium and silica then react to produce kaolinitc under acid and mont- morillonite or illites under basic conditions.
Thus the feldspars release K, N a and Ca ions and molecular silica but very little colloidal silica.
The ferromagnesian minerals also contribute the elements listed above but with Mg and F e in addition. As the silicates release far less C1 than alkalis, it will be clear that there is an inherent chlorine-alkali imbalance which is a Characteristic feature of water from crystalline and crystallophyllian rocks and not to be confused with the imbalance due to base exchanges.
W A T E R FROB1 THE MAIN T Y P E S OF R O C K 1
Thus the chemical composition of water depends on the nature of the terrain.
In Calcareous Terrains
The dissolved CO, quickly reaches its C0,Ca saturation point. However, and since,
1. H. Sohoeller, .L'inBueuee du dimat YUT la composition chimique des eaux souterrainen vadoses'. Bull. Sur. gdof. Fr.. (5). vol. 11, 1941, pp. 267-89. and C o w s d'hydrogiologie, Paris, Institut Franqais du Pdtrol~, 1949, 1 vol., 364 pp.
56
Geochemistry of groundwater
as w e have seen, the CO, pressure in the soil varies only very slightly, the values of CO,H and Ca in the water, which fluctuate correspondingly, vary only within the narrow limits indicated above. This then is an automatic limit to the dissolution of the calcium carbonate. With
the other salts found in limestones, the extent of solution will depend on the nature of the actual formation. Broadly speaking the water in limestones circulates mainly, even if not entirely,
through fissures, so that the rock surface exposed to attack is considerably reduced in relation to the volume of water circulating. Further, the most soluble salts, the chlorides and sulphates, are locked in the lime-
stone and in highly compacted or crystalline formations. The lack of pores prevents the water reaching them at any depth, maximum penetration being a few decimetres at most when the limestone is in process of decomposition. Naturally the position is not the same with limestones of high porosity, but in either
case, these particular salts can only be released after carbonates in which they are held have first been dissolved. Hence, the chemical composition of the water is bound, to some extent, to conform to that of the limestone. As limestone is generally poor in chlorides and sulphates, water from it will be rich first and foremost in carbonates and will be poor in chlorides and sulphates, while the dry residue will be low. In dolomites the phenomena are of the same kind as in limestones but broadly
speaking the rMglrCa ratio would appear to be smaller in the water than in the rock, particularly in dolomitic limestones, since calcite is more soluble than dolomite.
In Gypsum and Saliferous Formations
Water quickly picks up salts, not because it is in contact with extensive rock surfaces or for prolonged periods but because of the high solubility of gypsum and because of the high content of other very soluble salts, with consequent speedy dissolution. Water moving through gypsum speedily acquires a high content of CaSO, very
often reaching actual saturation. Similarly water in saliferous terrains contains a very high quantity of chlorides. It should be mentioned that the increase of SO, entails an increase not only of cal-
cium but also of magnesium, of which gypsum always contains a fairly large propor- tion. Again, once CaSO, saturation is reached the Ca can no longer increase and only MgSO, can still be dissolved. It then comes about that the water is extremely high in SO, and C1 and Ca, Mg and
Na, yielding dry residues which m a y rise to more than 200 g./litre. It is to be noted that the concentration of combined CO, remains near the normal
and even tends to remain below rather than rise above it when SO, is high as a result of the influence of the solubility product S0,Ca. Lastly, as the solubility of lime sulphate increases with the amount of chloride in
solution, water high in sodium chloride is apt to have a higher SO, and Ca content than merely gypseous water. The ratio rMg/rCa+ then has a tendency to increase.
Water in Contact with Mads and Clays
Groundwater may be in contact with marls, clays or shales (rnarnolites, argillites). The porosity of these rocks is often very high, sometimes exceeding 50 per cent, with very fine and hence very numerous pores, giving an enormous area of contact bet- ween water and rock. They are commonly rated as impermeable and water movement through them is very slow; and, as chemical analysis shows, the colloidal nature of
The symbol I indicates thut the clrmeuts b e h e which it ia plarrd arc cxprcssed in milliequivalents.
57
Arid zone hydrology
part of their constituent elements and the fineness of their pores have enabled the marla and clays to retain large quantities of salts (chlorides, sulphatea) by adsorption either by the sediments during deposition or from connate sea water which can some- times have amounted to 50 per cent of the total volume of the sediment. It follows that water in contact with argillaceous rocks is extremely high in salts with a dry residue often amounting to several grammes.
The combined CO, remains at the ordinary level but the proportions of SO, and C1 are higher than in water from other rocks, with the exception of gypseous and salife- rous formations, and usually exceed the HCO, content. The higher of the two is sometimes SO, and sometimes C1; in the former case there are of course corresponding high values of Ca and Mg, and in the latter of Na. Base exchanges are extremely c o m m o n when water is in contact with argdlaceous
rocks, of Ca and Mg ions for N a ions from sodic, and of N a and Mg ions for Ca ions from calcareous clays. The SiO, content is greater than with other types of water.
Water from Sands and Ordinary Sandstones
Sands and m a n y sandstones are highly porous. The rock surface exposed to attack is thus very large and the water quickly takes up large quantities of cations and anions, which are all the greater for the lengthier contact between water and rock as a result of the much slower rate of flow compared with that in limestone. Hence water from sands and sandstones is normally more heavily charged with salts (SO,, C1, Na, Mg, Ca) than that from limestones. The CO, content is the same as for all other water in the same climatic region.
Water from Purely Siliceous Sands and Sandstones
In this case, since the rock consists almost wholly of quartz, there are very few ele- ments that the water can pick up even in arid regions. Of course, as elsewhere, the dissolved CO, provides a proportion of HCO, and CO,
ions by dissolution, but this type of rock contains no carbonates and the additional ions which would be provided by their dissolution are lacking.
Hence the HCO, ion content is low, from a few milligrammes to a few centigrammes only. As the amounts of Ca and Mg ions are very low, not all of the equilibrium quantity of carbonic acid is saturated. Thus there is active CO, left. A final result of the low HCO, ion content is a low pH, round about 6 or 5. While C1 and SO, are often lower than in water from calcareous formations-they amount to a few centigrammes at most-the HCO, content is so low that either m a y equal or, as more often happens, exceed it. Ca and Mg are low and N a m a y exceed Ca.
Water in Contact with Organic Matter
Water m a y be in contact with organic matter such as peat, lignite, coal and hydro- carbons which are reducing media acting on sulphates through these bacteria. The consequences are: (a) a lowering of the SO, content and hence also of rSO,/rCl, compar- ed to water of similar origin which has not been in contact with organic matter; (b) some production of H,S; (c) a rise in the amount of combined CO,. This last phenomenon is a consequence of the large amounts of free CO, produced by the chemical and bio- logical combustion of organic matter.
Crystalline and crystallophyllian rocks yield water which is completely different from that of sedimentary formations. They are highly resistant to the solvent action of water which is immeasurably lower on them than on the main sedimentary rocks.
58

Geochemistry of groundwater
Granite and Gneiss
The water from their formations will gain the following elements from the decom- position of the rocks’ mineral components: quartz, SiO, - (traces); orthose, SiO, + K; plagioclases, SiO, + Na+ + Ca*; biotite, K + Fe; muscovite, K.
It will therefore contain large quantities of silica, alkalis and calcium and of HCO, ions got from the CO, in the soil air. The alkali/calcium ratio will depend on the cal- cium content of the plagioclases and on h o w they compare in quantity with the orthose. In ordinary granites
K,O + Na,O CaO 37
i.e. it is high; water accordingly is predominantly alkaline. A s it is always difficult for water to attack granite, that yielded by granite formations will be very low in a number of ions and will always show an excess of CO, since this will not have been cancelled out by bases. The water will therefore be extremely acid to begin with, but with the loss of its carbonic acid gas m a y become highly alkaline, the solutes being predomi- nantly alkalis. As with all igneous rock, the dry residue is low owing to the slowness of the decomposition process.
W h e n granite is attacked by CO,, m u c h the largest item released from the rock is silica, but the water can only retain relatively small quantities in solution (10 to 40 mg.). Iron, too, which is often the next largest item lost after silica, can only remain in solution in limited quantities varying with the acidity, CO, content and oxide reduction potential of the water and is accordingly found in the water in quantities varying only from a few tenths of a milligramme to a few milligrammes. On the other hand the alkalis which are dissolved out of the rock in proportions
near or sometimes even superior to those of iron, can be held in solution in larger quan- tities. The alkali content of the water is a function of the rate of the rock’s reaction to CO, and is accordingly very low, below 2 milliequivalents. Despite the predomin- ance of K in the rocks, the N a is more important than the K content in the water, K being retained by adsorption to the residue from the decomposition process.
With the exception of amphibolitic granites, granite rocks release smaller quantities of their bases and metals than of their alkalis. There is thus a tendency for Ca and Mg to be less abundant than Na; however the difference is small, rMgJrCa < 1. Amounts of C1 and SO, ions are always low-less than 2 milliequivalents. The HCO,
content is still small and p H is low as for all igneous rocks. The water from such rocks generally has corrosive qualities. While there are m a n y exceptions there is commonly more rNa than rC1, and imbal-
ance which is inherent and not due to base exchanges.
Basalts
The loss of silica from the decomposition of basalts is less considerable than from the granites. Nevertheless water from basalt rocks is, generally speaking, richer in silica than water from granites, running to about 20-30 mg./litre. While more iron is extracted from basalts than from granites, water from basalt does not contain more iron than other water of like pH [HCO,] and oxide-reduction potential.
With basalts, however, the large quantities of Ca and Mg released from the rocks result in Ca and Mg predominating in the water, though there are only about 3 milli- equivalents of Ca and 2 of Mg. N a is still low and does not normally exceed 2 milliequi- valent s. SO, and C1 are also very low, as is HCO,, though this last is a little higher than in
water from granite, so that p H is less acid.
59

Arid zone hydrology
The dry residue is naturally very low and rarely exceeds 400 mg./he. T o recapitulate, water from igneous rocks exhibits the following characteristics:
Dry residue: low as a result of the great difficulty with which the elements are dissolved;
Alkaline elements normally predominate; Ca very low, only reaching a significant figure in diorites amphibolites; Mg always on the low side; Ye from ferromagnesian minerals such as magnetite, reduced to solution as a result
C1 very low, owing to the rarity of chlorides; rC1 < rNa. Possibly some SO, from pyrites but always in small quantities; SiO, abundant; p H initially low. However water which has lost its free CO,(e.g. water which has
long been in contact with atmospheric air) has a high pH in consequence of the predominance of alkalis able to remain in solution.
of the acidity of the water;
MODIFYING PHENOMENA [168]
During its passage underground and even immediately on accumulation in the sod, groundwater undergoes frequent changes in chemical composition, the most important of which are reductions, base exchanges and concentration.
Reductions
It is not proposed to enlarge on these phenomena, to which a multitude of publications has already been devoted. The most important elements affected by them are the sul- phates though it must nevertheless not be forgotten that reduction of nitrates m a y also take place.
Some groundwater, in complete contrast to other water emerging from identical geological formations or even from the same underground reservoirs, is abnormally low in SO, or contains none at all but, on the other hand, often contains sulphuretted hydrogen, sulphides, hyposulphites, etc. The low SO, content is always associated with the presence of organic matter and also sometimes of one of the reduced elements mentioned above. The organic matter m a y be decomposing vegetable or animal remains, peat, lignite, coal or petroleum.
It was formerly thought that the reduction of the sulphates was brought about by the organic matter itself. However, it is n o w known that it is caused by a very specific anaerobic micro-organism (Sporovibrio desulfuricans, with its varieties aestuarii and Sporovibrio rubentschicki). In the biochemical processes of which these micro-organisms are the agents, the
hydrogen donor is an organic compound or even molecular hydrogen. Organic com- pounds are oxidized anaerobically by the action of a dehydrogenase while molecular hydrogen is activated directly by a hydrogenase. The hydrogen acceptor is initially the oxygen dissolved in the water. Once this has all been used up, the acceptors become successively SO,, SO9, SO, and SO in a four-stage progression comparing to the stan- dard Kluyver scheme:
SO,H, -+ SO,H, -+ SO,H, -+ SOH, + SH, This gives us the total resultant:
SO; + 8H+ -+ 4H,O + Ss + 8e 60

Geochemistry of groundwaier
and the following equilibria: [SOT] [H+I8
rs=1 Eh = Eo f 0.0075 log with E, = 0.14 at 250
S- + 2H+ Ca* + S= Cas + H,S HzO + CO,
HZCO, HCO,
Catt- + CO, H2O
L -
HZS CaS CaSH,S H2CO3 H+ + HCO; H+ + CO; CaCO, H+ + OH-
This reduction is accompanied by oxidation of the organic compounds and hence by the production of CO, which in turn will produce large quantities of CO;, HCO; and H+ ions. Thus the reduction of the sulphates will on the one hand reduce the SO, content and on the other produce the ions of S,O& S-, HCO; and H+ ions and hence of H,S.
Base Exchanges
Groundwater is also liable to come into contact with a variety of substances having the property of exchanging some of their o w n ions against ions contained in the water.
The powers of adsorption of these substances vary widely through a whole gamut of intermediate degrees, between two extreme forms, physical or V a n der Waals adsorption in which the attraction between adsorbant and adsorbate is weak, and chemical adsorption with strong valency bond. Thus there is not only fixation on these surfaces or the interior of these substances but an exchange of their cations with those of the water takes place. Hence there is an exchange of bases and it is to be noted that a similar exchange of anions m a y also take place if the physical characteristics of the adsorbant permit of it. The substances occurring in geological strata and liable to adsorb elements from
or exchange ions with groundwater are the following: (a) argillaceous minerals, glau- conite; (b) zeolite minerals; (c) organic substances, e.g. humus.
Clays and humus give positively charged colloids which are thus able to fix and exchange cations, i.e. bases. The colloids from alumina are positive while those from ferric hydroxide are amphoteric, i.e. they m a y be either positive or negative accord- ing to the pH of the water and hence exchange either cations or anions as the case m a y be. In the argillaceous minerals such as kaolinite, halloysite, the illites, the chlorites etc.,
where fixation of cations takes place mainly on the outer surfaces, the exchange capacity is relatively low. It is not the case with such minerals as montmorillonite, and vermiculite, when exchanges m a y likewise take place within the foliations and there is extensive fixation on the surface faces. In these rocks the exchange capacity is high.
Exchanges m a y likewise be produced by zeolites, glauconite and organic matters. As it is often difficult to know which are the substances which have exchanged bases with bases in the water it is proposed to call them all permutolites. The degree of fixation is not dependent solely on the nature of the rock but also
on the nature of the cations, the strength of cation fixation being inversely propor- tionate to the degree of hydration of the ion. At an equal degree of hydration, fix- ation of bivalent ions is stronger than that of monovalent ions. The power of fixation, f, is thus broadly:
fH > fRb >fBa > fSr > fCa > fMg > f K > fNa > fG 61

Arid wne hydrology
Potassium plays a special part. It is held in the illites by chemisorption and is extremely difficult to dislodge. In addition it has the exact dimensions (ionic diameter 3.66 A) to be able to fit into the interstices of the oxygen layer. NH, has a role similar to that of K.
Adsorption is likewise proportionate to the respective cations concentrations in the adsorbant and the liquid. The concentration in the adsorbant varies much less rapidly than that in the liquid.
According to Wiegener and Seeny the ratio between the initial stable concentra- tion, a, of cations in the liquid and their concentration, x, in the post-adsorption stable phase, both expressed in milliequivalents, is:
where a - x represents the quantity of cations exchanged and moving from the liquid to the clay and vice-versa. If w e call
a - x i.e.b. = (T) the base exchange index, in the sense of the definition given later, w e get:
k i.e.b. = 2 a (”-):/ a - x
Lastly it should be noted that the base exchange index will be the more complete- i.e. the nearer equilibrium-in proportion as the solution has been longer in contact with the exchanger. To conclude: (a) the absolute quantity of salts in groundwater is the greater in
proportion as the water was originally richer in exchangeable elements; (b) the relative quantity of salts in groundwater is the greater, or in other words the exchange is more complete in a given time, in proportion as the concentration was low and the time of contact great. Turning n o w to the case of a concurrent exchange of more than one cation, e.g.
Ca and Mg, between a permutolite and water, w e have: r ~ g l water - /[Mgj perm./& L C ~ I water ][~al perm.\‘
-
Hence, when base exchangers have established an equilibrium with water in which the relative proportions of the cations are:
or rMge/rCa,, rNa,/rCa,, rNa,/rMg,
the values being known, the cation ratios in the exchangers themselves will be:
rMg,/rCa,, rKa,/rCa,, rNa,/rMg,
rNa, or
rea, + %e. with well defined values. If another kind of water comes into contact with these base exchanges, there will
be a tendency towards the establishment of a n e w equilibrium between the exchangers and the new lot of water. It will be clear that the modification of the new water’s cation ratio will be in a direction tending to approximate them to the values of the corresponding ratios in the original water.
62

Geochemistry of grourulwa&er
These basic ratios provide a background for the study of the relations between
The principal cations contained in water are Naf, K+, Ca++, Mgff, and H+. We can base exchanges and the origin of the water.
therefore get the following exchanges:
perm. 2Na + Ca* perm. Ca + 2Na+ perm. 2Na + Mgft perm. Mg + 2Na+ perm. Caft + Mgft % perm. Mg + Caft perm. 2Na + 2 K perm. 2K + 2Na+
The base exchanges are thus liable completely to alter the cation ratios in the water and in particular the ratios K/Na, Na/Ca, Na/Mg, Mg/Ca. To evaluate the degree to which base exchange has taken place, the following indices
can be applied when N a and K in the water are exchanged with Mg and Ca in the permutolite (i.e.b. being then positive):
when the exchange of ions is the opposite way round (i.e.b. being then negative), the term index of disequihbrium would then be appropriate.
Alkaline chloride. The term ‘base exchange index’ will be abandoned as there m a y be an inherent disequilibrium already, as in sea water, where rC1 > rNa - rK and in water from crystalline rocks, where rC1< rNa + rK without any base exchange having occurred.
Concentration 1
Mineral concentration m a y be effected by evaporation or by dissolution. In concen- tration by evaporation there is a basically climatic influence at work. Evaporation takes place mainly in groundwater catchment areas, when inatrating rainfall first reaches the soil and then returns to the atmosphere from the evaporation zone. The soil water thus becomes progressively more mineralized and the next fall of rain of sufficient magnitude for deep infiltration carries the concentrated solutions in more or less diluted form from the soil to the water-table. It will readily be appreciated that the greater the interval between infiltrating precipitations replenishing the water-table, the sparser the rainfall in general and the higher the temperature and the deficit in atmospheric saturation, the higher will be the mineralization of the waters of infiltration. This is why the mineralization of groundwater is progressively greater from the temperate to the tropical regions and falls again from the tropical to the equatorial regions.2
It should nevertheless be noted that there m a y be concentration by evaporation in deep-lying water bodies when there are escapes of gas from them, the gas drawing up water vapour with it. This occurs more particularly with the water in certain petro- liferous formations from which gaseous hydrocarbons and carbonic acid gasa are released. As regards mineralization by dissolution, the main factors are temperature, pres-
sure, the area of the interface, the volume of the water and the time elapsing. W e know from Nernst’s law that the rate of dissolution (of a solid) is proportional to a saturation deficit. Hence the mineralization of underground water will be the higher
1. H. Schoellcr, ‘Les modiGcatious de la composition chimique de l’eau d a m une mCme nappe’, Association inlermtienals
2. idem, ‘L’intlueuce du climat sur la composition chimiquo des earn souterraines vadoses’, Bull. Soc. gbl. Fr., (5). t. XI.
3. R. Van A. Mills, Roger C. Wells, ‘The evaporation and concentration of waters associated with petroleum and natural
d’hydrdogie acientihipue. Aswmbkk #Oslo, 1948, pp. 124-9.
1941. pp. 267-89.
gas’, W.S. Geological S’uruq. Bull. 623, 1919, 104 pl.. 5 fig.
63
Arid zone hydrology
in proportion as the water lies deeper below the surface-i.e., as its temperature is higher-as aquifers of primary permeability are finer grained or those of secondary permeability more diaclastic, as pores or fissures are more constricted and circulation consequently slower and if the length of the reservoir is greater.
Obviously mineral concentration by dissolution cannot go beyond a certain stage, as water tends towards a state of physico-chemical equilibrium with the rock in which it circulates. Equilibrium is usually only approximated after a fairly extensive lapse of time (perfect equilibrium being reached only after an infinite time), the length being conditioned by the nature of the formation and, under Nernst's law, by the actual concentration of salts in the water.
Turning n o w to the main changes in the water's chemical composition resulting from concentration by dissolution, the main radicals found in water are: Ca, Mg, Na, C1, SO,, CO,, and HCO,, and the question for discussion is therefore the respective solubility products of the salts resulting from the combination of these ions. The salts can be tabulated in ascending order of solubility, S (number of grammes per kilo- gramme of water) as follows:
Grammes per kilogramme of water Solubility prodim
CaCO, CaSO, MgCO,, 3H,O NaHCO, Na,SO, Na,CO, NaCl MgSO, M%CL CaCI,
0.013 at 18OC. 2.016 at 18OC.
96 at 200C. 193 at 20°C. 213 at 2OOC. 358 at 20OC. 355 at 2OoC. 546 at 2OOC. 745 at 2OoC.
0.48 x lo-@ at 25OC. 6.1 x 10W5 at 16OC. 1.4 x lop4 at 16%
F r o m the other side, the main salts found in rocks and hence dissolvable in large quantities are CaCO,, CaSO,, MgCOS, and NaCl. The others are only found in trace quantities or quite exceptionally in certain formations. W e can already reckon that some salts can never be precipitated from vadose ground water, e.g. N a H C O , and Na,CO,, as it would necessitate combined CO, values of 2,500 to 7,500 mg./litre at least, which are never found in meteoric groundwater of this kind.
Except from exclusively siliceous or silicified rock formations groundwater is already pretty well saturated with calcium carbonate and bicarbonate to begin with, while the carbonic acid gas pressure in groundwater always remains approximately the same1 as that in the soil air of the topsoil, i.e. between 0.005 and 0.06. Thus concentration by dissolution cannot produce an increase in the carbonate and bicarbonate content of groundwater save obviously if the water picks up ions other than Ca, CO, and HCQ,; this will increase the solubility product though never to any great extent. On the other hand the dissolution of salts containing Ca ions, e.g. CaSO,, will have the cffect of reducing the CO, and HCQ, ion content. The upshot will be that the combined CO, content will usually remain between certain limits, an upper limit determined by the CO, pressure which m a y rise slightly according to the content of ions other than Ca, CO, and HCO,, and a lower limit which m a y decrease in proportion to the content of Ca ions. Broadly speaking the combined CO, oscillates between 75 and 240 mg. Leaving aside the acid water from crystalline or from sandstone rocks, w e m a y thus
1. H. Schoeller. 'L'inBuence du climat SUI la composition chimique des eaux souterrainen vadoses'. op. cit.. p. 284.
64

Geochemistry of groundwaler
conclude that, since underground water is pretty well saturated with calcium car- bonate, if the mineral concentration is equal to or lower than the normal solubility value of CaCO,, i.e. 300 to 400 mg., its mineral content must be almost exclusively calcium bicarbonate as calcium carbonate is the first salt to be dissolved in the topsoil.
The salt of next lowest solubility, and also one of the commonest, is gypsum. When water dissolves gypsum Ca ions are taken up which automatically lower the combined CO, in solution. Indeed it is notable that water very high in CaSO, always has a com- bined CO, content below the normal. The limit of solubility of CaSO, can easily be reached owing to the salt’s abundance and can even be exceeded in the course of nature if the water dissolves salts containing ions other than Ca and SO,. Water with NaCl in solution can thus have a much greater CaSO, content. The solubility of CaS0,2H,O (counted in terms of CaSO,), rises from 2.1 g. at 200 C for NaCl = 0, up to 7.3 g. for a concentration of NaCl = 146.2 g. falling back again for NaCl concentrations higher than that. Solubility could be diminished by the solution of further calcium salts, but of these salts CaCl, is practically non-existent in rocks and CaCO, is already at maximum concentration. However the dissolution of sulphates, e.g. Na,SO, or MgSO, m a y result in the solubility product being exceeded and CaCO, being precipitated. Such precipitations of calcium sulphate have been observed in rocks. There can be no doubt that a solution of magnesium sulphate does occur in gypseous formations as it is observable that groundwater with high SO, values always has a very high Mg content which brings with it an increase in the Mg/Ca and Na/Ca ratios.
The commonest mineral in groundwater, of higher solubility than those already dealt with, is NaCl. Transits of great length, very prolonged contacts or vast inter- faces all raise the level of NaCl in the water, but not saturation which only occurs quite exceptionally; normally the NaCl concentration in the water only increases to parity with that in the rock. For anything near a saturation to be reached, the aquifer itself needs to be saliferous. It is thus the exception to find values of this magnitude.
Finally it is observable that the greater the mineralization of water above a certain concentration, corresponding to the saturation level of calcium sulphate, the greater must be the decline of the SO,/Cl, and the increase of the Na/Ca, Na/Mg and even Mg/Ca ratios.
Concentration by evaporation obeys approximately the same rules as above and the variations in the ratios of the different radicals occur in the same order. In this instance however, precipitation m a y be more frequent. The 6rst salt to be precipitated in the soil is CaCO, in the form of calcareous concretions to be found in temperate regions or tuff in steppe or pre-desert areas; the second is gypsum in desert areas follow- ed by sodium salts, carbonate or sulphate, according to the water’s richness in CO, and SO, radicals.
From the foregoing it is to be concluded that, given a combined CO, content not exceeding 300 mg., we will usually get, first and foremost, water1 in which:
rCO, > rC1 or rSO, above a given total dissolved mineral concentration, usually approximately 60 milli- equivalent s ,
rC1 or rSO,> rCO,
and above a still higher concentration, usually in the neighbourhood of 180 milli- equivalents,
rC1) rSO,> rC0,
if no magnesium salts have been dissolved. Of course, if magnesium salts are present, the values of SO, m a y become much higher. The writer has found that, for all practical 1. H. Schoeller. ‘Sur la concentration des sels dissous dans lea eaux souterrainen’. C. R. du Congris d‘Erf0.d du ComW d’Plu&
&a e a u souterraines, Rabat, 1934, pp. 41-54.
5 65
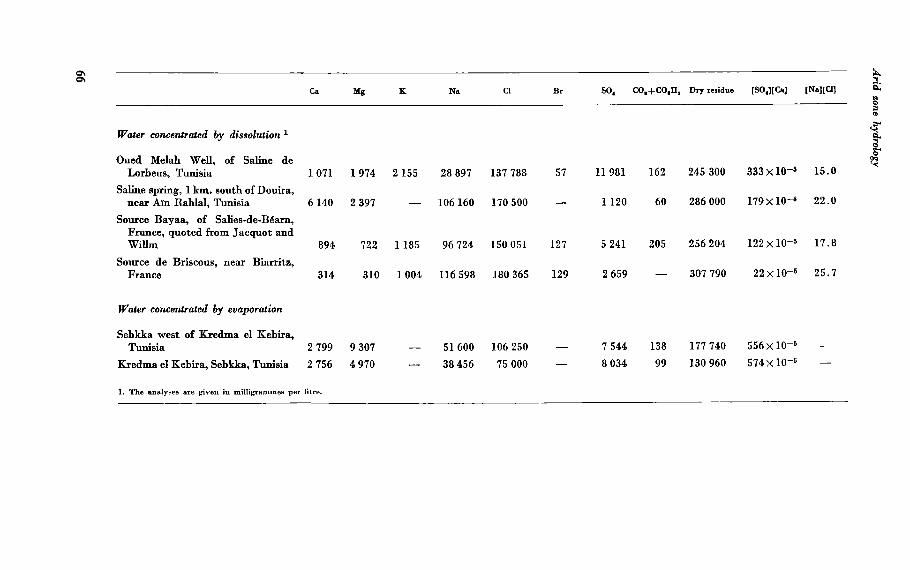
Arid zone hydrology 9
m 3
10 I 0 3
X m m m
0 0
03
In w
hl
@J W 3
3
m 3 &
co
t- In
m a
m
t- l- 3
t-
%
m
hl
m
In rl N
m d
d
t- O
rl
9
N N
ID I 0 3
X m t-
rl
0
0 0
W N a
0
W
0
N 3
r( I 0
0
v)
0
t- 3
0
W
r(
0
rl I t- m N
m
0
e 3
\o
a
t- rl
10 I 0
rl
X N N 3
e 0
e4 W
In hl
In 0
w
3
e
N
m
r- @J 3
d
m 0
0
In 3
e
hl t- W m
In
d 3
a
w
hl c- e
m
W
t- m N
I4
I X 2
hl N
0
m
t- t- 0
m I m
v)
W
e4
m w 3
In W m
0
a 3
m m
In W 3 3
w 0
0 4
2
03
f m
II
IOD
II
00
33
xx
w
e
mt-
mm
00
ew
t-m
P-
0
P-03
43
wm
m
m
3
we
w
m
In
0
c-a
II
00
mo
N
O
\om
ot-
i
ow
o
m
WW
3
w
mm
It
t-
0
ot-
me
m
m
mw
mIn
t-t-
Nhl
66

Geochemistry of groundwater
purposes, 290 mdliequivalents can be taken as the level above which we invariably get
rC1) rSOI> rC0,.
W e thus see that, if for any reason whatever, groundwater becomes highly minera- lized, whether through evaporation from an aquifer rising near to the surface even in the soil of the replenishment zone or through progressive accumulation through slow circulation, or through the length of transits bringing time and interface factors into operation, that water completely changes its nature approximating progressively to a type of composition:
rC1> rSO, > rC8, and rNa > rMg > rCa which is more or less the composition of sea water. Below are quoted a few specific cases of water very near saturation point either
in NaCl or in S0,Ca. There are subsurface reservoirs in which there is no circulation, either because the
external hydrostatic pressure at every point on the reservoir’s periphery equals the internal pressure, or because the aquifer is completely enclosed. Similarly, there may be circulation in part ofa reservoir only with stagnant water in other parts. In stagnant water of this kind, mineral concentration may be total, there being no limiting time factor, and the water should therefore be at or near chemical equilibrium with the rock. Indeed, only very small quantities of soluble salts in the rock and of elements liable to chemical attack by the water are needed for mineralization to be high. Take the case of a rock of density d containing n per cent by weight of NaCl, and
of porosity m. This means that one cubic metre of rock contains 1,O.O dn (I-rn) kg. of NaC1, and one litre of the imbibed water contains 1,000 dn (I-m) grammes of salts, given a state of equilibrium in which the concentrations in water and rock, volume for volume, are equal. Thus, if rock of porosity 0.20 and real density 2.65 contains only 2 Oio0 NaCl, water in equilibrium with the rock would contain 4.240 g. of NaCl per litre. Clays can contain from 1 to 2 per cent of NaCl. Taking d = 2.2 and m = 0.40, the above calculation gives us a concentration of from 13.2 to 26.4 g. of NaCl per litre of water. These proportions are those for outcrop rocks which have already undergone
leaching, and it follows that deep-lying water in nnleached horizons m a y show salt concentrations which are much higher. Hence, usually, the high NaCl content is taken as the characteristic allowing the recognition of connate water, i.e. water trapped in the sedimentary rocks at the time they were deposited, thereafter becoming ‘fossil water’. In actual practice this cannot be one, since it is common to other types of water. A high NaCl content does not necessarily indicate fossil sea water but m a y sim- ply mean that there has been salt concentration by evaporation or merely by disso- lution, in the latter case often by stagnant groundwater. The investigation of concentration and its effects on the chemical composition of
water can only be effected by reference to the solubility products: Thus for calcium carbonate it will be a matter of examining the product
[CO,=l [Ca++] = kc. In this instance, however, as the CO, component in the water depends on the
proportion of dissolved CO,, consideration must also be given to the equation
[H,CO, en.] = - K’2 [HCO<ja LCa++] K‘K‘c 22 4 6‘ eq. = [H,CO,] eq.
For calcium sulphate the product to be examined will be
[SO4] [Cal = K8 67
Arid zone hydrology
And in certain cases where saturation in NaCl m a y have been reached, the product examined will be
[Nal [Cll = K N ~ c ~ It should be borne in mind that these products vary with temperature and the ionic strength of the solution.
PRESENTATION OF ANALYSES
From the foregoing, it emerges that there are certain absolute values, ratios and pro- ducts which should be treated as significant.
Absolute Values and Products
HCOB The most important absolute value for consideration is that of HCO,. Generally speak- ing it is fairly constant as it is governed by the pressure of CO, in soil and interstitial air and this itself varies only slightly. HCO, values are below normal when the water comes into contact with air in which CO, pressure is lower than in soil or interstitial air. Examples are sea water, and the water in lakes and rivers, where CO, pressure in the ambient air is only 0.0003. [HCO?] values are above normal when the water is in contact with CO, in abnormal
proportions of volcanic or metamorphic origin or generated by organic materials (lignite, coal, hydrocarbons, etc.) which always have a tendency to oxidize.
However, in considering the absolute value of [HCO,],it is essential to take into account the [CO,] [Ca] solubility product as an addition of Ca, for instance, by base exchange or by the dissolution of gypsum, m a y have the effect of lowering the HCO, content if the value of the product is reached.
so, Here, too, the absolute value requires consideration. The dissolution of sulphates, and of gypsum in particular, gives extremely high concentration of SO, but once again, to assess the phenomenon correctly, the [SO,] [Ca] product must be studied.
Thus an extremely, and apparently abnormally, low SO, content m a y very well be due to a very large quantity of calcium being taken up, and not necessarily to reduc- tion of the sulphates by base exchange.
c1 The absolute value of chlorine is one of the most important pointers to the degree of stagnation of a body of groundwater, to its time of contact with the rock, to the length of the trajectory, and to the degree of evapotranspiration.
The absolute values of Ca, Mg and N a are dependent on those of the anions and base exchanges.
Relative Values
The following are the important relative values.
rSO,/rCl Is often characteristic of an entire groundwater reservoir in so far as the SO, con- centration nowhere reaches the m a x i m u m which the S0,Ca solubility product permits. When this is exceeded, the ratio cannot but diminish. When the mineral concentration of water is very low, less than 0.5 of rSO, or rC1, the
68
Geochemistry of groundwater
rSQ,/Cl ratio tends to vary either way as a very small addition of SO, or C1 causes a very large variation in the ratio.
rMg/rCa Is also often characteristic of a body of groundwater. However, the Mg and Ca contents generally increase with increasing SO, and C1 contents since [CO,] [Ca] remains fixed and since the SO, often brings Mg and Ca with it. Other values which are also often extremely significant [164] are
N a Na N a r--, r--, andr-- Mg Ca Ca + Mg
C1- N a r- c1 Is the index of chlorine-alkali imbalance, and expresses either the existence of an inherent imbalance, e.g. in water from crystalline rocks, or a base exchange.
Clearly, then, the presentation of analyses as percentile values cannot be suitable as it involves the loss of the pointers provided by the absolute values. Moreover, pre- sentation in this form is liable to conduce to false interpretations. Thus the water from petroleum-bearing formations is characterized by high absolute
HCO, values. But an analysis or graph reducing the milliequivalents to percentages would suggest that these values were very low simply because water from petroleum- bearing formations normally has a very high concentration of salts, particularly of NaC1. Analyses and graphs expressed in percentages are therefore to be strictly avoided. We must accordingly keep to analyses showing the anions and cations in grammes
or milligrammes per litre or kilogramme and then convert into milliequivalents. This leads to the question of h o w the conversion is to be effected.
Graphs and Tables
The most suitable graphs and tables are the following:
Collins's comparative table. The table consists of two parallel columns. In the left- hand column the values of rCa, rMg, rNa + 2 K are entered successively from bottom to top and in the right-hand column likewise, from bottom to top, rHCO, + rCOB, rSQ, and rC1. The chlorine-alkali imbalance is apparent at once.
The semi-logarithmic graph. 1 Semi-logarithmic paper is used. The abscissa is scaled arithmetically and the radicals rCa, rMg, rNa, rC1, rSO,, rHCO, + rCO, arranged along it from left to right at regular intervals, each equal to one-tenth of the value of the total concentration. Prom the ordinate, graduated on a logarithmic scale, are taken off the milliequivalent values of each of these elements (fig. 13) and the points thus plotted are joined by straight lines. Then if the types of water under exa- mination differ in composition, the curves will fall one above the other on the paper; when the straight line joining the points for two elements A and B in one type of water is parallel to that joining points for the same two elements A' and B' in another type, the ratio of these elements is the same in either case: A/B = A'/B'. With this type of graph it is also possible to determine, from the inclination of the
connecting lines, the ratios of the elements in a given type of water to each other, more particularly those elements which are deemed characteristic or of prime impor- tance,
r?uIg/rCa, rSO,/rCL, r - c1 , rNa/Ca, rNa/Mg. C1- Na
1. H. Schoeller. 'Utilit€ de la notion dee 6chanEeo de bases p m la cornparaison des eau= souterraineo vndoses', Bull. Soc. gPo2. Fr. (5), t. 5, 1935. pp. 651-57.
69

Arid sone hydrology
70

Geochemistry of groundwater
1 3
FIG. 14. Logarithmic scale of solubilities. 1. Scale of solubility of CaSO,, 2H,O for various ionic strengths and various temperatures. 2. Scale of k , calculation of tensions. 3. Scale of kr as a function of ionic strength and of temperature. 4. Scale of equilibrium pH.
71

Arid zone hydrology
It is also possible to find whether the solubility products have been reached. For instance, for the product [SO,] [Ca], all that is needed is to join the points
rSO, and rCa by a straight line: if the straight line cuts the vertical CaSO, (located half-way between rSO, and rCa) below the point of saturation S, saturation has not been reached. On the other hand, if the point of intersection is above S, there is super- saturation.
The position of S on the vertical is such that: - 1 1 2 2 log s = - log (rSO,) (&a) = - log (4[S04] [Ca]) X 10-O
[SO,] [Ca] = K, of the solubility product. For the solubility of Co,Ca, w e work the equation
A straight line is then drawn between rHCO, and rCa cutting a vertical erected at apoint between rHC0T and rCA one third of the distance between the two from rHC03 and two-thirds from rCa. If the point of intersection falls below kr, there is no satu- ration. If it is above kr, there is supersaturation. Allowance will, of course, be made for temperature and ionic strength.
For further details the reader is referred to [168].
T H E CHEMICAL COMPOSITION OF THE W A T E R IN U N D E R G R O U N D STRATA
Rules can be deduced from the examinations made of the chemical composition of subsurface water: 1. Water from rocks of the same petrographic nature, whatever their respective ages
or whatever the nature of the storage in them m a y exhibit c o m m o n characteristics. Thus with water from limestones w e shall usually find rCQ, > rSO, or rC1 and rCa > rMg or rNa; water from pure sandstones and sands and water from crystalline rocks will have a slight dry residue, and combined CO, below normal; water in contact with clay or marl materials will have a high dry residue and a sufficiently higher proportion of rC1 and rNa to give rC1 or rSO, > rCO, and rNa > rMg or &a; water from gypseous formations will have high dry residue and rSO, > rCO,.
Nevertheless, water from rocks of the same petrographic nature will not neces- sarily exhibit exactly the same chemical composition with identical characteristic proportions in all cases: chemical differences are produced by differences in the quality of the replenishment, in the length of transit through the aquifer and in climate.
2. Water from formations of the same petrographic nature, of the same age and in the same region usually has c o m m o n characteristics, and is m u c h more closely akin than water coming from formations of the same petrographic nature but of diffe- rent ages and belonging to different groundwater systems.
3. Nevertheless, the water from two separate bodies in the same geological horizon m a y differ in chemical composition even if they lie side by side. The greater the distance between groundwater bodies, the greater the likelihood of their presenting chemical differences. The recharge water m a y differ chemically, or the facies m a y change from point to point, or trajectories in the separate systems m a y differ in length, with consequent variations in the characteristic ratios. Again, in some groundwater systems the main circulation m a y be through the heart of the actual aquifer, and in others via the interface between the aquifer and the upper or lower confining bed, which is another source of differences in chemical composition.
72
Geochemistry of groundwater
4. On the other hand, waters from the same system in the same geological formation have relatively constant chemical characteristics which are much more so than those of the water from two separate systems even coming from the same horizon from petrographically identical rocks in it of the same age and even with the same substratum.
THE PROGRESSIVE CHANGES IN CHEMICAL COMPOSITION WITHIN A SINGLE GROUNDWATER BODY1
It should not be imagined that the chemical composition of the water in a ground- water reservoir remains constant from the point of entry to the point of exit. On the contrary, in moat cases there is a distinct chemical evolution. First and foremost, w e find an increase in the total mineral concentration through
the dissolution of further quantities of salts. Naturally, the increase in the total minera- lization is the more appreciable, in proportion as trajectory and time of contact are longer, and rate of flow slower and as the rock pores are smaller, i.e. the water- rock interface more extensive. This general increase will largely govern the other changes. Thus, generally speaking, the ratio of rSO, to rC1 decreases from the head of the
system downstream: as the speed at which a salt is dissolved is proportionate to the saturation deficit, chlorides are dissolved faster than alkali earth sulphates. Obviously if an aquifer is rich in sulphates and relatively poor in chlorides, the oppo-
site happens and the ratio of rSO, to rC1 rises. But the concentration rises increasingly down the course of the aquifer and SO, soon reaches saturation; after that the ratio of rSO, to rC1 is bound to decline. The ratio rMg/rCa usually tends to diminish downstream. In the first place, the
increase of Ca by dissolution of C0,Ca stops almost immediately as the waters are quickly saturated. Further CaSO, dissolves less rapidly than MgSO, and MgC1,. The index of disequilibrium also changes downstream from the recharge area.
It may be positive to begin with in the zone of replenishment, diminish progressively and finally become negative, reaching progressively higher negative values as the water moves further downstream. However, in certain cases, when the chlorine concen- tration becomes very high, generally above 500 millicquivalents, the ion exchange index becomes positive again. The intensity of these phenomena becomes progres- sively greater in proportion as the duration of the contact between water and rock is more extended. In other words, the intensity of the exchange depends not only on the length of trajectory but also on the slowness of ebb and the magnitude of the water-rock interface. The sulphate reduction which may take place if there is organic matter present is
also progressively more complete as the length of contact is greater. However, the aquifer is not invariably homogeneous throughout its whole extent.
It is thus perfectly possible that water runlets underground quite near together but moving through different materials may dissolve elements in different proportions and hence diverge in chemical composition. Lastly, the water circulating in an aquifer usually moves in ‘channel lines’ and is
rarely in active motion throughout the whole mass of the aquifer. As a result the runlets can develop individual characteristics, and mixing is checked so that complete homogeneity of the water in storage becomes impossible. In conclusion, a word should be said on what happens when a free water-table rises
sharply to or near the soil surface (depths of less than 2 m. or even less than 1 m.). In this case, particularly in arid regions, there will be progressive concentration by 1. H. SchocUer. ‘Les variations de la composition chimique de l’eau dane les nappes souterraines’, Association internationals
Ghydralogia scientifique, Assernbk d’Oslo. 1948. pp. 130-44.
73

Arid zone hydrology
evaporation because of the vertical circulation of the water alternately rising by capillarity and descending by infiltration. The dry residue will increase and concur- rently rSO,/rCl will diminish and rMg/rCa will increase as S0,Ca and C0,Ca are pre- cipi tated. To get an accurate picture of the chemical evolution of groundwater it is advanta-
geous to plot on maps the isocones or curves of equal concentration, isochlores or curves of equal C1 content, and similar curves for equal values of rSO,/Cl, rMg/rCa, r etc. C1- N a
c1
ZONATIONS REFLECTED IN THE CHEMICAL COMPOSITION OF G R O U N D W A T E R
Geological Zonation
As we have seen, the mineral content of water can be increased by chemical action or by time dissolution. What happens in this respect and to what extent depends on the nature of the geological formation, as CaCl is dissolved much faster than SO,Ca, and limestones yield to chemical attack faster than crystalline or crystallophylean rocks. The degree of concentration of the water is thus determined not only by the length of trajectory, and by the duration of its contact with the rock, but also by the nature of the rock. W e thus get essentially geological factors in operation. The chemistry of the solute in the water depends on what the rock contains in the
way of substances which can be dissolved or attacked chemically and additionally on the possibilities afforded for certain secondary reactions in the strata, e.g. base exchanges when there are permutolites, such as certain clays, glauconite, etc., sulphate reduction when organic matter is present. These again are essentiaIly geological factors. As types of geological strata are distributed by recognized sedimentation zones, it
follows that areas can be found yielding groundwater of broadly similar quality. Thus there are some areas where the water has a low calcium content, light dry resi- due, etc., and is usually chemically active. These areas coincide with areas of crystalline rock or very pure siliceous sand, e.g. the Landes sands of France and the dune sands of the Sahara. Alongside these areas there will be others where the water is, say, highly sulphated
and chlorated, corresponding to outcrops of the Triassic. There will thus be some degree of zonation by geology.
Vertical Zonation
The rate of circulation of groundwater becomes progressively slower and its dis- placement by water of other types (water oi infiltration from the surface particularly) less as its depth below the surface increases. In proportion as aquifers are at greater depths, leaching is less and the retention
of the water can be more prolonged. It is a legitimate inference that the concentration of salts in the water increases with depth below the surface and this has long been confirmed by observation notably in the petroliferous basins (Rogers 1917, Minor 1934, Torrey 1934, Case 1934 in [168]). W e therefore get a degree of vertical zonation. Hence, in the natural course of things, as the depth increases the composition of
the water will change and the predominant component will be converted from car- bonate-bicarbonate to chlorine at the lowest level by the Ignatovitch-Souline sequence quoted in Siline-Bektchourine [171] which follows:
HCO, + HCO,, SOT --f SOT + SOPCI- + Cl-SOP - C1- 74

Geochemistry of groundwater
a b
FIG. 15. Mornag aquifer (Tunisia)
a : map of the isocones 4367 Dry residue
Isopiezonietrir r u n e - Constant dry rrsidue curve I W
b : map of rSOl/rCl ratios 150,
aao Constant ralio curvc - 1 Cl
TSO e 0.59 notio 4 rC1
e : map of rMg/rCa ratios rllx
O.M Conslaut ralio curve - TCa
m g a 11.30 Ratio - TCa
C
75

And zone hydrology
This is a straightforward schema of the variation in chemical composition with
The first three types are found is the upper zone of brisk groundwater circulation. The sulphate chlorine and chlorine sulphate combinations normally come in the
intermediate zone of retarded flow while the chlorine type is found in the zone of ultra-slow circulation.
Naturally, the zonation on this basis is influenced by climatic, and m a y be disor- ganized by geological, zonation factors.
increasing concentration.1
Zonation by Climate
We have seen that concentration m a y occur as a result of evaporation and that, as it increases, the nature of the solution’s chemical composition changes entirely.
Concentration increases proportionately with evaporation potential, i.e. as air temperature rises and air moisture falls. It also increases in inverse proportion to rainfall. Hence, the more arid the climate, the higher the mineralization of ground- water. The mechanism of the concentration process will be discussed later. It is, how- ever, affected by basically climatic factors introducing a measure of zonation.
Although research on zonation by climate has so far been scanty, it is well known, firstly, that the chemical composition of water from springs and wells in Africa, the Sahara and other arid regions differs from that of groundwater in cold or temperate regions, and secondly, that mountain water is purer than plain water. This is proof that climate influences water’s chemical composition.2
W e n o w have to consider what are the climatic factors exerting this influence and h o w they operate.
The chief of them is the rainfall. Rain leaches the soil and carries the most soluble salts into the surface and subsurface, i.e. in circulating systems, whence the NaCl and CaSO, in solution, primarily. For the CaCO, the process is different: its solubility is very low and its interaction is dependent on the intervention of a factor quite dis- connected with the rainfall, namely the amount of free CO, in the water. Thus the amount of unleached soluble salts in the soil and the concentration of the
solution when they are dissolved will vary inversely with the height of the rainfall. Since rainfall is progressively lower as w e move from the temperate to the tropical
zone, increasing again from the latter zone onward to the equatorial, the chloride and sulphate contents and dry residues should become progressively higher going from France southwards to the Sahara, and progressively lower from the Sahara on to the Equator. This is what w e actually do find.
Evaporation also has a marked effect on the chemical composition of water. It increases the concentrations of chlorides and sulphides and hence the dry residue in the soil water and the ascent of water by capillarity from greater depths to make good, more or less, the losses from above results in a definite accompanying rise of salts towards the surface. This is clearly observable in tropical and sub-tropical regions.
W h e n evaporation becomes very high, the salts in solution m a y reach supersatu- ration and precipitation to form calcareous, gypseous and even saline crusts, according to the severity of the water loss. CaCO, is the first to be precipitated since, as the writer’s own researches have demonstrated, it is always very near saturation. Hence, on the edge of the desert w e find calcareous tuff appearing first on the temperate side of the line whereas the crusts are gypseous on the desert side since this mineral needs a higher degree of concentration to precipitate.
Concentration is particularly marked after rainfall too light to penetrate to the
1. H. Schoeller. 1934, loc. cit. 2. H. Schoeller, ‘L’inlluencc du climat sur la composition chimique des eau= souterraines’, Bull. Soc. gkol. Fr.. (5). t. XI, 1941.
pp. 267-89.
76
Geochemistry of groundwater
water-table and merely soaking the surface layers, when-given specially strong evaporation-it becomes progressively higher as salts are alternately leached out of the soil by infiltrating rain and returned towards the surface in solution and concen- trated. Only heavy rain will carry this highly mineralized water, with some dilution, down to the water-table and it will emerge, still mineralized, from the springs. For lack of a surface run-off it is the exception for this water to go from the springs direci to the sea.
The effects of evaporation thus reinforce those of low rainfall, and accordingly, in tropical regions we get saline, or selenitic water with a high dry residue whereas in temperate regions mineralization will be low.
The temperature, as well as being a key factor in the evaporation process, is also of great importance in the chemical processes at work. In particular it assists the chemical breakdown of silicates and accelerates the ordinary dissolution process.
Lastly, in conjunction with humidity, it controls the activity of the soil micro- organisms and the combustion of organic matter which produces carbonic acid gas, the essential factor in the chemical breakdown of the minerals, silicates and carbonates in the rock.
The author has traced the evolution of the chemistry of water from the temperate down to the equatorial regions and the following are his conclusions with regard to the various elements.
Dry residue. A gradual increase in the dry residue is hst observable southwards from the temperate regions down to the Sahara, with a subsequent decrease in the equa- torial belt.
Bicarbonates. Whereas water from all types of formation exhibits definite variations in Ca, Mg, Na, C1, and SO, according to climate, the bicarbonates remain steady between very narrow limits, at values, in 75 per cent of cases, of 2-8 milliequivalents only. Nevertheless, the bicarbonate content in all formations shows a very gradual rise southward from the temperate zone down to the central Tunisian steppe region where it is at a maximum, followed by a progressive decrease towards the desert (Sahara) and the equatorial regions. There is a strong probability that the southerly rise in bicarbonates as far as the steppe area begins back in the Arctic, since a comparable downhill increase is found all the way from mountain crests to plains.1 The relatively constant value of bicarbonates in water is a consequence of the relatively constant pressure of CO, in the soil air of topsoils proper. In cultivable soils the partial pressure of CO, usually varies between 0.005 and 0.06,
which is precisely what is used for the values of HCO, found, i.e., 2.5-7 milliequivalents at 15oC. The solution of the bicarbonates is made possible by the solution in water of infil-
tration of the CO, in the soil air which comes exclusively from the biological activity and the decomposition of organic matter in the topsoil itself. The more abundant the vegetation and the more vigorous the micro-organisms in the soil the greater will be the quantity of CO, produced, the higher its pressure and hence the larger the bicarbonate content.
Vegetation becomes more abundant and the micro-organisms more vigorous as air temperature and rainfall rise (up to certain optima, of course). Thus the bicarbonate content of water is definitely modified either way by climatic influences. The progressive increase in the HCO, content from north to south as far as the
Tunisian steppes is due to rising temperature in combination with sufficient humidity for CO, to be produced on a significant scale. 1. H. Schoeller. 'Les variations de la teneur en gaz. .cnrbouique des eaux souterrames en fonction de l'altitude', C. R. Acad. Sei. Paris. t. 230, 1950. pp. 560-1.
77

Arid zone hydrology
FIG. 16. Map of the hydrochemical zones of the European part of Russia, after Garmonov.
1. Zone of siliceous bicarbonate waters.
2. Zone of calcic bicarbonate waters. w A ?-3. Zone of predominantly sulphated and chloridic waters.
4. Sub-zone of continental saline waters.
5. Zone of calcic bicarbonate waters in the mountains of Crimea and in the Caucasus. (In She-Bektchourine [167], 1951).
78
Geochemistry of groundwater
The decrease southwards to the Sahara, despite the continued rise in temperature, is due to declining soil moisture and lack of vegetation. North of the steppes region the controlling factor is temperature, south it is soil moisture.
SO, and CZ. Whereas in temperate zones, the rSO, and rC1 contents are extremely low, usually markedly lower than rHCO,, they increase rapidly towards the Sahara. From the steppe region onward both of them are higher than rHCO,, though SO, increases more slowly than C1. The explanation lies in the climatic factors. The combination of higher evaporation
and lower rainfall is bound to cause concentrations of salts which are the greater in proportion as the salts are non-soluble, the rate of dissolution being proportional to the saturation deficit. That C1 should increase more rapidly than SO, is therefore normal. However, the evolutionary sequence m a y be disorganized by geological factors,
such as large amounts of gypsum in the sediments of the desert areas or of sodium chloride in some formations in the temperate zones. In the equatorial areas on the other hand, we again get extremely low SO, and C1 figures, often below those for water in the temperate zones. This is undoubtedly due to intensive leaching of all formations by the heavy rainfall. Ca, Mg, Nu. The anion modifications involve corresponding cation changes. As HCO, varies negligibly compared with the SO, and C1 ions, it is the variations of the latter which will cause those of the cations. Thus in going from the temperate zone to the desert Ca will increase, not with
HCO,, but with SO,. Mg follows the same course as Ca and for the same reasons but tends to increase
more rapidly; w e find the Mg/Ca ratios becoming higher in proportion as the sulphate concentrations are greater. Sodium is, broadly speaking, linked with chlorine and hence varies with it and w e find the C1 content increasing gradually from the temperate zone down to the desert region. Further south in the equatorial regions w e again get very low quantities of all three
cations, Ca, Mg and Na, as a result of intense leaching by the heavy rains. The same climatic influence in the zonation of groundwater in the chemical types
is revealed by the zonation map published by Garmonov.1 To summarize Garmonov’s argument, he maintains that the quality of phreatic
water vanes with the zonation of types of climate and overburden and other changing factors. The processes contributing to the mineralization of groundwater are likely to be: (a) dissolution of the salts in the soil; (b) leaching of the salts in the rock forma- tions in which phreatic water circulates; (c) aeolian transport of additional salts from elsewhere; (d) evaporation of underground water from the soil surface. Garmonov distinguishes four zones in European Russia (fig. 16):
1. A zone of silico-bicarbonate groundwater coinciding with the Tundra region, i.e. the northern coast of the Kola peninsula, the whole of the Kanin peninsula and the littoral eastwards, with the Arctic Circle as its approximate southern limit.
2. A zone of calcium bicarbonate water comprising the whole of central Russia and bounded approximately to the south by the line Mogilev-Dnepropetrovsk-Kharkov- Pensa-Ulyanovsk-Taschly .
3. A zone of predominantly sulphate- and chloride-bearing groundwater becoming identifiable in Southern Russia below the above boundary line within which an inland saline-i.e. basically chloride-bearing-sub-zone can be distinguished over- lying the region east of the Caspian and the depression on its northern shore.
1. I. V. Germonov, *Zonation of types of phreatic water in the European section of the Union of Soviet Socialiet Republim’ Innutigalions of the Hydrogeological Research Laboratory, U.S.S.R. Academy of Sciences, Volume 111, 1948, in SilineBek.- chourine [171].
79

Arid zone hydrology
4. A calcareous-carbonate zone in the mountain area of the Crimea and Caucasus. Further south, according to Priklonski’s data, in the low-lying area of trans-Cau- casia, there is another inland saline zone.
In a word Russia exhibits the same zonations as described earlier, with a north-south variation in the quality of groundwater, the type of water changing from the north southward from carbonate through chlorosulphate to chloride. The mountains of the Caucasus and the Crimea merely represent an enclave of intruded northern-type water in the south.
Naturally the climatic zonation m a y be disorganized locally by geological conditions. It thus emerges that there is a primary ‘macrozonation’ on purely climatic lines exclu- sive of any geological factors and governed solely by the relative acidity. It accordingly reflects conditions so general as to tend to override the other zonation factors. The distinguishing criteria principally applicable are the higher or lower levels of concen- tration or dilution of the water. Within this framework of zonation by climate, there m a y occur cases of geological
zonation with variations in the chemistry of the water caused by the nature of the rock. The geological considerations are, however, merely special factors introducing irregu- larities into the much broader climatic zonations.
Lastly some vertical zonation is everywhere found, due to the circumstance that the speed of circulation of groundwater declines progressively with increasing depth.
KOUNINE O N T E E CHEMISTRY OF W A T E R IN DESERTS
An outline of Russian work will not be without value here; it contributes some general ideas. Thus what Kounine [22] has to tell us about the formation of groundwater in deserts
confirms the conclusions already reported, and has some illustrative value. Kounine points out that the shorter the distance from the recharge area to the
groundwater reservoir the less saline the water will be, with mineralization higher in proportion as the underground trajectory is longer-which amounts to what w e have already seen, that the concentration of the groundwater solution varies with the length of time water and rock are in contact. H e also notes that the lower the salinity of water the greater the variety of its chemical composition and conversely the greater the salinity of the water the less varied its composition and the greater its approximation to a standard type. In short he is describing an effect of concentra- tion of which the end result is a type of water approximating chemically to sea water.1 In saline, as against brackish, water, the most typical mineral element is NaCl
and often CaCl,. The chemistry of groundwater is influenced to some extent by the formations through
which it moves, particularly during the first stages of mineralization. The principal factors however are unconnected with the composition of the rocks, e.g. evaporation within the aquifer which gradually increases the concentration and produces chemical changes.
Kounine thus gives striking confirmation of what has already been indicated.
SILINE-BEKTCHOURINE O N THE BUILD-UP OF THE CHEMICAL CONTENT OF G R O U N D W A T E R IN ARID REGIONS
A. I. Siline-Bektchourine [173] has carried out an interesting experiment ‘On the problem of the build-up of the chemical content of phreatic water in arid regions’, on the basis of laboratory experiments conducted with monolithic samples of rock, extracted in the Caspian coastal plain at depths of 2.5, 4.5, 6.5, 8.5 and 10.8 m. 1. H. Schoeller. 1934. loc. cit.
80

Geochemistry of groundwater
H e placed part of each sample in a kind of permeameter and then passed fresh water from the river Achtuba (a branch of the lower Volga), through the &st from the 2.5 m. level. The resulting filtrate was then passed through the next sample from the 5.5. m. level, the filtrate from that through the next sample and so on. This operation was repeated three times, in each instance with water from the
Achtuba. The chemical composition of the water extracts from the soil was as follows:
In percentages of tho dry weight of the sample
Dmth in metres
2.5 4.5 6.5
HCO, . . . . . so,. . . . . c1 . . . . . ca . . . . . Mg . . . . . Na . . . . .
TOTAL . . .
% 0.050 0.918 0.041
0.054 0.070
1.411
0.278
% 0.057 0.150 0.070 0.036 0.012 0.075
0.400
% 0.074 0.150 0.066 0.044 0.009 0.077
0.420
8.5
% 0.077 0.033 0.037 0.016 0.002 0.046
0.211 -
10.8
x 0.072 0.037 0.062 0,033 0.006 0.037
Q .247 -
As proportions of the total, in milliequivalents per litre, of dissolved minerals in the aqueousfiltrate
Depth in metrea
2.5 4.5 6.5 8.5 10.8
% % % % % HCO, . . . . . 0.97 1.26 so, . . . . . . 21.28 4.31 C1 . . . . . . 1.27 2.71 Ca . . . . . . 15.47 2.45 Mg . . . . . . 4.93 1.32 Na . . . . . . 3.12 4.51
1.52 1.90 1.56 3.96 1.14 1 .Ot 2.34 1.41 2.31 2.79 1.20 2.15 0.02 0.25 6.56 4.21 3.0 2.08 - -
TOTAL . . . . 47.04 16.56 15.64 8.90 9.78
The chemical composition of the Achtuba water in milliequivalents per litre is as follows:
HCOi so, c1 ca Mg- Na Total
0.70 2.35 0.90 1.30 - 2.65 7.90
It will be noted that the water extract is sulfato-chloride at the top level and chloro- sulphate at depth and that down to 8.5 m. rNa > rC1, whereas at 10 m. rC1 > tNa.
The Achtuba water is sulphato-chloride with rNa > rC1. With the first water paased through, there is initially an overall rise of concentration
with each sample percolated down to and including that from the 6.5 m. level. There- after the ratio rSO,/rCI, having been greater than 1 in the first two samples, decreases, and is less than 1 in the remainder.
6 81
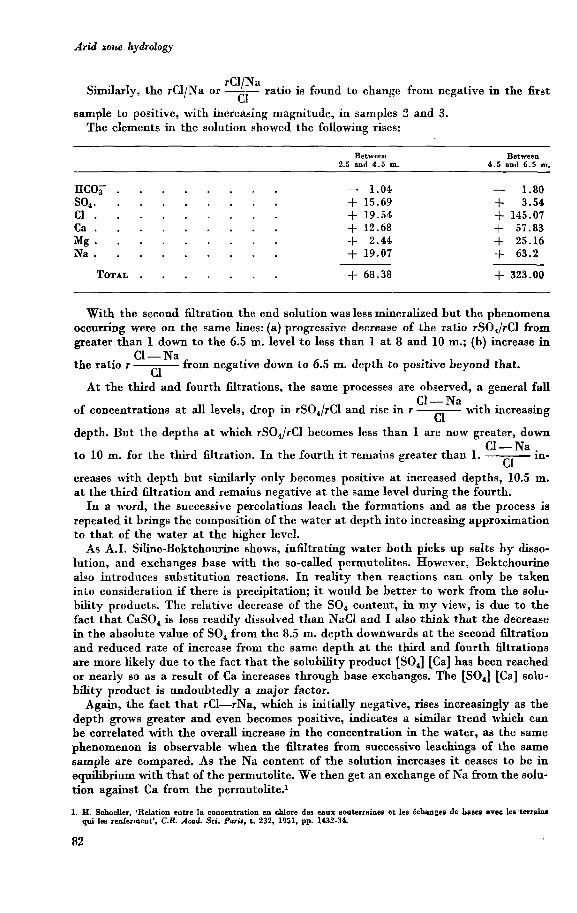
Arid zone hydrology
rCl/Na c1
The elements in the solution showed the following rises:
Similarly, the rCl/Na or -- ratio is found to change from negative in the first
sample to positive, with increasing magnitude, in samples 2 and 3.
Between Between 2.5 snd 4.5 m. 4.5 and 6.5 m.
HCQF . . . . . . . . - 1.04 so,. . . . . . . . . + 15.69 c1. . . . . . . . . + 19.54 C a . . . . . . . . . + 12.68 Mg . . . . . . . . . + 2.44 Na . . . . . . . . . + 19.07
- 1.80 + 3.54 + 145.07 + 57.83 + 25.16 $- 63.2
TOTAL . . . . . . . + 68.38 + 323.00
With the second filtration the end solution was less mineralized but the phenomena occurring were on the same lines: (a) progressive decrease of the ratio rSO,/rCl from greater than 1 down to the 6.5 m. level to less than 1 at 8 and 10 m.; (b) increase in
the ratio r ~ from negative down to 6.5 m. depth to positive beyond that. C1- N a c1
At the third and fourth filtrations, the same processes are observed, a general fall of concentrations at all levels, drop in rSO,/rCl and rise in r - with increasing depth. But the depths at which rSO,/rCl becomes less than 1 are now greater, down to 10 m. for the third filtration. In the fourth it remains greater than 1. ~ in-
C1- N a c1
C1- N a c1
creases with depth but similarly only becomes positive at increased depths, 10.5 m. at the third filtration and remains negative at the same level during the fourth. In a word, the successive percolations leach the formations and as the process is
repeated it brings the composition of the water at depth into increasing approximation to that of the water at the higher level. As A.I. SiIine-Bektchourine shows, infiltrating water both picks up salts by disso-
lution, and exchanges base with the so-called permutolites. However, Bektchourine also introduces substitution reactions. In reality then reactions can only be taken into consideration if there is precipitation; it would be better to work from the solu- bility products. The relative decrease of the SO, content, in m y view, is due to the fact that CaSO, is less readily dissolved than NaCl and I also think that the decrease in the absolute value of SO, from the 8.5 m. depth downwards at the second filtration and reduced rate of increase from the same depth at the third and fourth liltrations are more likely due to the fact that the solubility product [SO,] [Ca] has been reached or nearly so as a result of Ca increases through base exchanges. The [SO,] [Ca] solu- bility product is undoubtedly a major factor.
Again, the fact that rC1-rNa, which is initially negative, rises increasingly as the depth grows greater and even becomes positive, indicates a similar trend which can be correlated with the overall increase in the concentration in the water, as the same phenomenon is observable when the filtrates from successive leachings of the same sample are compared. As the N a content of the solution increases it ceases to be in equilibrium with that of the permutolite. W e then get an exchange of N a from the solu- tion against Ca from the permutolite.'
1. EI. Schoeller. 'Relation entre la concentration en chlore des eanx souterrsines et le8 6changes de bases avec les teneinm qui les renfcrment'. C.R. Acad. Sci. Paris, t. 232. 1951. pp. 1432-34.
82

Geochemistry of groundwater
Thus m y o w n approach to these phenomena, which discounts chemical reactions and considers only the conjunctions of ions, differs somewhat from that of Mr. Bek- t chourine .
Siline-Bektchourine’s work exhibits the build up of water’s chemical content as a three-stage process:
Stage I 1. Dissolution of NaCl, CaSO,, MgCO,, CaCO, and other salts by the water of infiI-
2. Base exchanges, e.g. tration.
Ca [(HCOJ,, SO,] + Na, Z Na, [(HCOa),, SO,] + Ca solution colloid solution colloid
or infrequently:
Ca [(HCOJ,, SO4] f M g s M g [(HCO,),, SO,] + Ca solution colloid
3. Substitution reaction:
Naa(Mg)(HCOs)a + = Na,(Mg)S04 + Ca (HCOa), not to be considered unless there is precipitation of CaCO,.
increase of the Ca content through base exchanges.
Stage 2 1. Concentration of solutions. 2. Base exchanges:
In most cases precipitation of CaCO, or even of CaSO, m a y be brought about by
2 NaCl + Ca (Mg) z? Ca (Mg) CI, + 2Na solution colloid solution caUoid
3. Substitution reaction: CaCI, + Na, (Mg) SO, = Nap (Mg) C1, + CaSO,
The same qualification as before applies.
Stage 3 Mixing of the water of infiltration with that of the water-table with reactions described as substitutions but in fact due to the attainment of solubility products.
Obviously this sequence is only true for geological formations and water comparable with those under consideration, and elsewhere the order of the phenomena differs. In particular the exchange of N a from solution against colloidal Ca m a y occur in cer- tain instances in the first stage, as actually happens in Tunisia.
However the basic three-stage sequence remains valid: dissolution; concentration; miving with the water of the water-table.
S O M E GENERAL GEOCHEMICAL FEATURES OF DESERTS A N D SEMI- DESERTS [17, 291
As we have just seen the chemical composition of the water in deserts and semi-deserts depends on the geographical conditions which are themselves affected by the hydro- geological situation. Sweet water will be found immediately below mountains or on the edges of closed basins, but the salinity of the groundwater will rise progressively
83

Arid zone hydrology
as the distance from either locality increases. Thus in closed basins, working in from the perimeter, the ratio will become first slightly brackish and then increasingly saltier until it reaches supersaturation at the centre.
The chemistry of the water also depends on the nature of the rocks and the duration of the water’s passage through them. Another factor affecting it is the mode of recharge of the aquifer. Infiltrations from surface water or direct from rainfall m a y represent an addition of sweet water to the underground reservoir, but when it is subjected to evapo-transpiration before it can reach the depths, there will be an increase in min- eralization. Thus a feature of desert hydrogeology is clearly the variety, chemically, of the
types of water found which m a y be sweet, salt, super- or ultra-sal. It is also apparent that the physicd conditions productive of accumulations of sweet, salt and ultra salt subsurface water often occur in close mutual proximity. Again zonation by depth does not always follow the rules: sweeter water can some-
times be found in deep-lying confined horizons than on the surface. There are examples both in the Russian deserts and in the Sahara where the so-called Albian sweet water horizon is found under saline water in the late Tertiary and Quaternary formations.
Contemporary hydrogeological phenomena are not by themselves an adequate clue to the geochemistry of groundwater in deserts and semi-deserts. Consideration must also be given to the effects of the rising and sinking of continents (and palaeo- geographical conditions). In those arid regions which underwent general upheaval in the Quaternary epoch, the processes of leaching and desalination of the rocks have produced a reduction of the salt content not only in streams and closed basins but also of the sub-surface stored water. On the other hand when the land mass sank the opposite effect has been produced: the rocks have been impregnated with salts and salts have increased in the groundwater.
Palaeogeographical conditions undoubtedly have their importance too: cold and rainy periods will have favoured the storage of sweet, and hot, dry periods that of saline water. With the geological time required by the passage of water through the major reservoirs both types of water from that period may, in certain cases, have been held in deep-lying aquifers until our own day.

C H A P T E R V
Types of tracer,, microcirculation of water in aquifers,, radioactive tracers
Tracers have long been employed on an appreciable scale in hydrology to study the flow of underground water. Their uses are as follows: 1. Determining whether or not particular formations are permeable: observations
are made of the spread, if any, of a tracer beyond the point of injection. 2. Determining whether there is direct communication between one point and another:
a tracer is dropped into the groundwater reservoir or discharge system at the upper end and its reappearance is watched for lower down at those points where it is thought that it will arrive; it is thus a purely qualitative investigation with no time values involved.
3. Determining the direction of flow, e.g. in a groundwater reservoir: the tracer is injected into a central well and a watch is kept at a series of other wells sunk in a circle around this to see where the tracer will emerge, an operation of similar type to that just described.
4. Measuring the velocity of groundwater flow: this time the requirement is to calculate the time taken by the tracer to go from one point to another, making this a quanti- tative operation which as w e shall see, is not as simple as it seems at first.
5. Measuring discharge: a known quantity of water containing a tracer at known concentration is introduced into the current upstream and the concentration of the tracer in the stream is determined at a point lower down.
CHARACTERISTICS OF A N IDEAL TRACER
Clearly, just any substance will not do as a tracer: certain specific qualities are required. Its appearance and even, most often, its amount must be easy to determine even when its concentration in the water is very low: it will always be greatly diluted at the observation point. With respect to the water, the tracer must either not be present or at worst be
present only in minute quantities in the underground reservoir or water currents SO that useful differences in concentration between the points of injection and the points of measurement can be obtained.
It must be easily transported by the water, i.e., it must remain readily in suspension or be highly soluble.
It must not be subject to decomposition or precipitation in the water either of the injection mixture or of the underground reservoirs.
85
Arid zone hydrology
It must be immune to destruction by micro-organisms during its underground trajectory. In reference to the rock-formation, the tracer must be neither absorbed, adsorbed
or trapped by the rock pores. The ‘contamination’ of the rock by it must not be too prolonged-i.e. the rock must
not release it too slowly-as this would make tests in short-interval series impossible. Finally, it must not react chemically with the porous medium. From the user’s angle, it must be easily obtainable at low cost ; its use must involve
only simple, speedy and low-cost routine techniques; it must be sufficiently non- poisonous to involve no danger, under normal conditions of use, at the time of injection, and tracers are necessarily used in high concentrations. Finally, it must not cause dangerous contamination of the water under examination, particularly beyond a reasonable time.
T H E VARIETIES OF NON-RADIOACTIVE TRACER
Until recent years the tracers used were solids transported by the water, chemicals easily soluble and easily detectable, and above all dyes still detectable by eye even greatly diluted. All have rendered great service and each has its advantages but also its defects. Now, the tracers of the future are probably the radioactive types, almost all of them detectable in extremely low concentrations. Some of them have a short half-life, which is extremely useful for some purposes; the long half-life of others is a considerable advantage in the study of water movements of very long duration.
There follows, first of all, a brief account of the solids, chemicals and dyes used as tracers. This will make it possible to form a better idea of the qualities of the radioactive tracers and of their defects, for they too are not perfect.
Solid Tracers Solid tracers are divisible into three types: buoyant, non-buoyant and suspended. Buoyant tracers floating on the surface only give the surface rate of flow which is
the fastest, and not the mean velocity, which is the most important. In addition the near certainty that they will get jammed makes them unsuitable for use in ground- water even in the average limestone formation. For them to be carried along at all satisfactorily, really large fissures are necessary.
Submerged tracers-i.e. those suspended from surface floats at a predetermined depth-are still less usable than the buoyant type as their bulk is still greater.
Suspended tracers are more easily transported by the water and are therefore usable particularly in well-fissured rocks. They need to be able to stay in suspension indefi- nitely and to be small enough themselves not to be held back by rock pores and cracks, the size of which is accordingly the essential consideration for or against the use of these tracers. Nor, if very finely pulverized, must they be liable to become fixed on the water-rock contact surfaces in any of the aquifer’s component rocks. A very wide variety of solids have been used as tracers-oat chaff, bran, starch
grains which are easily detectable with iodine, yeasts (Saccharomyces cerevisiae, Saccharomyces mycoderma) and bacteria (B. violacetus, B. pyocyaneus, M. prodigiosus, M. aceti).
Soluble Chemical Tracers
The great advantage of chemical tracers is that it is easy to come by highly soluble kinds which accordingly really ‘marry’ the water transporting them and in m a n y cases, detectable on emergence in sufficiently high concentration by chemical tests or even by measurements of electric conductivity.
Nevertheless they have certain faults, particularly when the concentration is high
86

Types of tracer
and the velocity of circulation of the water is extremely low their diffusion is likely to be irregular and in most cases this is only their smallest fault. In some instances, high concentration injections are the only possibility if the tracer
is to be detected downstream, but in that case the tracer solution becomes much denser than the groundwater. The result is that the tracer tends to sink to the bottom, does not mix evenly with the water and is often removed from circulation.
Moreover, the clay or organic material in the aquifer strongly adsorbs certain cations, e.g. Na, K, Ca, Mg, NH,, Li, Ba, etc., according to its composition. Finally, some tracers react with the aquifer, particularly with clay. M a in high con-
centration m a y peptise the clay and by thus reducing the permeability of the aquifer, change the velocity of the water, while Ca ions coagulate the clay and produce the opposite effect. Thc best tracers therefore will be anions which are very difficult to fix. The most widely used chemical tracers are the chlorides, NaCl, CaCl,, LiCl, and
NaCl, all highly soluble, readily detectable by the standard chlorine test or by measur- ing the electric conductivity. Their greatest advantage is that the C1 ion is not liable to adsorption and does not react chemically with rocks. Hence its onward movement is not subject to too much delay and little of it is lost en route, giving an excellent yield. However, the trap consists in the temptation to use it in excessive concentra- tions at the point of injection; it m a y then go astray and not re-emerge. Further, it often has to be used in very large quantities which makes the operation costly. Thus to get a content of 10 mg. of tracer per litre of water, lo4 times more NaCl must be used than fluorescine, which is detectable at lope dilution. Where 1 kg. of fluorescine is sufficient the corresponding quantity of NaCl needed is 10 tons. In other words instead of injecting a 50 litre solution of fluorescine in water at low concentrations, one would need to inject 38 m.3 of water saturated with NaCl with all the incon- veniences due to the density of the solution already mentioned.
Again, with groundwater high in chlorides such as is found in the arid zones, the use of chlorides as tracers becomes still more difficult as the rise in the chlorine concentra- tion at the observation points is lees easy to perceive.
Accordingly it is often advantageous in such cases to use bichromate of sodium (Na2Cr,0,.2H,O), which has a solubility of 2.38 kg. at 00 and 4.330 kg. in the anhy- drous state per litre of water and can be detected in dilutions of 1 to 2 x lope with a dyphenylcarbazide reagent.’ The number P of kilogrammes suitable with calcareous formations is given by the equation (Ravier, Hours, Scheebeli [ZlO]):
p = 3 d L - + 0.1 v a
d = the discharge in cubic metres per second at springs; L = the distance in metres to be travelled underground; a = the velocity in metres per day of the underground current V = the reserves of groundwater in thousands of cubic metres.
Many other chemical tracers have been used-boric acid, tetraborate of sodium, bromoform, commercial detergents, sugar, dextrose and phenol which is detectable by smell or taste particularly if transformed into chlorophenols. The sugars have the disadvantage of being attacked by micro-organisms.
Tracer Dyes Tracer dyes have very great advantages. Their solubility is high and they are detec- table at very low conccntrations, about or lo-’. However the majority of thcrn
1. E. Genet. ‘Note sur des d6terminations de cheminements soutcrrains par Is methode chimique’. Terms et eaur, Suppldment scientifique N o 3. 1954, pp. 73-81.
87

Arid zone hydrology
are adsorbed by argillaceous materials or organic matter, while some react chemically with the CO, dissolved in the water, or ferrugineous substances and organic matters. Thus their success has not been complete. In general their use is inadvisable in interstitially porous aquifers particularly if
they include argillaceous matter, are fine pored and only alIow a very low velocity of flow.
Against this they are almost perfect tracers for the study of water movement in karsts with rapid circulation and restricted flow paths.
The best known tracer is fluorescein (Na,C,,H,,O,). Uranine is also used; it is simply fluorescein rendered more soluble by the addition of carbonate of soda.
Fluorescein is adsorbed by argillaceous elements and reacts with organic matter and ferric oxides. It is destroyed by light and weakened by dissolved CO, and the acidity of water. In the latter case however it can be regenerated by alkalinizing the water. It can be detected with the naked eye in concentrations of lo-', with the T d a t fluoroscope to concentrations of 2 and sometimes 1 x lods and with the Dienert electric fluoroscope at 1 x 10-e. The latter instrument requires 45 ~ r n . ~ of water only, while 250 cm.3 are needed with the Trillat fluoroscope. The fluorescein is first diluted with alcohol to which a little ammonia has been added and then dissolved in the water (0.25 litre of NH, to 5 litres of alcohol for a solution of l kg. fluorescein in 50 litres of water). Ravier's formula [ZlO] for the weight P of fluorescein to be used is:
dL a
P k - + 0.02 V when P is the weight of fluorescein in kilogrammes; k = 0.5 for circulation through fissures or channels; k = 3 for interstitial circulation; d = is the discharge from the springs in cubic metres per second; L is the length of the trajectory in metres; V is the volume of the stored water in thousands of cubic metres; a is the velocity in metres per day of the underground current.
Dienertl used to use the following formulae: If rate of the stream discharge or of water injection over 48 hours is above 5 litres/sec., the equation for the quantity of fluorescein to use is:
P = 2.5 >.; lo-' dL
If the rate of stream discharge or of injection over a 12-hour period is less than 5 litres/sec. the equation is:
125 x 10-9 d x L b P =
where P is the weight of fluorescein in kilogrammes, d is the spring discharge in cubic metres per second, L, the length of the trajectory in metres; b, the mean discharge in cubic metres per second delivered over a 12-hour period.
Many other types of dyestuffs can be used. With alkaline waters, those used in addition to fluorescein are eosin, erythrosin
and congo red. Before the dyestuffs are introduced into the groundwater they are dissolved in a small amount of alkaline water. In acid waters methylene blue, aniline blue and ponceau red are used, being then dissolved in slightly acid water before use.
1. F. Dienert, Hydrologie agricole, Paris, BaillPre, 1932. 462 pp.
8%

Types of tracer
Other tracer dyes worth a venture are phenolphtalein, flapizine, indigo carmine,
The following are the quantities in grammes of dyestuffs required per 10 m. of acid green, acid violet and acid fuchsine.
trajectory, according to She-Bektchourine [171].
Dyestd Argillaceom rocks Sandy rocks Fissured rocks Kprsts
i Fluorescein Uranine Eosin Erythrosin Congo red 1 Methylene blue \ Aniline blue Ponceau red
g.
5-20
10-40
20-80
20-80 10-40
2-10
10-30
20-60
20-70 10-30
&*
2-20
10-40
20-80
20-80 10-40
g.
2-10
10-40
20-80
20-80 10-40
CIRCULATION OF W A T E R IN R O C K S
Tracers are introduced at a given point and carried downstream by the water to a predetermined point where their appearance is observed. However the trickles carrying the tracer do not all move at the same velocity nor along parallel, or even by the most direct, paths, so that the times of arrival of the corresponding fractions of the tracer injection at the observation point vary. From these differences the inferences have to b e drawn.
The Variety of Trajectories
There are numerous flow trajectories. Thus w e have: 1. A general trajectory determined by the sector of greatest gradient of the velocity
potential, following Darcy's Law. However, this general trajectory whose velocity is the mean of that of the whole mass, comprises individual trajectories of velocities both above and below the mean.
2. Irregular trajectories of velocity above the mean when coarse and more open- textured stretches of rock or channels in the rock make certain sections of the aquifer more permeable. The resultant less hampered flow m a y be parallel or at an angle to the overall line.
3. Irregular trajectories of velocity below the mean as a result of lower permeability along or across certain sections of the general flow path.
4. Conformably disposed trajectories of velocity above or below the mean in a homo- geneous rock. Here-e.g. in a sand of very heterogeneous granulation-coarse and fine pores and found together in the same rock and accordingly the individual trickles are fast or slowly moving on certain trajectories or more accurately certain portions of trajectories. However as there is intercommunication between all the pores in a homogeneous rock, mixing will take place between trickles of differing velocity and there will be very little likelihood of finding, downstream, trickles in which all the water has throughout been moving faster than that in others.
5. Velocities in a single conduit above and below the mean. The threads of liquid in the middle of a conduit move faster than those running
alolig the sides. In turbulent flow there is sufficient mixing for the velocities of all the water
molecules to work out at about the same mean value provided the trajectory is long enough,
89

A d zone hydrology
In laminar flow, the threads of liquid move parallel to each other, and in a conduit of section identical in form and dimensions at every point, the velocities vary in a regular positional order. However in rocks, the capillaries are irregular in section throughout the trajectory
of the trickles. Accordingly a possibility exists in this case too of threads of different velocity being mixed; on the other hand there is more probability of finding some trickles downstream which have travelled the whole w a y at velocities above or below the mean than in the case of rocks with interstitial porosity. This probability is hovewer relatively low if the course travelled is long.
It is thus apparent that cases 4 and 5 are proportionately less likely to arise as the pores or fissures of the rock are smaller and more numerous, whereas in a limestone mass with large fissures widely spaced and where there is no turbulence in the flow of the water, the probabilities are much greater.
The General Trajectory
This is the trajectory defined by Darcy’s equation for the apparent velocity of laminar flow in rock, or the equation
for the apparent velocity of turbulent or mixed flow. The apparent velocity is thus obtained by dividing the discharge through a cross-section of rock by the area of that cross-section. The average velocity which is greater than the apparent velocity is the velocity arrived at by dividing the unit cross-sectional discharge by the total cross- section of the conduit or conduits.
It is the apparent or average velocities which it is sought to determine by the use of tracers, and the point for consideration is h o w they can be arrived at from the range of velocities shown by the tracers.
Deviant Trajectories
These will show tracer-bearing trickles either before or after the direct trajectory and their peak concentrations m a y be independent of that of the general trajectory. It is however conceivable that interference occurs between deviant and direct tracer- bearing trickles at the point of arrival. No general law can be laid down about deviant trajectories beyond noting the possi-
bility that they exist and allowing for that possibility in interpreting the data logged at the observation points.
Direct Trajectories
Turbulent $ow trajectories. Suppose a tracer to be mixed with water with each tracer molecule moving with an ‘escort’ of water molecules. In turbulent flow the movements of the molecules are independent and random. As the forward movement goes on the concentration of tracer molecules assumes a Gaussian distribution around a centre. This centre coincides in time with the point of injection displaced by a distance corres- ponding to the mass flux of the liquid, or in other words, by a distance equal to that given by the average velocity.
W e thus get symmetrical curves of tracer concentration as a function of time and the centres of gravity give the mean times to cover the distance, i.e. of the average velocities (fig. 17).
The mean square of the tracer’s displacement in relation to the point of injection
90

Types of tracer
='c 0
100
50
0
FIG. 17. Symmetrical curve of concentration as a function of time.
increases as the square root of time elapsed.1 Thus the length of the base increases with distance whereas the curve flattens out.
Clearly the time of first appearance of the tracer cannot be used for calculation as it varies with distance and also indeed with the Reynolds number. The times logged must be given by the centres of gravity of the curves.
Laminar $ow trajectory in a capillary. Take an imaginary circular conduit of radius R. The velocity V declines from the centre where it is V, (maximum velocity) to the sides. A t a distance r from the axis,
V = K (R2 - T') with
y being the viscosity of the water.
The m a x i m u m velocity is at the point when r = 0: Thus V, = KR2 whence
As the average velocity is:
v = v, (1 - 2).
1. D. E. Ad. J. W. Kent, R. D. Lee, 'Radioactivity in pipe tine flow studies', World Oil. Vol. 129. 1949, pp. 187-8 : D. E. Hull. B. A. Fries. 'Radio isotopes in petroleum rehing, researoh and analysis'. Peaceful Uses of Atomic Ewrgy. United Nations. Vol. 15, 1956. pp. 236-50.
91
Arid zone hydrology
it is apparent that in cross-section the velocity ofthe swifiest trickles is double the average velocity of the water in the tube. In other words, the velocity of trickles transporting the first of the tracer dye to appear will work out at double the effective average velo- city of the water? Turning n o w to the average concentration of the tracer at a time t and at a distance
x from the point of departure, it is found [193] to be: 1
U =
The curve of concentration of the dyestuff at distance x as a function of time always has an exaggeratedly long tail. There will therefore still be a tendency for a ‘tail-end’ tracer cloud to subsist.
The same equation shows that the median is equal to two-thirds of the theoretical time of ‘detention’, T, i.e. the average time of transport of the tracer and that the harmonic mean is at 3/4 T. According to Archibald, the best measure of the period of detention is the 70.0th centile. However no experiment has been made to check this equation. It should be pointed out that m a n y authorities consider that the median, which corresponds to the centre of gravity, should give the time of detention.
Trajectory in a sand of unlimited lateral dimensions. In the cases already considered we were concerned with passage along a channel, strictly bounded laterally. This situa- tion would occur in water-bearing fissures such as m a y exist in limestone but would be less c o m m o n in rocks with interstitial porosity. In the latter there are no definite lateral boundaries for the threads of water apart
from the top and bottom confining beds. It is perfectly possible for a particular thread passing a given point to fan out downstream and on this fanning out Danel’s 2 views are worth attention.
Under normal conditions of groundwater circulation, water moving through rocks with interstitial porosity is in laminar flow. However, whereas in a tube there is no mixing of the ‘stream lines’, the position is otherwise in a rock of the kind w e are con- sidering, such as sand-when each pore is directly connected to others on six or eight sides at once (fig. 18 and 19).
Thus each time a trickle travelling from pore to pore has to move around a grain, it will tend to split up into two, three or four separate threads which will each do the same on reaching the next grain in their path down course and so on. Meanwhile the primary trickle flanking the h s t will have done the same thing and the secondary, tertiary etc., threads of both will move onward together. It is thus perfectly conceivable that the threads of liquid m a y mix.
Thus, with distance covered, the trickles will tend to diverge increasingly from the direct path and a cone of diffusion (fig. 20) will develop. If the original trickle contained a tracer, that tracer will accordingly fan out into
the form of a cone, the peak angle varying with the nature of the grains, but usually about 6 degrees. For each cross-section the curve of concentration is bell-shaped very like a Gaussian distribution. Axially the concentration in the cone varies as the inverse square of the distance measured from its peak. At a given distance from the point of injection, the diameter of the cone of diffusion
will become equal to the thickness of the aquifer. If the angle of the cone is indeed 60, that distance is about equal to 10 times the thickness of the aquifer. Further OII the
1. P. Dend. ‘The meamrement of groundwater flow’, Rmeedingr of Ankara Synposium on Arid Zons Hydrobm, Uneieo. 1953. pp. 99-107.
2. P. Danel. op. cit.
92

Types of tracer
19 20
FIG. 18. Interatitid flow. FIG. 19. Interstitial flow. FIG. 20. Diheion cone or dispersion cone.
cone wi flatten out increasingly and when the lateral diameter of the cone is m a n y times the thickness of the stratum, there will be no further decrease of the concentra- tion except inversely with distance.
Circulation in a sand can be likened to that through a series of capillaries roughly pardd and of varying cross-sections of radius rl, rl, ra etc., in a decreasing series. The maximum velocity dl then be:
and the average velocity for the whole will be: 1 - MK(R! + Rt f Ri + ...)
M(r: + ri + ri + ...I U - g - 2 - S -
q being the discharge through the cross-section S of the stratum.
The average velocity will therefore be inferior to the average velocity of the capillary rl.
93

Arid zone hydrology
Thus Dane1 writes: ‘we can., . conclude that for flow in a porous medium the effective velocity is generally less than, or at most equal to, half the maximum speed corresponding to the appearance of the dyestuff. . . . Experimental evidence shows that, in fact, the m a x i m u m velocity is about 2 or 3 times the effective velocity’. The lapse of time between the first appearance of the dyestuff and its appearance
in maximum concentration depends only on the thickness of the tracer wave at the start, that is to say that the point of maximum concentration depends only on the quantity of dyestuff injected originally and the length of time taken for the injection. Thus this m a x i m u m cannot be used to calculate the average velocity.
ADSORPTION A N D RETENTION OF TRACERS
Tracer-carrying water m a y come into contact with substances in the aquifer which have the property of fixing ions contained in the water and exchanging these against certain of their own. The adsorption m a y be chemical with an energy bond or merely physical (Van der Waals’ adsorption with low cohesion between adsorbant and adsor- bate). These two forms of bond between which there is every sort of intermediate stage, m a y indeed operate simultaneously. The materials in rocks with adsorbant and ion-exchange properties are: (a) argillaceous minerals, more particularly vermi- culites and montmorillonites, and to a lesser degree illites, halloysites and kaolinites, in descending order of base exchange capacity; (b) zeolitic minerals; (c) hydroxide of iron; (d) organic materials, e.g. humus.
These ion exchangers are known as permutolites. The degree of fixing depends on the nature of the cations. The strength of the bond is in inverse proportion to the degree of hydration of the ion. At an equal degree of hydration bivalent ions are fixed more powerfully than monovalent.
The exchange of A and B ions between water and rock and vice versa can be expres- sed:
[A] water [B] water I [B] permut. -- -
Thus the adsorption of cations, particularly Ca, Mg, Na, K, NH,, Li, Rb, Sr, etc. is extremely easy. The ease of adsorption varies inversely as the extent to which certain fixation by
the rocks has already occurred and directly as the water is rich in cations. This must be borne in mind in using cationic radio-active tracers and d necessitate the use of carriers. Adsorption will be low in the purely siliceous, calcareous and dolomitic rocks often
found, and both it and exchanges will be on a scale increasing in proportion as permu- tolite elements-argdlaceous and organic substances, hydroxide of iron, glauconite, etc. -are more abundant.
Anions and non-ionized elements m a y undergo some degree of physical adsorption and exhibit typical adsorption isotherms, but are much less copiously adsorbed than the cations.
The retention of Cl-, Br-, I-, NO;, Cr,O;, SOT, and boron anions is so low as to be practically negligrble. Hence when a salt is being used, the anion and not the cation should be taken as tracer. Thus, with the chlorides, NaCI, CaCl,, LiCl, NH,Cl, the obvious tracer element is the chlorine component. It must not be forgotten thet certain substances m a y react chemically either with
the rock or with other substances in the water: SO: and Ba++ precipitate when they meet, while chemical reactions occur in the case of calcium glycerophosphate and of the dissolved CO, group, HCO;, and CO;. Finally the possibilities of exceeding solubility products must be kept constantly in mind.
94

Types of tracer
The retention of adsorbable tracers contaminates rock, i.e. after a tracer has passed through a formation which has adsorbed a part of it, that formation will release the tracer ifwater is passed through it which contains none of the tracer substance, in which the tracer concentration [A] is:
rAi pernut. 1 I/P [A] water < [B] water H ( 1BJ permut.
when there is exchange. The kind of contamination of the rock which thus develops is proportionately
greater as ion fixation is stronger and the quantity of ions exchanged greater. As the tracer moves through the rock its concentration diminishes progressively
down-course, as a result (a) of the lateral fanning-out process affecting the trickles of water; (b) of some trickles advancing faster than others; (c) of the retention of tracer by the rock.
W e have seen that the lateral fanning out of the trickles results in the tracer becom- ing progressively less concentrated from upstream downwards. If the water-bearing material has no lateral boundaries the concentration decreases as the inverse of the square of the distance from the point of injection. If the tracer-bearing flux is limited by two parallel planes as in the case of aquifers, concentration decreases inversely as the distance. If the flow is confined laterally on all sides and if the threads of liquid all move
with the same velocity, the concentration remains the same over the whole trajectory. In fact, however, some tracer-bearing trickles move forward faster than others,
and will then mix with slower moving tracer-free trickles from ahead. Hence at a given distance from the starting point the tracer cloud takes on a somewhat elongated shape coaxial with the direction of flow. The concentration at the upstream end is very low, increasing progressively towards the downstream end where it attains its normal value. When the whole liquid mass moves in parallel trickles-as inside a cylin- der in which concentration over the whole cross-section is CO at the starting point- the concentration C of the dyestuff will vary progressively from the value 0 at the head to the value CO at the tail of the front, and C/Co will grow from 0 to 1.
If, however, given the same conditions of flow, there is cation adsorption by the rock, the tracer front will be retarded. At some point below the starting point base exchanges will take place and cause a progressive reduction of the cation concentra- tion of the tracer downstream. Then if a volume of tracer-free liquid comes into contact with the formation which adsorbed the tracer, desorption will take place as the liquid is undersaturated in relation to the rock. Further on the tracer m a y again come into contact with a rock short of its cations and there will be fresh adsorption and so on. The effect is to retard the front.
W e therefore need to turn to Kaufmann and Orlob [206] on the ratio of the velocity of the liquid front itself to the velocity Uca of the retarded tracer front. VermeuIen and Hister give it as:
where ra is the number of milliequivalents of the tracer adsorbed per gramme of the solid
pb, the apparent density of the porous medium; phase;
95
Arid wne hydrology
r[A]. the concentration in milliequivalents per cubic centimetre of the tiquid
rn is the porosity. phase; and
While equations 1 and 2 are suitable for the study of constant discharge through columns of soil, they demonstrate the impossibility of using tracers to determine the variations of velocity of a liquid in a porous medium. We can develop equation 1 for the hypothetical case of a wave of liquid of volume
m.dx moving slowly through a porous medium for a distance ax, transporting r[A].n.d~ milliequivalents of tracer. Given an exchange of tracer between water and rock reaching equilibrium instantaneously, the passage of the tracer wave over a distance (Ua/U) dx will be such that:
U a U a U U rLA1.rn.d~ = ra.pb - dz.r[A].rne - dx
If the rock has no adsorption properties, ra = 0, so that Ua = U and the two fronts move together. If the rock has adsorption properties and if adsorption and desorption are instantaneous, the tracer front will be of the same length and degree of definition as the liquid front but will simply be retarded. However, ion exchanges between liquid and rock require a certain amount of time
and thus the tracer front not only will not move forward as rapidly as the lipid front but will become increasingly attenuated.
M E T H O D S OF INJECTING TRACERS INTO AQUIFERS
There are two methods of injecting tracers: the constant input method and single- shot injection in bulk.
Constant Input Dilution Evaluation Method This consists in introducing a coastant flow, q, of tracer solution at concentration c into a current whose discharge Q it is sought to determine. At a point downstream where mixing m a y be reckoned to be complete, the concen-
tration e, in the discharge Q + q is measured. The discharge Q is then given by the equation:
Q = q T e - e”
When e, is very small in relation to c, this equation can be simplified to:
However, great caution is always required. Suppose that between the upstream injec- tion point and the observation point downstream a lateral current enters that being measured, the discharge actually measured will relate to the discharge at the point downstream. If on the other hand the stream divides between the point of injection and the logging point the volume of flow measured xvill be that past the injection
This method can be used for the currents circulating in limestone massifs, but their velocity cannot be calculated by it when the average cross-sectional areas of the rivulets over the distance between the upstream and downstream points are unknown. In aquifers with interstitial permeability, it is impossible to calculate either velocity
or total discharge as the discharge arrived at cannot be identified with that through any particular cross-sectional area of the aquifer. It is a fractional discharge of un- known proportions. A fortiori velocity cannot be estimated either. 96
point.

Types of tracer
Constant Input Velocity Determination Method A s before there is continuous injection of the tracer solution at the upstream point as far as possible at a constant rate and the time taken by the tracer front to reach the point of observation is calculated. As in the previous case, this is a costly method as large quantities of tracer are required.
T w o types of situation are possible: 1. Rock with no adsorption properties. In this case the flow of tracer in the fastest
trickles will arrive at time t, continuing as progressively slower tracer-bearing trickles come in. At time t, all the tracer-bearing threads of liquid will have reached the point of observation, and the curve of concentration will accordingly show a concentration front which grows with increasing rapidity up to a time tz, then progressively more slowly up to time t, after which the concentration will remain constant. As Dane1 1 has shown, the effective velocity is at most equal to half the m a x i m u m
velocity and m a y be as low as one-third of it. These are the values used as a basis for determining the velocity of the current. As w e have seen the time at which the tracer content reaches maximum concentration cannot be used for this purpose.
2. Rock with adsorptive properties. Here allowance must be made, in addition, to the ‘staggering’ effects of adsorption phenomena. Little detailed work has so far been done on this.
Single-shot Injection Methods With this method an injection of dyestuff of very brief duration is m a d e at a point upstream and the time taken by the tracer to reach a point downstream is then mea- sured.
A s a result of the difference in the rate of progress of individual threads of liquid, the tracer concentration at the point of observation increases up to a m a x i m u m value as the tracer in the fastest threads is progressively augmented by that in slower and slower trickles. Beyond this point, however, the swiftest moving runlets add water containing no more tracer from the upstream part of the injection and this mixes with the tracer-bearing water of the slower runlets; the latter successively behave in the Bame way in descending order of velocity. If a graph of the concentration in the water at the point of observation in function
of time is constructed, the result is a more or less bell-shaped curve, but with an exten- ded ‘taper-off’. It is also advisable to plot a cumulative curve of the concentration in function of time (fig. 21). On the non-cumulative curve, the elements to be marked are the time t, at which
the tracer appears, the height Eh of the mode, i.e. the m a x i m u m concentration observed, and the time tm of the mode, the time ti by which the tracer has disappeared and the
mean time tm = - (tf-tc). 1 2
In addition to the foregoing elements the following will be marked on the cumulative curve: the time, t,, of the median, corresponding to the centre of gravity; the time, t,, of the tenth centile, and the time, too of the ninetieth centile. The difference D between the two deciles t,,--tl, is then determined, and finally
the percentage of recovery of the tracer is calculated, i.e. the percentage of tracer found compared to the amount introduced; this is given by the surface below the cumulative curve. The recovery percentage gives not only the losses but also the extent of dispersion of the threads of liquid below the point of injection.
Here, too, some remarks follow on the two types of case which m a y arise-no adsorp- tion, and extensive adsorption, of tracer.
1. Dmel. op. ut.
7 97

Arid wne hydrology
No adsorption. W h e n there is no adsorption, the curve of concentration as a function of time is more or Iess bell-shaped and practically symmetrical.
The width of the ‘bell’ depends chiefly on differences in velocity of the various threads of liquid circulating within the aquifer, the variations in velocity across the width of individual capillaries or water-bearing channels, and the fluctuations due to variations in the diameter of individual capillaries and channels. The ‘bell-mouth’ becomes wider as the range of velocities increases.
The height of the curve, i.e. to the peak, is governed primarily by the factors deter- mining the shape of the curve. As the surface beneath the curve represents the quantity of tracer flowing at the observation point, then for equal volumes, an increase in the width of the curve means a decrease in the height of its peak.
However the height of the peak is also affected by the degree of dispersion of the threads of liquid below the point of injection downwards. If the dimensions of the water-bearing medium are so great that the injection can be deemed puncta1 and if a regular cone of dispersion develops below that point, the concentration along a straight line from the point of injection is inversely proportionate to the square of the distance. In any cross-section at right angles to the axis of the cone, concentration is greatest along the axis and diminishes gradually outwards on either side. If the tracer entirely fills the whole thickness of the aquifer, the decrease in concen-
tration thereafter becomes proportionate only to the distance after which the tracer has filled the whole thickness of the aquifer.
Multiple peaks. Deviant trajectories m a y have the effect of making the curve asymme- trical by increasing the concentration in the ‘tail’.
Alternatively, the arrival of deviant runlets at the observation point m a y produce secondary peaks usually located behind the main one.
It is, however, perfectly possible that a deviant runlet moving via a very free-run- ning channel m a y reach the point of observation before the peak of the general Bow and even before tracer from the general flow appears. The principal point to be ascertained is the average velocity of the water since
that is usually the significant fact for practical purposes. The average velocity in a given formation can be calculated from the porosity,
m, and the volume of water, V, displaced ahead of the tracer font. Let Vi be the volume of the liquid contained in the formation which will be displaced
ahead of the front, i.e. the volume between the point of injection and the point of observation. Let V be the volume of liquid necessary to displace Vi. W e then get:
v, =s’ (1 - C) dv 0 CO
VI can Le calculated by graphical integration of the area located above the volume representing the front.
Alternatively it will be apparent that volume values can be replaced by time values on the graph as the conversion from volumes V to times t can be effected by introduc- ing into the equation above the constants of m porosity and v velocity, 80 that
t, =j’ (1 - 2) dt 0 CO
t being the mean time taken by the tracer cloud to reach the point of observation. As w e have seen from Danel’s study, the average velocity is likely to be either greater than or equal to half the m a x i m u m velocity as determined by the &st occurrence of the tracer. Dane1 finds by experiment that the average velocity is in fact from a half to a third of the maximum.
From the m a n y experiments carried out in the laboratory on earth-filled cylinders,
98

Types of tracer
the average velocity is given by the position of the centre of gravity, i.e. the point in time at which 50 per cent of the tracer has passed the point of observation and 50 per cent has still to pass it. Archibald on the other hand contends that the best measure of the theoretical time of detention is the 70.7th centile. Adsorption occurring. When adsorption and desorption phenomena are found, many additional uncertainties are introduced. First and foremost the time of first occurrence of the tracer is no longer the time at
which the runlet of greatest velocity reaches the observation point: the whole tracer front is held back behind the liquid front. This is because the processes of adsorption and desorption make a time lag which increases in magnitude in proportion as the tracer is more strongly adsorbed and the trajectory longer. In addition to the various factors for elongation of the tracer cloud operative inde-
pendently of any adsorption and desorption, others must now be reckoned with. If adsorption and desorption were instantaneous, the tracer front would be of constant length through its whole trajectory. However, ion exchanges require a certain amount of time and accordingly the front becomes increasingly elongated as it travels along. If the speed of desorption is low, some tracer lingers in the rock and the cloud develops a very long tail. While the height of the peak decreases when the processes just described, quite apart
from all those operating in a non-adsorbant medium, extend the depth of the tracer cloud, it will also be affected by the permanent losses of tracer in the formation. In other words, the peak height declines in proportion as the medium is more adsorbant and the trajectory longer. The average velocity can no longer be estimated from, say, the time of appearance
of the tracer since this is retarded in relation to the arrival of the swiftest water runlets and the time lag is not calculable. Similarly the centre of gravity of the tracer is retarded in relation to that of the
threads of liquid leaving the point of injection and reaching the point of observation and again the delay cannot be calculated. All this goes to show that while there are in any case certain doubtful elements with
tracers not liable to adsorption, these elements are a thousand times more numerous with tracers which are adsorbable. Accordingly the use of the latter should be avoided.
CARRIERS
Most tracers are used in extremely low concentration. Hence where there is adsorption, the proportion of tracer adsorbed m a y be very large if the trajectory is of great length and there is prolonged contact with the rock, so that the tracer will no longer be detectable at the observation point. On the other hand if a radioactive tracer and its non-radioactive isotope are used
together, the adsorption process will operate simultaneously and indiscriminately on both and the proportion of the radioactive tracer adsorbed will thus be considerably reduced; for instance ordinary iodine would be used with tracer lalL Thus the use of carriers in addition is often necessary. The proportions in which they should be used will be given later.
THE USE OF RADIOACTIVE TRACERS
As a general rule the use of radioactive tracers is only essential when chemical or dye tracers have failed or for some reason cannot be used. In any case it is usually advis- able wherever possible to try a chemical or dye before resorting to radioactive tracers. With chemical tracers, the values measured are the variations in the concentration
99
Arid zone hydrology
of the chemical body added. This means the drawing and analysis of samples or in certain cases measurement of the electric conductivity which can be done on the spot. With dye tracers, the variation in the concentration of the dye is measured from
samples. With radioactive tracers, the variations of the concentration are determined by
measuring the radioactivity. This, of course, necessitates allowing for the variation of the tracer's radioactivity as a function of time. It will be recalled that if the degree of radioactivity at time t = 0 is A,, at time t
it becomes: - 1, A = &e
If w e take T to designate the period, i.e. the time required for its initial activity to diminish by half, i.e. its half life, we get:
-0.693: T A = Aoe being the decay constant.
0.693 1 =- T
But radioactivity is the product of several kinds of radiation varying in penetra- tion, energy and ionizing power.
OL radiation, helium nuclei of velocity one twentieth that of light, is of high energy and strongly ionizing. Its penetration, however, is low: it is stopped by from 3 to 8 cm. of air at normal temperatures and pressures. Thus despite its high energy it ie of little practical use.
p radiation--electrons at a velocity near that of light-is less ionizing than a radi- ation but more penetrating, needing 0.477 mm. of lead to stop it at an energy of 0.961 MeV and 0.92 mm. at 2.2 MeV. The effective thicknesses of water (in millimetres) for successive energies (in MeV) are the following : 1
mm. MeV mm. MeV mm. MeV
0.018 0.004 0.17 0.35 0.29 0.70
0.36 1 .oo 0.714 2.6 0.961 4.1
1.46 6.6 1.70 8.0 2.2 10.1
It should be noted that the absorption of p radiation gives rise to secondary radi- ation-X rays-on a scale proportionate to the activity of the @ radiation.
y radiation is of the same physical nature as visible light and X rays but is of much shorter wavelength. Its ionizing power is comparable to that of @ radiation but pene- tration is much higher. Thus the following thicknesses of lead are required to reduce the intensity by one half: 0.89 MeV, 8 mm.; 1.72 MeV, 12 mm.; 2.76 MeV, 14 mm.
Radioactivity is measured by the rate of disintegration per second. The unit of measure, the millicurie, is equivalent to 3 x 10' disintegrations per second.
Modern detection apparatus gives accurate measurements down to some hundreds of disintegrations per minute. Thus radioactivity need only amount to a small fraction of a millicurie to be measureable.
Not all radioactive substances are suitable as tracers, for which a combination of certain specific features is required. These are as follows: 1. The substance must be sufficiently soluble for injection in concentrations large
enough for detection at the point of observation.
1. Commiesariat B I'Energie Atomigue (France), Radidio-BUmsnts artificiels prdparks par le Commissarial h I'Energie Atornigus. Liata No 4. Gif-sur-Yvette. March 1957, 137 pp.
100

Types of tracer
2. Liability to adsorption must be low so that the tracer is not held up in transit. 3. It must not contaminate the rocks. 4. It must be detectable in low concentrations, if possible with portable apparatus. 5. It must be capable of being detected even in borings and wells. 6. It must have a half-life conformable to the duration of its passage between the
7. It must be readily and cheaply obtainable. 8. It must not be dangerous under normal conditions of use. Arising out of the final stipulation, radioactive bodies present dangers against which it is essential to be on guard.
From the point of view of mere exposure, a radiation is the least harmful on account of its low penetration. On the other hand adsorption of substances emitting a radiation is very dangerous as its extremely high powers of ionization then come into play.
points.
p radiation attacks the skin and exposed tissues. y radiation is much more dangerous as its high power of penetration enables it to
reach the internal organs. It is therefore well to know the tolerance doses :
1. Exposure to radiation from radioactive substances located outside the human body will arise primarily in connexion with the handling of radioactive tracers during dilution. The outside radiation dose to which the human body can be sub- jected without after-effects in the case of permanent workers is 0.3 roentgens per week a or 60 mr/8 h., measured in the air where the whole person is exposed. In the case of partial exposure only the tolerance is much higher, 1.5 r/week for the hands.
The approximate dose in roentgens/8 h. at a distance of 1 m. from a C curie soume of y radiation of energy E M e V is:
R = 4.4 EC 2. In the case of contamination by radioactive substances, i.e. of their absorption,
the danger of any radio element is proportionate to the length of its half-life, the ionizing power of the radiation it emits (U> p >y) the degree of selectivity with which it settles in a particular part of the body and the difficulty of its elimination G o m that part. The toxicity of the following is low: 24Na, aaK, 6’Wn, 84Cu, ‘SAS, 8SKr; the following
are fairly toxic: SH, 14C, 3aP, 3 5 , aeC1, soFe, ‘WO, 85r, 1s1I, 137Cs, 140Ba, 108Au; and the following are highly toxic: 4%a, “Fe, DIY, 96Zr, 1k4Ce, aloBi. In drinking water the m a x i m u m degree of radioactivity permissible in concen-
tration is 10-4 mc/litre for p radiation emitters. For iodine 131, emitting p and y radiation and concentrating in the thyroid, the m a x i m u m is as low as 10-5 mcptre, whereas for chrome 51, a pure y emitter and hence less dangerous to absorb, the figure is 0.5 curies/m.a The maximum for tritium is 2 x 10⁻⁴ mclcm.3
T h e m a x i m u m level of iodine 131 in the body, with maximum concentration in the thyroid, is 0.3 microcuries, and that of tritium 10 millicuries (104 p c).
Usable Radioactive Tracers There are many tracers which can be used. It is only proposed to list those most easily obtainable and available at reasonable prices. These will be subdivided into those emitting pure p radiation and those emitting both p and y radiation.
Pure p emitters Tritium (3H), half-life 12.5 years, energy 0.019 MeV. Found in the form of hydrogen
1. Commissariat P 1’Energie Atomique, op. cit. 2. The rmntgen is a quantity of X or 7 radiation such that the associated corpuscular emission per 0.001293 g. of air produces.
in air, ions carrying one electrostatic unit of quantity of electricity of either sign.
101
Arid zone hydrology
with 10 per cent 3 H or tritiated water at 200 mc/cm.3 Carbon 44 (14C), half-life 5,700 years. Energy 0.155 MeV. Phosphorous 32 (“P), half-life 14.3 days. Energy 1.712 MeV. P0,H3 in hydrochloric acid solution of 5 to 10 mc/cms or in neutral sodium phosphate solution at 2 mc/cm.S
Sulphur 35 (ass), half-life 87.1 days. Energy 0.166 MeV. Sug., H,S04 in a diluted hydro- chloric acid solution at 1 to 10 mclcm.3
Calcium 45 (46Ca), 164 days, 0.166 MeV. Target: CaCO,; saturation, 530 yc. Strontium 90 (sOSr), 28 years, 0.54 and 2.24 MeV. Target: Sr(NO,),, 1 to 5 mc/cm., Strontium 89 (8sSr), 53 days, 1.46 MeV. Target: SrCO,, saturation 99 yc.
p and y radiation emitters Sodium 24 (24Na), 14.9 hours; p: 1.39 MeV; y: 2.76-1.38 MeV. Target: Na,C03 or NaCl;
Iron 59 (Ks1’e), 46.3 days; p: 0.46-1.56-0.27 MeV; y: 1.10-1.29-1.19 MeV. Target: Fe;
Cobalt 60 (60Co), 5.2 years; p: 0.32 MeV; y: 1.33-1.17 MeV. Target: CO or Co,O,; satur-
Iodine 434 (1311), 8.05 days; p: 0.61-0.34 M e V ; y: 0.36-0.28-0.64-0.25-0.81 MeV. INa:
ThuEium 470 (170Tm) ; 129 days; p: 0.97-0.98 MeV; y: 0.084 MeV. Target: Tm,03; satur-
Bromine 82 (@*Br), 35.9 hours; p: 0.465 MeV; y: 0.547-1.312 MeV. BrNH,, alkaline
Barium 140 (‘4OBa), 12 days. The y radiations from lanthanum, more penetrating
Rubidium 86 (Wb), 19.5 days; p: 1.822-0.716 MeV; y: 1.076 MeV. Rubidium chloride,
Ruthenium 103 (lOsRu), 39.8 days; p: 0.217-0.698 MeV; y: 0.498 MeV. Target: Ru, satur-
Saturation 39 mc/g.
saturation, 3.7 mc.
ation, 990 mc. Cobalt chloride 2 to 50 mc/mg.
10 to 50 rn~/cm.~
ation, 1.2 curies.
bromide, 4 mc/mg.
than thoEe from barium, are measured.
saturation 9.9 mc/g.
ation: 2 mc/g.
These isotopes can be classified on the following linea:
Isotopes liable to adsorption or to react with water or to rocks. 24Na, 55E’e, 59E’e, 137Cs, 131Ba, @eRb, 32P, 45Ca, 90Sr, @OSr; hence Na, Fe, Cs, Ba, Rb, Ca and Sr cannot be used in argillaceous or organic media which will fix the adsorbable cations. Fe can likewise not be used in water where it is liable to precipitation by oxidation,
while Ba will be precipitated by SO.,, and P is also unsuitable for use. However, if the groundwater has a high content say of Na or Ca and is in geo-
chemical equilibrium with the rocks through which it is passing, there will be no tendency to the fixation of 24Na or 46Ca respectively. Moreover these cations can serve as carriers. Finally if the formations contain no adsorbing elements, as with, say, pure lime-
stones or purely siliceous sands or sandstones, the cations can be used as tracers.
Isotopes not readily adsorbable. (a) Isotopes of very short half-life. agBr. With a half life of only 35.9 hours, this isotope can seldom be used in groundwater hydraulics as the need to measure trajectories of this kind of duration arises relatively rarely. (b) Normal short half-life isotopes. lS11, 8.05 days. This is a more useful half-life
and there are types of situation when this tracer can be employed: over short distances for water circulating at low velocity and over sizeable difitances for water in swift flow as in limestone massifs. In view of its high activity it can be detected with appreciable sensitivity without
using a carrier. However, since the adsorption of this iodine is nevertheless not always negligible,
102
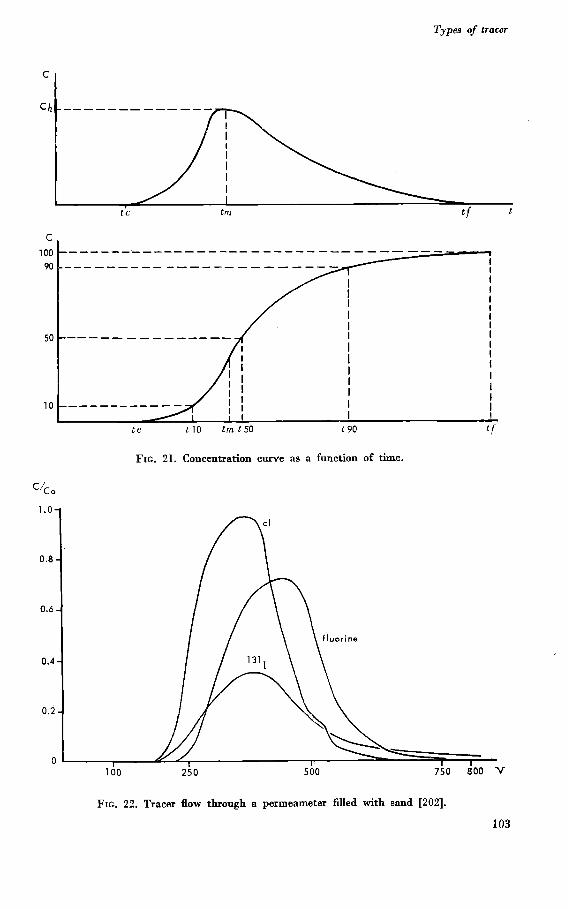
Types of tracer
CI
C 100 90
50
10
tc L10 trn L50 190 tf
FIG. 21. Concentration curve as a function of time.
FIG. 22. Tracer flow through a permeameter filled with sand [202].
103

Arid zone hydrology
particularly in view of its low concentration, it is worth combining it with non-radio- active iodine as a carrier.
(c) Long half-life isotopes. 3H, 12.5 years. This is a thoroughly useful half-life, enabling the isotope to be employed when velocities are low and trajectories are of great length.
Its activity is about 2 x 10l6 disintegrations per minute per gramme and its natural specific activity is extremely low. The great advantage is that tritium becomes a component of the water and forms a single body with it.
Methods for the U s e of Radioactive Tracers
First and foremost, before a radioactive tracer is used in a particular aquifer, inform- ation is desirable on how it will disperse in the rock and how far it m a y be retained by adsorption. Yield tests should accordingly be made on samples in the laboratory and the results also compared with those for fluorescine and more particularly for NaC1. The tests are made with a large model water permeameter-suitable types are in
metal with dimensions of about 1.5 m. in height and 90 cm. diameter (Kaufman and Orlob, [206, 2071) or in glass with heights of from 1 to 3 m. and a diameter of 0.46 m. (Hours, [204]). The water is introduced into the permeameter at the top and runs out at the bottom.
The water level in the upper part can be kept constant by an overflow pipe. A sample of the earth material, as nearly as possible in its natural state and of
known volume, i6 loaded into the permeameter and is then soaked to saturation with water. Next, a volume V of tracer solution at concentration co, is poured on to the top
surface of the column, the beginning of this operation being used as the zero point for the time values. As soon as the tracer solution has been completely absorbed by the sample and has
disappeared from its upper surface, the flow of water into the permeameter is started, with the overflow maintaining it at a constant head; it is of course desirable to use the same water as that of the underground current whose velocity it is sought to measure. Throughout the operation, the amounts of water flowing out are measured, with extraction of samples at regular intervals, and determination of the tracer concen- tration c of each. A graph is then plotted with the c/co concentration ratios scaled on the ordinate and the cumulative volumes of water on the abscissa (fig. 21, 22, 23). A second graph is then plotted with the cumulative values of the successive c/co
ratios scaled on the ordinate (fig. 21). First of all the yield 2 (Vc)/ (V) col is calculated from the cumulative curve.
If earth columns of different length are used the reduction of yield as a function of the length of the trajectories can be determined (fig. 24).
The time lag can be calculated by using sodium chloride as a control and comparing the points of maximum concentration, given by the peaks of the curves. It will then be an easy matter to compare one tracer with another.
Thereafter an attempt must be made to calculate the quantities needed respectively for the radioactive tracer and the carrier isotope. In this connexion Hours [204] writes: ‘The choice of the minimum quantity of
carrier isotope can be based on the following line of reasoning: to make the best use of the “tell-tale” qualities of our millicuries, our object will be to preserve a detectable degree of radioactivity with the minimum concentration of tracer still giving appre- ciable yield in a permeameter experiment (of the order of several y/l.). In other words, there is little prospect in the field of the tracer re-emerging at a concentration notably inferior to that minimum and w e shall therefore adjust the limit of sensitivity of our detection system, expressed in y/l., to that minimum value.’
104

Types of tracer
FIG. 23. Tracer flow through a permeameter filled with silt [202].
FIG. 24. INaItracer at 50y/l. C 6
5
2800 cc
Influence of the length of the column [200]
Curve Length 9/0 of tracers
OlltflOW recuperated ~~ ~~
m. 1 1 100 I412 min 95 2 1.9 100 m1/14 min 87 3 2.85 100 ml/ll min 85
105

Arid zone hydrology
Take the case of Serre-PonGon, where the minimum was about 4 y/l. in BrNafor a detector sensitivity of 0.2 pcurie/m.a Thus 5 kg. of BrNa were needed to achieve an activity of 250 pcurie of (this
activity being calculated for the time of reappearance of the tracer, i.e. about three days after injection).
T o detect the tracer use m a y be made, say, of a Geiger-Muller counter though this instrument has a m a x i m u m efficiency of only 2 per cent for y photons. For p radiation its efficiency is high, in the neighbourhood of 100 per cent. Another detector which can be used is the scintillation counter with an efficiency percentage for y photons well into double figures.
Obviously there can be no question of measuring the radiation at a distance from the water, above the soil surface, owing to the screen which the soil itself constitutes against p and even y radiations.
The detection procedure (Hours [204]) will therefore be one of the following: 1. Immersing a portable detector in the groundwater body, the well, boring or spring.
However, the sensitivity of the majority of these detectors is poor, no better than about 5 pcuries/m.a, though sensitivities as high as 1 pcurie/m.8 can be obtained with the Geiger-Muller and 0.2 pcurie/m.a with the scintillation counter.
2. Pumping water from the tracer-bearing mass and passing it through a tank housing the detector.
3. In bringing a small sample of water into the vicinity of the detector by fitting it either into a ring-shaped recipient (10-20 ml.) around the crystal of the detector, or into the well (3-20 ml.) of a Lollow centre crystal.
4. Extracting the tracer fiom the water and pressing it near the detector. For instance radioactive iodine used as a tracer (with the addition of INa as carrier) is first oxidized with nitrosyle sulphate and then reconstituted in CCl,. The iodine is then restored to an aqueous solution as INa-I0,Na by agitation with a soda solution. The solution is then dried out in an evaporation dish which is placed with the residue under the aperture of a bell-shaped counter.
Experiments in which Radioactive Tracers have been Used
The first experiment was probably Hess’s [203] on the Susquehanna River in the United States of America, using radium. However radium is not really suitable as it can be precipitated by SO, ions as RaSO,. In addition the operation is too costly. This was followed by m a n y other experiments to calculate the discharges or velo-
cities of streams, e.g. by Montens [208], Sons [214], Josendal, Sandford, Simane [205], Harold A. Thomas Junior (1956), Allen and Grindley [192] to name only a few.
Radioactive tracers have also been used to study the flow of liquids in conduits and to detect water leakages, e.g. by Archibald [193] Hull, Kent and Lee (1949), Hull and Fries (1956), Puttman and Jefferson (1956), and Seligman [212].
Comparatively few tests have been carried out on groundwater, the most important being those by Fox [201], Truesdale [216], Urbain, Lagrange, Hours and Geslin [218], Hours [204], Kaufman and Orlob [206, 2071, Brown, Parker and Smith [197], Vessey and Czerny [220], etc. It is perhaps for the investigation of petroleum deposits that the largest call has
been made on radioactive isotopes, more particularly to detect the direct channels of communication between the different points of a petroleum-bearing formation, e.g. by Comber and Tiratso (1950), Edwards and Holter [198], Russel [211], Watkins and Mardock [222], Flagg, Myers, Campbell, Terry, Mardock [199], Aebersold [190], Watkins and Dunning [221], etc. There follow descriptions of a few specimen tests on groundwater.
106

Types of tracer
T h e Calijornia Research Laboratory test (1954) [206, 2071. The object was to see how the rate of advance of bacteria of the coli group compared with that of the liquid sewage front in a water-bearing formation. The tracers used were fluorescine, a chloride, dextrose and iodine 131 and they were injected at a rate of 140 litres/min. through a wall 12 inches in diameter into a captive groundwater body at a depth of 27.4 m. The average thickness of the aquifer was 1.34 m. and it consisted of gravels and sand of an effective gauge of 0.56 mm., 6.9 coefficient of uniformity and porosity of 0.35. Twenty-three wells of 6 inch diameter were driven at distances up to 152 m. Very large quantities of sodium chloride had to be used and its density caused rivulets to divide and sporadic delivery of the tracer at the observation points. The quantities introduced into the aquifer were: (a) 170 litres of a sodic fluorescein
solution at a concentration of 100 mg./kg., i.e. 17 g. of the tracer; 1,500 litres of sugar solution at a concentration of 6 g./kg., or 9 kg. of the tracer; (b) 420 litres of water containing 20 millicuries of iodine 131 (three minutes' injection time); (c) the bacteria were introduced by a continuous injection of a mixture of 10 per cent of decanted lipide sewage and recharge water. The table below gives the observations made at three wells on the same meridian.
Time of arrival of first detectRblo traces 1 Distance from injection well Calculated ,811 B.Coli Dextrose Fluorescein
m. 3.95 (13 ft.) 2.8 1.1 0.4 0.6 0.2 19.2 (63 ft.) 65 29 23 8.2 2.8 30.5 (100 ft.) 160 15 24 16 15
1. Mean time of arrival of liquid front estimated on the basis of injection at 140 litreslmin. and the average thickness (27.4 m.) and the porosity (0.35) of this oqnifer.
Fig. 25 shows the iodine 131 results for the same three wells. 100
10
1
I I
, well ai a distance
well ai a distance
well ai a distanc of 100 It.
/
1 ' 10 100 700 hours
FIG. 25. Trajectory of iodine 131 in a confined aquifer [202].
107

Arid zone hydrology
Thus all the tracer fronts travelled very fast, at a velocity several times greater than the average velocity which should have been achieved in a homogeneous medium. It follows that there must have been ‘bypass’ channelling on a considerable scale. The ratio of the estimated mean time of arrival to the actual times of the tracers,
in other words the ratio of tracer velocity to calculated mean velocity is shown in the following table:
Well l0lI S.Coli Dextrose Fluorescein
m. 3.95 2.54 7.00 4.66 14 19.2 2.24 2.83 7.93 23.2 30.5 2.16 6.66 10.00 10.66
The most regular results were given by the iodine tracer. The graphs of the vari- ations of the iodine concentration in time for each of the wells have centres of gravity little removed from the calculated mean time, save for the first well where there appears to be a time lag. As to why the progress of the other tracers was so irregular-i.e. why their behaviour
so strongly suggests extensive by-passing-it is possible that the method of injection affected the result. T o detect the extremely small amounts of radioactive iodine reaching the two
outermost wells, it was necessary to evaporate the samples (of 20 cm.* each) and deter- mine the p radiation with an internal flow counter. In the outermost well the activity of the iodine did not exceed 6.5 strokes/minute/cm.a
The fluorescein reached this well at a peak concentration of 0.4 mg./kg., with a tail comparable to that observed in the permeameters.
Serre-Ponpn test (France) [204]. The object was to find out whether there could be intercommunication between a gallery passing under the Durance and a piezometer borehole sunk in stony alluvial deposits 100 m. away on the other side of the river.
Large amounts of fluorescein and eoscin were injected into the piezometer but throughout 10 days’ pumping no trace of them appeared in the gallery. In view of this failure, a solution of 5 kg. of sodium bromide in 25 litres of water with
one curie of brome 82 as a marker was injected under pressure equivalent to a 30 m. head followed by a swift wash through with 500 litres of water. Water waa then pumped from the gallery at a rate of 3.5 m.s/min. and radioactivity
was detectable in it 24 hours after the injection. The tracer front was fairly steep and the tail very long.
Tests ut Cuuterets and Luz (France) [218]. The task was to determine whether the prin- cipal recharge of the thermal sodic sulphur springs of Luz and Saint-Sauveur was from vadose water. These are hot springs, which means that part of their course underground is at great depths, the mean annual temperature of the air being approximately W C . The springs emerge at the interfall between granite and lower carboniferous schists
and there are lakes up in the mountains lying on the same interfall, which are assumed to feed the aquifer system. 0.7 curie of iodine 131, in the form of sodium iodine, was dropped into one of the
lakes, Lac du Labas, with an estimated direct trajectory to the discharge point of 21 km.
Samples were taken on 13 successive days, initially of 2 litres and finally of 15 litres, and reduced to approximately 100 cm.8
108

Types of tracer
Counter tests revealed no systematic tendency for the total radioactivity to rise, and the test demonstrated that either the flow through the aquifer-not surprisingly in view of the length of trajectory-was much slower than had been thought, if the springs were indeed of vadose origin, or alternatively their replenishment really came from elsewhere. However, the experiment was by no means useless as it permitted a study of the movements of the water in the lake.
Tests in the petroliferous formations in Oklahoma (Nowata County) and Kansas (An- derson County), U.S.A. [222]. These tests are of special interest as they indicate the way to set about a hydrogeological investigation. Their object was to estimate the permeability of the formations in question by determining the direction and velocity of water measured in them.
The obvious initial step, before any test, is to collect all available documentation assembled on the lithology and structure of the permeable formation, and the fullest particulars of the characteristics of the injection well with particular attention to its hydraulic properties. If samples of the rock are available, it is advisable to begin by testing its absorption of tracers by the permeameter method described earlier.
The next step is to log the y radiation and neutrons, both in the injection well and in the observation wells where the tracer m a y appear, using standard apparatus for the y radiation and ionization chambers for the neutrons. If the preliminary data suggest that the water should pass rapidly from the injection
to the observation well, it m a y be judicious to carry out a test with a colour tracer to begin with. This will give the approximate duration of the trajectory and hence the time when the y-logging team should arrive on the ground to detect the first appear- ance of the tracer without having to wait too long. In any event the behaviour of the colour tracer at the observation wells confirmed the existence of suspected channels and enabled the required quantities of the radioactive tracer to be calculated more accurately. The injection was made at a fairly steady rate of 3.8 litres per quarter hour. The
radioactivity of the fluids yielded by all the observation wells where the tracer might appear was kept under continuous observation with y-sensitive Geiger-Muller tubes lowered vertically.
Samples of liquid were taken at varying intervals up to the moment when a definite increase over the background level of radioactivity was shown. After that the sampling interval was shortened.
Before the tracer reached the first observation well, a y radiation ray logger was placed in front of the permeable formation and when the radioactive tracer started to come through, y radiation logs were recorded at frequent intervals, permitting a definite identification of the horizons through which the water circulated most freely.
Test B in Nowata County, Oklahoma, was carried out for a scheme for repressing a petroleum deposit at a depth of 155 m. in the Bartlesville sands by water injections. The cone strainers of the boreholes topped a 13.7 m. depth of sand and the arrange- ment of the wells is shown in fig. 26, 190-W being the injection well. The yields of oil and water respectively from the individual extraction wells are given below:
Well Water Oil Ratio
R R-2 165-P
m.3 1.19 11.9 2.384
m.a 0.0476 0.215 0.018
25/1 5611 130/1
109

Arid zone hydrology
The excessive amounts of water in relation to oil appeared to indicate the existence of a line of flow through fissures between the injection and the extraction wells.
The ‘anchor packer’ hydraulic tests carried out on the injection well (190-W) showed that the water from it entered the sand at a depth of approximately 158 m. A tracer solution of 226 g. of fluorescein to roughly every 43 litres of water was
introduced into the injection well (190-W) at a constant rate and the colour traces appeared in well R-2 approximately 11 hours later, i.e. after about 1,910 litres of the solution had been put over into well 190-W and 3,340 litres of petroleum and water had been extracted from well R-2. N o fluorescein was detected in the water from wells R-1 and 165-P. Thus the prescence of colour tracer in well R-2 confirmed that
R-2
R-1
G-15 .
there was channelling in a specific direction.
N 0 190-W
H-14 H-16 e
G-17
t 165-P -
a F-16 . F-14
FIG. 26. FIG. 27.
Next a solution of approximately 87 millicuries of iodine 131 to about 119 litres of water was injected into well 190-W for 15 minutes. The rate of injection of water into well 190-W had been raised since the test made with the colour tracers. An increase of radioactivity was noted in well R-2, 281, hours after the injection of
the tracer, during which time 1,310 litres of water had been put over into well 190-W. From the level in the tubing at which the radioactive liquid stood when the first reading was logged, it was calculated that the tracer had reached well R-2 in two hours only. An increase of radioactivity was detected at the surface of the liquid pro- duced by R-2, 411, hours after the injection, during which time 2,260 litres of water had been injected. The distribution logs gave a precise pinpointing of the zone of entry into well R-2.
Counting from the time of injection the first increase in radioactivity took place 41/2 hours and the peak 7 hours later. Twelve days after that the radioactivity of the water was still a little above its natural basic level.
Integration of the observations made of the water in well R-2 showed that 70 milli- curies-i.e. about 80 per cent-of the radioactive iodine reached the well. A slight increase in radioactivity was observed in well R-1 approximately 72 hours
after the injection of the tracer. However the peak was lower and the decrease of radio- activity swifter. No radioactivity was observed in the four other wells. The data thus obtained showed that the water passed directly from well 190-W to
well R-2 through one or two channels at a depth of about 158 m., which strongly
110

Types of tracer
suggests the existence of a continuous fracture either between 190-W and R-1 over a distance of 80 m. or between 190-W and R-1 via R-2 over a distance of 84 m. approxi- mately. A similar example is a test in the Bartlesville sandstone in Anderson County, Kansas.
The tip of the petrol-bearing formation lies at a depth of from 236 to 241 m. The depth of the sand is between 8 and 13 m. in the immediate area and the wells are arranged as shown in fig. 27. 6-15 was the injection well. The extraction wells, H-16, F-16 and to a lesser extent
M-14 and F-14 were discharging too much water and the amount from H-16 alone was more than was being fed into 6-15; the whole blame for the excessive yield of water could not, therefore be laid on the latter. However tests made on other injection wells showed that the behaviour of 6-15 was abnormal and that it might nevertheless be the major cause of the relatively high water output of M-16 and its neighbours. The relatively low yield of water from 6-17 which lay almost on a straight line between the injection well (6-15) and 6-16 pointed to the presence of a channel zone of very high permeability between the last two wells. An initial test with colour tracer was carried out to confirm the existence of such a zone and to determine the duration of the trajectory between the wells. A tracer solution of 226.8 g. of fluorescein in about 83 litres of water was injected
and samples were taken every two hours for 72 hours counting from the time of injec- tion and every day for the week following this period. The first trace of fluorescein was detected at the water surface in well M-16 58 hours after the injection of the tracer, during which period 19,300 litres of water had been put over into well 6-15 and 31,000 litres of liquid extracted from well H-16. Fluorescence reached a peak intensity of 0.5 ppm and remained detectable for at least two weeks. The first traces of fluorescence in F-16’s water were noted after about seven days
at a maximum concentration of less than 0.5 ppm; thereafter the degree of fluoresence decreased rapidly. No traces were observed in the water of wells H-14, F-14 and 6-17.
After making y radiation logs for all the wells of the group a 15-minute injection was made into well 6-15 of a solution of 44 millicuries of iodine 131 in about 96 litres of water; the rate of water input at the time was 10,500 litres per day against 8,000 litres at the time the colour tracer was injected.
After the tracer injection, b s t y radiation logs were made which showed increased radiation and located the zones of water influx of which the most important was between the 256 and 257 m. levels, with secondary influxes on a smaller scale at 252 and 255 m. Samples were taken at random intervals before, and frequently and regu- larly after, the appearance of the tracer in extraction wells and revealed no appre- ciable increase of radioactivity at any time in wells F-14 and 6-17. In well H-16 the first traces of radioactivity were detected in the surface 32 hours
after the injection of the tracer. As it had been calculated that water entering the well required 2 hours 48 minutes to reach the top of the tubing, it follows that the tracer reached the well in 29 hours. The 14-hour time difference between the first appear- ances of fluorescein (58 hours) and of the radioactive tracer (32 hours) respectively in the well water is perhaps due to the facts, (a) that a larger quantity of water was used in the injection of the radioactive tracer, and (b) that there m a y have been par- tial adsorption of the fluorescein.
Continuous measurements of radioactivity were carried out on wells F-16, H-16 and H-14. In H-16, the first traces appeared 29 hours after the injection with inten- sity rising to a peak initially after 43 hours and again after 75 and 105 hours. The y radiation logs for this well showed that water was entering at these levels
at 258, 260 and 262 m. respectively. There can accordingly be no doubt that each peak relates to the influx at a separate level. Measurements of the variation of radioactivity in time in well F-16 also showed
111

Arid tone hydrology
three similar peaks, but lower and decreasing progressively, the first 108 hours, the second 132 and the third 170 hours after the injection. In this well, too, water was entering at three levels clearly indicated by increases in the y radiation recorded on the logs which showed two slight rises at 240-241 and at 244-245 m. depth and a steep rise at 262 m. In well H-14 there were again three peaks at 134, 158 and 182 hours after injection.
However, unlike the other boreholes, the heights of the peaks increased successively, and were much greater than in the other well, but the amplitudes were lower. This is probably connected with the presence of zones of higher permeability.
Wadi Raiyun test, Libyan Desert [200]. Here radioactive rubidium chloride was used to test the impermeability of the substratum of the Wadi Raiyan.
Other tests with rubidium chloride were conducted in Egypt and revealed links between the Nile and groundwater bodies in the vicinity. About a hundred millicuries of rubidium were used. The aquifer was a very pure siliceous sand, the distance covered about twenty kilometres and the dilution factor between injection and emergence, of the order of a thousand million.
Research on hydrological balances [196]. In the spring of 1954 the origin of the rain falling on the Mississippi and the balance of water movement between the ocean and this basin were established by Operation Castel.
Before and after the operation tests of tritium concentrations in rainwater and surface water were carried out in large numbers, notably in Chicago, Ottawa, Mexico, New Mexico, Western Europe and Greenland. These showed that immediately after the operation, from March to May, there was a considerable rise in the tritium content of rainwater in Chicago and Ottawa. Between June and September, however, there waa a rapid decrease followed by a period of stability lasting about a year with a further rise thereafter from the beginning of 1956 (fig. 28).
Calculations showed that the retention period of tritium in the air, i.e. the period after which all particles have the same average probability of precipitation is about
500
400
300
200
100
1954 1955 1956 FIG. 28. Tritium content of rainwater and mow in the northern hemisphere [192].
112

Types of tracer
forty days (against a retention period of only three days for troposphere humidity). The shortness of the retention period explains why rainwater and surface water
analyses in the Southern Hemisphere did not bring to light any excess of tritium over the normal content. :++ On the other hand, increases in the tritium content were observed in the Northern Hemisphere as shown in the table below:
Increase Tritium atoms (TJH x lo8) precipitated per
Lake Michigan Lake of Zurich Lake Tahoe (California) Crater Lake (Oregon) North Atlantic North Pacific
5.6 26 7 6 2 2
(187 f 20) x 107 67 x 107 190 x 107
100 x 107 100 x 107
1800 x 10’
The normal tritium content is 10-11 to 10-18 per atom of hydrogen. The quantity of tritium precipitated per square centimetre after Operation Castel
was also calculated. This is shown in the right-hand column of the table above. W e can thus assume that there was an average precipitation of tritium in the Northern Hemisphere of 200 x 107 atoms per cm.2 (107 atoms of tritium give one disintegration per minute). The result was a notable rise in the tritium content of stream and river water in the Northern Hemisphere. The tritium content of the Mississippi rose from 4.7 (4.5) to 44 x 10-18 T/H, representing an increase of 39 x lo-’@ T/H. In other words 7.7 m. of water was mixed with the rainwater transporting the tritium from operation Castel.
After the decrease of the tritium to normal, the tritium content of the river run-off remained constant for a period of one year. This means that there was a complete mixing of the waters right from the first
months onwards. Rainwater was no more enriched in tritium than river water as a result of recurring evaporation in the water cycle. Thus the mixing of tritiated rain- water with continental waters does not only take place superficially, and it is possible that further mixing could take place later on. During the period of constant tritium content (44 x 10-18 T/H), in the Mississippi,
the rain and snow in Cbicago had a steady content of 21 x 10-18 T/H and seawater one of 2.5 x 10-ls T/H. It is calculated from this that an average of one third of all rainfall consists of re-evaporated water from land masses and two thirds of water freshly evaporated from the sea. For the purposes of this calculation, five units were subtracted from the river water tritium content and seven from that of rainwater to allow for tritium additions from cosmic radiation at the time the b o m b was exploded. Thus of the 770 mm. of annual precipitations falling on the Mississippi basin, 520 mm.
come direct from the sea and 250 mm. from re-evaporated inland water. Run-off is reckoned at 280 mm. which puts the level of evaporation in the Mississippi
basin at 490 mm. (770-280 mm.) equivalent to one third of the atmospheric moisture which forms the rain. Thus the other two thirds from the sea amount to 980 mm. or say, 1 m. As w e have seen, 520 mm. of this moisture is returned to the earth’s surface in the form of rain. It follows that the balances of 480 mm. (1,000 - 520) of ‘oceanic’ water and 240 mm. (409 - 250) of subsurface water remain in the vapour phase in the air.
Thus the moisture (240 mm. per year) from subsurface waters in the Northern Mississippi Valley returned to the sea by the winds is less than that (280 mm. per year) transported by the Mississippi itself.
8 113

Arid wne. hydrology
t I
5
L
tu al
I I
I
W
E 0
LL
5
L
114 FIG. 29. Water balance in
the Mississippi Valley [192].

Types of tram
W e can therefore conclude that rainfall in the Mississippi valley includes an admix- ture of evapotranspirated subsurface water, in the space of a few months, equivalent to 8 m. of rain. About 520 mm. of ‘oceanic’ water are precipitated as rain yearly, 490 mm. are re-evaporated, 280 mm. return to the sea by way of the streams and 240 mm. return by evaporation. The following diagram (fig. 29) shows the resulting water cycles. Observations were also carried out on thermal-springs-Steamboat Springs in Nevada
and the Yellowstone Park geysers in Wyoming. It was already known from the recent researches by H. Craig 1 based on the D/H,
018/01@ ratios that the water from these springs should in all probability be of meteoric
The tritium rates showed that small quantities of extra tritium brought by the rain had appeared with great rapidity in almost all the springs and that the full mixing process had most probably not been completed. The age of the water in these springs should therefore be about fifty years.
origin.
1. II. Craig, G. Boato. D. E. White, ‘Nuolear processes in geologic settings. Second conference, September 8-10 1955’. Publi- cation No. $00. National Academy of Science, (1956).
115

B I B L I O G R A P H Y 1
WATER BALANCE AND RESOURCES
1. BAKER, D. ‘Safe yield of ground water reservoirs’, Association internationale d’hydrologie scientifipue, Assemblie de Bruzelles, 1951, t. 2, p. 160. (Publication no. 33.)
2. BAUMANN, P. ‘Groundwater phenomena related to basin recharge’, Proceedings of the American Society of Civil Engineers, 1955, vol. 81, no. 806, 25 pp.
3. BERKALOFF, E. ‘Etude du bilan d’eau Axn Ketena’, Bulletin konomipue et social de la Tuni- sie, no. 44, 1950.
4. BOGOMOLOV, G. V. ‘Classification des ressources d‘eau souterraines et evaluation de leurs rbserves’, Association internationale d’hydrologie scientijique, Symposia Darcy, 1956, t. 2, pp. 262-271. (Publication no. 41.)
5. -; PLOTNIKOV, N. A. ‘Classifying the underground water resources and appraising their reserves’, Congrhs gblogique international de Mexico, 1956, t. 2, p, 48.
6. -;- . ‘Classification des ressources des eaux souterraines et leur representation sur des cartes’, Abstracts of the reports at the XIth General Assembly of the International Asso- ciation of Scientijic Hydrology, Moscow, Akad. Nauk S.S.S.R., 1957,- pp. 45-7.
7. BOLELLI, E. ‘Coefficients d’infiltration, coefficients d’bvaporation. Etude d’un can precis dans les calcaires greseux (PliocBne et Quaternaire de la cBte du Maroc)’, Association inter- nationale d’hydrologie scientijique, Assemblie de Bruzelles, 1951, t. 4, pp. 12-15. (Publication no. 35.)
8. CHEBOTAREV, I. I. ‘Principles of the estimation of subterranean waters’, Wat. & Wm. Engng 1951.
9. CLODIUS, S. ‘Neue Zahlen zum Schema des Wasser-Kreislaufes’, Bohrtechnik-Brunnenlau, 1955, vol. 6, no. 1, pp. 21-3.
10. COLAS, R. ‘L’alimentation en eau des rgions arides’. Societe des Ingenieurs Civilrr de France, 1956, pp. 396-412. (Mimoire 109, no. 5.)
11. COLLINS, B. W. ‘Ground water in the hydrologic cycle, with special reference to Canter- bury, N e w Zealand’, Report Seventh Science Congress, Christchurch, Nac Zealand. Royal Society of N e w Zealand, 1953, pp. 127-39.
12. DANEL, P. ‘La reserve des d6bits des eaux souterraines’, Tech, mod., Construction, 1952, p. 245.
13. DBOUHIN, G. ‘Incidences de l’utilisation des eaux souterraines EIV I’dquilibre hydrolo- gique’, Tech. de l’eau, no. 122, 1957, pp. 15-22.
14. DUBIEF, J. Essai sur l’hydrographie superjicielle au Sahara. Birmandreis, Algiers, Direction du Service de la Colonisation et de 1’Hydreulique. Direction des Etudes Scientifiquee, vol. 1, 1953, p. 457, 41 fig.
1. This bibliography haa been printed a8 received from the author.
116

Bibliographie
15. FOURMARIER, P. ‘Les reserves aquifkres en Belgique’, Tech. de I’eau, 1952, pp. 25-7. 16. GARMANOV, I. ; &ENSKI, G. ‘La formation des eaux souterraines et leur repartition par
zones, dans les regions arides de l’U.R.S.S.’, Congrbs ge‘ologique international de Mexico, 1956, t. 20, p. 50.
17. GUIRSKI, N. K. Quelques particularite’s de la dynamique des eaux souterraines des de’serts et des semi-de’serts. 1958, 23 pp., 7 fig. (Communication privee.)
18. KOCH, P. Contribution & l’e’tude de la corre’lation entre les pre’cipitations et les niveaux de nappe dans le bassin amont de la Seine. (La houille blanche, t. 10, num6ro special B.), 1955.
19. KOUDELINE, B. I. ‘Principles of the regional estimate of natural resources of underground waters and problems of water balance’, Abstracts ofthe reports at the XIth General Assembly of the International Association of Scientijic Hydrology. Moscow, Akad. Nauk S.S.S.R.,
20. -. ‘Principes nouveaux pour distinguer ce qui est db i l’6coulement souterrain sur l’hydrographie des fleuves’, Bulletin de I’Association internationale d’hydrologie scientijique, no. 7, 1957, pp. 25-35.
21. -. ‘Importance des structures geologiques pour les calculs du bilan d’eau de multiples annbes’, Bulletin de l’dssociation internationale d’hydrologie scientijque, no. 7, 1957, pp. 36-40.
22. KOUNINE, V. N. ‘Conditions of the formation of underground waters in the desert’, Abstracts of the reports at the XIth General Assembly of the International Association of Scientijc Hydrology. Moscow, Akad. Nauk S.S.S.R., 1957, pp. 54-7.
23. MAMADEVAN, C. ‘Hydrology of arid and sub-arid regions in India’, Congrbs ge‘ologique international de Mexico, 1956, t. 20, p. 23.
24. MANIL, G. ‘Un aspect du problkme du bilan de l’eau dans le sol. Les donn6es de Penman 6ur l’evaporation en conditions naturelles’, Bulletin de l’lnstitut agrommique de Gembloux, 1954, t. 22, no. 3-4, pp. 255-71.
25. PENMAN, H. ‘The water balance of catchment areas’, Association internationale d’hydrdogie scienti$que, Assemble’e de Bruxelles, 1951, t. 3, pp. 434-43. (Publication no. 34.)
26. -. ‘Components in the water balance of a catchment area’, Quarterly J. R. met. Soc. 1955, vol. 81, no. 348, pp. 280-4.
27. SCHOELLER, H. ‘Condensations occultes, en particulier dans lea affleurements de terrains calcaires ou greseux de l’Afrique du Nord’, Colloques internationaux du Centre national de la recherche scientijque. Algiers, March 1951 ; Pans, 1953, no. 35, pp. 353-63.
28. SILINE-BEKTCHOURINE, A. I.; PLOTNIKOV, N. A. ‘Certaines lois de formation des eaux souterraines dans les zones arides de la terre’, Congrbs ge’ologique international de Mexico,
29. -; -. Quelques rbgles de la formation des eaux souterraines dans les re’gions arides du globe. Moscow, Acadbmie des sciences de I’U.R.S.S., Universit6 d’ztat de MOSCOU, Institut de recherches g6ologiques, 1958, 23 p. (Communication privbe.)
30. TIXERONT, J. ‘Les ressources en eau dans les regions arides’, Ann. Ponts Chauss. (France), 1956, t. 126, no, 3, pp. 965-97.
31. -; BERHLALOW, E. ‘Recherches sur le bilan d’eau en Tunisie’, Association internationale d’hydrologie scientijique, Assemble’e de Rome, 1954, t. 3, pp. 553-8. (Publication no. 38.)
des captages de Tunis et de Bizerte’, Association internationale d’hydrologie scientijique, Assemble’e de Rome, 1954, t. 3, pp. 553-8. (Publication no. 38.)
33. TROXELL, H. C. ‘The influence of ground water storage on the run-off in the San Bernardino and Eastern San Gabriel Mountains of northern California’, Trans. Amer. geophys. Un. 1953, vol. 34, no. 4, pp. 552-62.
34. TUINZARD, H. ‘Influence of the atmospheric pressure on the head of artesian water and phreatic water’, Association internationale d‘hydrologie scientijque, Assemblce de Rome, 1954, t. 2, pp. 32-7. (Publication no. 37.)
35. TURC, L. ‘Nouvelle formule pour le calcul du bilan de l’eau en fonction des valeurs moyennes annuelles des precipitations et de la temperature’, C.R. Acad. Sei. France, 1951, t. 233, no. 11, pp. 633-5.
36. --. E. ‘Relations entre les pr6cipitations, l’bvaporation et l’bcoulement’, Sols africains, 1953, vol. 3, no. 1, pp. 130-72.
37. -. ‘Le bilan de l’eau des sols, relations entre les precipitations et l’bcoulement’, Ann. agron., se‘rie A, 1954, vol. 5, no. 4, pp. 491-596.
117
1957. pp. 52-65.
1956, t. 20, pp. 56-7.
32. -; -. , CAINE, A. ; MAUDUECH, E. ‘Bilan d’eau des massifs calcaires en Tunisie. Cas

Arid zone hydrology
38. TURC, L. ‘Calcul du bilan de l’eau. evaluation en fonction des precipitations et des tern- peratures’, Association internationale d’hydrologie scientijique, Assemblie de Rome, 1954, E. 3, pp. 188-202. (Publication no. 38.)
39. VEIHMEYER, F. J. ‘Hydrology of range lands as affected by the presence of brush vegeta- tion’, Association internationale d’hydrologie scientihue, Assemblie de Bruxelles, 1951, t. 3, pp. 226-34. (Publication no. 34.)
40. SOCIETE HYDROTECHNIQUE DE FRANCE, ALGIERS. ‘Pluie, evaporation, filtration et Bconle- ment. Comptes rendus des troisibmcs journees de l’hydraulique’, Lo houille blanche, 1955.
FLUCTUATIONS OF GROUNDWATER LEVEL
41. ACHTEN, M. A. ‘Fluctuations des nappes a@kres’, Tech. de l‘eau, 1952, no. 6, pp. 31-9. 42. BOGARDI, J. ‘Der Eiduss des Niederschlags und der Temperatur auf die Veranderungen
des Grundwasserspiegels’, Acta tech. Acad. Sci. Hungar. 1952, vol. 5, no. 2, pp. 219-45. 43. COLLINS, B. W. ‘Fluctations of ground water levels in New Zealand and their significance’,
Association internationale d’hydrologie scienti$que, Assembl6e de Rome, 1954, t. 2, pp. 25-31. (Publication no. 37.)
44. CUSHMAN, R. L.; HALPENY, L. C. ‘Effect of western drought on the water resources of Safford Valley, Arizona’, Trans. Amer. geophys. Un. 1955, vol. 36, no. 1, pp. 87-94.
45. DENNER, J. ‘La variation du niveau des eaux souterraines pour une longue serie d’annees, Gewiisserkunde Tagung in Freiburg i. B.’, Gas und Wasserfach 1955, vol. 96, no. 18, pp. 611-13.
46. -. ‘86 jahrige Grundwasserganglinie von Berlin (Ein Ergebnis des dtesten existier- d e n Grundwasserdienstes’, 2. dtsch. geol. Ges. 1954, vol. 106, pp. 70-4.
47. DOLL& M. ‘Oscillations de la surface pidzomktrique du rdseau aquifbre du Turonien sup& rieur’, Association internationale d’hydrologie scientijique, Assernblh de Bruxelles, 1951, t. 3, pp. 136-42. (Publication no. 33.)
48. -. ‘Oscillations de la surface piezometrique du reseau aquifbre du Turonien superieur’, Tech. de l’eau 1952, no. 68, pp. 7-12.
49. FERRIS, J. G. ‘Cyclic fluctuations of water level as a basis for determining aquifer trans- missibility’, Association internationale d’hydrologie scientifzque, Assemblie de Bruxelles, 1951, t. 2, p. 213. (Publication no. 33.)
50. GRUNDY, F. ‘The ground water depletion curve, its construction uses’, Association inter- nationale d’hydrologie scientijique, Assemblie de Bruxelles, 1951, t. 2, p. 213. (Publication no. 35.)
51. MUGGE, R. ‘Aufzeichnung von Luftdruck und Erbebenwellen mit Hilfe von Brunnen- spiegeln’, Association internationale d’hydrologie scientijique, AssemblD de Rome, 1954, t. 2, pp. 49-52. (Publication no. 37.)
52. NEMETH, E. ‘Recherche graphique sur la correlation entre le fluctuation de la nappe phrda- tique et celle de la tempgrature’, Association internationale d‘hydrologie scientijique, Assemblie de Rome, 1954, t. 2, pp. 598-601. (Publication no. 37.)
53. PAAVEL, V. ‘Die Veriinderlichkeit der Niederschlagshohen und die Bemessung der Grund- wasser-fassungsanlagen’, Gas und Wasserfach 1955, vol. 96, no. 18, pp. 599-601.
54. RAFFO, J. M. ‘Variaciones de la napa freatica en relacion con la precipitacion, la presion atmosfkrica y la temperatma’, Association internationale d’hydrologie sciedfique, Assemblie de Rome, 1954, t. 2, pp. 99-112. (Publication no. 37.)
55. THOMAS, H. E. ‘Fluctuations of ground water levels’, Association internationale d’hydro- logie scientijique, Assemblie de Bruxelles, 1951, t. 2, pp. 143-6. (Publication no. 33.)
56. TISON, G. ‘Nouvelles recherches sur les fluctuations des nappes aquifbres’, Association internationale d’hydrologie scientijique, Assenablb de Rome, 1954, t. 2, pp. 38-48. (Publication no. 37.)
57. -. ‘Fluctuations des nappes aquiferes de types divers et particurerement des nappes d’alluvions’, Association internationale d’hydrologie xientihue, Symposia DWCY, 1956, t. 2, pp. 210-21. (Publication no. 41.)
58. TISON, L. J. ‘Au sujet des fluctuations des nappes aquifbres &endues’, Association inter- nationale d’hydrologie scientijique, Assemblie de Bruxelles, 1951, t. 2, pp. 195-201. (Publica- tion no. 33.)
59. -. ‘Une etude analytique des fluctuations des nappes aquifbres est-elle possible?’, Ann. Association Inghieurs &ole spiciale de Gand, 1952, no. 3, pp. 89-99.

Bibliography
60. WAITE, H. A.; THOMAS, H. E. ‘Effect of current drought upon water supplies in Cedar Valley, Utah‘, Trans. Amer. geophys. Un. 1955, vol. 36, no. 5, pp. 805-12.
61. WERNER, P. W. ; SANDGUIST, K. J. ‘On the ground water recession curve for large water- sheds’, Association internationale d’hydrologie scientifique, Assemble‘e de Brurelles, 1951, t. 2, pp. 202-12. (Publication no. 33.)
PROSPECTING FOR AND EXPLOITATION OF AQUIFERS IN ARID REGIONS
62. CEEBOTAREV, I. I. ‘Yield capacity of the aquifer’, Wat. & Wat. Engng. 1954, pp. 355-7. 63. CLAIR, A. ‘Etude hydrologique du chott Chergui’, Terres et eau%, supplement scientifique,
1956, no. 7, pp. 3-34. 64. HOW, R. H. L. ; WILKE, H. R. ; BLOODGOOD, D. E. ‘Application of air photo interpretation
in the location of ground water’, J. Amer. Wat. Wks. Ass. 1956, vol. 48, no. 11, pp. 138-9. 65. LOEHNBERG, A. ‘Water supply and drainage in semi-arid countries’, Trans. Amer. geophys.
Un. 1957, vol. 38, no. 4, pp. 501-10. 66. LOWY, H. ‘Geophysical prospection of underground water in the desert by means of elec-
tromagnetic interference fringes’, Proc. Instn. Radio Engrs. 1956, vol. 44, no. 8, p. 1062. 67. SCHOELLER, H. ‘Zone et rayon d’appel, debits specifiques des forages, des puits. Calcul
des constantes des couches aquifbres et de la longueur du hont d’empnmt’, IUGG Newsletter, no. 13, London, International Union of Geodesy and Geophysics, 1956, pp. 143-160.
68. -. ‘Methode de determination du rayon d’appel des forages et du coe5cient de Darcy. Application 5 l’etude de la nappe des sables paleocbnes de l’Aquitaine’, Association inter- naionale d’hydrologie scientijique, SymposiaDarcy, 1956, t. 2, pp. 67-75. (Publication no. 41.)
PERMEABILITY AND STEADY YIELD OF WELLS AND BOREHOLES
69. BINDEMAN, N. N. [Mithodes de determination de la conductibilite des roches par pompage
70. -. [MBthodes graphiques de determination du debit des puits], Gostroizdat, 1951. 71. BORELI, M. ‘Free surface flow toward partially penetrating wells’, Trans. Amer. geophys.
Un. 1955, vol. 36, no. 4, pp. 664-72. 72. HANSEN, V. E. ‘Unconfined ground water flow to multiple wells’, Proc. Amer. Soc. civ.
Engrs. vol. 78, no. 142, 18 pp. 73. HANTUSH, M. S. ; JACOB, C. E. “Plane potential flow of ground water with linear leakage’,
Trans. Amer. geophys. Un. 1954, vol. 35, no. 6, pp. 917-36. 74. - ; -. ‘Steady three dimensional flow to a well, in a two layered aquifer’, Trans. Amer.
geophys. Un. 1955, vol. 36, no. 2, pp. 286-92. 75. INESON, J. ‘Darcy’s law and the evaluation of permeability’, Association internationale
d’hydrologie scientifique, Symposia Darcy, 1956, t. 2, pp. 165-72. (Publication no. 41.) 76. KREPS, H. ‘Ein neues Verfahren eur Ermittlung der Grundwassergeschwindigkeit aus
einem Pumpenversuch’, Die Wasserwirtschaf, 1954, t. 44, no. 9, pp. 228-32. 77. LELLI, M. ‘Sulla relaeione fra la reciproca influenza di due pozei freatici e la potenea deUa
falda d’acqua sotteranea attraversata’. G. Gen. civ. 1950, t. 88, no. 7-8, pp. 423-6. 78. NAHRGANG, G. Zur Theorie des volkomrnenen und unvolkommenen Brunnens. Berlin, Gattin-
gen, Heidelberg ; Springer, 1954, $3 pp. 79. -. ‘L’hypothhse de Dupuit-Thiem pour le calcul d’un puits et l’ecoulement reel au
voisinage d’un puits vertical 5 surface libre’, Association internetionale d’hydrologie scien- tifiqne, Symposia Darcy, 1956, t. 2, pp. 173-83. (Publication no. 41.)
80. REMSON, I. ; LANG, S. M. ‘A pumping test method for the determination of specific yield’, Trans. Amer. geophys. Un. 1955, vol. 36, no. 2, pp. 321-55.
81. SCHMIDT, H. J. ‘Abweichungen eines Ergiebigkeitsgesetees bei einem Brunnen mit freiem Grundwasserspiegels’, Gas und Wasser-uch, 1949, t. 90, no. 23, p. 622.
82. SCHOELLER, H. ‘MBthode de determination du rayon d’appel des forages et du coe5cient de Darcy. Application 5 l’btude de l’epuisement de la nappe des sables palhcbnes d’Aqui- taine’, Association internationale d’hydrologie scientijique, Symposia Darcy, 1956, t. 2, pp. 67-75. (Publication no. 41.)
83. TCHARNYI, I. A. ‘Demonstration rigoureuse de la formule de Dupuit dans l’ecoulement sans pression’, Dokl. Akad. Nauk S.S.S.R. 1951, t. 79, no. 6.
119
et deversement], Ougletchizdat, 1951.

Arid zone hydrology
84. VIBERT, A. ‘Sur une demonstration rigoureuse des formules de Dupuit’, Gbnie ciw. 1954,
85. - . ‘Puits captants et galeries drainantes’, Gdnie civ. 1950, t. 70, no. 17, pp. 329-33. 86. WEN HSIUNG LI ; BOCK, P. ; BENTON, S. F. ‘A new formula for flow into partially pene-
no. 1, pp. 10-12.
trating wells in aquifers’, Trans. Amer. geophys. Un. vol. 35, no. 5, pp. 805-12.
PERMEABILITY AND YIELD OF WELLS AND BOREHOLES UNDER NON-STEADY CONDITIONS
87. BOULTON, N. S. ‘The drawdown of the water table under non-steady conditions near a pumped well in an unconfined formation’, Proc. Instn. civ. Engrs. part. 3, vol. 3, no. 2,
88. -. ‘Unsteady radial flow to a pumped well allowing for delayed yield from storage’, Association internationale d’hydrologie scientifique, Assemblde de Rome, 1954, t. 2, pp. 472-7. (Publication no. 37.)
89. COOPER, H. H. ; JACOB, C. E. ‘A generalized graphical method for evaluating formation constants and summarizing well field history’, Trans. Amer. geophys. Un. 1946, vol. 27,
90. GELIS, E. DE. El6ments d’hydraulique souterraine. Rabat, Ministere de la Production Indus- trielle et des Mines, Service Geologique, 1956, 84 pp. (Notes et mdmoires, no. 138).
91. GOLDSCHMIDT, M. J. ; JACOBS, M. ‘Underground water in the Haifa-Acco sand dunes and its replenishment’, Association internationale d’hydrologie scientifique, Symposia Darcy, 1956, t. 2, no. 41, pp. 39-56.
92. HANTUSH, M. S. ; JACOB, C. E, ‘Non-steady Green’s functions for an infinite strip of leaky aquifer’, Trans. Amer. geophys. Un. 1955, vol. 36, no. 1, pp. 101-12,
93. -; - . ‘Non-steady radial flow in inhite leaky aquifer’, Trans. Amer. geophys. Un. 1955, vol. 36, no. 1, pp. 95-100.
94. HANTUSH, M. S. ‘Analysis of data from pumping tests in leaky aquifers’, Trans. Amer. geophys. Un. 1956, vol. 37, no. 6, pp. 735-7.
95. INESON, J. ‘The drawdown of the water table under non-steady conditions near a pumped well in an unconhed formation’, Proc. Instn. civ. Engrs. 1955, part 3, vol. 4, no. 1, p. 218.
96. JACOB, C. E.; LOHMAN, S. W. ‘Non-steady flow to a well of constant drawdown in an extensive aquifer’, Trans. Amer. geophys. Un. 1952, vol. 33, no. 4, pp. 559-70.
97. NELSON, W. B.; THOMAS, H. E. ‘Pumping from wells on the floor of the Sevier Desert, Utah‘, Trans. Amer. gwphys. un, 1953, vol. 34, no. 1, pp. 74-85.
98. REMSON, I. ; VAN HYLCHAMA, T. E. A. ‘Nomographs for the rapid analysis of aquifer tests’, J. Amer. Wat. Wks. Ass. vol. 48, no. 5, pp. 511-16.
99. RORABAUGH, M. I. Graphical and theoretical analysis of step drawdown test of artesian well. 1953, special no. 362, 23 pp. of Proc. Amer. Soc. civ. Engrs.
100. SCHNEEBELI, G.; HUARD DE LA MARRE, P. ‘Nouvelles methodes de calcul pratique des Bcoulements de jiltration non permanents B surface libre’, La houille blanche, no. 3, 1953.
101. -. ‘Sur I’hydraulique des puits’, Association internationale d’hydrologie scientijique, Symposia Darcy, 1956, t. 2, pp. 10-27. (Publication no. 41.)
102. TEIEIS, C. V. ; BROWN, R. H. Use of slide rule in solvind ground water problems involving application of the non equilibrium formula. Reprint, n. d., 2 pp. (US. Geological Survey.)
103. UBELL, K. ‘Unsteady flow of ground water caused by well drawdown’, Association inter- nationale d‘hydrologie scientifique, Symposia Darcy, 1956, t. 2, pp. 129-32. (Publication no. 41.)
104. VEN TE CHOW. ‘On the determination of transmissibility and storage coefficients from pumping test data’, Trans. Amer. geophys. Un. 1952, vol. 33, pp. 397-405.
pp. 564-79.
pp. 526-34.
GEOCHEMISTRY OF GROUNDWATER
105. ARNDT, R. H. ‘Radioactivity of rivers and lakes in parts of Garland and Hot Springs Coun-
106. BEHNE, W ‘Untersuchungen zur Geochemie des Chlor und Brom’, Geochimica et Cosmo-
107. BOCHERT, H. ‘Zur Geochemie des Kohlenstoffs’, Goechimica et Cosmochimica Acta, 1951,
ties, Arkansas’, Econ. Geol. 1953, vol. 48, pp. 551-67.
chimica Acta, 1953, vol. 3, no. 4, pp. 186-214.
vol. 2, no. 1, pp. 62-75.

Bibliography
108. BUYDENS, R. ‘Le comportement des fluorures dans l’eau’, Bull. Acad. M6d. Belg. 1954, t. 19, no. 5, pp. 217-42.
109. -. ‘L’importance du fluor et de l’iode dans les eaux d’inatration’, Bulletin du Centre belge d’hde et de documentation des eaux, 1951, no. 13, pp. 145-50.
110. CARVALHO, A. H. DE. ‘Preuve analytique indirecte de l’existence de l’anion silicate dane les eaux naturelles’, XVe Congrbs de chimie analytipue, Lisbonne, 1956, pp. 234-5.
111. CAZAUX, P. ; CANELLAS, J. ; THOMASSIN, R. ‘Contribution B la connaissance de la constitu- tion chimique des eaux sulfides’, Ann. Inst. Hydrol. 1954, t. 25, pp. 47-74.
112. CHEBOTAREV, I. 1. ‘Reporting, interpretation and utilization of water analyses’, Vat. & Wat. Engrg. 1952, pp. 132-7.
113. -. ‘Les problbmes de salinite dans les regions arides’, Wat. & Vat. Engng. 1955, t. 59, no. 707, pp. 10-19.
114. -. ‘Metamorphism of natural waters in the crust of weathering’, Geochimica et Cosmo- chiniica Acta, 1955, vol. 8, no. 1-2, pp. 22-48; no. 3, pp. 137-70.
115. -. ‘Geochemical metabolism in natural waters’, Congrbs giologique international de Mexico, 1956, t. 20, p. 210.
116. -. ‘Geochemical types of waters in arid regions’, Congrks gioologipue international de Mexico, 1956, t. 20, pp. 48-9.
117. CHILINGAR, G. V. ‘Durov’s classification of natural waters and chemical composition of atmospheric precipitations in U.R.S.S. A review’, Trans. Amer. geophys. Un. 1956, vol. 37, no. 2, pp. 193-6.
118. -. ‘C1 and SO4 content of atmospheric precipitation in U.S.S.R.’, Trans. Amer. geoplys. Un. 1956, vol. 37, no. 4, pp. 410-12.
119. ---. ‘Soviet’s methods of reporting and displaying results of chemical analyses of natural waters and methods of recognising oil-field waters. A summary’, Trans. Amer. geophys. Un. 1957, vol. 38, no. 2, pp. 219-21.
120. DANSGAARD, W. ‘The 0 l s abundance in fresh water’, Geochimica et Cosmochimica Acto, 1954, vol. 6, pp. 241-60.
121. -. ‘The OI8 abundance in natural waters’, Nature, 1954, vol. 174, no. 4422, pp. 241-60. 122. DAUVILLIER, A. ‘Sur le cycle du sel’, C. R. Acad. Sei. France 1956, t. 242, no. 1,
123. DAVIS, R. ; SCHAEFFER, 0. A. ‘Chlorine-36 in nature’, Ann. N. Y. Acad. Sei. 1955, vol. 62, no. 5, 17 pp.
124. DOLE, M. ; LANE, G. A. ; RUDD, P. ; ZANHELIES, D. A. ‘Isotopic composition of atmospheric oxygen and nitrogen’, Gwchimica et Cosmochimica Acta, 1954, vol. 6, pp. 65-78.
125. DOWNES, R. G. ‘Cyclic salt as a dominant factor in the genesis of soils in South-Eastern Australia’, Austr. Agrie. Res. 1954, vol. 5, no. 3, pp. 448-64.
126. DUBILER, A. S. ‘Sur le problbme de la composition chimique des eaux souterraines de la rkgion precaspienne nord-occidentale’, Trud. Lab. gidrogeol. Probl. 1955, t. 12, pp. 120-38.
127. DUROV, S. A. ‘Sur la question de l’origine de la composition de l’eau des Karsts’, J. chim. Ukr. 1956, t. 22, no. 1, pp. 106-11.
128. DYE, J. F. ‘Calculation of effect of temperature on pH, free carbon dioxide and the three forms of alkalinity’, J. Amer. Vat. Tks. Ass. 1952, vol. 44, no. 4, pp. 356-72.
129. EPSTEIN, L. ; MAYEDA, T. ‘Variation of Ol8 content of waters from natural sources’, Gedi- mica et Cosmochimica Acta, 1953, vol. 2, no. 3, pp. 213-25.
130. FIGUEROL. ‘Variaciones quimicas de una pizarra situada en la pared de un horno’, 3’8 Reunion internacional sobre reactividad de 10s solidos, Madrid, Resumenes, 1956, p. 45.
131. FRIEDMAN, L. ; UREY, H. C. ‘Deuterium content of natural waters’, Bull. geol. Soc. Amer. 1952, vol. 63, no. 12, part 2, p. 1252.
132. - ; -. ‘Deuterium content of natural waters’, Ann. mineralogist 1953, vol. 38, no. 3-4, p. 338.
133. GEORGES, W. 0. ; HASTINGS, W. W. ‘Nitrate in the ground water of Texas’, Trans. Amer. geophys. Un. 1951, vol. 32, no. 3, pp. 450-6.
134. GIUGHIARELLI, M. G. ‘Ricerche sul tenore di F nelle acque di alimentasione della Puglia e Lucania’, Boll. Soc. ital. Biol. sper. 1952, t. 28, no. 6, pp. 1182-3.
135. GORBOV, A. F. ‘Sur la zonalit6 de la composition chimique des eaux dans la steppe de Kulundiusk’, Dokl. Akad. Nauk. S.S.S.R., 1951, vol. 81, no. 5, pp. 871-4.
136. GUYOT, J. ‘Etude geochimique des eaux dans la region de Biskra’, Terres et eaux, supple- ment scientifique, 1955, no. 6, pp. 3-15.
121
pp. 47-50.

Arid zone hydrology
137.
138.
139.
140.
141.
142.
143.
144.
145.
146.
147.
148.
149.
150.
151.
152.
153.
154.
155.
156.
157.
158.
159.
H ~ A , T. ‘Relation entre la nature chimique des eaux douces et la nature geologique du milieu’, J. chem. Soc. Japan, Pure chem. Sect. 1953, vol. 74, no. 5, pp. 365-7; no. 6, pp. 450-2 ; no. 7, pp. 522-5. HASTINGS, W. W. ‘Report of committee on the chemistry of natural waters, 1951-1952’, Trans. Amer. geophys. Un. 1951, vol. 32, no. 5, p. 769. ‘Report of research committee on chemistry of natural waters 1951-1952’, Trans. Amer. geophys. Un. 1953, vol. 34, no. 3, pp. 484-7. HERMAN, A. ‘La configuration chimique des eaux souterraines’, Bulletin du Ce d r e belge d’6tudes et de documentation des eaux, 1955, no. 27, pp. 37-45. IWASAKI, I. ; TAREETANI, I. ; KATSURA, T. ; TACHIBANA, K. ‘Recherches gdochimiques sur les ddpBts des sources chaudes 130, dans la source chaude de Shiroike’, J. chem. Soc. Japan, Pure chem. Sect. 1953, vol. 74, no. 10, p. 857-9. KELLER, G. ‘Grundwasserversalzungen im saxonischeng Faltungsfeld Niedersachsens’, Geotektonisches Symposium zu Ehren won Hans Stille, Stuttgart, 1956. KOBAYASHI, S. ‘Distribution du fluor dans les eaux terrestres, 60US divers Btats’, Bull. chem. Soc. Japan, 1954, t. 27, no. 6, pp. 314-7. KORCENSHTEJN, V. N. ‘Traits hydrochimiques caractdristiques de l’horizon aquifkre Khadoumsky de l’Bl6vation de Stavropol’, Dokl. Akad. Nauk. S.S.S.R., 1955, vol. 104, no. 5, pp. 771-4. KORITNIG, S. ‘Ein Beitrag zur Geochemie des Fluor’, Geochimica e; Cosmochimua Acta, 1951, vol. 1, pp. 80-116. LA MOREAUX, P. E. ‘Fluoride in gound water of Alabama’, Trans. Amer. Inst. min., (metall.) Engrs. 1951, vol. 187, pp. 886-8. LOVE, S. K. ‘Radio-activit6 naturelle de l’eau’, J. indust. Engng. Chem. 1951, vol. 43, no. 7, pp. 1541-4. MARGAT, J. ; MARTIN, R. ‘Essai sur 1’6vaporation et les variations de concentrations des eaux souterraines dans une nappe phreatique d’un pays desertique’, Association intern- tionale d’hydrologie scientijique, Assemblie de Rome, 1954, t. 2, pp. 72-84. (Publication no. 37.) MUCHEYBLE, G. ‘Observations sur les eaux sonterraines radio-actives du Nord de la France et la radio-activite des roches encaissantes’, Ann. Imt. Hydrol. 1952, t. 23. no. 72, pp. 29-64. NORING, P. ‘Chemische und physikalische Erscheinungen beim einatrierten Grund- wasser’, Association internationale d’hydrologie scientijiqus, AssembUe de Rome, 1954, t. 2, pp. 113-17. (Publication no. 37.) OAIRA, S. ‘Distribution of heavy water in natural waters’, J. Earth Sei., Nagoya Uniu., Japan 1953, vol. 1, pp. 42-61. OVCHINNIKOV, A. M. ‘Sur les principes de la classification hydrogdochimique des eaux souterraines’, Bull. Soc. Nat. Moscou, Section ghlogie, 1953, t. 28, no. 2, pp. 86-7. RICHTER, W. ; FLATHE, H. ‘Die Versalzung von Kiistennahen Grundwassern dargestelt an einem Teil der deutschen Nordseekiiste’, Association internationale d’hydrologie scientifique, Assembke de Rome, 1954, t. 2, pp. 118-30. (Publication no. 37.) RIDDER, M. DE. ‘Fluor in drinkwater’, Bulletin du Centre belge d’hdes et de documentation des eaux, 1950, no. 7, pp. 421-3. RONA, E. ; UREY, W. D. ‘Radioactivity of ocean sediments. Radium and uranium content of ocean and river waters’, Amer. J. Sei. 1952, vol. 250, no. 4, pp. 241-62. SAITO, N. ‘On the existence of radiocolloids in natural waters’, Association internationale d’hydrologie scisntifique, Assembl6e de Bruxelles, 1951, t. 3, pp. 512-16. (Publication no. 34.) SAJDAKOVSKIJ, S. Z. ‘Sur la formation des eaux hydrosulfiirees dans l’extrBmit6 SW de la plate-forme russe’, Dokl. Akad. Nauk. S.S.S.R., 1955, vol. 103, no. 2, pp. 303-4. -- ; TKACHUK, V. G. ; CVIK, S. M. ‘Sur le probkme des conditions de formation des eaux souterraines du type chloruro-alcalino calcique’, Dokl. Akad. Nauk S.S.S.R., 1952, vol. 80, no. 5, pp. 791-2. SARUHASHI, K. ‘On the equilibrium concentration ratio of carbonic acid substances dissolved in natural waters. A study of the metabolism in natural waters’, Papers Meteurol. Geophys. _ _ Japan 1955, vol. 6, no. 1, pp. 36-55.
160. ‘fitude sur les transformations dans les eaux naturelles. Sur le rapport de la concentration 2 l’dquilibre des substances dBriv6es de l’acide carbonique dissoutes dans les e a u natu- relles’, J. Chem. Soc. Japan, Pure chem. Sect. 1955, t. 76, no. 111, pp. 1294-308.
161. SAVCHENKO, P. S. ‘Teneur en iode des ea- souterraines dans la region de la rivikre Severnyj Donetz’, Dokl. Akad. Nauk S.S.S.R., 1954, vol. 99, no. 2.
122
Bibliography
162. %NE~!DER, H. ‘Chemie des Gmdwassers’, in Die Wasserschiessung, Deutscher Verein won Gm und Wassmfachmannern. Essen, 1952, pp. 53-71.
163. SCHOELLER, H. ‘Relation entre la concentration en chlore des eaux souterraines et les Bchanges de bases avec les terrains qui les renferment’, C. R. Acad. Sci., France, 1951, t. 132,
164. --. ‘Condensations ocealtes, en particulier dans les affleurements de terrains calcaires ou greseux de l’Afrique du Nord’, Cdloque international no 35 d Alger du Centre national de la recherche scienti$que, 1951, pp. 353-63.
165. -. ‘Contribution 5 l’etude du fluor des eaux souterraines’, Ann. Inst. Hydrol. 1952, t. 23, no. 72, pp. 2-19.
166. -. ‘Essai sur la qualitb chimique de l’eau destinee B l’alimentation de l’homme d a m les pays arides’, Terms et eauz, Algiers, Suppkment scientifique, 1955, no. 24, pp. 4(-11.
167. -. ‘La solubilits du fer dans les eaux souterraines’, Ann. Inst. Hydrol. 1955, t. 26, no. 78,
168. -. Gochirnie des eaux souterrainss; application aux eaux du gisement de pitrole. Paris, Technip, 1956, 213 pp. : and Rev. Inst. frang. Pitrole 1955, vol. 11, pp. 181-213 ; 219-46 ;
169. SCHWILLE, E. ‘Chlorure et nitrate dans les eaux souterraines de la Hesse rhenane et de la Rhhnie’, Gas und Wasserfach, 1953, t. 94, no. 14, pp. 410-14.
170. -. ‘Ionenumtausch und der Chemismus von Grund- und Mineralwsssern’. 2. der geolo- gishcen Gesellschaft 1954, t. 106, pp. 16-22.
171. S~INE-BEETCHOURINE, A. I. Hydrogiologie spiciale. 1 vol., Moscow, Gossendarctvennoe ir- datelctvo geologitcheshoi literatouri, 1951, 394 pp.
172. -. ‘Zonalite hydrochimique des eaux souterraines du synclinal attenant B la Caspienne’, Izuest. Akad Nauk S.S.S.R.; ser. Geol., 1952, no. 4, pp.. 27-40.
173. -. ‘Sur les questions de la formation de la composition chimipe des eaux souterraines dans les regions arides’, M. G. Ou outhchenie zapouski, bip, 176, geologuia, Izv, 1956, pp. 175- 93.
174. -. ‘Types of hydrochemical maps in hydrogeology’? Abstracts of she reports at the XIrh generd msernbly of the International Union of Geodesy and Geophysics. The interna- tional Association of Scient+ Hydrology. Moscow, Akad. Nauk S.S.S.R., 1957, pp. 69-7Q.
175. SPIEO, N. S. ; GRAMBERG, I. S. ; VOOK, C. I. ‘Sur la classification generique des eaux natu- relles’, Dokl. Akad. Nauk, S.S.S.R., 1953, t. 93, no. 3, pp. 531-4.
176. STANEO, M. ‘Radioactivity of waters issuing from sedimentary rocks‘, Econ. Geol. 1952, vol. 47, no. 5, pp. 543-7.
177. STRAUB, J. ; KOVACS, E. ‘Antagonisme fluor-iode’, NipegRFzsigiigy, 1956, t. 37, pp. 162-4. 178. SUGAWAIU, I(. ; TOCHIEUVO, L. ‘The determination of argon in natural waters, with special
reference to the metabolism of oxygen and nitrogen’, J. Earth Sci. Nagoya Uniu., Japan
179. TAGEEVA, N. W. ‘Sur certains types gbochimiquee d’eaux souterraines’, h e s t . Akad. Nauk, S.S.S.R., Sr. Geol., 1954, no. 1, pp. 69-76.
180. -; TCEHOMIFIRBVA, M. M. ‘Sur la geochimie des eaux naturelles du type chlorures de M g et de Na’, Dokl. Akad. Nauk S.S.S.R., 1954, t. 96, no. 1, pp. 121-4.
181. TAKAHISA, H.; FUMIO, S. ‘Ihude statistique sur les caracteres geochimiques des eaux douces au Japon’, Geochimico et Cosmochimica Acta, 1956, vol. 9, no. 5, pp. 249-55.
182. TAMRAZJAN, G. P. ‘Sur les lois de variation de la composition chimique des eaux de la s6rie Mafkop, dans les limites du Caucase’, Dokl. Akad. Nauk S.S.S.R., 1954, t. 96, no. 6,
183. VINE. ‘La salinit& des eaux souterraines dans le Schleswig-Holstein. Origine, btendue, signification et suppression’, Gewasserhmnde-Tagung in Freiburg im B., Gas und Wasser- fach, 1955, t. 96, no. 18, pp. 611-13.
184. VOLHER, A. ; MONTSMA, E. 0. ‘D6termination des salinites des eaux 2 grandes profondeurs dans le sous-sol du Zuiderree par prospection ghphysique’, Associafion infernationale d’hydrologie scientifique, Assemblie de Rome, 1954, t. 2, pp. 151-61. (Publication no. 37.)
185. VORONHOV, P. P.; SOHOLOVA, 0. K. ‘Influence du lieu de prelbvement des eaux sur la quantite d’ions en solution’, Dokl. Akad. Nauk S.S.S.R., 1951, t. 81, no. 4, pp. 561-4.
186. VQRONKOV, P. P.; SOEOLOVA, 0. K. ‘PartidritB de formation de la composition chi- mique des eaux superficielles dans les diff6rentes aones giographiques’, Dokl. Akad. Nauk S.S.S.R., 1954, t. 94, no. 2, pp. 293-6.
123
pp. 1432-4.
pp. 1-37.
567-52; 671-71!3; 823-74.
1955, t. 3, pp. 77-84.
pp. 1229-32.
Arid zone hydrology
187. WAGNER, R. ‘Zum Chemismus tiefer Grundwiisser in einem Teil Nord-Westdeutschlands’, Association internationale d’hydrologie scientifique, Assemblie de Rome, 1954, t. 2, pp. 131-7. (Publication no. 37.)
188. WEDEMEYER, F. W. ‘L‘eau de source contenaut des nitrates provoque la mkth6moglo- binemiose chez les jeunes enfants’, Archiv fur Kinderheilkunde, 1956, t. 152, pp. 267-75.
189. ZELLER, E. J. ; WMY, J. L. ‘Factors influencing precipitation of calcium carbonate’, Bull. Amer. Ass. Petrol. Geol. 1956, vol. 40, no. 1, pp. 140-52.
RADIOACTIVE TRACERS
190. AEBERSOLD, P. C. ‘Le rBle des isotopes en technologie et dans l’industrie’, Utilisation de Z’inergie atomique b des fins pacijiques. Nations Unies, 1956, vol. 14, pp. 3-15.
191. ALBERTS, A. A. ; COCANOVER, R. D. ; BUNDRANT, C. 0. ‘Application of radio-isotopes to subsurface surveys’, AIME, Petroleum Branch, Fall Meeting, San Antonio, Oct. 1954.
192. ALLEN, F. H. ; GRINDLEY, J. ‘Radioactive tracers in the Thames Estuary’, The Dock and Harbour Authority, Jan. 1957, vol. 37, no. 435, pp. 302-6.
193. ARCHIBALD, R. S. ‘Radiotracers in flow tests’, J. Boston Soc. civ. Engrs. 1950, vol. 37, no. 1, pp. 49-116.
194. BAVEL, C. H. M. VAN; HOOD, E. E. ; UNDERWOOD, N. ‘Vertical resolution in the neutron method for measuring soil moisture’, Trans. Amer. geophys. Un. 1954, vol. 35, no. 4,
195. BEATTY, K. 0. ; FERREL, J. K. ; RICHARDSON. ‘Les radio-isotopes dans l’etude de la dyna- mique des hides’, Utilisation de l’inergie atomique b des fins pacijiques, Nations Unies,
196. BEGGEMAN, F. ; LIBBY, W. F. ‘Continental water balance, groundwater inventory and storage times, surface ocean mixing rates and world-wide water circulation patterns from cosmic-ray and bomb tritium’, Geochimica et Cosmochimica Acta, 1957, vol. 12, pp. 277-96.
197. BROWN, R. E.; PARKER, H. M.; SMITH, J. M. ‘Decharge terrestre des d6chets liquides’, Utilisation de l’inergie atomique b des fins pacifiques, Nations Unies, 1956, vol. 9, pp. 763-9.
198. EDWARDS, J. M. ; HOLTER, L. E. ‘Radio-isotopes for water-input profiles, in water flood operations’, Oil Gas J. 29 Sept. 1954, pp. 53-60.
199. FLAGC, A. H. ; MYERS, J. P. ; CAMPBELL, J. L. P. ; TERRY, J. M. ; MARDOCK, E. S. ‘Radio- active tracers in oil production problems’, J. Petrol. Tech. ; AIME, Petroleum Transactions,
200. Fox, C. S. ‘L’emploi des isotopes radio-actifs pour contr6ler le mouvement des eaux souter-
201. -, ‘Radioactive isotopes trace underground waters’, Public Works Jan. 1952, pp. 57-8. 202. GUERON, J. ‘Emploi des radio-dlkments en hydrologie’, ler CongrBs international de spilio-
logie, 1953, vol. 2, pp. 301-6. 203. HESS, V. F. ‘On the use of a radioactive tracer method in measurements of water’, Trans.
Amer. geophys. Un. 1943, vol. 2, pp. 587-94. 204. HOURS, R. ‘Les traceurs radio-actifs en hydrologie’, Mimoires et travaux de la Sociiti
hydrotechnique de France, 1955, vol. 1, pp. 14-24. 205. JOSENDAL, V. A. ; SANDFORD, B. B. ; WILSON, J. W. ‘Improved multiphase flow studies
employing radioactive tracers’, J. petiol. Tech. 1952, vol. 4, pp. 65-76. 206. KAUFMAN, W. J.; ORLOB, G. T. ‘An evaluation of ground water tracers’, Trans. Amer.
geophys. Un. 1956, vol. 37, no. 3, pp. 297-306. 207. -; -. ‘Measuring ground water movement with radio-active and chemical tracers’,
J. Amer. Wac. ms. Ass. 1956, vol. 48, no. 5, pp. 559-72. 208. MONTENS, A. ‘Die Verwendung von radioaktiven Isotopen bei Stromungs- und Geschwin-
digkeits Messungen’, Gas und Wasserfach, 1952, vol. 93, no. 14, pp. 411-16. 209. ‘Radioactive isotopes in petroleum research’, Petroleum, 1952, vol. 15, pp. 61-5. 210. RAVIER ; HOURS, R. ; SCHNEEBELI, G. ‘Emploi de traceurs en hydrologie’, Association
211. RUSSEL, M. ‘Radioactive iodine used as a tracer’, World Oil, 1954, vol. 138, pp. 266-75. 212. SELIGMAN, H. ‘Progrks recents dans les utilisations industrielles des isotopes radio-actifs’,
Utilisation de l’inergie atomique b des fins pacifiques, Nations Unies, 1956, vol. 14, pp. 16-18. 2 13. SIMANE, C. ‘L’emploi des radio-isotopes en Tchkcoslovaquie’, Utilisation de l’inergie atomique
d des fins pacifiques, Nations Unies, 1956, vol. 14, pp. 65-8.
124
pp. 595-600.
1956, vol. 15, pp. 230-5.
1955, vol. 204, pp. 1-6.
raineB’, Ingegneria, 1951, pp. 305-7.
frangaise pour Z‘6tude des eaux, 1955, no. 40, pp. 1-2.

Bibliography
214. SONS, E. ‘Die Messung von Fliessaeiten in Wasserlaufen mit Hilfe von radioaktiven Stoffen’, Die Wasserwirtschajt, 1952, vol. 42, no. 10, pp. 313-7.
215. STANLEY, D. R. ‘Sand filtration studied with radiotracers’, Amer. Soc. civ. Engrs. 1955, vol. 81, p. 592.
216. TRUESDALE, G. A. ‘Use of radioactive isotopes in tracing sewage flow’, Atomics and atomic technology, 1954, vol. 5, pp. 304-12.
217. URBAIN, P. ‘Sur l’etat actuel des recherches hydrologiques par la methode des traceurs radio-actifs’, Association internatwnale d’hydrologie scientijique, Assembl6e de Rome, 1954, t. 2, pp. 238-47. (Publication no. 37.)
218. -- , LAGRANGE, R. ; HOURS. R. ; GESLIN, M. ‘Sur I’emploi des traceurs radio-actifs sur le terrain en geologie et hydrogeologie’, Ann. Inst. Hydrol. 1954, vol. 25, no. 76, pp. 7-26.
219. U.S. NATIONAL BUREAU OF STANDARDS. Maximum permissible amounts of radio-isotopes in the human body, and maximum permissible concentrations in air and water. 1953. (Hand- book no. 52.)
220. VESSEY, E. DE; CZERNY, GYOZO. ‘A study of underground flow of radioactive isotopes and tracing ions’, Hidrologiai Kolony, 1957, vol. 37, pp. 44-56.
221. WATKINS, J. W. ; DUNNING, H. N. ‘Les isotopes radio-actifs dam la recherche applipuge B la production du petrole’, Utilisation de l’6nergie atomique B des fins paci,fiques, Nations Unies, 1956, vol. 15, pp. 37-44.
222. - ; MARDOCK, E. S. ‘Use of radioactive iodine as a tracer in water flooding operations’, J. Petrol. Tech., MIME, 1954, vol. 6, pp. 117-24.
125