sources of economic growth thorvaldur gylfason outline i.pictures of growth ii.determinants of...
Post on 19-Dec-2015
215 views
TRANSCRIPT
Sources of Sources of Economic Economic GrowthGrowth
Thorvaldur GylfasonThorvaldur Gylfason
OutlineI.I. Pictures of growthPictures of growthII.II. Determinants of growthDeterminants of growth
1.1. Saving and investmentSaving and investment2.2. EfficiencyEfficiency
a)a) LiberalizationLiberalizationb)b) StabilizationStabilizationc)c) PrivatizationPrivatizationd)d) EducationEducatione)e) DiversificationDiversificationf)f) DistributionDistribution
III.III. Empirical evidence of growthEmpirical evidence of growth

Economic growth: The short run vs. the long run
Time
Nati
on
al eco
nom
ic o
utp
ut
Actual output
Potential output
Business cyclesin the short run
Economic growthin the long run
Downswing
Upswing
Economic growth: The short run vs. the long run
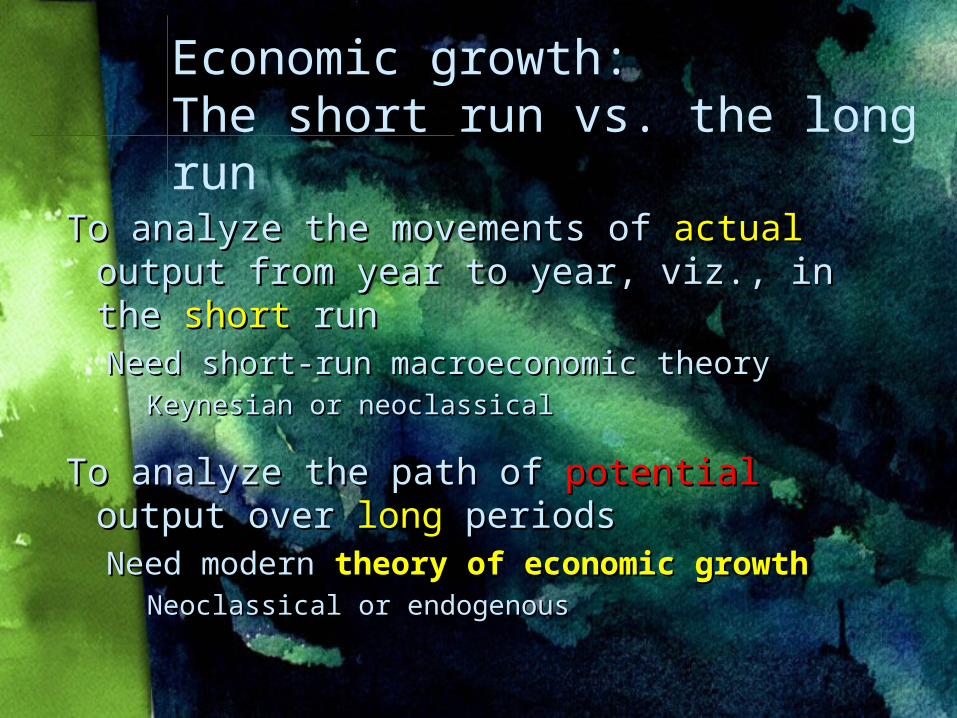
To analyze the movements of To analyze the movements of actualactual output from year to year, viz., in the output from year to year, viz., in the shortshort run runNeed short-run macroeconomic theoryNeed short-run macroeconomic theory
Keynesian or neoclassicalKeynesian or neoclassical
To analyze the path of To analyze the path of potentialpotential output output over over longlong periods periodsNeed modern Need modern theory of economic growththeory of economic growth
Neoclassical or endogenousNeoclassical or endogenous

Growing together, growing apart
TimeTime
Nati
on
al eco
nom
ic o
utp
ut
ou
tpu
t
Rapid growth
Slow growth
West-Germany : East-GermanyWest-Germany : East-GermanyAustria : Czech RepublicAustria : Czech RepublicFinland : EstoniaFinland : EstoniaTaiwan : ChinaTaiwan : ChinaSouth Korea : North KoreaSouth Korea : North Korea
Botswana : NigeriaBotswana : NigeriaKenya : TanzaniaKenya : TanzaniaThailand : BurmaThailand : BurmaTunisia : MoroccoTunisia : MoroccoSpain : ArgentinaSpain : ArgentinaMauritius : MadagascarMauritius : Madagascar
Economic system
Economic policy?
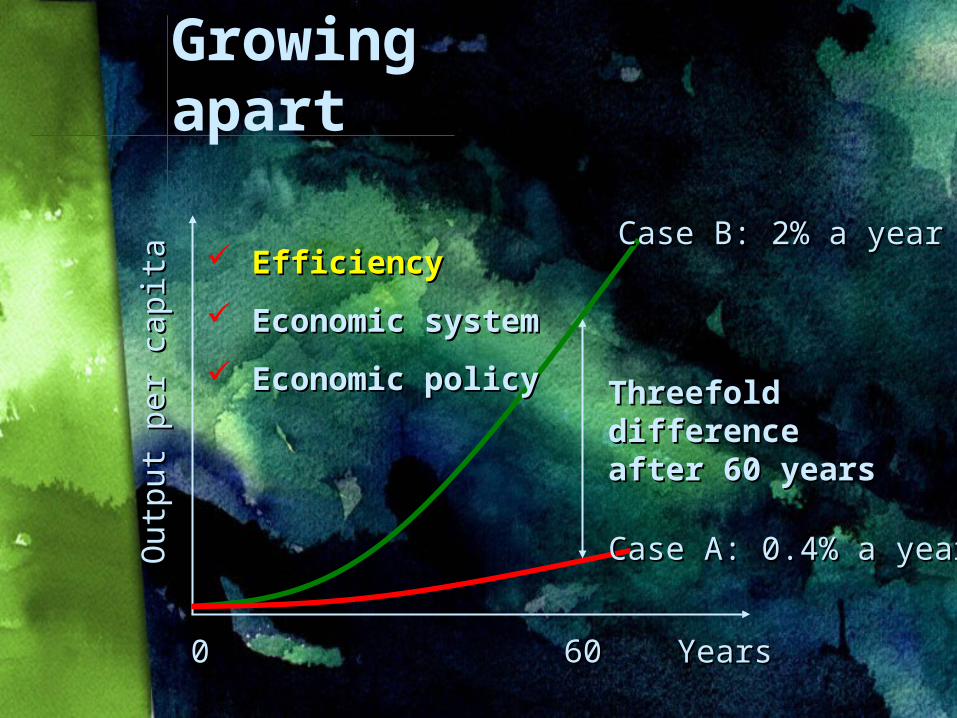
Growing apart
YearsYears
Outp
ut
per
cap
ita
Outp
ut
per
cap
ita
Case B: 2% a yearCase B: 2% a year
Case A: 0.4% a yearCase A: 0.4% a year
EfficiencyEfficiency
Economic systemEconomic system
Economic policyEconomic policy Threefold Threefold difference after difference after 60 years60 years
00 6060
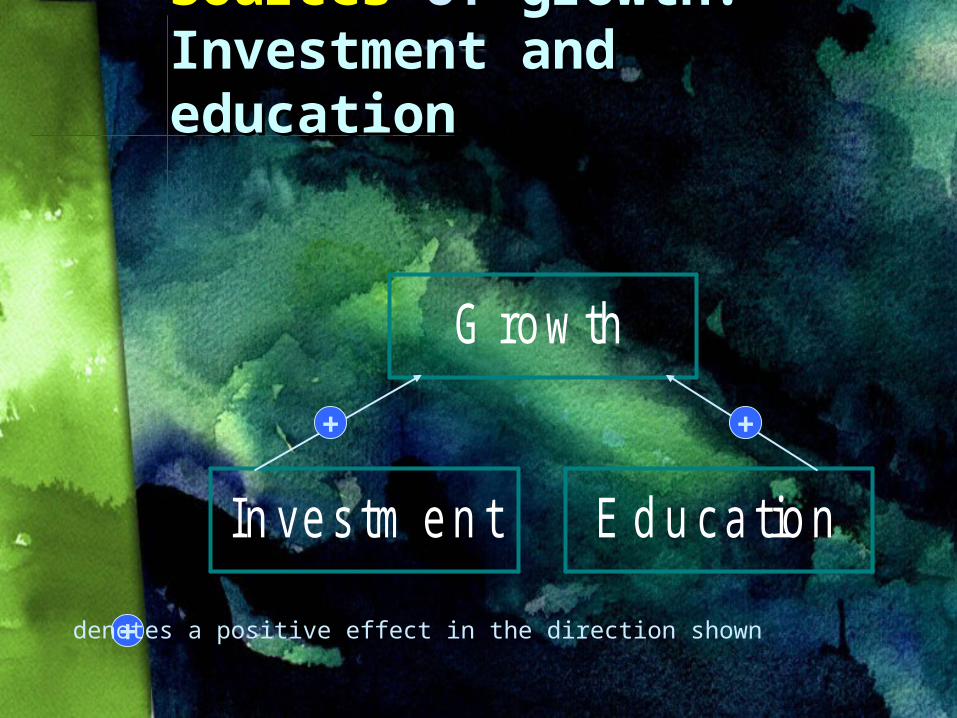
Sources Sources of of growth: growth: Investment and Investment and educationeducation
In ves tm en t E d u ca tion
G row th
+ +
+denotes a positive effect in the direction shown
In ves tm en t E d u ca tion
G row th
+ +
+denotes a positive effect in the direction shown
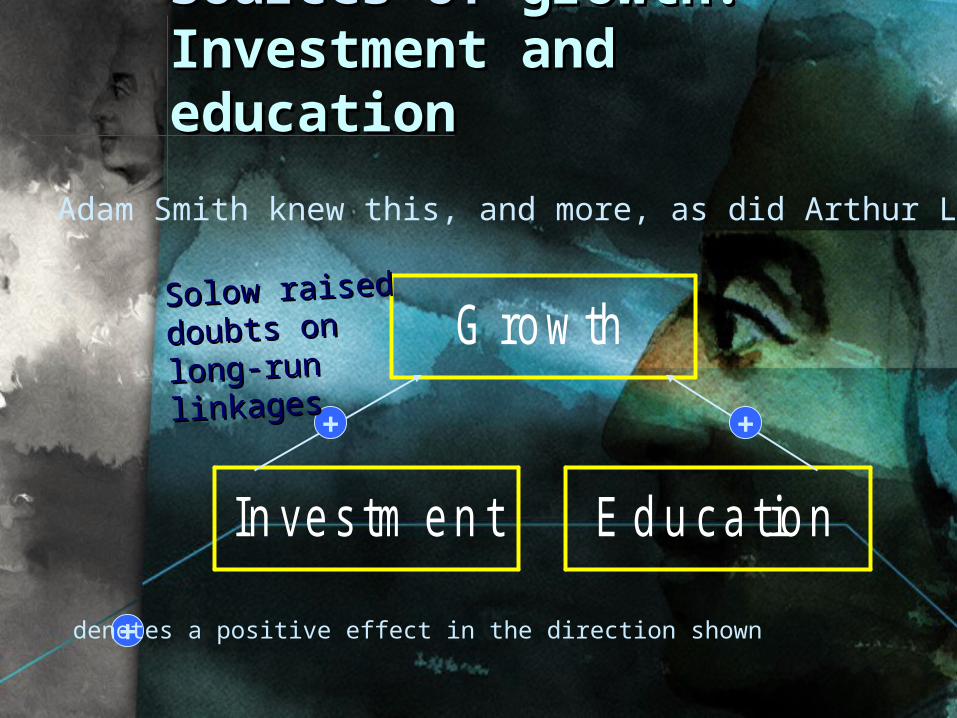
Adam Smith knew this, and more, as did Arthur Lewis
Sources of Sources of growth: growth: Investment and Investment and educationeducation
Solow raised Solow raised
doubts on doubts on
long-run long-run
linkageslinkages

More More sources sources of growthof growth
In ves tm en t x E d u ca tion
G row th+ +
+denotes a positive effect in the direction shown
+
Arthur Lewis: x is trade, stable politics, good weather
But Solow carried the day: long-run growth is exogenous!

More More sources sources of growthof growth
In ves tm en t O p en n ess E d u ca tion
G row th+ +
+denotes a positive effect in the direction shown
+
Suppose our x is openness to trade; then …

The Neoclassical Theory of Exogenous Economic Growth
Traces the rate of growth of output per capita to a single source:
Technological progressTechnological progress
Hence, economic growth in the long run is immune to economic policy, good or bad
“To change the rate of growth of real output per head you have to change the rate of technical progress.”
ROBERT M. SOLOW

The New Theory of Endogenous Economic Growth
Traces the rate of growth of output Traces the rate of growth of output per capita to two main sources:per capita to two main sources:
SavingSaving
EfficiencyEfficiency
“The proximate causes of economic growth are the effort to economize, the accumulation of knowledge, and the accumulation of capital.”
W. ARTHUR LEWIS

Botswana and Nigeria: GNP per capita 1962-2001Case 1
0
500
1000
1500
2000
2500
3000
3500
1960
1964
1968
1972
1976
1980
1984
1988
1992
1996
2000
Botswana
Nigeria
Current US$,Atlas method
Nedadi Usman: Nedadi Usman:
Oil has made us Oil has made us
lazylazy

Egypt, Morocco, and Tunisia:GNP per capita 1962-2001Case 2
0
500
1000
1500
2000
2500
1960
1964
1968
1972
1976
1980
1984
1988
1992
1996
2000
Tunisia
Egypt, Arab Rep.
Morocco
Current US$,Atlas method
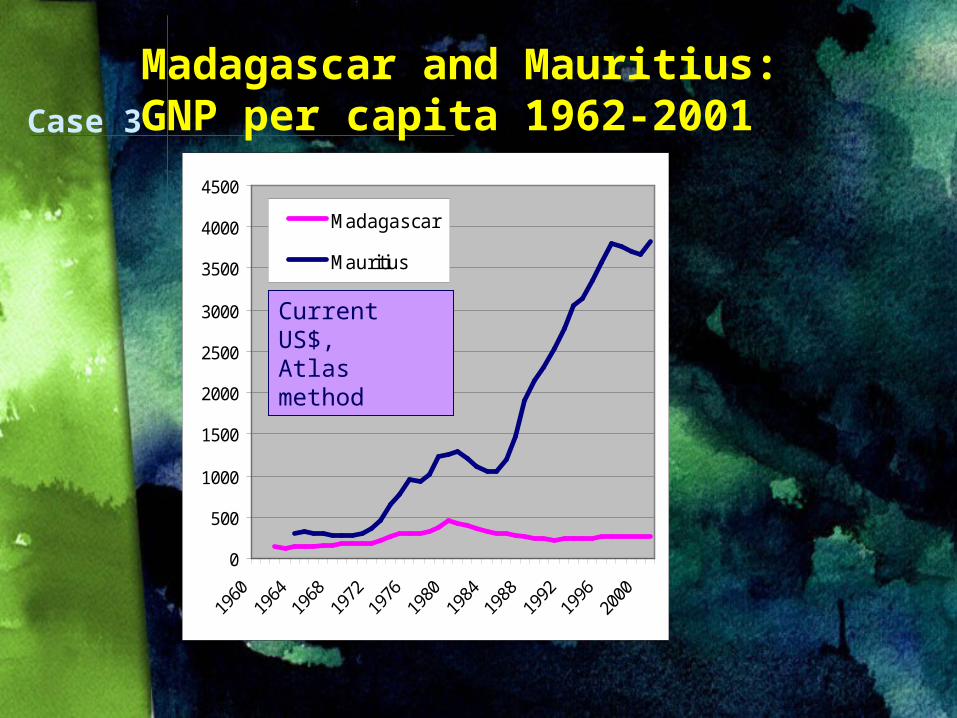
Madagascar and Mauritius:GNP per capita 1962-2001Case 3
0
500
1000
1500
2000
2500
3000
3500
4000
4500
Madagascar
Mauritius
Current US$,Atlas method

Country Country AA
Country BCountry B
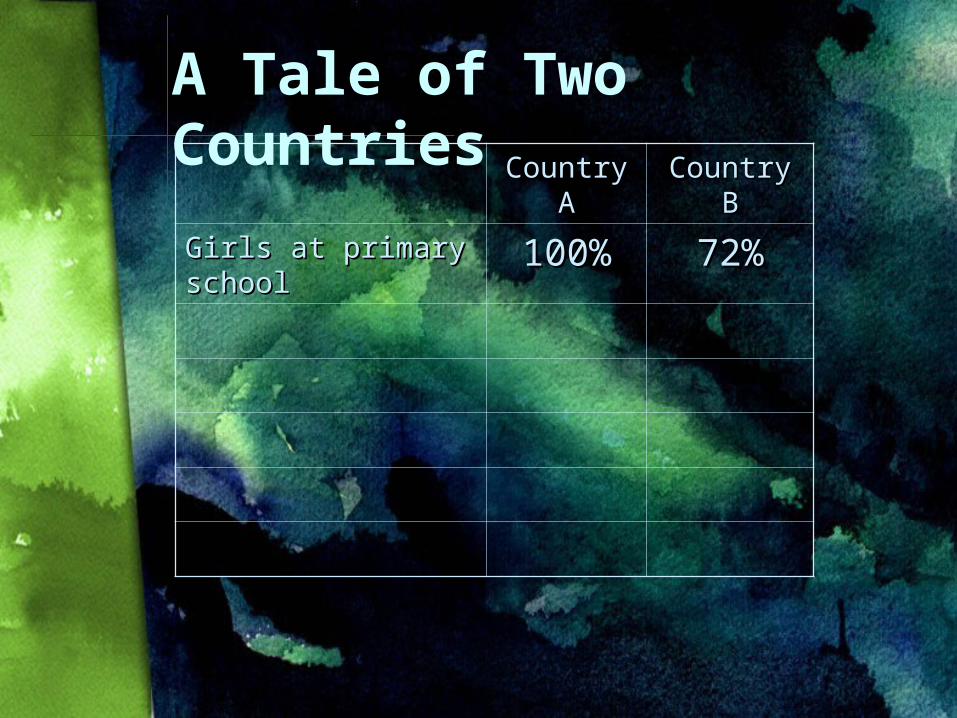
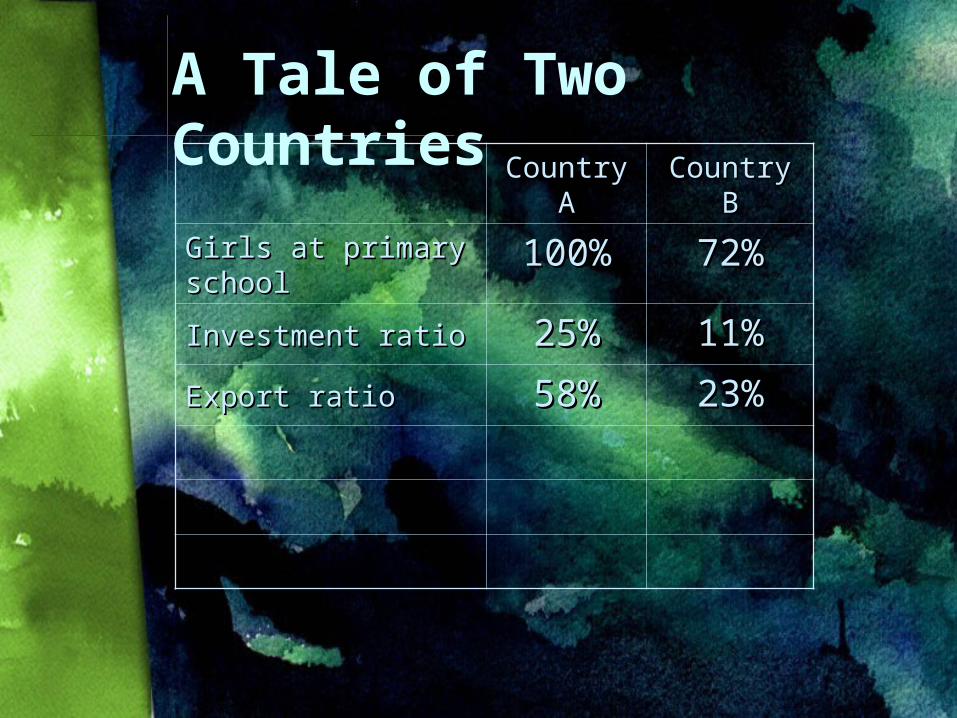
A Tale of Two Countries
Country Country AA
Country BCountry B
Girls at primary Girls at primary schoolschool
100%100% 72%72%
A Tale of Two Countries

Country Country AA
Country BCountry B
Girls at primary Girls at primary schoolschool
100%100% 72%72%
Investment ratioInvestment ratio 25%25% 11%11%
A Tale of Two Countries
Country Country AA
Country BCountry B
Girls at primary Girls at primary schoolschool
100%100% 72%72%
Investment ratioInvestment ratio 25%25% 11%11%Export ratioExport ratio 58%58% 23%23%
A Tale of Two Countries

Country Country AA
Country BCountry B
Girls at primary Girls at primary schoolschool
100%100% 72%72%
Investment ratioInvestment ratio 25%25% 11%11%Export ratioExport ratio 58%58% 23%23%Primary export Primary export ratioratio
33%33% 80%80%
A Tale of Two Countries

Country Country AA
Country BCountry B
Girls at primary Girls at primary schoolschool
100%100% 72%72%
Investment ratioInvestment ratio 25%25% 11%11%Export ratioExport ratio 58%58% 23%23%Primary export Primary export ratioratio
33%33% 80%80%
InflationInflation 10%10% 18%18%
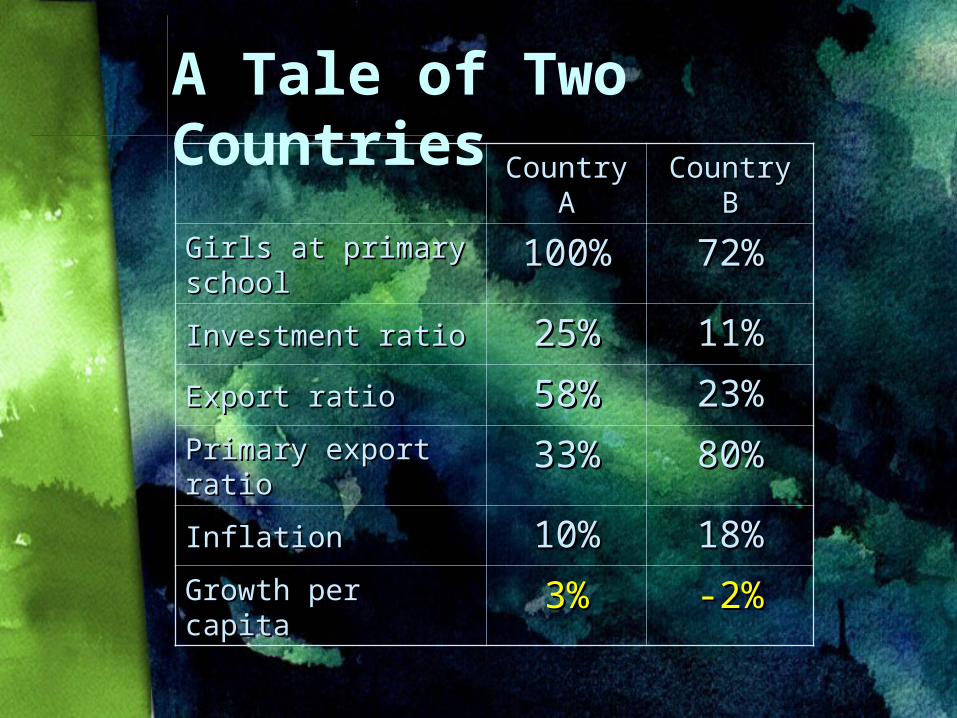
A Tale of Two Countries
Country Country AA
Country BCountry B
Girls at primary Girls at primary schoolschool
100%100% 72%72%
Investment ratioInvestment ratio 25%25% 11%11%Export ratioExport ratio 58%58% 23%23%Primary export Primary export ratioratio
33%33% 80%80%
InflationInflation 10%10% 18%18%Growth per capitaGrowth per capita 3%3% -2%-2%
A Tale of Two Countries
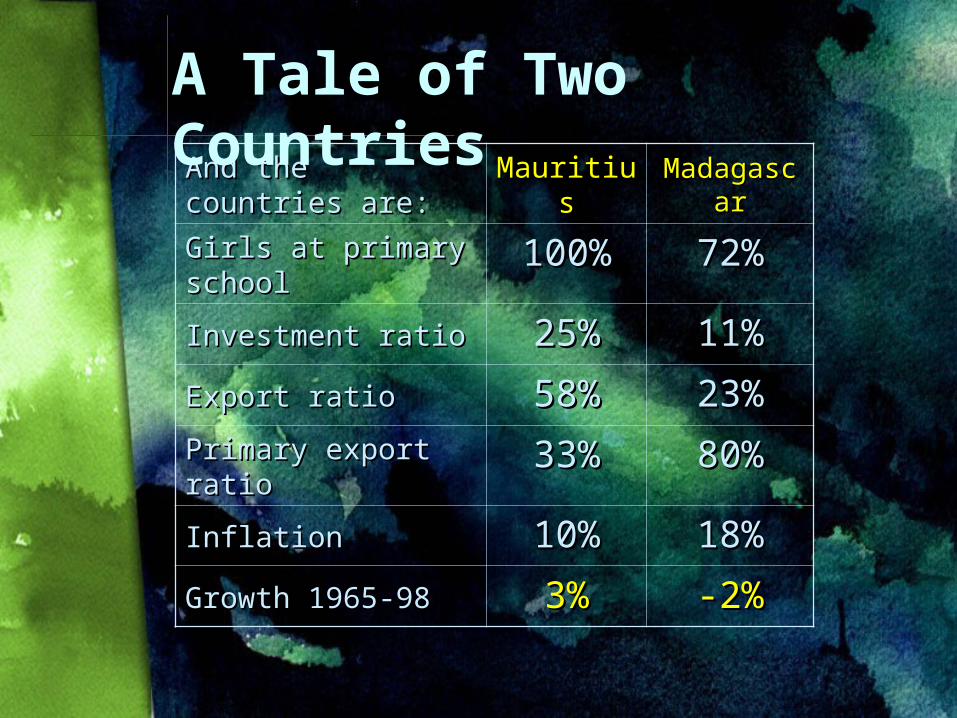
And the countries And the countries are:are: MauritiusMauritius MadagascMadagasc
arar
Girls at primary Girls at primary schoolschool
100%100% 72%72%
Investment ratioInvestment ratio 25%25% 11%11%Export ratioExport ratio 58%58% 23%23%Primary export Primary export ratioratio
33%33% 80%80%
InflationInflation 10%10% 18%18%Growth 1965-98Growth 1965-98 3%3% -2%-2%
A Tale of Two Countries

Madagascar and Mauritius:GNP per capita 1962-2001Case 3
0
500
1000
1500
2000
2500
3000
3500
4000
4500
Madagascar
Mauritius
Current US$,Atlas method

Exogenous vs. endogenous growth
The neoclassical viewThe neoclassical viewthat economic growth in the long run is that economic growth in the long run is
merely a matter of merely a matter of technologytechnology does not does not throw much light on the impressive growth throw much light on the impressive growth performance of Asia since the 1960s, or on performance of Asia since the 1960s, or on growth differentialsgrowth differentials
The new viewThe new viewthat long-run growth depends on that long-run growth depends on savingsaving and and
efficiency efficiency is more illuminatingis more illuminating
Besides, it’s not really new, because Adam Besides, it’s not really new, because Adam Smith knew this (1776) Smith knew this (1776)

One crucial implication of exogenous growth
The neoclassical viewThe neoclassical viewIf two countries are identical (same If two countries are identical (same
saving rate, same population growth, saving rate, same population growth, same technology), then their income same technology), then their income per head will per head will ultimatelyultimately be the same be the same
This means that poor countries must This means that poor countries must grow faster than – grow faster than – catch upcatch up with! – with! – rich countries: “conditional rich countries: “conditional convergence”convergence”
Endogenous growth theory does not Endogenous growth theory does not have this implication have this implication
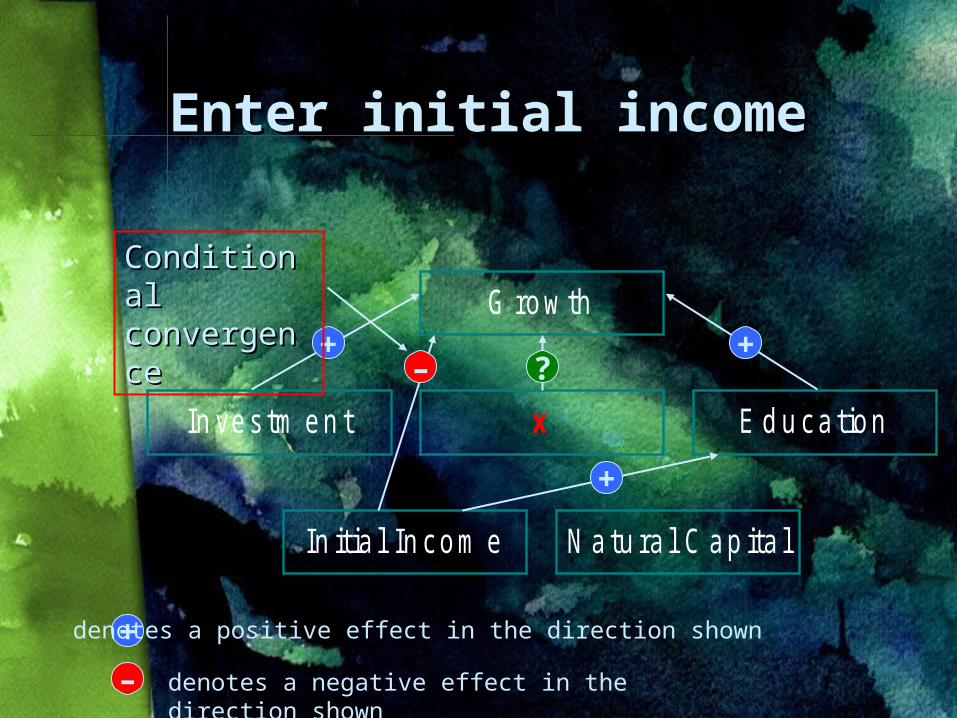
Enter initial incomeEnter initial income
In ves tm en t
In it ia l In com e N atu ra l C ap ita l
x E d u ca tion
G row th+
+
+–
+denotes a positive effect in the direction shown
– denotes a negative effect in the direction shown
?
Conditional Conditional convergencconvergencee
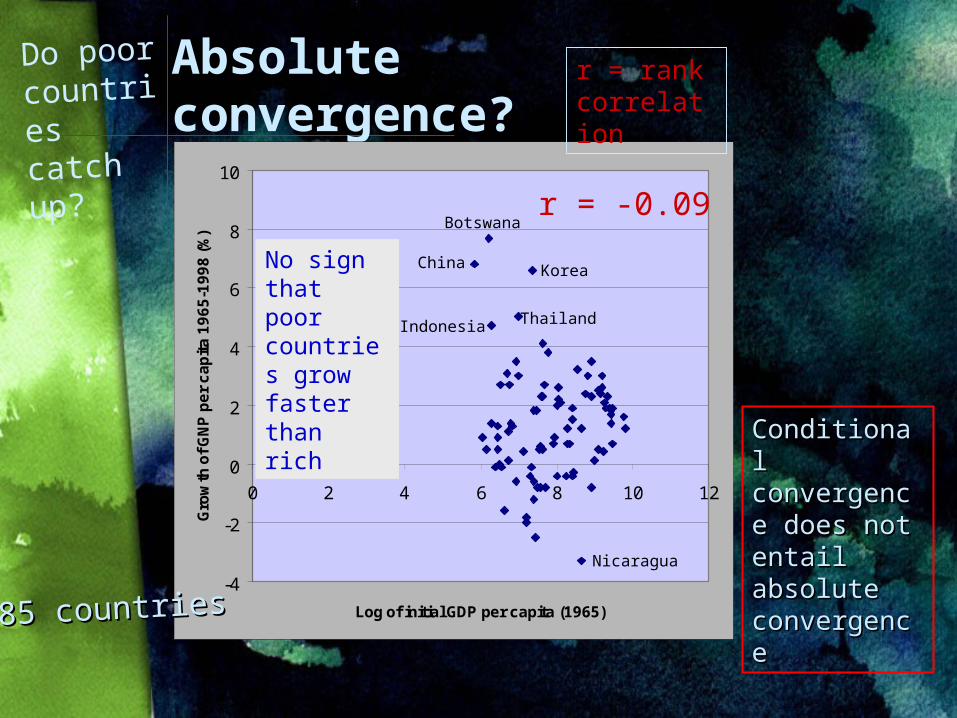
Absolute convergence?
Do poor countries catch up?
-4
-2
0
2
4
6
8
10
0 2 4 6 8 10 12
Log of initial GDP per capita (1965)
Gro
wth
of
GN
P p
er
ca
pit
a 1
96
5-1
99
8 (
%)
r = -0.09Botswana
China Korea
Nicaragua
ThailandIndonesia
No sign that poor countries grow faster than rich
8855 countries countries
r = rank correlation
Conditional Conditional convergence convergence does not does not entail entail absolute absolute convergenceconvergence

Sources of endogenous growth I
Saving Saving Fits real world Fits real world experienceexperience quite well quite well
No coincidence that, in East Asia, saving rates of No coincidence that, in East Asia, saving rates of 30-30-40%40% of GDP went along with rapid economic growth of GDP went along with rapid economic growth
No coincidence either that many African economies with No coincidence either that many African economies with saving rates around saving rates around 10%10% of GDP have been stagnant of GDP have been stagnant
OECD countries: saving rates of about OECD countries: saving rates of about 20%20% of GDP of GDP
Important implication for Important implication for economic policyeconomic policy::Economic stability with Economic stability with low inflationlow inflation and positive real and positive real
interest rates spurs saving, which is interest rates spurs saving, which is good for growthgood for growth
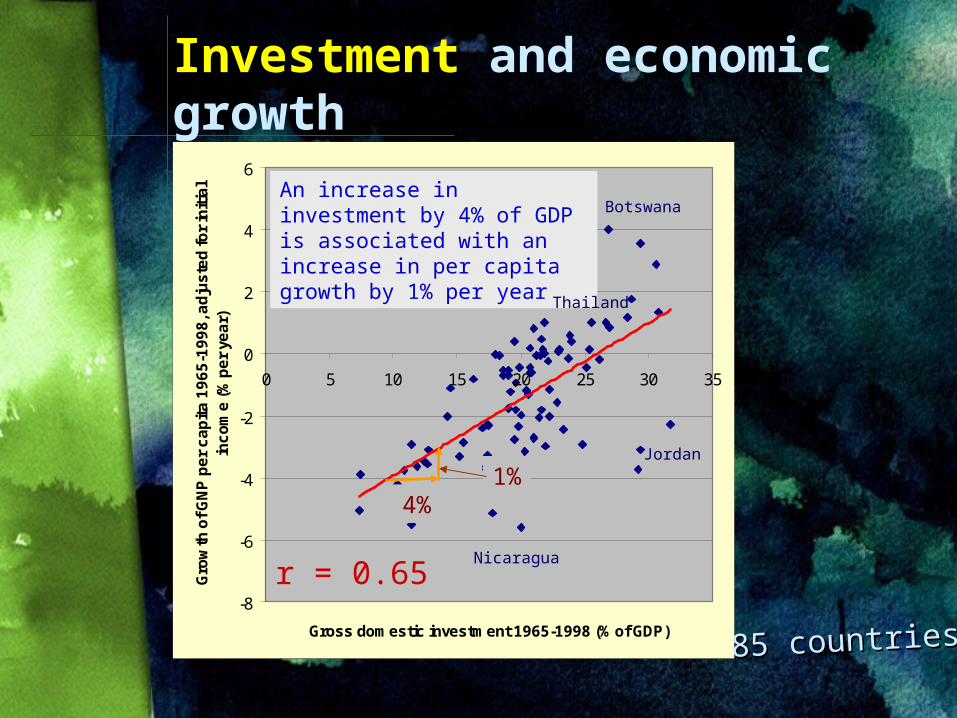
Investment and economic growth
-8
-6
-4
-2
0
2
4
6
0 5 10 15 20 25 30 35
Gross domestic investment 1965-1998 (% of GDP)
Gro
wth
of
GN
P p
er
ca
pit
a 1
96
5-1
99
8, a
dju
ste
d f
or
init
ial
inc
om
e (
% p
er
yea
r)
r = 0.65
Jordan
Botswana
Nicaragua
85 countries85 countries
An increase in investment by 4% of GDP is associated with an increase in per capita growth by 1% per year
4%1%
Thailand

Sources of endogenous growth II
EfficiencyEfficiencyAlso fits real world experience quite wellAlso fits real world experience quite well
Technical progress is good for growth because it allows Technical progress is good for growth because it allows us to us to squeeze more output out of given inputssqueeze more output out of given inputs
And that is exactly what increased And that is exactly what increased efficiencyefficiency is all is all about! about!
Thus, technology is best viewed as an aspect of general Thus, technology is best viewed as an aspect of general economic efficiency economic efficiency
Important implication for Important implication for economic policyeconomic policy::Everything that increases economic efficiency, no matter Everything that increases economic efficiency, no matter
what, is also what, is also good for growthgood for growth
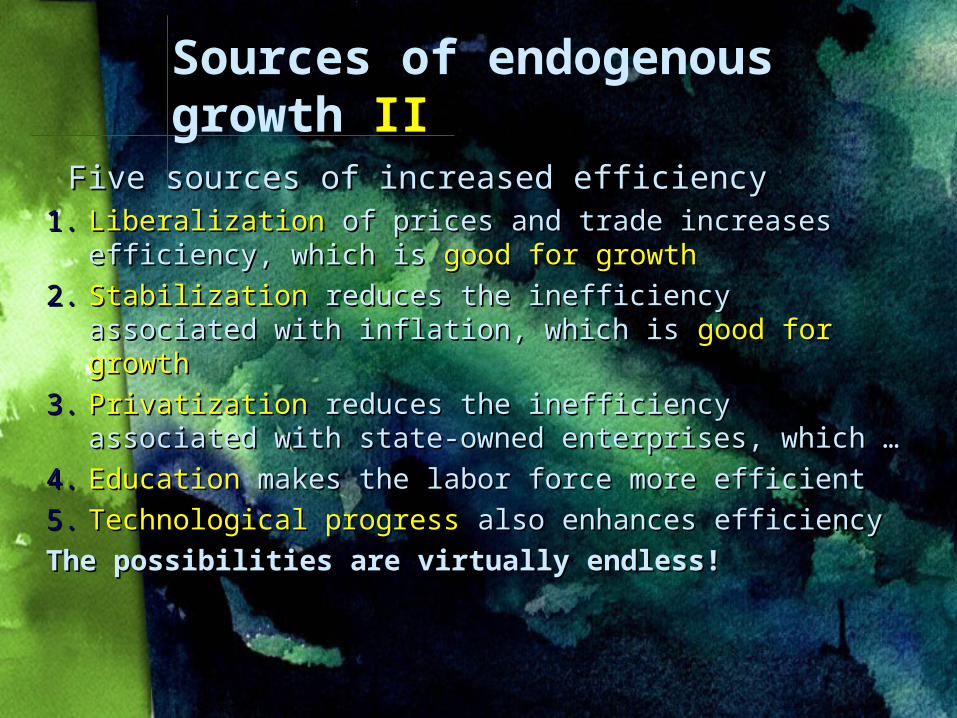
Sources of endogenous growth II
Five sources of increased efficiencyFive sources of increased efficiency1.1. LiberalizationLiberalization of prices and trade increases of prices and trade increases
efficiency, which is efficiency, which is good for growthgood for growth
2.2. StabilizationStabilization reduces the inefficiency associated with reduces the inefficiency associated with inflation, which is inflation, which is good for growthgood for growth
3.3. PrivatizationPrivatization reduces the inefficiency associated with reduces the inefficiency associated with state-owned enterprises, which …state-owned enterprises, which …
4.4. EducationEducation makes the labor force more efficient makes the labor force more efficient
5.5. Technological progressTechnological progress also enhances efficiency also enhances efficiency
The possibilities are virtually endless!The possibilities are virtually endless!
Sources of endogenous growth II
This is This is good newsgood newsIf growth were merely a matter of technology, we If growth were merely a matter of technology, we
would not be able to do much about it …would not be able to do much about it …… … except to follow technology-friendly policies by except to follow technology-friendly policies by
supporting supporting R&DR&D and such and such
But if growth depends on saving and efficiency, But if growth depends on saving and efficiency, there are things that we there are things that we can docan do, in the private , in the private sector as well as through the public sector, to sector as well as through the public sector, to foster rapid economic growthfoster rapid economic growth
Because Because everything that is good for saving and everything that is good for saving and efficiency is also efficiency is also good for growthgood for growth

Liberalization and economic growth
Liberalization of pricesLiberalization of prices means that markets, means that markets, not bureaucrats, are allowed to set prices not bureaucrats, are allowed to set prices Mixed market economy is Mixed market economy is more efficientmore efficient than than
central planningcentral planning Compare former Soviet Union with the US and Compare former Soviet Union with the US and
EuropeEurope
Liberalization of tradeLiberalization of trade allows specialization allows specialization according to comparative advantageaccording to comparative advantageFree trade is Free trade is more efficientmore efficient than self-sufficiency than self-sufficiency
North Korea and Cuba vs. Hong Kong and SingaporeNorth Korea and Cuba vs. Hong Kong and Singapore
Applies to trade in goods, services, capitalApplies to trade in goods, services, capital
1

Openness to trade and growth 1965-98
-8
-6
-4
-2
0
2
4
6
-40 -30 -20 -10 0 10 20 30 40
Actual less predicted exports 1965-98 (% of GDP)
An
nu
al
gro
wth
of
GN
P p
er
cap
ita
196
5-98
, a
dju
ste
d f
or
init
ial
inco
me
(%
)
Malaysia
Belgium
Korea
Guinea Bissau
87 countries
An increase in openness by 14% of GDP is associated with an increase in per capita growth by 1% per year
r = 0.40

Stabilization and economic growth
Stabilization of pricesStabilization of prices means that distortions means that distortions associated with inflation are reducedassociated with inflation are reduced InflationInflation distorts the choice between real and financial distorts the choice between real and financial
capital by punishing money holdings, and thus capital by punishing money holdings, and thus creates creates inefficiency inefficiency in productionin production
Inflation thus involves a tax, the Inflation thus involves a tax, the inflation taxinflation tax An An inefficient taxinefficient tax compared with most other taxes compared with most other taxes
Inflation also creates Inflation also creates uncertainlyuncertainly which tends to which tends to discourage trade and investment discourage trade and investment
Inflation also tends to result in Inflation also tends to result in overvaluationovervaluation of of currency, thus hurting exports and growthcurrency, thus hurting exports and growth
2

Privatization and economic growth
PrivatizationPrivatization means that profit-oriented means that profit-oriented owners and able managers are allowed to owners and able managers are allowed to direct enterprisesdirect enterprisesProfit motiveProfit motive replaces political considerations replaces political considerations
as the guiding principle of business operationsas the guiding principle of business operationsProfit-maximizing owners generally want to appoint Profit-maximizing owners generally want to appoint
managers and staff on merit rather than on the managers and staff on merit rather than on the basis of political connections, for examplebasis of political connections, for example
Private enterprise is generally Private enterprise is generally more efficientmore efficient than state-owned enterprisesthan state-owned enterprises
3

Education and economic growth
EducationEducation means a better trained and hence means a better trained and hence more efficientmore efficient work force work force Need to provide primary and secondary education Need to provide primary and secondary education
to all, especially femalesto all, especially females Need to provide tertiary education to a greatly Need to provide tertiary education to a greatly
increased number of peopleincreased number of people Need increased public commitment to educationNeed increased public commitment to education This requires both increased This requires both increased public expenditurepublic expenditure on on
education and probably also increased scope for education and probably also increased scope for private sector involvementprivate sector involvement in education in education
4
Same story time and again
Free trade Free trade is good for growth is good for growth Reduces the inefficiency that results from Reduces the inefficiency that results from
restrictions on trade restrictions on trade
Price stabilityPrice stability is good for growth is good for growth Reduces inefficiency resulting from inflationReduces inefficiency resulting from inflation
PrivatizationPrivatization is good for growth is good for growth Reduces inefficiency resulting from SOEsReduces inefficiency resulting from SOEs
EducationEducation is good for growth is good for growth Reduces the inefficiency that results from Reduces the inefficiency that results from
inadequate educationinadequate education
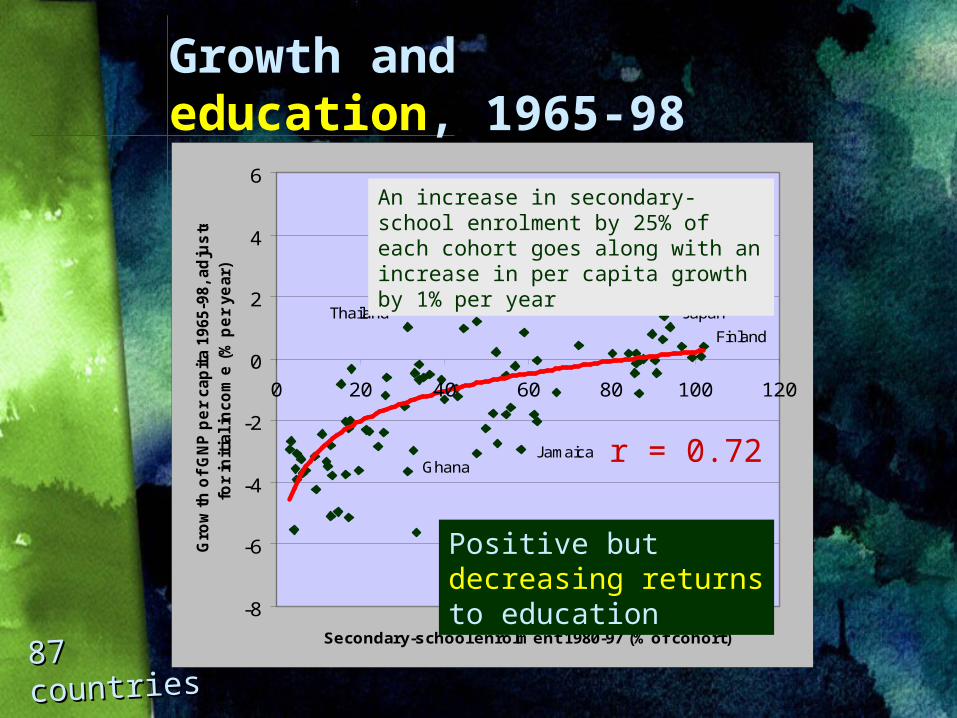
Growth and education, 1965-98
-8
-6
-4
-2
0
2
4
6
0 20 40 60 80 100 120
Secondary-school enrolment 1980-97 (% of cohort)
Gro
wth
of
GN
P p
er
cap
ita 1
965-9
8, ad
jus
ted
for
init
ial in
co
me
(%
pe
r ye
ar)
Thailand Japan
Finland
JamaicaGhana
Positive but decreasing returns to education
An increase in secondary-school enrolment by 25% of each cohort goes along with an increase in per capita growth by 1% per year
r = 0.72
87 87 countriescountries
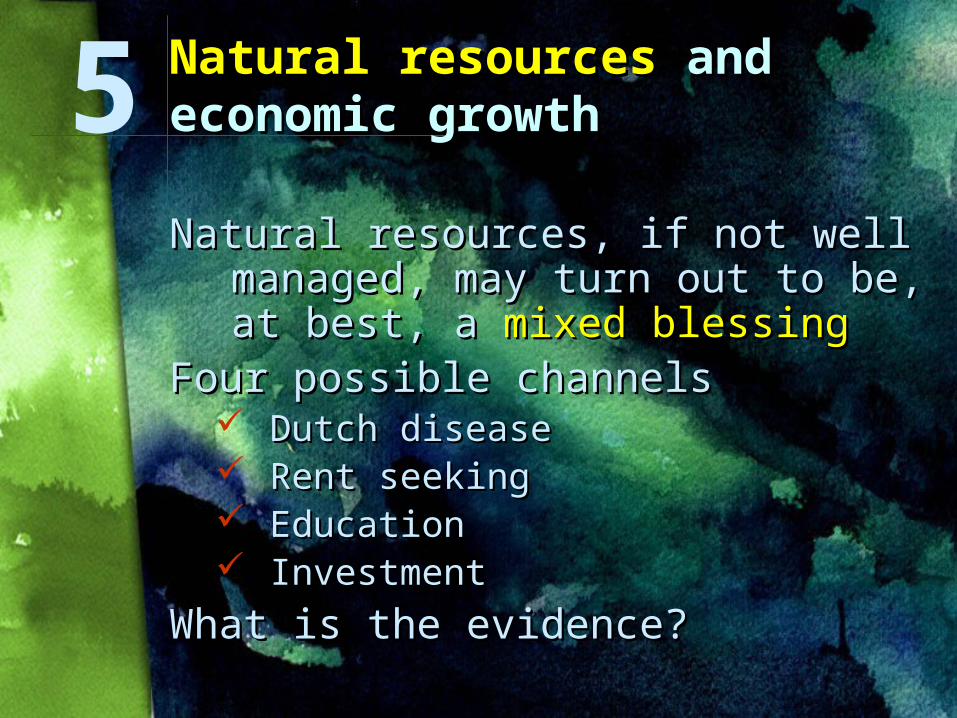
Natural resourcesNatural resources and and economic growtheconomic growth
Natural resources, if not well Natural resources, if not well managed, may turn out to be, managed, may turn out to be, at best, a at best, a mixed blessingmixed blessing
Four possible channelsFour possible channels Dutch diseaseDutch disease Rent seekingRent seeking Education Education InvestmentInvestment
What is the evidence?What is the evidence?
5
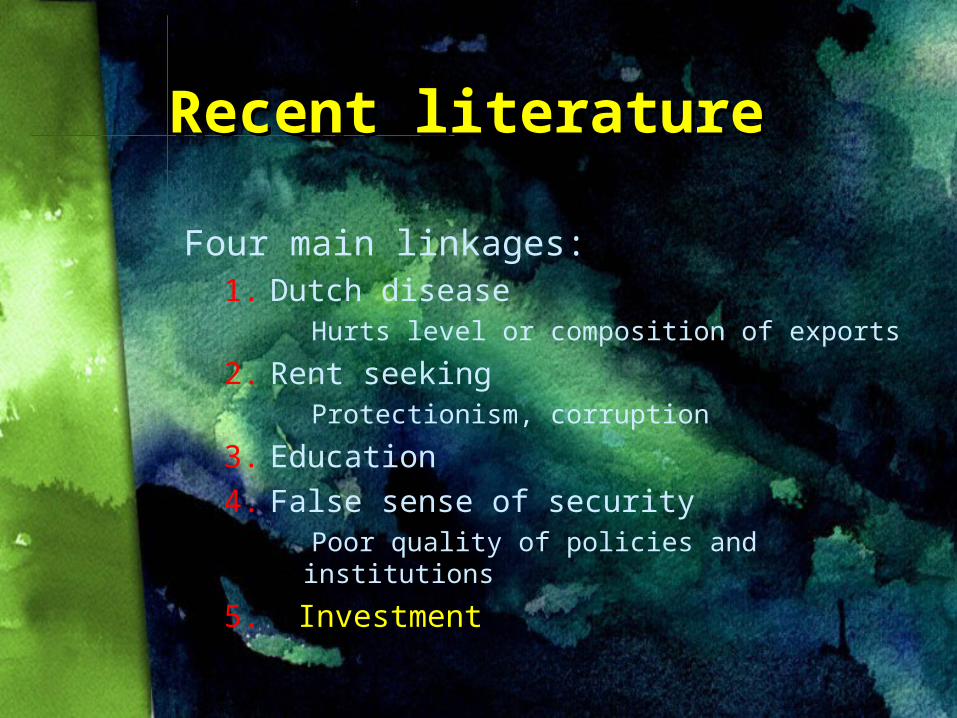
Recent literatureRecent literature
Four main linkages: 1. Dutch disease
Hurts level or composition of exports
2. Rent seeking Protectionism, corruption
3. Education4. False sense of security
Poor quality of policies and institutions
5. Investment

In ves tm en t
In it ia l In com e N atu ra l C ap ita l
x E d u ca tion
G row th+
+
+––
––
Enter Enter natural natural resourcesresources
?
Natural resource abundance hurtsNatural resource abundance hurts investment investment and and educationeducation, and hence also growth, and hence also growth
Dutch disease
Rent seeking
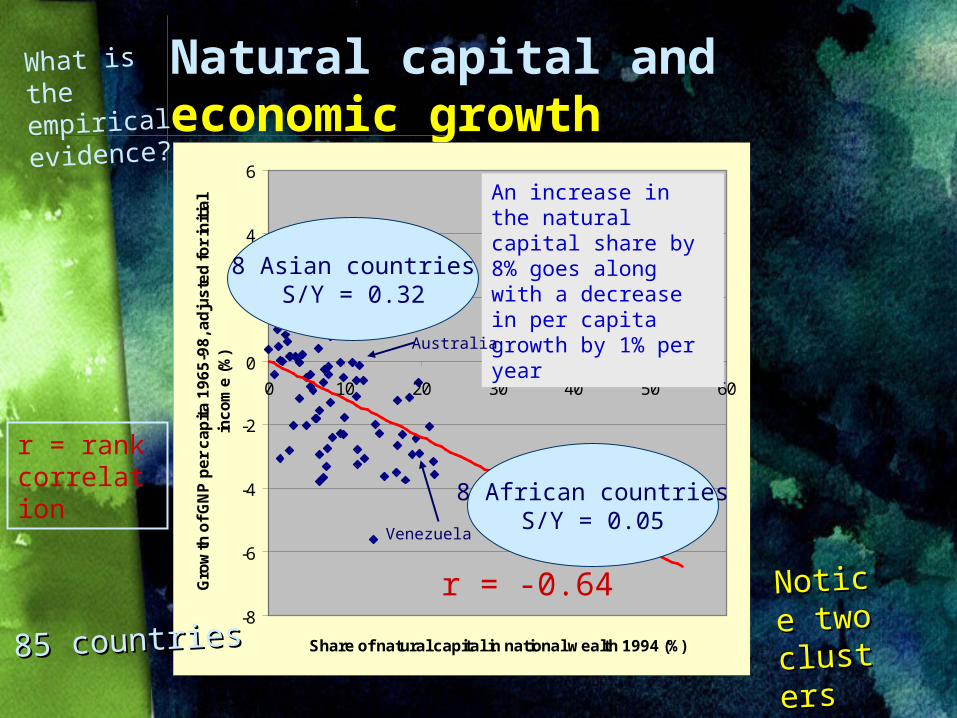
Natural capital and economic growth
What is the empirical evidence?
r = rank correlation
-8
-6
-4
-2
0
2
4
6
0 10 20 30 40 50 60
Share of natural capital in national wealth 1994 (%)
Gro
wth
of
GN
P p
er
ca
pit
a 1
96
5-9
8, a
dju
ste
d f
or
init
ial
inc
om
e (
%)
An increase in the natural capital share by 8% goes along with a decrease in per capita growth by 1% per year
r = -0.64
8 African countriesS/Y = 0.05
8 Asian countriesS/Y = 0.32
Notice Notice two two clusterclusterss
Venezuela
Australia
85 countries85 countries

6 Inequality and economic growth
Two views:Two views:1.1. Inequality is Inequality is goodgood for growth for growth
Too much equality weakens Too much equality weakens incentives to work, save, and incentives to work, save, and acquire an educationacquire an education
2.2. Inequality is Inequality is badbad for growth for growth Too much inequality reduces social Too much inequality reduces social
cohesion and creates conflictcohesion and creates conflict
What is the empirical evidence?What is the empirical evidence?
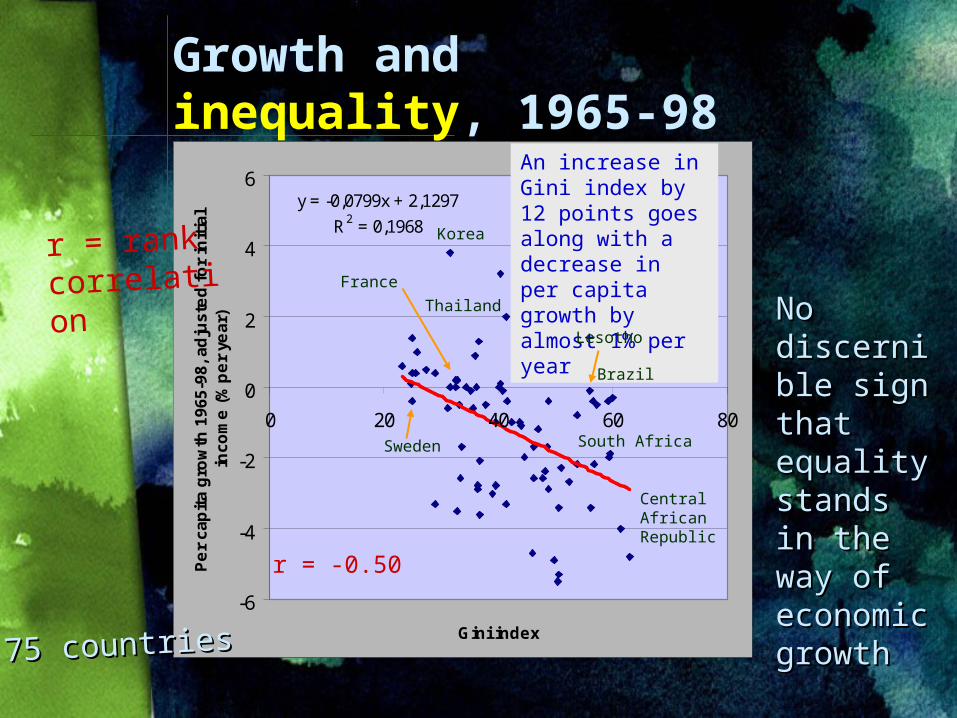
y = -0,0799x + 2,1297
R2 = 0,1968
-6
-4
-2
0
2
4
6
0 20 40 60 80
Gini index
Pe
r c
ap
ita
gro
wth
19
65
-98
, a
dju
ste
d f
or
init
ial
inc
om
e (
% p
er
yea
r)
An increase in Gini index by 12 points goes along with a decrease in per capita growth by almost 1% per year
r = rank correlation
r = -0.50
Growth and inequality, 1965-98
Sweden
Thailand
Central African Republic
South Africa
France
Brazil
No No discernibldiscernible sign e sign that that equality equality stands in stands in the way the way of of economic economic growthgrowth
Korea
75 countries75 countries
Lesotho
What is the upshot?What is the upshot?
Economic growth responds to Economic growth responds to public public policypolicy
In particular, by encouragingIn particular, by encouraging saving and saving and investmentinvestment of high quality of high quality foreign foreign tradetrade and investment and investmenteducationeducationeconomic diversificationeconomic diversificationand perhaps alsoand perhaps also equality equality
... the government can help foster ... the government can help foster rapid rapid economic growtheconomic growth

Sir Arthur Lewis got it Sir Arthur Lewis got it rightright
Since the second world Since the second world war it has become war it has become quite clear that rapid quite clear that rapid economic growth is economic growth is available to those available to those countries with countries with adequate natural adequate natural resources which resources which make make the effort to achieve itthe effort to achieve it..
W. ARTHUR LEWISW. ARTHUR LEWIS(1968)(1968)
What else?What else?These lessons are borne out by These lessons are borne out by
experience from around the worldexperience from around the worldAdditional lessons:Additional lessons:
Too much Too much inflationinflation hurts saving, investment, hurts saving, investment, and trade and trade — and thereby also growth and thereby also growth
Too much Too much SOESOE activity hurts the quality of activity hurts the quality of investment and education investment and education — and growth and growth
Too much Too much agricultureagriculture and, more generally, and, more generally, natural resource dependencenatural resource dependence, if not well , if not well managed, hurts education, investment, and managed, hurts education, investment, and trade trade — and thereby also growth and thereby also growth
Too rapid Too rapid population growthpopulation growth also tends to also tends to impede economic growthimpede economic growth

ReservationsReservationsEven so, the question of rapid growth is, Even so, the question of rapid growth is,
of course, a bit more complicatedof course, a bit more complicatedWe also need to address a host of We also need to address a host of
politicalpolitical, , socialsocial,, and and culturalcultural questions questions as well as questions of as well as questions of naturalnatural conditions, climate, and public health conditions, climate, and public health — which would take us too far afield
But the main point remains:But the main point remains:To grow or not to growTo grow or not to grow is in large measure is in large measure
a a matter of choicematter of choiceMany of the constraints on growth are Many of the constraints on growth are man-man-
mademade, and can be removed, and can be removed

To grow or not to grow is in large measure a matter of choice
To grow or not to grow is in large measure a matter of choice
These slides – and more! – can be viewed on my website: www.hi.is/~gylfason
Conclusion: Conclusion: It can It can be donebe done
The EndThe End