sound quality engineering für die optimale akustik ihrer ... quality... · für die optimale...
TRANSCRIPT
Online-Seminar
Sound Quality Engineering für die optimale Akustik Ihrer Produkte
Stefanie Fabian
Unrestricted @ Siemens AG 2019

Unrestricted © Siemens AG 2019
Page 2 Siemens PLM Software
Stefanie Fabian
PreSales Consultant
Testing Solutions
phone: +49 (40) 23720534
mobile: +49 (1520) 3464954
email: [email protected]
Welcome

Unrestricted © Siemens AG 2019
Page 3 Siemens PLM Software
Sound Quality Process
MEASURE
SUBJECTIVE ANALYSISOBJECTIVE ANALYSIS
INCREASE OF SOUND QUALITY

Agenda:Human hearing system – Psychoacoustics
Binaural measurements
Objective analysis - Sound quality metrics
Subjective analysis - Jury Testing
Human hearing system -
Psychoacoustics

Unrestricted © Siemens AG 2019
Page 6 Siemens PLM Software
Human hearing system
≠Time-averaging
Microphones measure
instantaneous
pressure fluctuations
The brain does not
respond to the
instantaneous pressure,
instead it behaves like
an integrator.
ഥ𝒑 =𝟏
𝑻∙ න
𝟎
𝑻
𝒑𝟐 𝒕 𝒅𝒕
Unrestricted © Siemens AG 2019
Page 7 Siemens PLM Software
Equal loudness curves
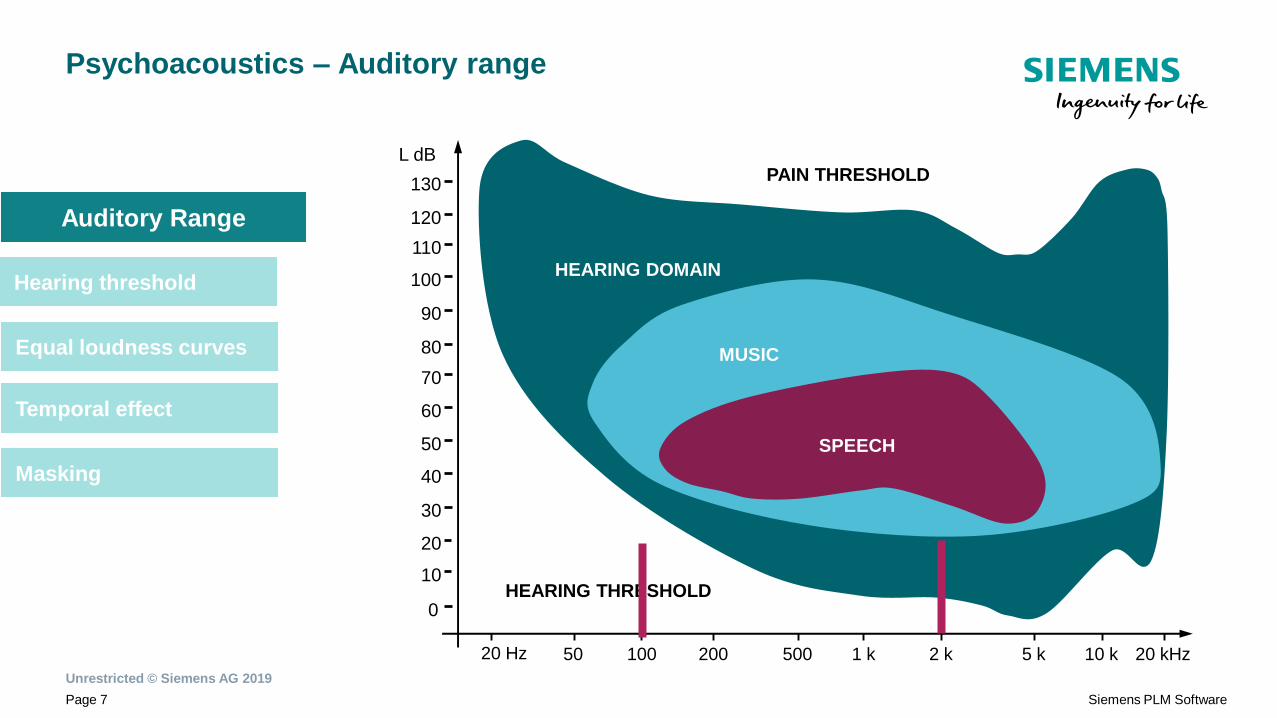
Psychoacoustics – Auditory range
Hearing threshold
Temporal effect
Masking
Auditory Range
20 Hz 50 100 200 500 1 k 2 k 5 k 10 k 20 kHz
0
10
20
30
40
50
60
70
80
90
100
110
120
L dB
HEARING THRESHOLD
PAIN THRESHOLD
HEARING DOMAIN
MUSIC
SPEECH
130

Unrestricted © Siemens AG 2019
Page 8 Siemens PLM Software
Equal loudness curves
Psychoacoustics - A-weighting
▪ Filter with similar attributes to ear
▪ Simple curve shape, attenuates low frequencies
▪ 1000 Hz - no gain/attenuation, used for microphone calibrations
Auditory Range
Hearing threshold
Temporal effect
Masking

Unrestricted © Siemens AG 2019
Page 9 Siemens PLM Software
Equal loudness curves
Hearing threshold
Auditory Range
Equal loudness curves
ISO 226:2003 Equal
loudness curves
Temporal effect
Masking

Unrestricted © Siemens AG 2019
Page 10 Siemens PLM Software
Temporal effect
Equal loudness curves
Temporal effect
Masking
Hearing threshold
Some specsAuditory Range

Unrestricted © Siemens AG 2019
Page 11 Siemens PLM Software
Frequency Masking
Masking for 1200 Hz Sine Tone
Equal loudness curves
Temporal effect
Masking
Hearing threshold
Some specsAuditory Range
1200 Hz tone
changes
threshold
4000 Hz tone is
completely
inaudible

Binaural
measurements

Unrestricted © Siemens AG 2019
Page 13 Siemens PLM Software
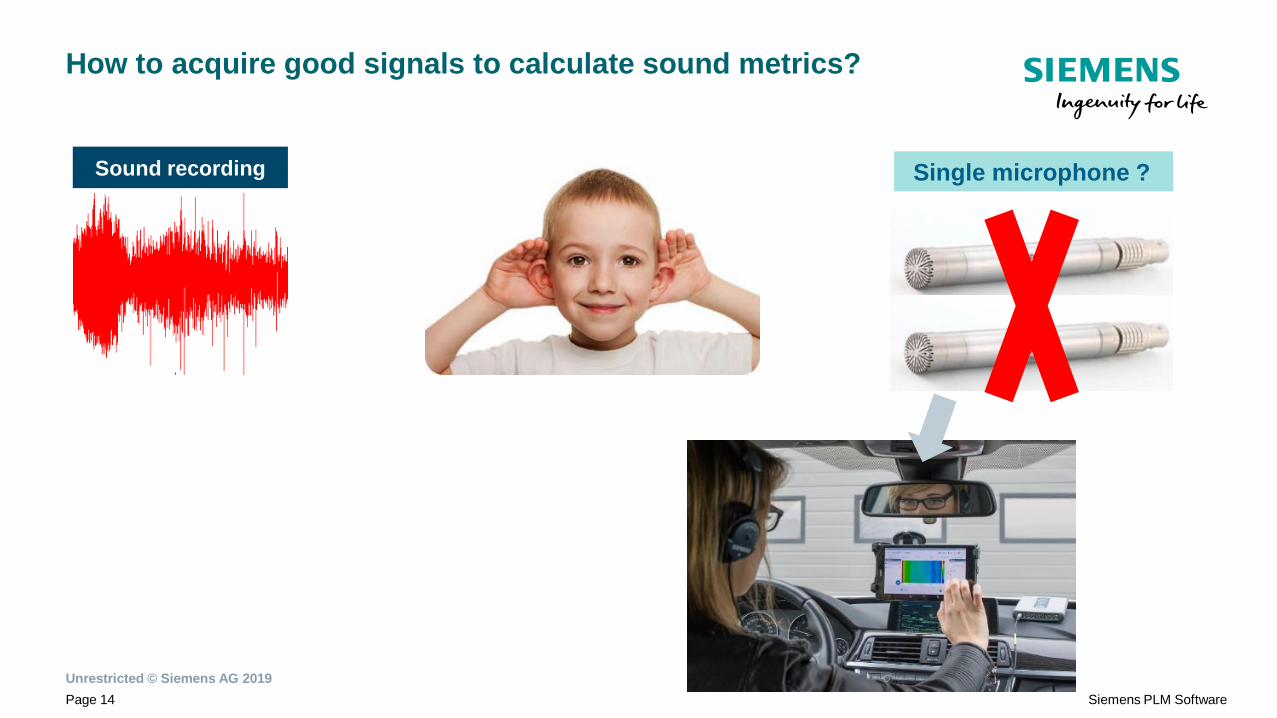
How to acquire good signals to calculate sound metrics?
Single microphone ?Sound recording
Unrestricted © Siemens AG 2019
Page 14 Siemens PLM Software
How to acquire good signals to calculate sound metrics?
Sound recording Single microphone ?

Unrestricted © Siemens AG 2019
Page 15 Siemens PLM Software
How to measure binaural recordings?
G.R.A.S. 45BB KEMAR Head and Torso
Simcenter SCADAS XS with Simcenter SCADAS 3D Binaural Headset
Binaural measurements
✓ Ideal for listening tests
✓ Stereo recordings
✓ Requires artificial head or a binaural headset
✓ Can be used for direct replay
✓ Recorded data is automatically equalized for
analysis

Unrestricted © Siemens AG 2019
Page 16 Siemens PLM Software
Accurate audio replay – Equalization
Equalization for analysis
Removing the head and torso effect
Replay equalization
Adding the head and torso effect
Removing the headphones effect

Objective analysis
Sound quality metrics

Unrestricted © Siemens AG 2019
Page 18 Siemens PLM Software
Introducing sound quality metrics
Groups of sound quality metrics
• Adapting recorded sounds to perception
• Loudness ISO532 (A and B), Loudness Stevens VII,
Time Varying loudness, …
• To quantify speech intelligibility according to the environment
• Speech interference level, Articulation Index, …
• Amplitude variation and harshness due to modulation
• Roughness, fluctuation strength
• To quantify if the noise is disturbing or not
• Noise rating, noise criterion, balanced noise criterion, sharpness
• To quantify the perception of tonal components in real sounds
• Pitch, tonality, tone-to-noise ratio, prominence ratio
Level
metrics
Speech
metrics
Modulation
metrics
Annoyance
metrics
Tonal
metrics

Unrestricted © Siemens AG 2019
Page 19 Siemens PLM Software
White goods – more than Sound Power
White goods
FridgesOperate all day – produce idle noise but during
cooling, opening/closing of the doors. Main noise
source: compressors and fans.
Washing machinesVarious operational conditions: Opening/closing
sound, different spinning velocities, drying. Main
noise source: rotating drum, valves, pumps
Vacuum cleaners
Focus on loudness and annoyance. Depending on
the design, the noise may be: mechanical
(bearing/rotor), electromagnetic (magnetic force
induced vibrations) or aerodynamic (fan).
Commonly used sound quality metrics
• Loudness
• Spectral analysis
• Modulation analysis
• Tonality
• Sharpness

Unrestricted © Siemens AG 2019
Page 20 Siemens PLM Software
Vacuum cleaner – why do we need Loudness?
Sound Pressure Level
and Sound Power are
important, but
sometimes not enoughLoudness takes into account the aspects of human hearing and is
more representative of the subjective preference

Unrestricted © Siemens AG 2019
Page 21 Siemens PLM Software
Loudness
The metric of Loudness takes into account:
• Frequency
• Level
• Hearing threshold
• Temporal effect
• Masking
1 sone is
40 phones is
1 kHz @ 40 dB
sine tone
Loudness is a psychoacoustic parameter, that
maps the human perception of the volume of
acoustic signals to a linear scale
This metric is standardized:
ISO 532DIN45631
ANSI S3.4

Unrestricted © Siemens AG 2019
Page 22 Siemens PLM Software
Door slam – frequency content
Unrestricted © Siemens AG 2019
Page 23 Siemens PLM Software
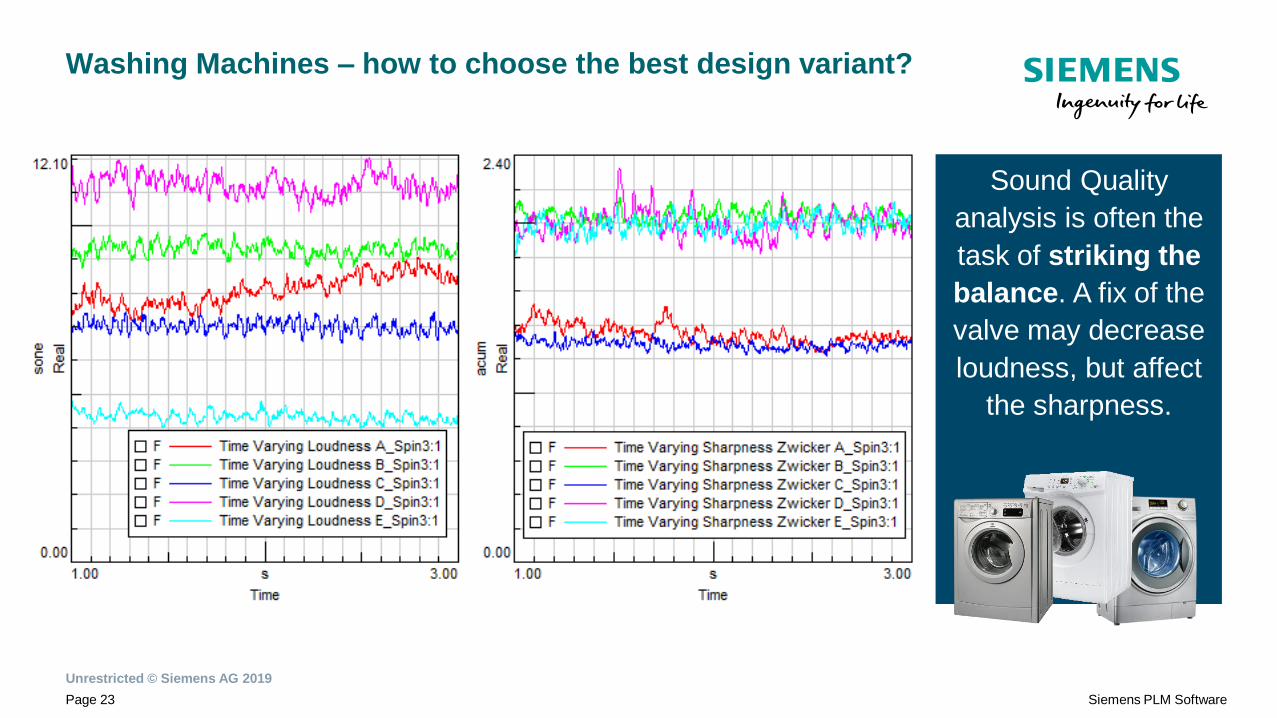
Sound Quality
analysis is often the
task of striking the
balance. A fix of the
valve may decrease
loudness, but affect
the sharpness.
Washing Machines – how to choose the best design variant?

Unrestricted © Siemens AG 2019
Page 24 Siemens PLM Software
Sharpness
This metric is standardized:
DIN 45692
Multiple methods exist:
Zwicker & Fastl, von Bismarck,
Aures (includes Loudness)
1 acum is as sharp as a 1
kHz @ 60 dB band of +-80 Hz
width
Sharpness is a measure of the high frequency content of a sound;
the greater the proportion of high frequencies the ‘sharper’ the
sound.
Unrestricted © Siemens AG 2019
Page 25 Siemens PLM Software
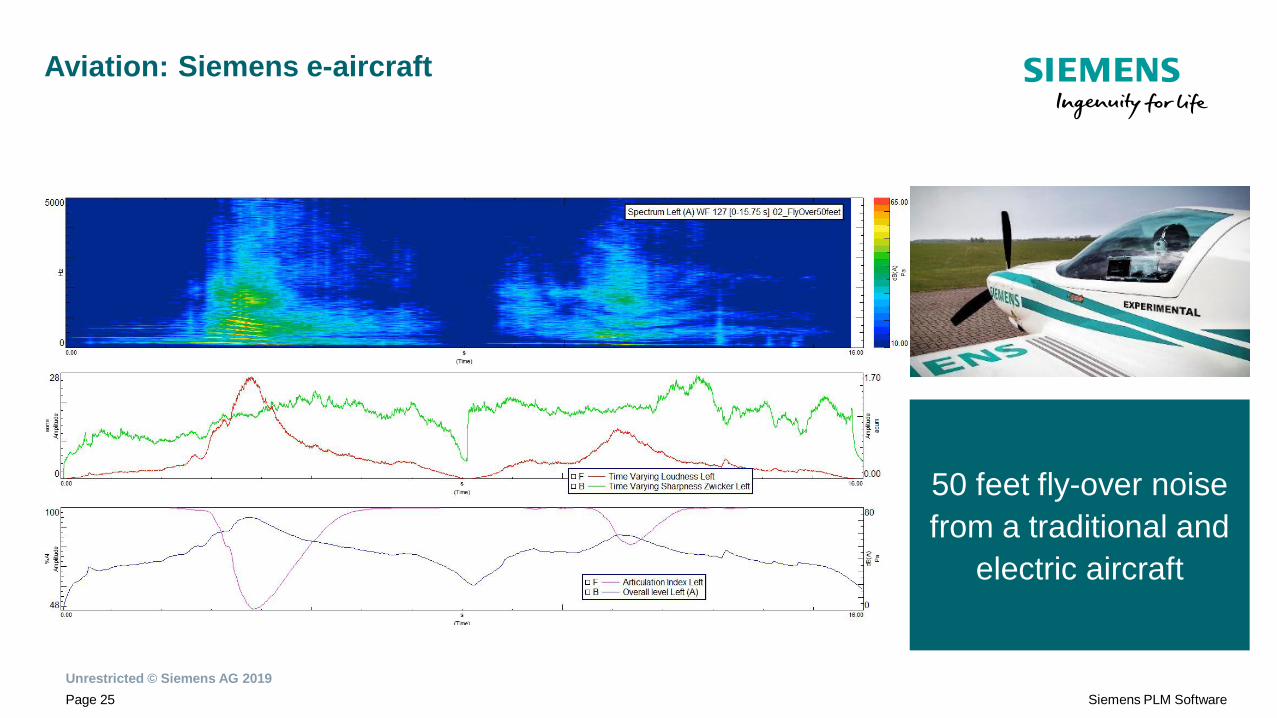
Aviation: Siemens e-aircraft
50 feet fly-over noise
from a traditional and
electric aircraft

Unrestricted © Siemens AG 2019
Page 26 Siemens PLM Software
Articulation Index
Articulation Index – How well is speech understood in the
presence of the analyzed sound. Analysis is done in 1/3
Octave bands
Unrestricted © Siemens AG 2019
Page 27 Siemens PLM Software
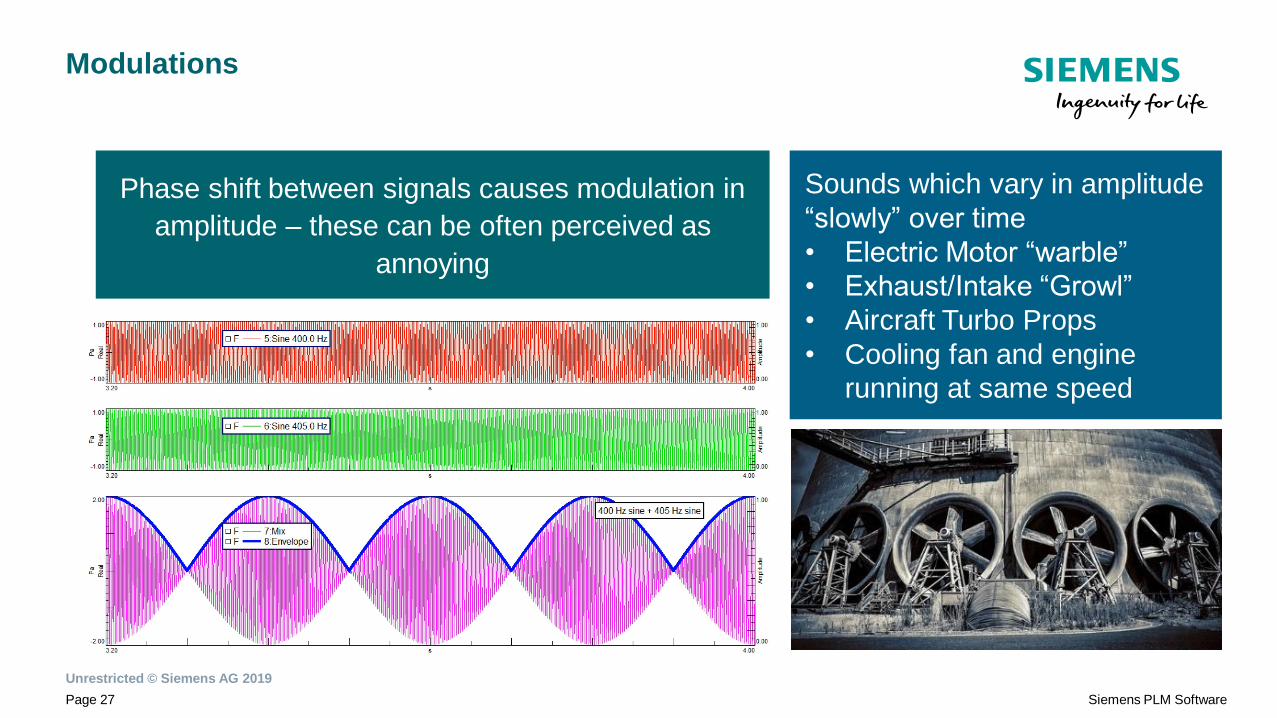
Modulations
Sounds which vary in amplitude
“slowly” over time
• Electric Motor “warble”
• Exhaust/Intake “Growl”
• Aircraft Turbo Props
• Cooling fan and engine
running at same speed
Phase shift between signals causes modulation in
amplitude – these can be often perceived as
annoying

Unrestricted © Siemens AG 2019
Page 28 Siemens PLM Software
Roughness
Roughness
focuses on faster
modulations,
between 20 and
300 Hz, max at 70
Hz
1 asper is
roughness
produced by a 1000
Hz tone of 60 dB
which is 100%
amplitude
modulated at 70 Hz

Unrestricted © Siemens AG 2019
Page 29 Siemens PLM Software
Prominence Ratio
PROBLEM?
PROBLEM?

Unrestricted © Siemens AG 2019
Page 30 Siemens PLM Software
Prominence Ratio Maps
Unrestricted © Siemens AG 2019
Page 31 Siemens PLM Software
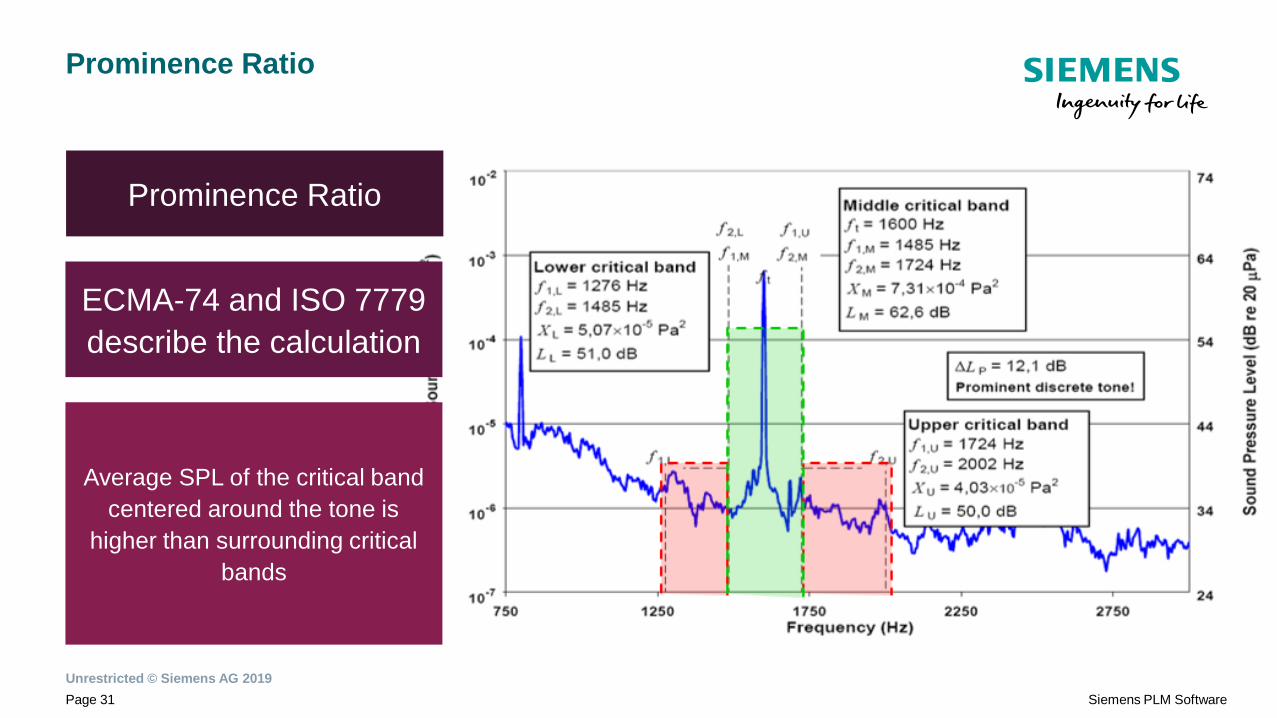
Prominence Ratio
Prominence Ratio
ECMA-74 and ISO 7779
describe the calculation
Average SPL of the critical band
centered around the tone is
higher than surrounding critical
bands

Unrestricted © Siemens AG 2019
Page 32 Siemens PLM Software
Customer actuated sounds
Typical noise problems
▪ Hollow sound when closing
▪ Multiple impact sensation
▪ Bad sound quality image, not robust
▪ Ringing
Customer actuated sounds
Door closure
Transient, impact type of sounds.
Play a significant role in the sound
quality image of the complete
vehicle.
Commonly used sound quality metrics
• Time Varying Loudness
• Time Varying Sharpness
• Ringing – time the sound takes to
converge back to the background level
• Wavelets

Unrestricted © Siemens AG 2019
Page 33 Siemens PLM Software
Wavelets
Traditional FFT methods do not work well on transient events:
▪ Good Time Resolution Bad Frequency
▪ Good Frequency Resolution Bad Time
Wavelet analysis uses filtering and flexible FFT settings to achieve the best results of the complete frequency range. It is best suitable for short, transient sounds

Unrestricted © Siemens AG 2019
Page 34 Siemens PLM Software
Introducing sound quality metrics
Groups of sound quality metrics
• Adapting recorded sounds to perception
• Loudness ISO532 (A and B), Loudness Stevens VII,
Time Varying loudness, …
• To quantify speech intelligibility according to the environment
• Speech interference level, Articulation Index, …
• Amplitude variation and harshness due to modulation
• Roughness, fluctuation strength
• To quantify if the noise is disturbing or not
• Noise rating, noise criterion, balanced noise criterion, sharpness
• To quantify the perception of tonal components in real sounds
• Pitch, tonality, tone-to-noise ratio, prominence ratio
Level
metrics
Speech
metrics
Modulation
metrics
Annoyance
metrics
Tonal
metrics
Subjective Analysis
Jury Testing
Unrestricted © Siemens AG 2019
Page 36 Siemens PLM Software
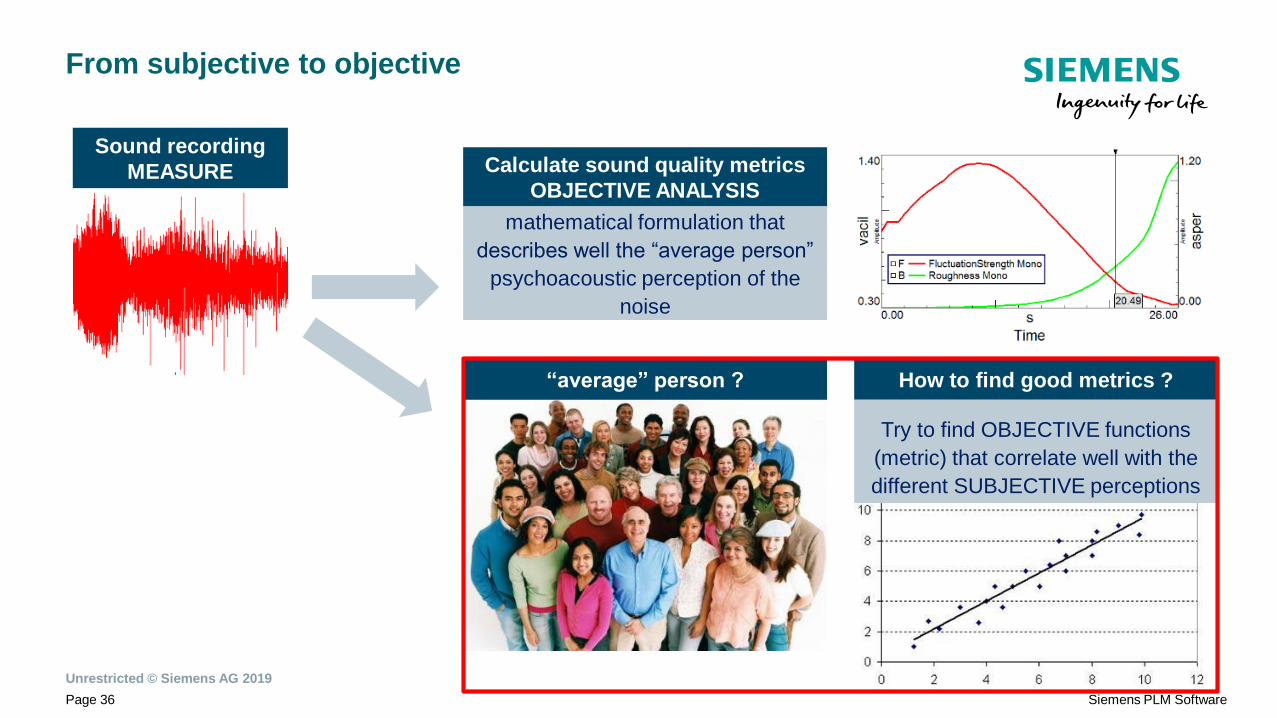
From subjective to objective
Sound recording
MEASURE Calculate sound quality metrics
OBJECTIVE ANALYSIS
mathematical formulation that
describes well the “average person”
psychoacoustic perception of the
noise
“average” person ? How to find good metrics ?
Try to find OBJECTIVE functions
(metric) that correlate well with the
different SUBJECTIVE perceptions

Unrestricted © Siemens AG 2019
Page 37 Siemens PLM Software
From subjective to objective
Jury testing
SUBJECTIVE ANALYSIS
Calculate sound quality metrics
OBJECTIVE ANALYSIS
mathematical formulation that
describes well the “average person”
psychoacoustic perception of the
noise
Listening sessions, including different “profiles”
of people.
Try to correlate metrics with jury testing results
Sound recording
MEASURE

Unrestricted © Siemens AG 2019
Page 38 Siemens PLM Software
Subjective analysis – Jury Testing
Understand what the
customer thinks
about the sound of
your product

Unrestricted © Siemens AG 2019
Page 39 Siemens PLM Software
Test procedure
Group Mode
Group of Jurors participates in the
test at the same location and time.
Answers are sent through wireless or
cable connection.
Individual Mode
One Juror at a time sits in front of the
computer and participates in the test.
All decentralized results can be
analyzed together.

Unrestricted © Siemens AG 2019
Page 40 Siemens PLM Software
Use sounds
measured with
Testlab or
imported from
an external
source
Support for A/B
comparison, Semantic
Differential and Category
Judgement with statistical
questions and reference
answers
Connect to an
unlimited number
of Jurors and
watch their
answers in real
time
Improve result quality
with automatic checks
on concordance and
consistency
1-click export to Excel
to further analysis
Jury Testing
Unrestricted © Siemens AG 2019
Page 41 Siemens PLM Software
Realize innovation.
Thank you!
Stefanie Fabian
PreSales Consultant
Testing Solutions
phone: +49 (40) 23720534
mobile: +49 (1520) 3464954
email: [email protected]
https://www.plm.automation.siemens.com/de/products/lms/testing/