sorption and transport of water vapour in acrylic paints
TRANSCRIPT
SORPTION AND TRANSPORT OF WATER
VAPOUR IN ACRYLIC PAINTS
by
Özge TOPÇUO�LU
A Thesis Submitted to the Graduate School of Engineering and
Sciences of �zmir Institute of Technology
in Partial Fulfillment of the Requirements for the Degree of
MASTER OF SCIENCE
Department: Chemical Engineering
Major: Chemical Engineering
�zmir Institute of Technology
�zmir, Turkey
October 2004

ii
We approve the thesis of Özge TOPÇUO�LU
Date of Signature
..................................... 27.10.2004
Assoc. Prof. Sacide ALSOY ALTINKAYA
Supervisor
Department of Chemical Engineering
..................................... 27.10.2004
Prof. Devrim BALKÖSE
Co-Supervisor
Department of Chemical Engineering
..................................... 27.10.2004
Asst. Prof. Fehime ÖZKAN
Department of Chemical Engineering
..................................... 27. 10.2004
Assoc. Prof. Funda TIHMINLIO�LU
Department of Chemical Engineering
..................................... 27. 10. 2004
Assoc. Prof. Metin TANO�LU
Department of Mechanical Engineering
..................................... 27.10.2004
Prof. Devrim BALKÖSE
Head of the Department
iii
ACKNOWLEDGEMENTS
I am deeply grateful to my advisors Assoc. Prof. Sacide Alsoy Altınkaya and
Prof. Devrim Balköse for their great support.
Thanks to Yılmaz Yürekli and Burcu Alp Akta� for their help in technical
works.
Special thanks to Mine Bahçeci and Gökhan Erdo�an for their valuable
suggestions and professional approaches during the characterization studies.
I also wish to thank Dr. Dan Perera for his comments on my differential
scanning calorimetry analysis results.
Cafer Özgür prepared my sample holders voluntarily and he have taken great
care.
Gözde Genç made very useful comments on scanning electron microscope
analysis and she shared her industrial experiences with me, related to paint materials.
Ayben Top, Selda Gökta� and �ebnem �im�ek; my dear friends helped me
sincerely whenever I met with a problem.
Thanks for �erife �ahin Özalp for her patience in replying my numerous
questions.
Finally my thanks are for my family, especially my parents Bilge and Latif
Topçuo�lu and my brother Sedat Topçuo�lu for sharing my sleepless nights.

iv
ABSTRACT
Sorption, diffusion and permeation data were obtained for water vapour in water
borne acrylic paint films and in the pure binder of the paints which is
methylmethacrylate-co-butylacrylate copolymer. Paint films which have the same
formulation but contain different amount of binder were characterized to determine
elements and their form, distribution of the ingredients, structure, functional groups,
degradation temperature, glass transition temperature and roughness of the surfaces
using energy dispersive X-ray (EDX), X-ray diffraction, map diagrams, scanning
electron microscope, fourier transform infrared spectroscopy, thermal gravimetry,
differential scanning calorimetry (DSC) and atomic force microscope, respectively.
Diffusivity and solubility of water in the paint films were measured at T= 30 oC
while for the pure copolymer film similar data were collected at T= 30 oC and T= 40 oC,
using a new type of gravimetric sorption apparatus called magnetic suspension balance.
Fickian sorption is observed for both the paint films and the pure copolymer.
Diffusivity and permeability of water increases while the maximum water
sorption capacity decreases with decreasing binder fraction in the paint films. Scanning
electron microscope pictures and map diagrams show a nonhomogeneous distribution
and flocculation of the pigments in the paint films with low binder content. Transport
properties (diffusivity, permeability, water sorption capacity) of the pure copolymer are
similar to those determined for the paint film containing 40% binder.
The sorption data for the paint films and the pure copolymer were interpreted
using Flory-Huggins theory and ENSIC model, respectively. The Zimm and Lundberg
cluster integral was used to determine the extend of clustering of water molecules.
According to the predictions, water form clusters both in the paint films and in the pure
copolymer. Degree of clustering and the change of mean cluster size with sorption
appears to be larger for the pure copolymer.
v
ÖZ
Aynı formülasyona sahip fakat ba�layıcı madde oranları farklı su bazlı akrilik
boya filmleri ile bu boya filmlerinin ba�layıcı maddesi olan metilmetakrilat-ko-
bütilakrilat kopolimeri içerisinde su buharının sorpsiyon, yayınım ve geçirgenli�ine dair
veriler elde edilmi�tir. Boya filmleri, yapılarında yer alan elementler ile bulundukları
formların, da�ılımlarının, genel olarak yapının, fonksiyonel grupların, bozunma ve
camsı geçi� sıcaklıkları ile yüzey pürüzlülük de�erlerinin bulunması amacıyla enerji
da�ılımı X ı�ınları (EDX), X ı�ınları kırınımı, harita diagramları, taramalı elektron
mikroskopu, fourier transform kızılötesi spektroskopisi, termal gravimetri, taramalı
diferansiyel kalorimetri ve atomik kuvvet mikroskopu kullanılarak karakterize
edilmi�lerdir.
Suyun boya filmleri içerisindeki yayınım ve çözünürlü�ü a�ırlık ölçümüne
dayalı yeni tip bir sorpsiyon cihazı olan manyetik askılı terazi kullanılarak 30 oC
sıcaklıkta ölçülürken benzer veriler saf kopolimer filmi için 30 oC ve 40 oC’ de
toplanmı�tır.
Azalan ba�layıcı miktarına paralel olarak boya filmlerinin yapılarında
barındırabilecekleri maksimum su tutma kapasitelerinde bir azalma görülürken suyun
yayınım ve geçirgenlik katsayısı de�erlerinde artı� gözlenmi�tir. Taramalı elektron
mikroskop resimleri ve harita diagramları ba�layıcı içeri�i az olan boya filmlerinde
pigmentlerin homojen bir �ekilde da�ılmayarak topakla�malar olu�turduklarını
göstermi�tir. Saf kopolimerin ta�ınım özelliklerinin (yayınım, geçirgenlik, su tutma
kapasitesi) %40 ba�layıcı içeren film için elde edilen de�erlere yakın oldu�u
belirlenmi�tir.
Boya filmlerinin ve saf kopolimerin sorpsiyon verisi sırasıyla Flory-Huggins
teorisi ve ENSIC modeli kullanılarak de�erlendirilmi�tir. Zimm ve Lundberg’in
geli�tirdi�i model kullanılarak su moleküllerinin filmler içerisinde ne derece
kümelenme olu�turdukları belirlenmi�tir. Hesaplamalara göre, su hem boya filmleri
hemde saf kopolimer içerisinde kümelenmeler olu�turmaktadır. Kümelenmenin derecesi
ve ortalama kümelenme büyüklük de�erinin saf kopolimerde artı� gösterdi�i tespit
edilmi�tir.

vi
TABLE OF CONTENTS
LIST OF FIGURES ......................................................................................................... ix
LIST OF TABLES......................................................................................................... xiv
NOMENCLATURE ...................................................................................................... xvi
CHAPTER 1.INTRODUCTION .................................................................................... 1
CHAPTER 2.MODELING OF DIFFUSION, SORPTION AND PERMEATION
PROCESSES ............................................................................................ 3
2.1. Basic Equations..................................................................................... 3
2.2. Modeling of Sorption Process............................................................... 4
2.2.1. Constant Diffusion Coefficient Case ........................................... 4
2.2.2. Variable Diffusion Coefficient Case............................................ 5
2.3. Typical Sorption Kinetics ..................................................................... 7
2.4. Modeling of Permeation Process .......................................................... 9
2.5. Modeling of Equilibrium Isotherm..................................................... 11
CHAPTER 3.GENERAL INFORMATION ABOUT PAINT AND EFFECTS
OF ITS INGREDIENTS ON DIFFUSION BEHAVIOUR OF
PAINT- PENETRANT SYSTEMS....................................................... 13
3.1. Ingredients of Paint Material .............................................................. 13
3.1.1. Vehicles ..................................................................................... 13
3.1.2. Solvents...................................................................................... 14
3.1.3. Pigments..................................................................................... 15
3.1.4. Additives.................................................................................... 15
3.1.5. Fillers and Extenders ................................................................. 16
3.2.Effects of Paint Ingredients on Diffusion Process ............................... 16
3.2.1. Effects of Pigments on Diffusion Process ................................. 16
3.2.2. Effects of Additives and Fillers on Diffusion Process............... 18

vii
CHAPTER 4. EXPERIMENTAL STUDIES ............................................................... 20
4.1. Materials ............................................................................................. 20
4.2. Film Preparation Method .................................................................... 20
4.3. Characterization Studies ..................................................................... 21
4.3.1. Scanning Electron Microscope (SEM) ..................................... 21
4.3.2. Energy Dispersive X-Ray (EDX) ............................................. 21
4.3.3. Fourier Transform Infrared Spectroscopy (FTIR) .................... 21
4.3.4. Thermal Gravimetry (TGA) ...................................................... 22
4.3.5. Differential Scanning Calorimetry (DSC) ................................ 22
4.3.6. X-Ray Diffraction (XRD) ......................................................... 22
4.3.7. Atomic Force Microscope (AFM) ............................................ 23
4.4. Solid-Liquid Ratio Analysis ............................................................... 23
4.5. Permeability Studies ........................................................................... 23
4.6. Diffusion Studies ................................................................................ 26
4.6.1. Magnetic Suspension Balance ................................................... 26
CHAPTER 5. RESULTS AND DISCUSSION............................................................ 28
5.1. Characterization of the Paint Films .................................................... 28
5.1.1. Determination of the Thickness and Morphology of the
Paint Films Using Scanning Electron Microscope .................. 28
5.1.2. Surface Micrographs of the Paint Films .................................. 30
5.1.3. Fourier Transform Infrared Spectroscopy Analysis ................ 35
5.1.4. Elemental Composition of the Paint Films .............................. 39
5.1.5. Map of the Paint Films............................................................. 40
5.1.6. Roughness of the Paint Films .................................................. 42
5.1.7. Thermal Analysis ..................................................................... 42
5.1.8. Differential Scanning Calorimetry Analysis of the Paint
Films.. ...................................................................................... 44
5.1.9. X-ray Results ........................................................................... 48
5.2. Solid-Liquid Ratio of the Samples...................................................... 50
5.3. Permeation Studies ............................................................................. 50
5.4. Equilibrium Isotherms ........................................................................ 54
5.5. Diffusion Studies ................................................................................ 61
5.5.1. Diffusion Studies with Paint Films.......................................... 61
viii
5.5.2. Diffusion Studies with Pure Copolymer Film ......................... 65
CONCLUSIONS AND SUGGESTIONS FOR FUTURE WORK................................ 68
REFERENCES ............................................................................................................... 70
APPENDIX .................................................................................................................... 74

ix
LIST OF FIGURES
Figure 2.1. Typical sorption curves: a) Fickian absorption curve, b)
Case II absorption curve, c) Two-stage absorption curve,
d) Sigmoidal absorption curve (Source: Van der Wel and
Adan, 1999) .............................................................................................. 8
Figure 3.1. Effect of PVC on the diffusion coefficients of water
diffusing through alkyd coatings (Source: Bin Liu et al.
2002) ....................................................................................................... 17
Figure 3.2. Water uptake as a function of immersion time: (a) for the
coating containing polyacrylic acid and (b) for the coating
containing polyamine salt (Source: Landolt et al., 2002) ..................... 19
Figure 4.1. Digital photograph of the permeation set-up ........................................ 25
Figure 4.2. Schematic diagram of the permeation set-up ......................................... 25
Figure 4.3. Schematic diagram of experimental set-up for measuring
sorption and diffusivities ........................................................................ 27
Figure 5.1. Scanning electron micrograph taken over the cross section
of paint. Binder content: 40% ................................................................ 29
Figure 5.2. Scanning electron micrograph taken over the cross section
of the paint. Binder content: 30% .......................................................... 29
Figure 5.3. Scanning electron micrograph taken over the cross section
of the paint. Binder content: 20% ......................................................... 30
Figure 5.4. Scanning electron micrograph taken over the cross section
of the paint. Binder content: 10% ......................................................... 30
Figure 5.5. Surface micrographs of the paint having 40% binder at
2500 magnification; (a): opaque side, (b): glossy side ........................... 31

x
Figure 5.6. Surface micrographs of the paint having 30% binder at
2500 magnification; (a): opaque side, (b): glossy side ........................... 31
Figure 5.7. Surface micrographs of the paint having 20% binder at
2500 magnification; (a): opaque side, (b): glossy side ........................... 31
Figure 5.8. Surface micrographs of the paint having 10% binder at
2500 magnification; (a): opaque side, (b): glossy side ........................... 32
Figure 5.9. Surface micrographs of the paint films taken from opaque
sides 20000 magnification for the paint films having; (a):
40%, (b): 30%, (c): 20%, (d): 10% binder ............................................. 33
Figure 5.10. Surface micrographs taken at BS mode for the paint film
having 40% binder at 2000X magnification .......................................... 34
Figure 5.11. Surface micrographs taken at BS mode for the paint film
having 30% binder at 2000X magnification .......................................... 34
Figure 5.12. Surface micrographs taken at BS mode for the paint film
having 20% binder at 2000X magnification .......................................... 35
Figure 5.13. Surface micrographs taken at BS mode for the paint film
having 10% binder at 2000X magnification .......................................... 35
Figure 5.14. FTIR spectrum of the paint film having 40% binder.............................. 37
Figure 5.15. FTIR spectrum of the paint film having 30% binder.............................. 37
Figure 5.16. FTIR spectrum of the paint film having 20% binder.............................. 38
Figure 5.17. FTIR spectrum of the paint sample having 10% binder ......................... 38
Figure 5.18. FTIR spectrum of the pure copolymer.................................................... 39
Figure 5.19. Map of the paint film having 40% binder at 2000X
magnification; blue: calcium, green: titanium, magenta:
silicon, yellow: oxygen, red: magnesium, white: carbon ....................... 40

xi
Figure 5.20. Map of the paint film having 30% binder at 2500X
magnification; blue: calcium, green: titanium, magenta:
silicon, yellow: oxygen, red: magnesium, white: carbon ....................... 41
Figure 5.21. Map of the paint film having 20% binder at 3500X
magnification; blue: calcium, green: titanium, magenta:
silicon, yellow: oxygen, red: magnesium, white: carbon ....................... 41
Figure 5.22. Map of the paint film having 10% binder 5000X
magnification; blue: calcium, green: titanium, magenta:
silicon, yellow: oxygen, red: magnesium, white: carbon ....................... 42
Figure 5.23. TG curves of the paint films ................................................................... 44
Figure 5.24. TG curve of the pure copolymer............................................................. 44
Figure 5.25. DSC curve of the paint film having 40% binder .................................... 46
Figure 5.26. DSC curve of the paint film having 30% binder .................................... 46
Figure 5.27. DSC curve of the paint film having 20% binder .................................... 47
Figure 5.28. DSC curve of the paint film having 10% binder .................................... 47
Figure 5.29. DSC curve of the pure copolymer .......................................................... 48
Figure 5.30. Heat of decomposition as a function of binder content ......................... 48
Figure 5.31. X-ray diffraction diagram of the paint films .......................................... 49
Figure 5.32. The change in relative humidity in the upper compartment
when glossy sides of the films are exposed to deionized
water vapour .......................................................................................... 53
Figure 5.33. The change in relative humidity in the upper compartment
when opaque sides of the films are exposed to deionized
water vapour .......................................................................................... 53

xii
Figure 5.34. The change in relative humidity in the upper compartment
when glossy sides of the films are in equilibrium with the
water vapour of aqueous 2.9 wt% NaCl solution .................................. 54
Figure 5.35. Water vapour sorption equilibria for the paint containing
40% binder at T= 30 oC .......................................................................... 55
Figure 5.36. Water vapour sorption equilibria for the paint containing
30% binder at T= 30 oC .......................................................................... 55
Figure 5.37. Water vapour sorption equilibria for the paint containing
20% binder at T= 30 oC .......................................................................... 56
Figure 5.38. Water vapour sorption equilibria for the paint containing
10% binder at T= 30 oC .......................................................................... 56
Figure 5.39. Equilibrium isotherm of the pure copolymer for T= 30 oC
and 40 oC................................................................................................ 57
Figure 5.40. Clustering function as a function of water vapour activity
for the pure copolymer film .................................................................... 58
Figure 5.41. Mean cluster size as a function of the volume fraction of
water in the pure copolymer film............................................................ 58
Figure 5.42. Clustering function as a function of water vapour activity
for the paint film containing 40% binder ............................................... 59
Figure 5.43. Clustering function as a function of water vapour activity
for the paint film containing 30% binder ............................................... 59
Figure 5.44. Clustering function as a function of water vapour activity
for the paint film containing 20% binder................................................ 59
Figure 5.45. Clustering function as a function of water vapour activity
for the paint film containing 10% ........................................................... 60
Figure 5.46. Mean cluster size as a function of the volume fraction of
water in the paint film containing 40% binder ...................................... 60

xiii
Figure 5.47. Mean cluster size as a function of the volume fraction of
water in the paint film containing 30% binder ...................................... 60
Figure 5.48. Mean cluster size as a function of the volume fraction of
water in the paint film containing 20% binder ...................................... 61
Figure 5.49. Mean cluster size as a function of the volume fraction of
water in the paint film containing 10% binder ...................................... 61
Figure 5.50. Diffusion coefficient of water in the paint films as a
function of its average weight fraction at T=30 oC................................. 64
Figure 5.51. Diffusion coefficient of water in the pure copolymer as a
function of its average weight fraction at 30 oC and 40 oC.................... 66
Figure A1. Fractional mass uptake curves of the paint film containing
40% binder for water vapour pressures of (a): 2075 Pa,
(b):2500 Pa, (c):3500 Pa ......................................................................... 74
Figure A2. Fractional mass uptake curves of the paint film containing
30% binder for water vapour pressures of (a):2280 Pa, (b):
2860 Pa, (c): 3260 Pa.............................................................................. 75
Figure A3. Fractional mass uptake curves of the paint film containing
20% binder for water vapour pressures of (a): 580 Pa, (b):
1630 Pa, (c):2500 Pa, (d): 3000 Pa ........................................................ 76
Figure A4. Fractional mass uptake curves of the paint film containing
10% binder for water vapour pressures of (a):1970 Pa, (b):
2400 Pa, (c): 2950 Pa.............................................................................. 77
Figure A5. Fractional mass uptake curves of the pure copolymer film
at T= 30 oC for water vapour pressures of (a): 2040 Pa, (b):
2620 Pa, (c): 3500 Pa.............................................................................. 78
Figure A6. Fractional mass uptake curves of the pure copolymer film
at T= 40 oC for water vapour pressures of (a): 2040 Pa, (b):
2620 Pa, (c): 3160 Pa, (d): 4120 Pa, (e): 5200 Pa................................... 79
xiv
LIST OF TABLES
Table 3.1. Diffusion coefficient of water in flourinated coatings at
different PVC (Source: Barbucci et al., 1999) ....................................... 17
Table 5.1. Average thickness of the paint films ..................................................... 28
Table 5.2. Average weight percent of elements present in the paint
films ....................................................................................................... 40
Table 5.3. Degradation temperature and mass loss of the films .............................. 43
Table 5.4. Decomposition peak temperatures and heat of
decomposition of the binder ................................................................... 45
Table 5.5. Mass loss values of the samples after the first and second
drying processes...................................................................................... 50
Table 5.6. Permeability coefficients of water vapour through pure
copolymer and paint films having 40%, 30%, 20%, 10%
binder ...................................................................................................... 52
Table 5.7. Parameters 1� and 2� in Equation 2.20 for varying water
concentrations in paint films................................................................... 62
Table 5.8. Diffusivity data for water - paint system containing 40%
binder at 30 oC ........................................................................................ 63
Table 5.9. Diffusivity data for water - paint system containing 30%
binder at 30 oC ........................................................................................ 63
Table 5.10. Diffusivity data for water - paint system containing 20%
binder at 30 oC ....................................................................................... 63
Table 5.11. Diffusivity data for water - paint system containing 10%
binder at 30 oC ....................................................................................... 63

xv
Table 5.12. Parameters 1� and 2� in Equation 2.20 for varying water
concentrations in pure copolymer film for T= 30 oC.............................. 65
Table 5.13. Parameters 1� and 2� in Equation 2.20 for varying water
concentrations in pure copolymer film for T= 40 oC.............................. 66
Table 5.14. Diffusivity data for water- pure copolymer system at T= 30 oC ................ 66
Table 5.15. Diffusivity data for water- pure copolymer system at T= 40 oC ................ 67

xvi
NOMENCLATURE
A :Area of the membrane; (cm2)
aw :Activity of water vapour
C : Concentration of penetrant molecules; (mol/cm3)
Ceq : Penetrant concentration at equilibrium; (mol/cm3)
Co :Initial concentration of the penetrant in the film; (mol/cm3)
C1L :Concentration of the permeant at lower surface of the membrane;
(mol/cm3)
C1u :Concentration of the permeant at upper surface of the membrane;
(mol/cm3)
D :Diffusion coefficient; (cm2/s)
Deff :Effective diffusion coefficient; (cm2/s)
D0 :Diffusion coefficient at initial concentration; (cm2/s)
Gww :Cluster integral
J :Mass flux; (g/cm2s)
J1o :Mass diffusion flux of solvent relative to velocity of polymer;
(g/cm2s)
kp :Polymer-penetrant interaction parameter for ENSIC model
ks :Mutual penetrant interaction parameter for ENSIC model
L :Thickness of the film; (cm)
Mo :Mass of the film at initial time; (gr)
Mt :Mass of the film at any time; (gr)
xvii
M� :Mass of the film at equilibrium; (gr)
Peff :Effective permeability coefficient; (mol/cm3skPa)
Psolvent :Solvent vapour pressure; (kPa)
P1L :Partial pressure of the permeant in lower compartment; (kPa)
01P :Saturated vapour pressure of the solvent; (kPa)
P1u :Partial pressure of the permeant in upper compartment; (kPa)
P1ui :Partial pressure of the permeant in upper compartment at initial time;
(kPa)
P1u(t) :Partial pressure of the permeant in upper compartment at any time;
(kPa)
q1 :Concentration variable; (gr/ cm3)
*1q :Dimensionless concentration variable of the solvent
q1E :Equilibrium concentration variable of solvent; (gr/ cm3)
q1� :Initial concentration variable of the solvent; (gr/ cm3)
q2� :Initial concentration variable of the polymer; (gr/ cm3)
R :Gas constant; (cm3kPa/mol.K)
RH :Relative humidity; (%)
Seff :Effective solubility coefficient; (mol/cm3kPa)
T :Temperature; (K)
Tg :Glass transition temperature; (K)
T :Time; (s)
t* :Dimensionless time
x :Coordinate in the direction of flux; (m)
xviii
v1 :Mass average velocity of solvent; (cm/s)
v2 :Mass average velocity of polymer; (cm/s)
Vu :Volume of the upper cell; (cm3)
Vw :Partial molar volume of the water; (cm3/mol)
V1 :Specific volume of the solvent; (cm3/gr)
V2 :Specific volume of the polymer; (cm3/gr)
�average :Average weight fraction of the penetrant in the film
�equilibrium :Weight fraction of the penetrant in the film at equilibriums
�initial :Initial weight fraction of the penetrant in the film
�1 :Weight fraction of the solvent
�l� :Initial weight fraction of the solvent
∆H :Heat of decomposition of the binder; (kJ/kg)
χ :Flory-Huggins interaction parameter.
φw :Volume fraction of water in the polymer.
� :Length variable; (cm)
�L :Quantity defined as �L = 2�V2L; (cm)
�* :Dimensionless length variable defined by Equation (2.16)
1 :Mass density of the solvent; (gr/ cm3)
2 :Mass density of the polymer; (gr/ cm3)
� :Exponential constant used in defining concentration dependence of
diffusion coefficient
CHAPTER 1
INTRODUCTION
Paints are often used for their decorative and protective functions. An
underlying substrate can be easily deteoriated by the presence of moisture in the
substrate or at the surface of the substrate. Deteoriating effects of water can be direct or
indirect. When exposed to water in liquid or vapor form, paint eventually swells and
peeling is observed. In addition, water in the paint favors corrosion reactions and
growth of organisms, consequently paint losses its protective and decorative properties.
To know the barrier properties of the paint, its water transport properties must be
known. Nowadays, solvent borne paints are being substitued by water borne paints due
to pressure of the regulations which aimed at reducing the emission of volatile organic
compounds (VOCs). Success in chosing the most appropriate formulation for the water
borne paints coming into the market depends on predicting drying rate of water from the
paint which requires to know transport properties of water in the paint.
Previous studies have shown that paint ingredients which can be grouped as
binders, solvents, pigments, additives, fillers and extenders have strong influence on
structure of the paint films, hence on the diffusion process (Paul, 1985; Bierwagen,
1987; Brown et al., 1997; Barbucci et al., 1998; Corfias et al., 1999; van der Wel and
Adan, 1999; George and Thomas, 2000; Bin Liu et al., 2002; Landolt et al., 2002).
The main objectives of this study are to measure permeability, diffusivity, and
solubility, of water in water borne acrylic based paint containing methylmethacrylate-
co-butylacrylate copolymer as a binder, to characterize structure of the paint films and
to determine the relationship between the structure and transport properties.
In this study, the effect of binder content on the transport properties of water was
investigated. For this purpose, four types of paints which have the same formulation but
differ in the binder amount as 40%, 30%, 20% and 10% were utilized.
To find the relationship between the transport properties and the structure, these
paint films were characterized using scanning electron microscope (SEM), energy
dispersive X-ray (EDX), fourier transform infrared spectroscopy (FTIR), thermal

2
gravimetric analysis (TGA), differential scanning calorimetry (DSC), X-ray diffraction
(XRD) and atomic force microscope (AFM).
Transport properties of small molecules in the polymers are measured by
classical techniques given by Crank and Park (1968) and also by new advanced
electronic, magnetic or nuclear magnetic resonance techniques (Mamaliga et al., 2003).
In this study, magnetic suspension balance which is one of the most reliable and
sensitive apparatus among other gravimetric sorption techniques was used to determine
transport properties of water in both the paint films and the pure copolymer film.
Sorption data were fitted by the Flory-Huggins theory and ENSIC model to be able to
predict maximum water sorption capacity of the films. Thermodynamic models were
also utilized to predict the extend of clustering and mean cluster size of water
molecules.
From practical point of view, industry uses permeability coefficient of water to
directly determine barrier properties of the paint films. Based on this concern,
permeability of water in the paint and the pure copolymer films was also measured.
The thesis consists of four sections. The equations describing the sorption,
diffusion and permeation processes are presented in Chapter 2. Chapter 3 gives general
information about the paint and discusses the effect of its ingredients on diffusion
behaviour of paint–penetrant systems. Experimetal techniques used for characterizing
the samples and for measuring permeability, diffusivity and solubilities are discussed in
Chapter 4. Experimental data and model predictions are discussed in Chapter 5 and
general conclusions and possible suggestions for future work are summarized at the end
of the thesis.

3
CHAPTER 2
MODELING OF DIFFUSION, SORPTION AND
PERMEATION PROCESSES
In this chapter, typical sorption kinetics are discussed and equations describing
the permeation process and the sorption process for both constant diffusion coefficient
and variable diffusion coefficient cases are given. Furthermore, thermodynamic theories
for modeling equilibrium isotherms are discussed.
2.1 Basic Equations
The transport of a penetrant molecule through a polymer film depends on the
solubility of that penetrant molecule within that polymeric membrane and diffusivity
through that system. The transport of some vapours in rubbery polymers follows a
Fickian behaviour if the penetrant molecule is small enough that the relaxation motion
of the polymer chains occurs in a faster rate in comparison to rate of diffusion of small
penetrant molecules. For one dimensional case, Fickian type diffusion can be described
by the Fick’s first and second law;
JxC
D =∂∂− (2.1)
)xC
(D(C)xt
C∂∂
∂∂=
∂∂ (2.2)
In Equations 2.1 and 2.2, J is the the amount of permeant passing through the unit area
of the film in unit time, D is the diffusion coefficient, C is the concentration of penetrant
molecules, x is the coordinate in the direction of flux, and t is the time.

4
2.2 Modeling of Sorption Process
2.2.1 Constant Diffusion Coefficient Case
During the sorption process the paint films with a thickness of L are placed into
the multi-tray sample holders in which one side of the films is exposed to the water
vapour and the other side of the films is based on the impermeable wall of the sample
holder. Important assumptions utilized to model this process is that the diffusion of
water vapour through the polymeric based paint films is one dimensional Fickian type
diffusion. There is no chemical reaction between the water vapour and ingredients of
the paint material. The paint films are subjected to pure deionized water vapour.
Finally, the vapour pressure of the water is small enough that at the end of each
absorption step, the change in the thickness of the sample can be ignored and diffusion
coefficient is independent of the concentration. Under these assumptions, sorption
process is described by Equation 2.3;
2
2
xC
DtC
∂∂=
∂∂ (2.3)
Initially, the concentration of the water, Co, in the paint is the same everywhere;
t=0 → C= C0 (2.4)
At times greater than zero, the concentration of the penetrant at the surface is constant
and equal to its equilibrium concentration, Ceq.
t>0 → x= L C=Ceq (2.5)
and concentration gradient at the lower surface is zero since it is impermeable to
penetrant.
t>0, x= 0, 0xC =
∂∂ (2.6)

5
Analytical solution of the equations given in Equations 2.3 through Equation 2.6 is
given by Crank (1975).
�∞
=
��
���
�−
��
���
�−−−=1n
DtLn
n0
2
xeLn
1)sin1)((n1
2Ct)C(x, (2.7)
If Equation 2.7 is integrated between the limits of x = 0 to x= L then dimensionless
uptake is obtained as follows;
( )
( ){ }222
0m2
0
0t'
t'
t/L12mDexp12m
18-1
MMMM
MM
2 +−+
=−−
= �∞
=∞∞ (2.8)
Crank has shown that at short times as t goes to zero, Equation 2.8 can be simplified as
shown below;
1/2
2'
t'
LDt
2MM
��
���
�=∞
(2.9)
Equation 2.9 points out that for short time interval, mass change curve becomes linear
and diffusion coefficient value can be easily obtained from the slope of the '
't
MM
∞
versus
t graph.
2.2.2 Variable Diffusion Coefficient Case
Experimental sorption curves are not properly described by analytical solution
given by Equation 2.9 when both diffusion coefficient and the thickness of the film
change through a particular step. In this case model equations to determine diffusion
coefficients need to be modified. Recently Alsoy and Duda (2002) have analyzed
unsteady- state sorption of a vapour or liquid by a polymer to investigate the influence
of the moving phase boundary associated with polymer swelling and diffusion- induced
convection. According to their formulation, the species continuity equations for the
solvent denoted by 1 and polymer denoted by 2.

6
( )
0x�
t 111 =
∂∂
+∂
∂ (2.10)
( )
0x�
t 222 =
∂∂
+∂
∂ (2.11)
are converted to the following equation;
0�
Jt
q
t
o1
�
1 =���
����
�
∂∂
+��
���
�
∂∂ (2.12)
after introducing a diffusive flux ( )211o1 ��J −= , a new concentration variable,
22
11 V
q = , and a new length variable ( ) �=
x
022 dxVtx,ξ . If diffusive flux is expressed
in terms of new length and concentration variables,
( )222
o1 VDJ = (2.13)
and is substitued into Equation 2.12, then the sorption process is described by the
following equation:
( )
��
�
∂∂
∂∂=�
�
���
�
∂∂
ξξ12
22�
1 qVD
tq
(2.14)
Equation 2.14 is a nonlinear equation which is subject to the following initial and
boundary conditions:
0�
q
0�
1 =���
����
�
∂∂
=
, ( ) E1L1 qt,q =ξ , ( ) 1o1 q�,0q = , LV� 22oL = (2.15)
This formulation can be put into a dimensionless form utilizing the following
dimensionless variables.
7
1o1E
1o1*1 qq
qqq
−−
= L
*
�
�� = ,
2L
o*
�
tDt = (2.16)
��
�
∂∂
∂∂=
∂∂
*
*1
o
222
**
*1
�
qD
)VD(�t
q (2.17)
0tq
0�
*
*1
*
=���
����
�
∂∂
=
1)t(1,q **1 = ( ) 0,0q **
1 =ξ (2.18)
In systems involving polymers, concentration dependence of small molecule in the film
is usually described by an exponential function. Based on this fact, following expression
can be proposed:
[ ]*1o �qexpDD = (2.19)
where the exponent α is allowed to vary with concentration as follows:
( )[ ]1o121 ww�exp�� −= (2.20)
At very low sorption rates, � approaches to zero, thus, diffusion coefficient remains
constant (D=Do).
The solution of equations (2.17) through (2.20) gives concentration of solvent in
the film (polymer) as a function of position and time. When integrated, theoretical
uptake curve is generated. The diffusion coefficient is obtained by minimizing the
difference between the experimental and theoretical uptake curves.
2.3 Typical Sorption Kinetics
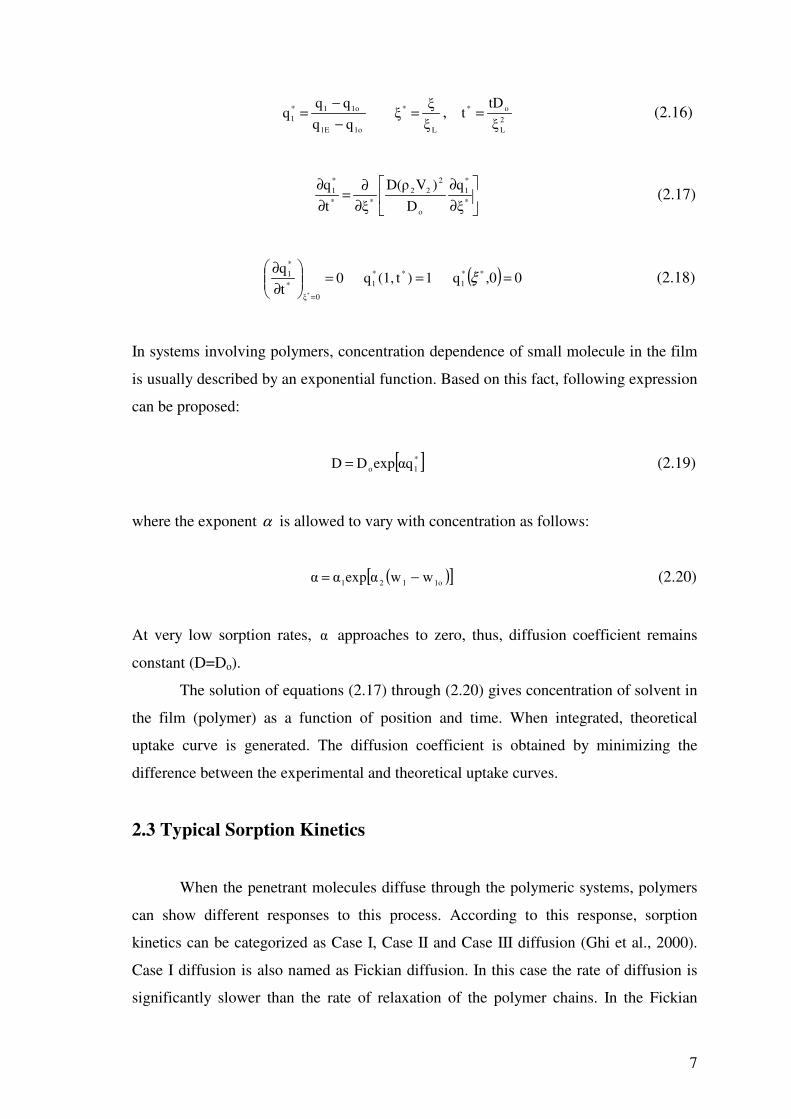
When the penetrant molecules diffuse through the polymeric systems, polymers
can show different responses to this process. According to this response, sorption
kinetics can be categorized as Case I, Case II and Case III diffusion (Ghi et al., 2000).
Case I diffusion is also named as Fickian diffusion. In this case the rate of diffusion is
significantly slower than the rate of relaxation of the polymer chains. In the Fickian
8
sorption when the fractional mass versus square root of time graph is drawn, firstly a
linear part appears. Then the curve reaches to a saturation level. If the sorption process
is a Fickian one, the desorption and absorption curves should overlap (van der Wel and
Adan, 1999). In Case II diffusion, the rate of penetrant diffusion is greater than the rate
of relaxation of the polymer chains. Case III sorption is also known as anomalous
diffusion and this is a general name because there is not only one type of anomalous
diffusion. Some of them are two-stage sorption and the others are sigmoidal sorption.
As the name suggests, in the two stage sorption the curve exhibits two parts as firstly
fast Fickian absorption and secondly slow non-Fickian absorption. In Sigmoidal
sorption, S shaped curve is seen. Figure 2.1 shows typical sorption curves mentioned
here.
(a) (b)
(c) (d)
Figure 2.1: Typical sorption curves: a) Fickian absorption curve, b) Case II absorption curve, c) Two-stage absorption curve, d) Sigmoidal absorption curve (Source: van der Wel and Adan, 1999).
time1/2 (s1/2)
rela
tive
mas
s up
take
(kgk
g-1)
time (s)
rela
tive
mas
s up
take
(kgk
g-1)
time1/2 (s1/2) time1/2 (s1/2)
rela
tive
mas
s up
take
(kgk
g-1)
rela
tive
mas
s up
take
(kgk
g-1)

9
2.4 Modeling of Permeation Process
In the permeation experiments one side of the film with thickness L is exposed
to the water vapour, which can be called as feed side and the other side is exposed to the
atmosphere in the upper volume of the permeation cell and it can be called as permeate
side. To model permeation process through paint films, it is assumed that transport
through the films is one dimensional and can be represented by Fickian diffusion with
an effective diffusivity, Deff.
xC
DJ eff ∂∂−= (2.21)
Furthermore, it is assumed that film with a thickness of L is thin so that steady-
state condition is achieved in the film even though the concentrations on the lower and
upper compartments may change with time. If it is considered that diffusion coefficient
is independent of concentration, then, Equation 2.21 can be integrated from x = 0 to x =
L to find the following expression for the flux, J.
)C(CL
DJ 1u1L
eff −= (2.22)
where C1L and C1u are the concentration of permeant at lower and upper surfaces of the
membrane. If a linear equilibrium relationship between vapour and polymer phase
exists,
C1L = P1L. Seff (2.23)
C1u = P1u. Seff (2.24)
then, amount of permeant passing through the membrane per unit time per unit area, J,
is given as follows
10
)P(PLSD
J 1u1Leffeff. −= (2.25)
where P1L and P1u are partial pressure of the permeant in lower and upper compartments
respectively. The product Deff.Seff in Equation 2.25 is called as permeability coefficient,
Peff. Molecules permeating through the membrane cause an increase in partial pressure
of the permeant in the upper volume of the cell. If vapour phase is assumed to be ideal,
then an increase in pressure of the permeant is given by the following expression;
J.Adt
dPRTV 1uu = (2.26)
where Vu is the volume of the upper cell, A is the area of the membrane and T is the
temperature in the upper compartment. If Equations 2.25 and 2.26 are combined;
)P(PPVA
LRT
dtdP
1u1Leffu
1u −= (2.27)
and if partial pressure of the permeant in the lower compartment is maintained constant,
then Equation 2.27 can be integrated between the limits;
t = 0 P1u = P1ui (2.28)
t = t P1u = P1u(t) (2.29)
to give following expression;
ln tVLARTP
PPPP eff
1u(t)1L
1ui1L =−−
(2.30)
Permeability coefficient, Peff, can be calculated from the slope of 1u(t)1L
1ui1L
PPPP
ln−−
vs time
graph.
11
2.5. Modeling of Equilibrium Isotherm
The Flory-Huggins thermodynamic theory is used for correlating the water
sorption isotherms (Barrie, 1968; Perrin et al,. 1997; Rodriguez et al., 2003). Barrie
(1968) notes that the theory is useful for describing water sorption behaviour in
hydrophobic polymers. Perrin et al. (1997) showed that the water sorption isotherm in
hydrophilic cellulose acetate can be well described by the Flory-Huggins theory for
activities less than 0.7.
According to the Flory-Huggins theory, the relation between activity of water
vapour, aw, and its volume fraction in the polymer, φw is given as follows (Prausnitz et
al., 1986).
2wwww )� (1)�(1ln�lna −+−+= (2.31)
In this expression, χ represents the Flory-Huggins interaction parameter which provides
how much a penetrant can dissolve the polymer. If χ value is less than 0.5, then the
penetrant is a good solvent for the polymer.
The deviation from the Flory-Huggins thermodynamic theory especially at high
penetrant activities lead to another approach derived by Perrin (Perrin et al., 1997). This
model called as ENSIC model takes into account both penetrant-polymer and penetrant-
penetrant interactions by introducing a second interaction parameter, ks for mutual
penetrant interactions. The interactions between the polymer and penetrant are reflected
by the parameter kp, which is comparable to the Flory-Huggins interaction parameter χ.
These two constants are related to the penetrant volume fraction in the polymer by the
following equation.
( )[ ]( ) pps
wpsw /kkk
1akkexp�
−−−
= (2.32)
The thermodynamic theories can also be used to determine extend of clustering.
Water is a unique penetrant due to its polar nature, thus, it can hydrogen bond with itself

12
and can form clusters. Zimm and Lundberg describe a mathematical approach to
determine the extend of clustering based on a cluster integral, Gww, which can be
calculated from the equilibrium sorption isotherm as follows (Rodriguez et al., 2003)
( )
1a/�a
)�(1V
G
TP,w
www
w
ww −
��
�
∂∂
−−= (2.33)
where Vw is the partial molar volume of the water. The quantity Gww/Vw indicates
whether clustering takes place or not. If Gww/Vw = -1, the solution is ideal, indicating
that water molecules do not affect the distribution of other water molecules. If
Gww/Vw>0, water molecules tend to cluster, whereas if Gww/Vw<-1, the water molecules
prefer to remain isolated.

13
CHAPTER 3
GENERAL INFORMATION ABOUT PAINT AND
EFFECTS OF ITS INGREDIENTS ON DIFFUSION
BEHAVIOUR OF PAINT-PENETRANT SYSTEMS
In order to protect the surfaces from some corrosive, deteoriating materials and
obtain aesthetic appearance, one of the most effective and commonly used way is to
coat the surfaces with paints. Paint has a complex structure containing many functional
ingredients. The properties of paint such as adhesion, color, thickness, viscosity, drying
time and barrier property are strongly influenced by its ingredients.
In the first part of this chapter, general information about the paint ingredients
are given. In the second part, the effects of paint ingredients on diffusion process are
discussed.
3.1 Ingredients of Paint Material
Generally paint constituents are grouped in five categories: vehicles, solvents,
pigments, additives, fillers and extenders (Weismantel, 1981; van der Wel and Adan,
1999). Polymer also named as vehicle is the binder material in which other ingredients
are solubilised or dispersed. They represent the matrix structure of the coating and they
are key elements to predict the durability of the coating (Bierwagen, 1987). Solvents
adjust the viscosity of the paint material, pigments give the desired color to the paint
while additives increase the stability of the paint material.
3.1.1 Vehicles
The vehicle is responsible from a continious paint film formation and well
adhesion to the substrate. The vehicles are divided into six groups as solid thermoplastic
film formers, lacquer- type film formers, oxidizing film formers, room temperature

14
catalyzed film formers, heat cured film formers and emulsion type film formers
(Weismantel, 1981).
3.1.2 Solvents
Solvents are used to improve the application properties of paint materials. Most
important function of a solvent is to reduce viscosity sufficiently so that the coating can
be easily applied. In addition, solvents control levelling, flow, gloss, drying time and
durability. Solvents dissolve the film former of coating solution. They separate and keep
apart the droplets of film former in emulsion coatings.
Paints are categorised as waterborne and solvent borne paints. For the solvent
borne paints, solvents are often classified as hydrocarbons and oxygenated solvents.
Hydrocarbon solvents are grouped as aliphatic and aromatic. They differ in the way in
which the carbon atoms are connected in the molecule. This characteristic structural
difference affects the chemical and toxicological properties of the solvent (Weismantel,
1981).
In water borne paints, function of solvent is performed by water. Water borne
coatings have low viscosity so brushability is higher and their flammability is lower. In
addition, they are environmentally friendly products, since the emission of volatile
organic compounds from solvent borne coatings is a major concern. However, the
disadvantages of water borne coatings may arise from their easy foaming properties and
high cost. Furthermore, drying time for water borne paints is longer and some defects in
the form of cracks are frequently observed and water may react with some materials
(Kristoffersson et al., 1998). The most common applications of water borne coatings is
latexes. Latex can be defined as a stable colloidal dispersion of a polymeric substance in
an aqueous medium. Microstructure development of latex coatings can be divided into
three stages: 1)Water evaporation and transformation from a suspension to a porous
medium. 2) Deformation of latex particles due to capillary pressure 3) Final coating
properties development (gloss, opacity, brightness) formed by heat, pressure, aging etc.
(Keddie, 1997; Kristoffersson et al., 1998; Le Pen et al., 2003). In comparison to water
soluble polymers (water can dissolve the binder) polymeric content of the latex is higher
and at the same time viscosity does not increase, due to the low glass transition
temperature, there is no need to add plasticizer (Kristoffersson et al., 1998).
15
3.1.3 Pigments
Paint pigments are solid grains or uniform size particles (Weismantel, 1981).
They are insoluble and dense substances which are suspended into the coating
formulation (van der Wel and Adan, 1999). Paint pigments must be unreactive to
perform their functions. According to their origin and compositions, pigments are
classified into three groups as inorganic, organic, and dispersed pigments (Paul, 1985).
Three important aspects of pigmentation are opacity, color and gloss control.
Opacity is the ability of paint to hide the substrate. Color is due to the ability of
pigments to absorb certain wavelenghts of visible light and reflect the other
wavelenghts. Pigments also control the gloss of paint by affecting the texture of the
coating surface (Weismantel, 1981). By absorbing UV radiation pigments prevent the
degradation of the polymer. Pigment absorbtion spectra and whether the pigment has
photocatalyst property or not are important subjects for a good protection. Some of the
most popular pigments are titanium dioxide, iron oxide, aluminium flakes and zinc
oxide.
3.1.4 Additives
Additives are used in relatively small amount to improve the performance of
coatings (Weismantel, 1981; van der Wel and Adan, 1999). Some necessary properties
which cannot be supplied by the binder or pigments are given by additives to the paint.
Additives also improve certain properties of the vehicle like speed of drying, and
resistance to fading (Weismantel, 1981). The most important additives are pigment
dispersants, rheology modifiers, levelling additives, and antifoams. Antifoams prevent
foam formation. Levelling agents facilitate spreading of the paint over the substrate
surface and homogeneous film formation. Rheology modifiers are used to adjust the
viscosity of paint. Pigment dispersants supply well, homogeneous distribution of the
pigments through the paint (van der Wel and Adan, 1999).

16
3.1.5 Fillers and Extenders
Fillers are generally used to lower the paint price. They increase the hardness of
the paint material. Talc, clay, chalk, quartz, are the filler materials used for these
purposes (van der Wel and Adan, 1999).
Extenders are type of inorganic pigments. They are mainly added to the paint
systems to a) control the rheological properties of paints, b) reduce settling tendency of
pigments, c) improve flow properties, d) reduce gloss, e) increase the opacity of white
hiding pigments, f) improve mechanical properties, g) increase the barrier properties of
paint films (resistance of films towards diffusion of water and agressive gases) (Paul,
1985).
3.2 Effects of Paint Ingredients on Diffusion Process
Transport properties of polymers may exhibit differences when they are used as
paint constituents. Because, besides polymer; paint consists of pigments, solvents,
additives, fillers and extenders, and each of these ingredients affects transport behaviour
(van der Wel and Adan, 1999).
3.2.1 Effects of Pigments on Diffusion Process
To obtain a high quality paint essential amount of pigments must be contained
in the paint material due to their useful contributions. The amount of pigments and
fillers relative to the amount of binder is known as pigment volume concentration
(PVC). It is known that inorganic pigments and extenders are dense, and impermeable
substances and their solubilities are less or they are non soluble. Because of these
properties, pigments improve the barrier properties of paints. In order to perform their
functions all of the pigments must be completely wetted by the binder material. Thus,
binder should be found in the paint in a sufficient amount. When the amount of binder is
such that the total pigment volume is completely wetted, PVC is called as critical
pigment volume concentration (CPVC). If the amount of pigments is increased
unlimitedly, percentage of binder decreases to a very low amount, in other words if
CPVC is exceeded all of the pigments cannot be wetted by the binder material

17
completely. In this case, the structure of the paint becomes porous and the rate of water
transport through the paint increases. Consequently, the barrier properties of the paint
significantly decreases. Bin Liu et al., (2002) investigated the effect of changing
pigment amount on the water vapour diffusion behaviour of alkyd based coatings. They
used micaceous iron oxide as the pigment material in the coatings and PVC was
changed as 40%, 50%, 60%, and 70%. Their results have shown that diffusion
coefficient of water in the coating decreased when PVC increased up to 60% as
illustrated in Figure 3.1. Based on these results, they have concluded that 60%
corresponds to CPVC above which pigment binder interface becomes porous due to
insufficient wetting of pigments, thus, diffusion coefficient increases.
Figure 3.1: Effect of PVC on the diffusion coefficients of water diffusing through alkyd
coatings (Source: Bin Liu et al., 2002).
Barbucci et al. (1998) also found that diffusion coefficient of water in
flourinated coating changes with PVC. Their results are tabulated in Table 3.1.
Table 3.1: Diffusion coefficient of water in flourinated coatings at different PVC. (Source: Barbucci et al., 1999).
PVC D (cm2/s)
0 2.5x10⁻⁵
7 4.0x10⁻⁵
10 2.1x10⁻⁵
D (c
m2 /s
)
18
Not only the binder amount but also the size, shape and the geometry of the
pigment influence the CPVC (Paul, 1985) and coating durability (Bierwagen, 1987). In
an ideal case of pigmentation, the pigments should be well dispersed. Degree of
dispersion of the pigment is closely related to the coating protection capacity since
pigments and polymer interact in the coating. Moreover, if flocculation occurs, the
pigment particles cannot be wetted completely and the wetting process is not successful.
For this reason even if the CPVC is not exceeded, due to the insufficient wetting of the
pigments, a porous structure can be observed and barrier property of the paint decreases.
Brown et al. (1997) studied the effect of PVC and the size of the latex particles on the
pigment distribution in water-borne coatings. They reported that heterogeneous
distribution and forming clusters in the pigment crystals cause to high water vapour
permeability in emulsion paints. They stated that pigment clustering is due to size and
size distribution of latex particles as well as the number and size distribution of the
pigment particles.
3.2.2 Effects of Additives and Fillers on Diffusion Process
Paint is a very complex structure containing many groups. The polarity of these
groups are usually different from each others, especially in water borne paints, the
polarity difference between the groups increases. One of the important functions of the
additives is to enable compatibility between these different groups in the paint.
However, additives are known as hydrophilic materials, thus, they cause an increase in
water permeation rate and a decrease in barrier property of the paint (van der Wel and
Adan, 1999). One of the commonly used additives are pigment dispersants. They
provide a physical barrier around pigment particles to prevent flocculation (Brisson and
Haber, 1991). In order to investigate the type of dispersion agent on the barrier
properties of water borne epoxy coating, Landolt et al. (2002) performed experiments
by using two types of coating with the same formulation containing polyacrylic acid and
polyamine salt as dispersing agent. In Figure 3.2 water uptake behaviours of the
coatings were represented. According to the figure, water uptake values of the coating
which contain polyacrylic acid is higher which means that it has relatively bad barrier
properties in comparison to the coating containing polyamine salt. This result showed
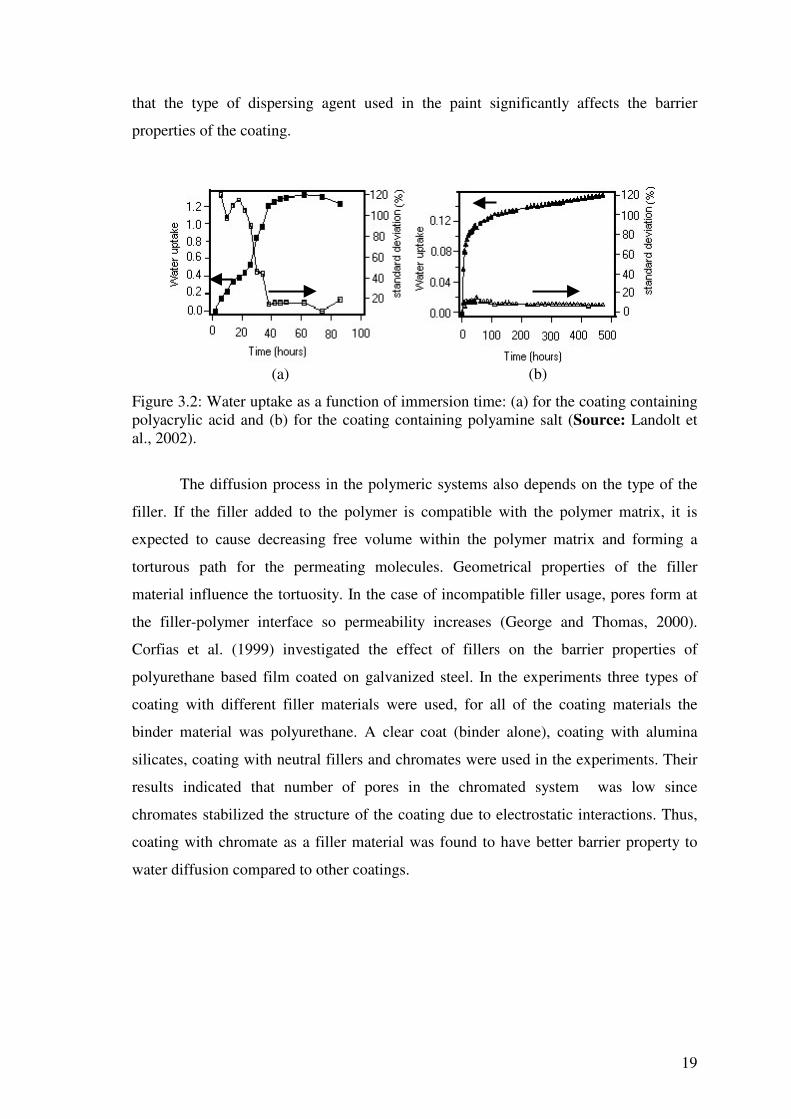
19
that the type of dispersing agent used in the paint significantly affects the barrier
properties of the coating.
(a) (b)
Figure 3.2: Water uptake as a function of immersion time: (a) for the coating containing polyacrylic acid and (b) for the coating containing polyamine salt (Source: Landolt et al., 2002).
The diffusion process in the polymeric systems also depends on the type of the
filler. If the filler added to the polymer is compatible with the polymer matrix, it is
expected to cause decreasing free volume within the polymer matrix and forming a
torturous path for the permeating molecules. Geometrical properties of the filler
material influence the tortuosity. In the case of incompatible filler usage, pores form at
the filler-polymer interface so permeability increases (George and Thomas, 2000).
Corfias et al. (1999) investigated the effect of fillers on the barrier properties of
polyurethane based film coated on galvanized steel. In the experiments three types of
coating with different filler materials were used, for all of the coating materials the
binder material was polyurethane. A clear coat (binder alone), coating with alumina
silicates, coating with neutral fillers and chromates were used in the experiments. Their
results indicated that number of pores in the chromated system was low since
chromates stabilized the structure of the coating due to electrostatic interactions. Thus,
coating with chromate as a filler material was found to have better barrier property to
water diffusion compared to other coatings.

20
CHAPTER 4
EXPERIMENTAL STUDIES
Experimental studies can be grouped into three categories as characterization,
permeation and diffusion studies. In the first part of this chapter, all characterization
techniques used to identify the structure of the paint films are introduced. In the second
part, details of the experimental set-ups and procedures followed for measuring
permeability and diffusivities are discussed.
4.1 Materials
In this study four types of paints which have the same formulation but differ in
the binder amount as 40%, 30%, 20%, 10% were utilized. The binder used in paint
formulation is methylmethacrylate-co-butylacrylate copolymer. Paint samples were
supplied by Akril Kimya A.�. Some experiments were done by using binder alone
(methylmethacrylate-co-butylacrylate copolymer) in order to compare the results
obtained from the experiments in which paint samples were used. Binder material was
supplied by Organik Kimya A.� in the form of an emulsion consisting of 50%
copolymer, 50% water and 110 ppm residual methylmethacrylate.
4.2 Film Preparation Method
Paint films were prepared by casting the solution onto a clean and smooth glass
substrate through an automatic film applicator (Sheen-1133N). For characterization
studies, all paint films were prepared by using a blade with a thickness of 300 µm. For
permeability and diffusion studies paint films were prepared using the blades with a
gap of 120, 250, and 300 µm. In order to evaporate the water contained in the films,
they were dried in the vacuum oven at 100 oC for an hour. Dried films were placed in a
deionised water bath to detach them from the glass substrate easily. Duration time in the
water bath was different for each film ranging from 30 seconds to 37 minutes. For the

21
final drying process the detached films were again replaced in a vacuum oven at a
temperature of 100 oC for 72 hours.
4.3 Characterization Studies
4.3.1 Scanning Electron Microscope (SEM)
Scanning Electron Microscope (Philips XL 30 S FEG) was used to determine
structure of the paint films from their opaque and glossy surfaces at various
magnifications using secondary electron imaging (SEI) and back scattering (BS)
detectors. In addition, cross sectional micrographs were taken to measure average
thickness of the paint films using only SEI detector. At the same time SEI mode
allowed to observe possible structural differences between opaque and glossy sides of
the paint films. In BS mode, compositional contrast was seen in the images of the paint
films, and this contrast was used to evaluate the distribution of different phases and
compounds in the paint films.
4.3.2 Energy Dispersive X-ray (EDX)
EDX analysis was carried out on the opaque surfaces to determine the elements
in the paint films. In this analysis, data were collected from 20 randomly chosen points
and by taking arithmetic mean of these values, average weight percent of the elements
found in the films was calculated.
The elements investigated in the EDX were represented by a different colour
and map diagrams were formed. By using these diagrams, the degree of homogenity in
the distribution of the elements in the paint films with different binder amount was
observed.
4.3.3 Fourier Transform Infrared Spectroscopy (FTIR)
FTIR spectrophotometer (Shimadzu 8601 PC) was used to obtain functional
groups in the paint samples. The resolution was 4 cm-1. The range of the wavenumber
was between 400 and 4600 cm-1. Sensitive pyroelectric type of DLATGS (deuterium
22
triglyceride sulfide which is adapted by L-alanine ) element was mounted on the FTIR –
8601 PC as a detector.
4.3.4 Thermal Gravimetry (TGA)
In order to observe changes in thermal events in the paint films related to
changing binder amount, thermal gravimetric analysis was done by using Shimadzu
TGA-51. The samples were placed into the alumina crucible. Weight of the samples
was 8.683, 9.164, 7.989, 9.968 mg for the paint films which have 40%, 30%, 20%, 10%
binder, respectively. Samples were heated up to 1000 oC with a heating rate of 10 oC/min. During the heating of the samples, nitrogen gas was used as the purge gas with
a flow rate of 30 ml/min except that in the paint with 30% binder, the flow rate of the
nitrogen gas was 40 ml/min. TG analysis of the pure copolymer with a weight of 9.46
mg was done under the same conditions except that the heating process was applied up
to 600 oC.
4.3.5 Differential Scanning Calorimetry (DSC)
Differential Scanning Calorimetry (Shimadzu DSC-50) was used to determine
the glass transition temperatures of the paint films. Films whose weights change
between 2.6 –3.4 mg were placed into the aluminium crucible. Then, they were heated
up to 500 oC with a heating rate of 1 oC /min until 30 oC and 5 oC/min above 30 oC
using nitrogen as a purge gas with a flowrate of 40 ml/min.
4.3.6 X-Ray Diffraction (XRD)
Philips X’Pert Pro diffractometer was used to investigate the crystalline form of
the elements present in the paint films. The operating conditions were 45 kV and 45
mA. CuKα radiation, λ = 0.15406 Ao, was carried out. The range for the X-ray scan
was made over 2θ values of 5-70 oC with a scan speed of 0.06o/second. X’Pert
Graphics & Identify software was used to record the XRD intensities. The data
collector was X’Pert data collector. The crystalline peaks were identified by matching

23
with standard reference patterns from PCDFWin database maintained by the
International Centre for Diffraction Data (ICDD).
4.3.7 Atomic Force Microscope (AFM)
AFM was used to measure the roughness of the paint films. Analysis was done
by using Digital Instrument Multimode Nanoscope SPM 4, and both in contact mode.
The measurements were carried out in ambient air. In contact mode, OTR8-35 Si
cantilever was used. The lenght of the cantilever and the resonance frequency were
between 100-200 µm and 73-24 kHz, respectively.
4.4 Solid-Liquid Ratio Analysis
The solid-liquid ratio of the liquid paint samples and also pure copolymer were
investigated by using Sartorius Moisture Analyzer (MA 100) device. The liquid samples
were cast onto the aluminium pans and the initial mass of the samples and the tares of
the pans were measured in the Sartorius Electronic Balance that has a resolution of 0.1
mg. Standard drying was selected as heating program and the temperature was set to 70 oC. Until the temperature reach the set value, an empty pan was placed into the device.
While changing the pans, the maximum temperature deviations caused by opening of
the device is 4 oC for a minute. Thus, it could be said that the drying kinetics of the
samples was studied under constant temperature. Drying period in the moisture analyzer
device was two hours. At the end of the first drying period, the dried samples except
pure copolymer were placed into a vacuum oven which works under vacuum at 80 oC.
At certain time intervals, weight of the samples was measured and the drying process
continued until no change in weight of the samples was observed which lasted for two
weeks.
4.5 Permeability Studies
Permeability studie were performed in a vessel consisting of three separable
parts as shown in Figure 4.1. A schematic diagram of the permeability set up is
illustrated in Figure 4.2. The bottom part contains a small bath filled with the solvent

24
used in the permeability studies. In this study, deionized water, 2.9% and 5% (by
weight) NaCl solutions were used as solutes. The middle part of the set up consists of a
hole whose diameter is 3.83 cm. The inside diameter of the middle part is 5.8 cm. Films
were cut in such a manner that their diameters are nearly equal to the inside diameter of
the middle part so that area of the hole is fully covered. The films were placed into the
section by using vacuum gress oil. The ring was put over the films to keep the constant
position of the films and prevent any possible leakage which may be seen in the areas
other than effective hole area. In most of the experiments the rings were renewed in
order to prevent contamination which may remain from the previous experiments. The
last part which is the upper part of the permeation set up consists of a probe to read the
humidity of the upper section. When the solvent transport proceeds through the films,
an increase in relative humidity of the upper section is read by the probe and the relative
humidity, time and temperature data collected are stored in the internal memory of the
probe (Datalogger SK-L 200 TH).
During typical permeation experiments the bottom of the middle part was
covered tightly with the parafilm and then the film under investigation was placed to the
upper part of the middle section and ring was placed over the film. The upper part
which contains humidity sensor was linked to the middle section and exposed to dry air
during six hours. Just before the drying air was passed through the system, the initial
humidity was recorded. These humidity values changed from one experiment to another
between the range of 29.9- 58.3%. Drying of the films was performed by using an air
pump (EP-6500). First of all, the air was pumped to the drying column which contains
anhydrous CaSO4 and molecular sieve 5A and then it was transported to the upper part
of the permeation set up with a flowrate of 610 ml/min. At the end of the drying
process, the humidity of the upper section was completely lowered to the value of 5%.
The purpose of drying the upper part of the films was to remove water in the films. As
it was explained in the film preparation method section, the films detached from the
glass substrate were placed into the oven which works under vacuum at 100 oC during
72 hours. However, when they are exposed to the atmosphere, they absorb some amount
of water vapour from the air due to the concentration gradient. Another reason for six
hours drying was to allow uniform concentration in the upper part of the set-up. After
the drying process was completed, the parafilms under the middle section was removed
and the middle and upper sections was linked together to the bottom section. The set up
was completely tighted by the help of steel rings placed on top of the upper part and

25
when tight connection was provided between all parts of the device, computer program
was immediately started to record increasing relative humidity values caused by the
water transport through the membrane. Time interval to collect the relative humidity
and temperature data was selected as 10 seconds.
Figure 4.1: Digital photograph of the permeation set-up.
Figure 4.2: Schematic diagram of the permeation set-up
Pump
Drying column
Computer
Deionized water bath
Sample section
Flowmeter
Humidity sensor

26
4.6 Diffusion Studies
4.6.1 Magnetic Suspension Balance
Magnetic Suspension Balance consists of four groups as main sorption column,
controlling unit, computer and supporting units as shown in Figure 4.3. Main sorption
column consists of microbalance, suspension magnet, coupling housing, measuring load
decoupling, thermostats and the measuring cell. Electromagnet is inside the
microbalance. The resolution of the microbalance is 1 µg, the maximum load is 5 g, and
the reproducibility of the measurements is ± 2 µg. The operating pressure and
temperature of the column are 150 bars and 250 oC, respectively. The important parts of
the supporting units are water bath, vacuum pump, pressure gauge, solvent flask, and
cold trap. The function of the water bath (accuracy is ± 0.5 oC, and the operating range
is between 5 and 150 oC) which stands near to the column is to keep the main sorption
column at a desired temperature. The vapour pressure of the solvent is measured by a
pressure transducer operating within the range of vacuum up to 1 atm. with an accuracy
of 0.25 % full scale. Vacuum is applied to the column by using rotary vane pump which
can apply vacuum up to 0.0001 mbar. A cold trap is installed between the sorption
column and the vacuum pump in order to prevent the corrosion of vacuum pump
caused by the suction of the solvent vapours in the column. Solvent vapour is prepared
in a solvent flask inserted into a constant temperature bath.
In diffusion experiments, multi-tray sample holder was used to place the films
into the measuring cell. Before experiments are started, the column was heated up to 60 oC by using water bath and during the heating of the column, vacuum was applied in
order to remove water desorbed by the paint films due to this heating process. Then, the
program in the software was started and the system is allowed to reach equilibrium in
24 hours. After this preliminary part was completed, experiments were performed in
two ways. In one way, sorption process was started by sending the solvent vapour at
room temperature to the system. For this purpose, solvent vapour was trapped in the line
between the column and solvent valves. The pressure gauge reads the saturated pressure
of the solvent at the ambient temperature. Meanwhile the program in the software was
started and the weight differences under vacuum was recorded until 4-30 measuring
data points were supplied. Then the column valve was opened and solvent vapour was
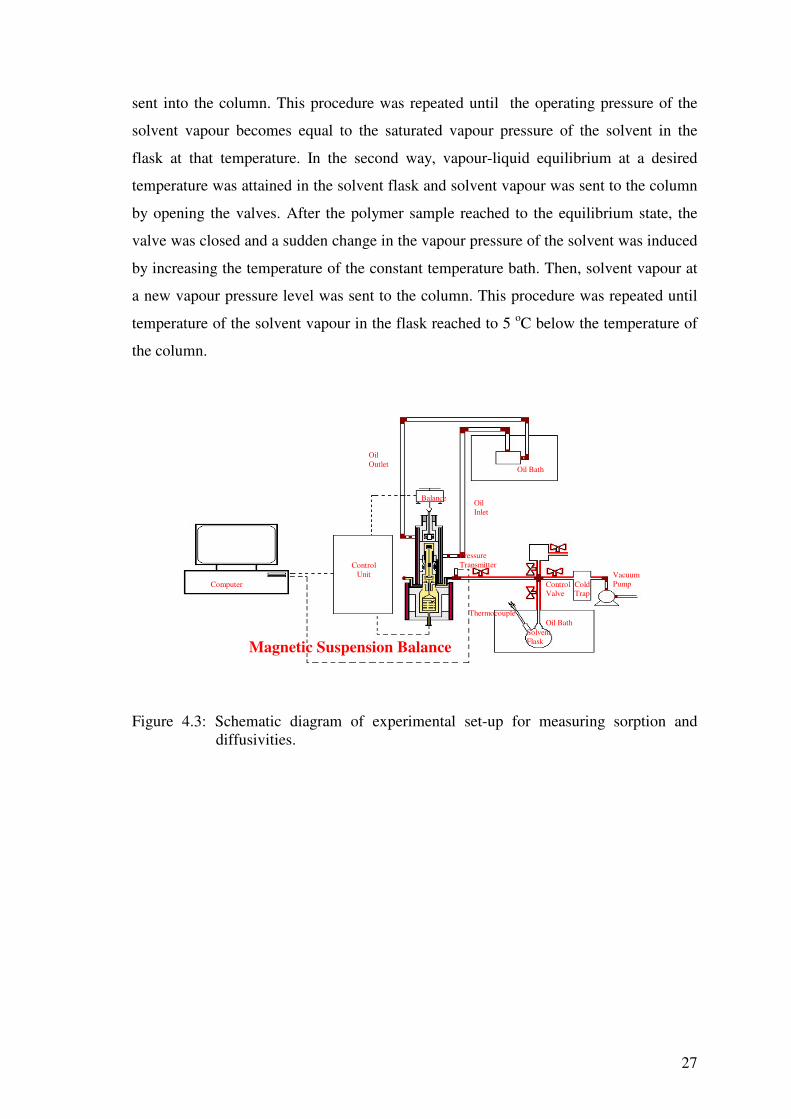
27
sent into the column. This procedure was repeated until the operating pressure of the
solvent vapour becomes equal to the saturated vapour pressure of the solvent in the
flask at that temperature. In the second way, vapour-liquid equilibrium at a desired
temperature was attained in the solvent flask and solvent vapour was sent to the column
by opening the valves. After the polymer sample reached to the equilibrium state, the
valve was closed and a sudden change in the vapour pressure of the solvent was induced
by increasing the temperature of the constant temperature bath. Then, solvent vapour at
a new vapour pressure level was sent to the column. This procedure was repeated until
temperature of the solvent vapour in the flask reached to 5 oC below the temperature of
the column.
Figure 4.3: Schematic diagram of experimental set-up for measuring sorption and
diffusivities.
Oil Outlet
Oil Bath
Oil Inlet
Magnetic Suspension Balance
Computer
Solvent Flask
Vacuum Pump
Control Unit
Balance
Pressure Transmitter
Cold Trap
Thermocouple
Control Valve
Oil Bath
28
CHAPTER 5
RESULTS AND DISCUSSIONS
In this chapter, first of all the results of characterization studies are discussed.
Then, permeability and equilibrium sorption studies are discussed. Finally, the results of
diffusion studies are given.
5.1 Characterization of the Paint Films
5.1.1 Determination of the Thickness and Morphology of the Paint
Films Using Scanning Electron Microscope
Figures 5.1 through 5.4 show the scanning electron micrograph pictures of the
paint films having 40%, 30%, 20%, 10% binder, respectively. Thickness of each film
listed in Table 5.1, was determined from an average of 6 or 7 measurements.
Table 5.1: Average thickness of the paint films.
Sample
Number of points taken
for thickness measurements
Average thickness
(micron)
40% Binder 6 106.7
30% Binder 7 100.2
20% Binder 6 116.6
10% Binder 6 141.3
From the figures it can be seen that the structure of the paint films having 40%
and 30% binder exhibits similarities with each other. These paint films have relatively
less porous structure in comparison to paint films having 20% and 10% binder. The
structural similarity also exists for the paint films having 20% and 10% binder.
According to the cross sectional micrographs, the porosity of these films is relatively
high.
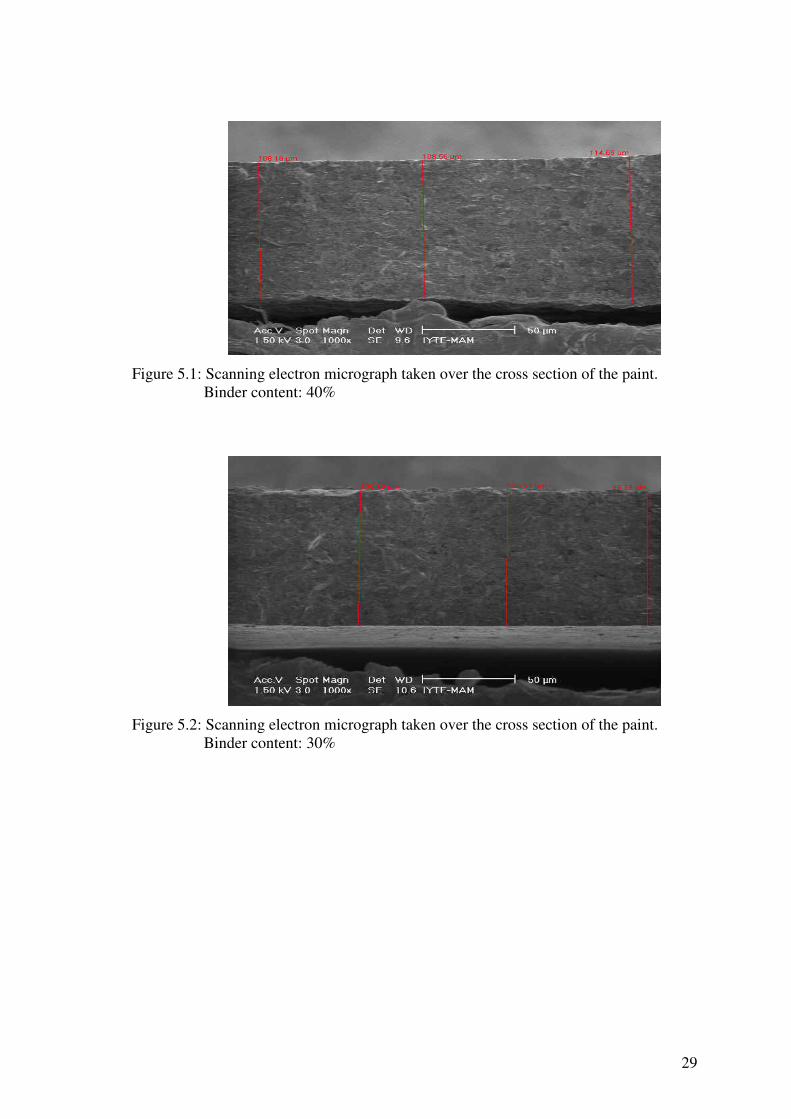
29
Figure 5.1: Scanning electron micrograph taken over the cross section of the paint. Binder content: 40%
Figure 5.2: Scanning electron micrograph taken over the cross section of the paint. Binder content: 30%
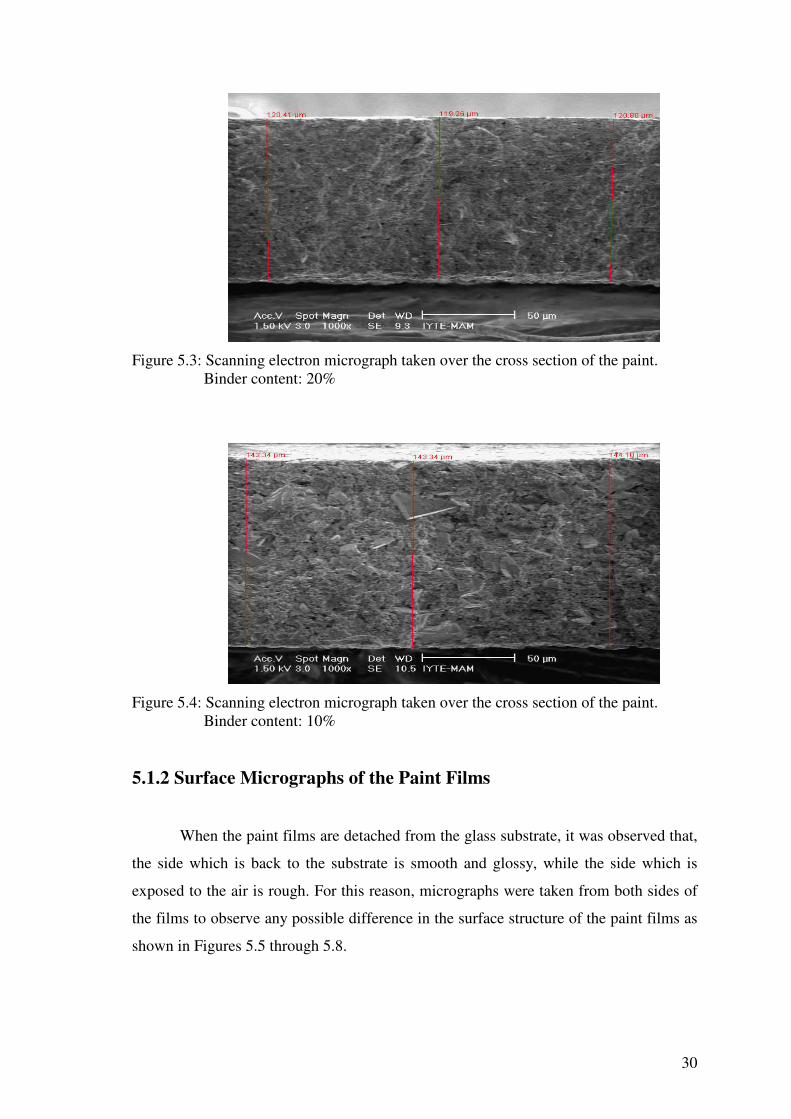
30
Figure 5.3: Scanning electron micrograph taken over the cross section of the paint. Binder content: 20%
Figure 5.4: Scanning electron micrograph taken over the cross section of the paint. Binder content: 10%
5.1.2 Surface Micrographs of the Paint Films
When the paint films are detached from the glass substrate, it was observed that,
the side which is back to the substrate is smooth and glossy, while the side which is
exposed to the air is rough. For this reason, micrographs were taken from both sides of
the films to observe any possible difference in the surface structure of the paint films as
shown in Figures 5.5 through 5.8.

31
(a) (b) Figure 5.5: Surface micrographs of the paint having 40% binder at 2500 magnification; (a): opaque side, (b): glossy side.
(a) (b) Figure 5.6: Surface micrographs of the paint having 30% binder at 2500 magnification; (a): opaque side, (b): glossy side.
(a) (b) Figure 5.7: Surface micrographs of the paint having 20% binder at 2500 magnification; (a): opaque side, (b): glossy side.

32
(a) (b) Figure 5.8: Surface micrographs of the paint having 10% binder at 2500 magnification; (a): opaque side, (b): glossy side.
When micrograph of opaque and glossy sides are compared with each others, it
was seen that the relatively high roughness of the opaque sides is obvious for all of the
paint films. Another important result can be obtained by comparing the surface
micrographs of the paint films with each others as shown in Figures 5.9a through 5.9d.
According to these micrographs the paint having 40% binder almost have a non porous
structure. When the binder amount in the paints decrease from 40% to 10%, more
porous structure was observed in the films and this situation can be observed from both
glossy and opaque sides of the films. It is well known that porous structure formation is
a result of the pigment flocculation caused by insufficient wetting of pigments by the
binder.
Figure 5.9 shows that in the paint having 40% binder, there is a matrix structure
on which the pigments and other fillers exhibit relatively homogeneous distribution.
However, as binder percentage decreases, pigment distribution becomes
nonhomogeneous. Especially in paints having 20% and 10% binder, pigment
flocculation and related to that some pores formed can be clearly seen. From the same
figure it can be seen that although micro structure of the all paint films exhibit
differences, it is difficult to distinguish the paint structures having 40% and 30% binder
and also paints having 20% and 10% binder are similar. The remarkable difference in
paint structures is observed when the binder amount is reduced from 40% to 20%.

33
(a) (b)
(c) (d)
Figure 5.9: Surface micrographs of the paint films taken from opaque sides at 20000 magnification for the paint films having; (a): 40%, (b): 30%, (c): 20%, (d): 10% binder.
In the micrographs of the films taken by using BS detector, the compositional
contrast give a good visual distinction between the copolymer matrix, pigments and
pores contained in the paint films. As it is known that, the light regions in the
micrographs show the heavier molecules and the dark regions show the lighter
molecules. Also black regions seen in the graphs are attributed to the presence of the
pores. Surface micrographs of each paint film taken at BS mode are shown in Figures
5.10 through 5.13. The presence of white regions in each graph indicates titania
molecules in the structure.

34
Figure 5.10: Surface micrographs taken at BS mode for the paint film having 40% binder at 2000X magnification.
Figure 5.11: Surface micrographs taken at BS mode for the paint film having 30% binder at 2000X magnification.
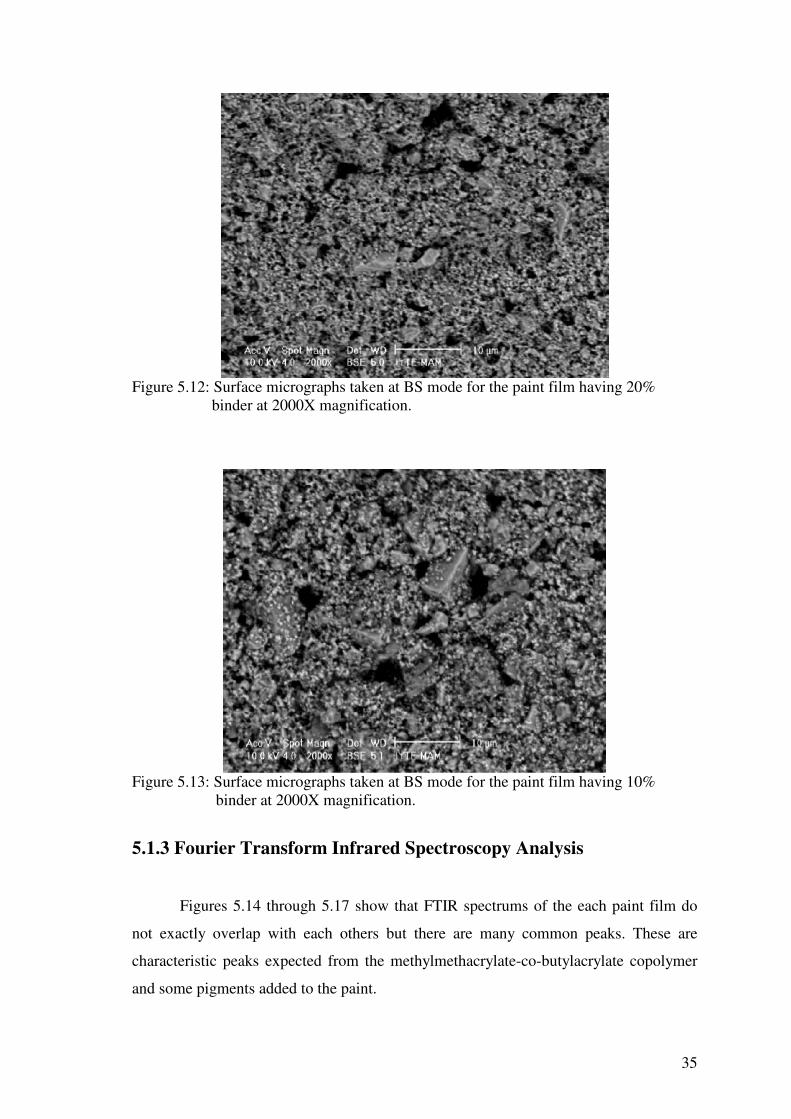
35
Figure 5.12: Surface micrographs taken at BS mode for the paint film having 20% binder at 2000X magnification.
Figure 5.13: Surface micrographs taken at BS mode for the paint film having 10% binder at 2000X magnification.
5.1.3 Fourier Transform Infrared Spectroscopy Analysis
Figures 5.14 through 5.17 show that FTIR spectrums of the each paint film do
not exactly overlap with each others but there are many common peaks. These are
characteristic peaks expected from the methylmethacrylate-co-butylacrylate copolymer
and some pigments added to the paint.

36
Common peak ranges at the spectrum are as follows:
3600-3060 cm-1: OH group is observed due to the presence of water. In addition, C-H
streching vibrations absorb in between 3000-2900 cm-1.
1797.53 cm-1; 1751.24 cm-1: All saturated esters have strong sharp absorption peak at
about 1740 cm-1 due to the C=O streching mode.
1720.39-1635.52 cm-1: Liquid H2O absorbs near 1640 cm-1. In acrylates and
methacrylates C=O absorb at 1725 cm-1.
1260-1000 cm-1: In the paint films this range corresponds to strong Si-O bands. It is
known that silica absorbs near 1100 cm-1 .
700-500 cm-1: TiO2 has its strongest bands in the 700-500 cm-1 region and all paint
samples gave peaks between these wavelenghts (Colthup et al., 1990).
Vitala et al. (2000) studied the morphology, microstructure, and chemical
composition of pure and Ca and P doped TiO2 films. They reported that TiO2 show a
strong broad absorption band in the region 1000-400 cm-1and this bands correspond to
the formation of Ti-O-Ti bonds. In their spectra the bands between 600-450 cm-1 was
attributed to the amorphous TiO2. Burgos and Langlet (1999) mentioned about the TiO2
sol-gel reactions and in IR studies they found bands belonging to Ti-O and Ti-O-Ti
groups in the range of 800-400 cm-1. All paint films used in this study exhibit
absorbtion bands between the values mentioned above, which confirm the presence of
TiO2.
Reig et al. (2002) proposed constant ratio method for the quantitative analysis of
calcite and quartz in geological samples. They reported that calcite is one of the three
crystalline forms of calcium carbonate, the other ones are aragonite and vaterite, and all
of these crystal minerals are represented by the same chemical formula but do not
exhibit same infrared spectrum. Although there are three types of calcium carbonate
crystal, the most commonly seen form of calcium carbonate is calcite. In their article
FTIR spectrums of calcite is given as 1420, 875 and 712 cm-1. The band which
represent the silica was reported as 798 and 779 cm-1 and stated that quartz is one of the
minerological forms of the silica and there are large amount of quartz in the nature.
Sönmez and Cebeci (2003) stated that IR bands at 854.4 and 875.6 cm-1 are
characteristics of the carbonate in calcite.

37
Figure 5.14: FTIR spectrum of the paint film having 40% binder.
Figure 5.15: FTIR spectrum of the paint film having 30% binder.
500.01000.01500.02000.03000.04000.01/cm
2.0
3.0
4.0
5.0
Abs
500.01000.01500.02000.03000.04000.01/cm
2.0
3.0
4.0
5.0
Abs

38
500.01000.01500.02000.03000.04000.01/cm
2.5
3.0
3.5
4.0
Abs
Figure 5.16: FTIR spectrum of the paint film having 20% binder.
500.01000.01500.02000.03000.04000.01/cm
2.5
3.0
3.5
4.0
Abs
Figure 5.17: FTIR spectrum of the paint film having 10% binder.

39
500.01000.01500.02000.03000.04000.01/cm
0.0
1.0
2.0
3.0
4.0
Abs
Figure 5.18: FTIR spectrum of the pure copolymer.
5.1.4 Elemental Composition of the Paint Films
EDX results were obtained for each paint film by analysing randomly selected
20 different points over their opaque sides and results were evaluated by taking average
of the values collected from these points. Average weight percent of elements present in
the paint films are represented in Table 5.2. According to the EDX results the common
elements seen in each film are carbon, oxygen, titanium, calcium, silicon, aluminium,
magnesium, and sodium. The average amount of carbon element decreases as the binder
percentage decreases, however, oxygen amount remains nearly the same. According to
the X-ray analysis results, all elements except oxygen and carbon are found as oxygen
containing compounds in the paint, while carbon is only seen in calcite besides binder
material. Since these oxygen containing elements are found in a significant amount in
the paint having 10% binder, it is not surprising to see relatively high amount of oxygen
and low amount of carbon in this paint.

40
Table 5.2: Average weight percent of elements present in the paint films.
Binder (%)
C O Na Mg Al Si Ca Ti
40 50.3 37.4 0.7 0.9 1 3.2 2.7 3.8 30 45.2 40.9 0.8 1 1.1 3.8 3.4 3.8 20 41.6 42.3 0.7 1.1 1 3.3 4.3 5.7 10 26.9 42.2 0.9 1.3 1.5 5.2 9.4 12.5
5.1.5 Map of the Paint Films
In Figures 5.19 through 5.22 map diagrams of the paint films are shown.
According to these figures map diagrams belonging to 40% and 30% binder indicate
relatively homogeneos distribution of elements. Especially in the paint having 40%
binder a homogeneous distribution is very remarkable. In paint having 30% binder
calcium element which is represented by blue colour exhibits some flocculations in
some regions. The formation of flocculations in silicon and calcium elements in the
paint having 20% binder is very obvious. The most heterogeneous distribution of
elements is observed in the paint having 10% binder, as shown in Figure 5.22.
Figure 5.19: Map of the paint film having 40% binder at 2000X magnification; blue: calcium, green: titanium, magenta: silicon, yellow: oxygen, red: magnesium, white: carbon.

41
Figure 5.20: Map of the paint film having 30% binder at 2500X magnification; blue: calcium, green: titanium, magenta: silicon, yellow: oxygen, red: magnesium, white: carbon.
Figure 5.21: Map of the paint film having 20% binder at 3500X magnification; blue: calcium, green: titanium, magenta: silicon, yellow: oxygen, red: magnesium, white: carbon.

42
Figure 5.22: Map of the paint film having 10% binder at 5000X magnification; blue: calcium, green: titanium, magenta: silicon, yellow: oxygen, red: magnesium, white: carbon.
5.1.6 Roughness of the Paint Films
The roughness of the paint films was measured using Atomic Force Microscope
in contact mode. For this purpose, each paint film was scanned at five different surfaces
over 100 µm x 100 µm areas. According to the AFM results, the average overall
roughness of the paint films having 40%, 30%, 20% and 10% binder are 133.8, 124.7,
144.3 and 144.3 nm, respectively in terms of Ra values. Here Ra, the height variance of
the line/surface, corresponds to the following expression (Cannon and Pethrick, 2002).
avg
n
ii ZZ
n1 −� (5.1)
5.1.7 Thermal Analysis
Figures 5.23 and 5.24 show the TGA curves of the paint films and pure
copolymer film, respectively. According to these results, degradation process of the
paint films occur at two steps, whereas the thermal degradation of the pure copolymer
film occur at one step. Another difference in the degradation mechanism of the paint
films and pure copolymer is that at the end of the degradation process all paint films left

43
thermally stable char. However, pure copolymer film degraded until losing all of its
mass, a thermally stable char was not observed. In Table 5.3, degradation temperatures
of the films and mass losses are summarized. It is seen that if the binder amount in the
paint decreases, the total mass loss of the paint decreases.
Table 5.3: Degradation temperature and mass loss of the films.
Sample Total mass loss (%)
First step mass loss (%)
Second stepmass loss (%)
Tonset
of first step (oC)
Tendset
of first step
(oC)
Tonset of second
step (oC)
Tendset of second step
(oC) 40%
binder 47.51 26.36 24.49 257.4 411 667.1 776.2
30% binder
43.67 21.22 24.24 258.3 409.2 668.9 775
20% binder
39.82 15.38 24.94 269.4 400.3 663.8 776.3
10% binder
34.88 9.21 24.89 276.2 400.1 661.7 785.7
Pure binder
99.18 - - 263.6 599.9 - -
Mass loss in the first step is associated with the decomposition of the binder
material, methylmethacrylate-co-butylacrylate. Thus, in this step when the binder
amount in the paint films decreases, mass losses decreases and the temperature range of
the degradation process becomes narrow. For pure copolymer the temperature range for
the degradation process is large compared to the paint films since in this case the sample
contains 100% binder. The second step mass loss is attributed to the degradation of
calcite into calciumoxide and carbondioxide by the following reaction.
CaCO3(s) CaO(s) + CO2(g) (5.2)
At the end of second step mass loss, the residual thermally stable char contains
CaO and titania which are both stable over 1000 oC.

44
Figure 5.23: TG curves of the paint films.
0
20
40
60
80
100
120
0 100 200 300 400 500 600 700
Figure 5.24: TG curve of the pure copolymer.
5.1.8 Differential Scanning Calorimetry Analysis of the Paint Films
Figures 5.25 through 5.29 show the DSC curves of the paint and pure copolymer
films. According to these curves, paint films exhibit two exothermic decomposition
peaks while the pure copolymer exhibits a single decomposition peak. During the
decomposition of the paint films, heat is released due to the thermal oxidation of the
Wei
ght (
%)
Temperature (oC)
Wei
ght (
%)
0
20
40
60
80
100
120
0 200 400 600 800 1000 1200
40% binder30% binder
20% binder10% binder
Temperature (oC)
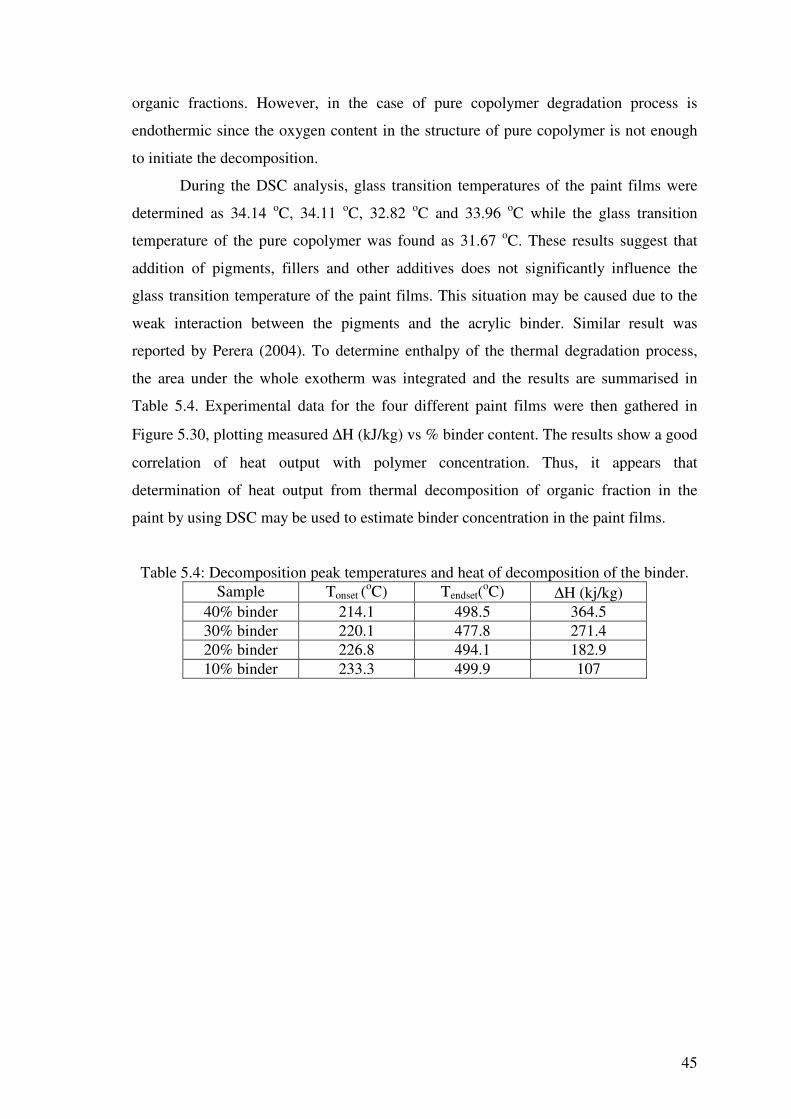
45
organic fractions. However, in the case of pure copolymer degradation process is
endothermic since the oxygen content in the structure of pure copolymer is not enough
to initiate the decomposition.
During the DSC analysis, glass transition temperatures of the paint films were
determined as 34.14 oC, 34.11 oC, 32.82 oC and 33.96 oC while the glass transition
temperature of the pure copolymer was found as 31.67 oC. These results suggest that
addition of pigments, fillers and other additives does not significantly influence the
glass transition temperature of the paint films. This situation may be caused due to the
weak interaction between the pigments and the acrylic binder. Similar result was
reported by Perera (2004). To determine enthalpy of the thermal degradation process,
the area under the whole exotherm was integrated and the results are summarised in
Table 5.4. Experimental data for the four different paint films were then gathered in
Figure 5.30, plotting measured ∆H (kJ/kg) vs % binder content. The results show a good
correlation of heat output with polymer concentration. Thus, it appears that
determination of heat output from thermal decomposition of organic fraction in the
paint by using DSC may be used to estimate binder concentration in the paint films.
Table 5.4: Decomposition peak temperatures and heat of decomposition of the binder. Sample Tonset (oC) Tendset(oC) ∆H (kj/kg)
40% binder 214.1 498.5 364.5 30% binder 220.1 477.8 271.4 20% binder 226.8 494.1 182.9 10% binder 233.3 499.9 107

46
-1
-0.5
0
0.5
1
1.5
2
2.5
3
0 100 200 300 400 500 600
Figure 5.25: DSC curve of the paint film having 40% binder.
-1
-0.5
0
0.5
1
1.5
2
2.5
0 100 200 300 400 500 600
Figure 5.26: DSC curve of the paint film having 30% binder.
Temperature (oC)
Hea
t Flo
w (m
W)
Exo
Temperature (oC)
Hea
t Flo
w (m
W) Exo

47
-1
-0.5
0
0.5
1
1.5
0 100 200 300 400 500 600
Figure 5.27: DSC curve of the paint film having 20% binder.
-1.6
-1.4
-1.2
-1
-0.8
-0.6
-0.4
-0.2
0
0.2
0.4
0 100 200 300 400 500 600
Figure 5.28: DSC curve of the paint film having 10% binder.
Temperature (oC)
Hea
t Flo
w (m
W)
Exo
Temperature (oC)
Hea
t Flo
w (m
W)
Exo

48
-7
-6
-5
-4
-3
-2
-1
0
1
2
3
0 100 200 300 400 500 600
Figure 5.29: DSC curve of the pure copolymer.
Figure 5.30: Heat of decomposition as a function of binder content.
5.1.9 X-Ray Results
At the end of the EDX analysis, the elements in the paint films were determined
and they were listed in Table 5.2. X-Ray analysis was used to determine form of these
elements. This analysis showed that all paint films gave nearly the same spectrums as
shown in Figure 5.31. According to the X-ray diffraction analysis, calcium is in the
form of calcite (CaCO3) as expected which is a compound generally used as a filler in
Temperature (oC)
Hea
t Flo
w (m
W) Exo
Binder (%)
∆H (k
j/kg)
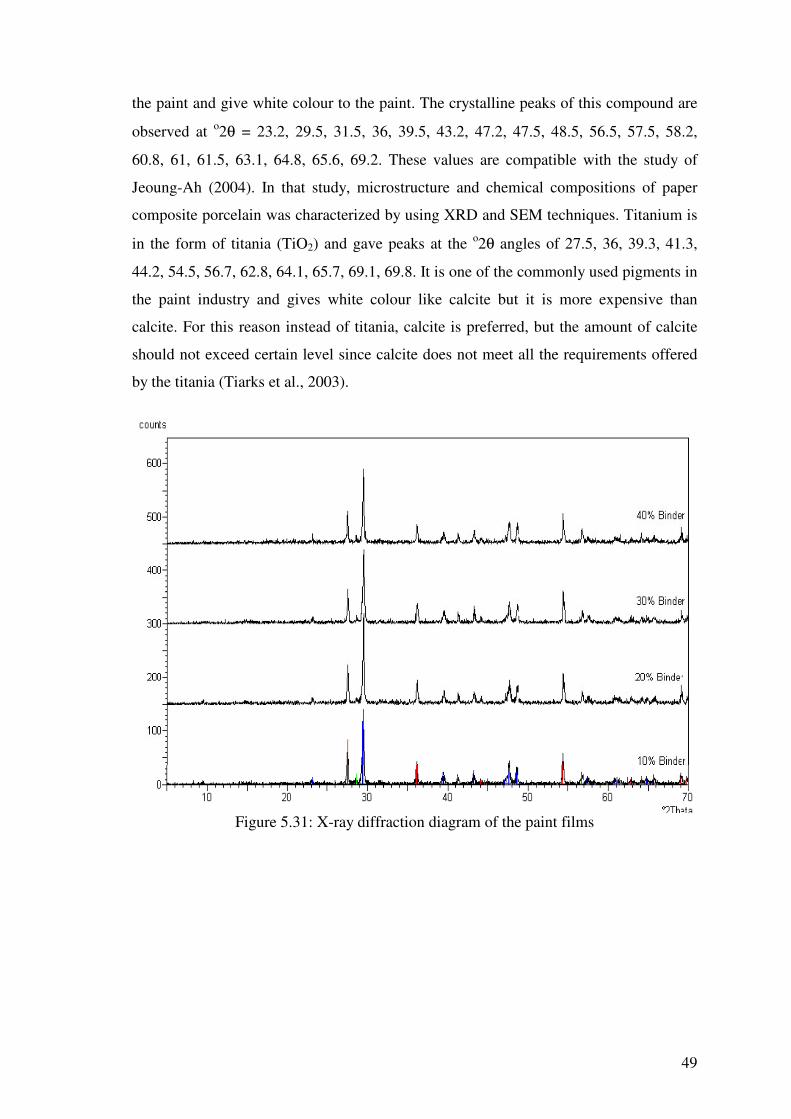
49
the paint and give white colour to the paint. The crystalline peaks of this compound are
observed at o2θ = 23.2, 29.5, 31.5, 36, 39.5, 43.2, 47.2, 47.5, 48.5, 56.5, 57.5, 58.2,
60.8, 61, 61.5, 63.1, 64.8, 65.6, 69.2. These values are compatible with the study of
Jeoung-Ah (2004). In that study, microstructure and chemical compositions of paper
composite porcelain was characterized by using XRD and SEM techniques. Titanium is
in the form of titania (TiO2) and gave peaks at the o2θ angles of 27.5, 36, 39.3, 41.3,
44.2, 54.5, 56.7, 62.8, 64.1, 65.7, 69.1, 69.8. It is one of the commonly used pigments in
the paint industry and gives white colour like calcite but it is more expensive than
calcite. For this reason instead of titania, calcite is preferred, but the amount of calcite
should not exceed certain level since calcite does not meet all the requirements offered
by the titania (Tiarks et al., 2003).
Figure 5.31: X-ray diffraction diagram of the paint films
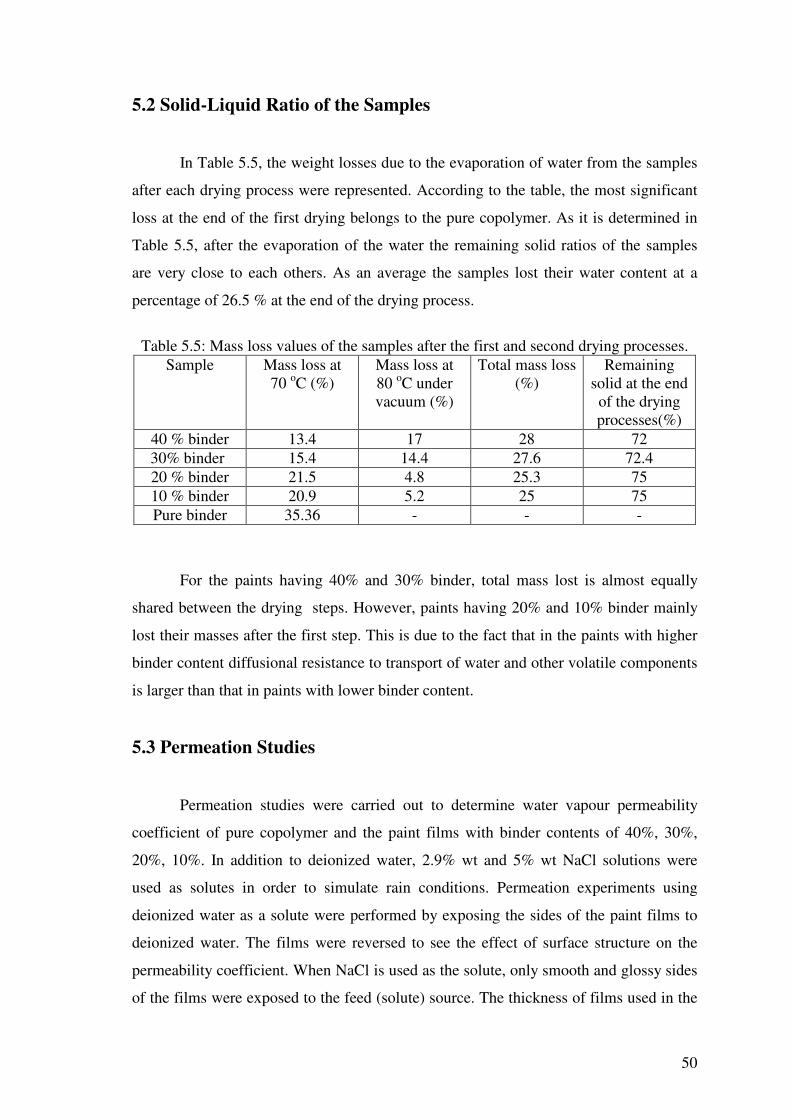
50
5.2 Solid-Liquid Ratio of the Samples
In Table 5.5, the weight losses due to the evaporation of water from the samples
after each drying process were represented. According to the table, the most significant
loss at the end of the first drying belongs to the pure copolymer. As it is determined in
Table 5.5, after the evaporation of the water the remaining solid ratios of the samples
are very close to each others. As an average the samples lost their water content at a
percentage of 26.5 % at the end of the drying process.
Table 5.5: Mass loss values of the samples after the first and second drying processes.
Sample Mass loss at 70 oC (%)
Mass loss at 80 oC under vacuum (%)
Total mass loss (%)
Remaining solid at the end of the drying processes(%)
40 % binder 13.4 17 28 72 30% binder 15.4 14.4 27.6 72.4
20 % binder 21.5 4.8 25.3 75 10 % binder 20.9 5.2 25 75 Pure binder 35.36 - - -
For the paints having 40% and 30% binder, total mass lost is almost equally
shared between the drying steps. However, paints having 20% and 10% binder mainly
lost their masses after the first step. This is due to the fact that in the paints with higher
binder content diffusional resistance to transport of water and other volatile components
is larger than that in paints with lower binder content.
5.3 Permeation Studies
Permeation studies were carried out to determine water vapour permeability
coefficient of pure copolymer and the paint films with binder contents of 40%, 30%,
20%, 10%. In addition to deionized water, 2.9% wt and 5% wt NaCl solutions were
used as solutes in order to simulate rain conditions. Permeation experiments using
deionized water as a solute were performed by exposing the sides of the paint films to
deionized water. The films were reversed to see the effect of surface structure on the
permeability coefficient. When NaCl is used as the solute, only smooth and glossy sides
of the films were exposed to the feed (solute) source. The thickness of films used in the

51
experiments are different from each others, thus the change of relative humidity in the
upper compartment was plotted as a function of time normalized with the thickness of
the films as illustrated in Figures 5.32 through 5.34. Permeability coefficient of water
vapour was calculated from the slope of linear portion of 1u(t)1L
1ui1L
PPPP
ln−−
vs time graph and
the results were tabulated in Table 5.6. When the binder amount decreases, permeability
coefficient of the paint films increases with the increase in the porosity of the films as
shown by SEM pictures in Figures 5.10 through 5.13. Pore formation in the films is
associated with pigment flocculation due to insufficient wetting of the pigment particles
by the binder. The permeability coefficient of the pure copolymer is very close to that of
the paint film with the binder content of 40%, since this paint film contains a relatively
homogeneous and nonporous structure, similar to the structure of the pure copolymer
film. An insignificant difference in permeability coefficients was observed for the paint
films having 40%, 30% and 20% binder when their opaque and glossy sides were
exposed to water vapour. However, for the paint film containing 10% binder,
permeability coefficient is almost two times higher when its glossy surface was exposed
to the water vapour. This result can be explained by the difference in roughness of the
surfaces. In AFM, the roughness of the glossy surfaces were determined while
measurements could not be taken on opaque surfaces due to very high roughness values.
When opaque side of the paint film is exposed to the feed source, water molecules first
permeate through a much more rough surface, thus see a higher resistance to their
transport at the beginning of the process. The increase in resistance to the permeation of
water molecules causes smaller permeability coefficients since these values are
determined from the data collected especially at early times of the permeation process.
The largest overall roughness value was determined for the paint films with the binder
contents of 20% and10%. Thus, the difference in permeability coefficients determined
by exposing different sides to the water vapour is greatest for the paint film having 10%
binder. It should be also noted that, the linear permeation model given by Equation
(2.30) is valid for a longer time period for the pure copolymer and paint films
containing 40% and 30% binder.
When NaCl solution was used as a solute, permeability coefficient of water
vapour decreases for the pure copolymer and the paint films having 40%, 30% binder,
since partial pressure of water vapour on the feed side, consequently, the concentration
difference through the film decreases. An increase in permeability coefficients was
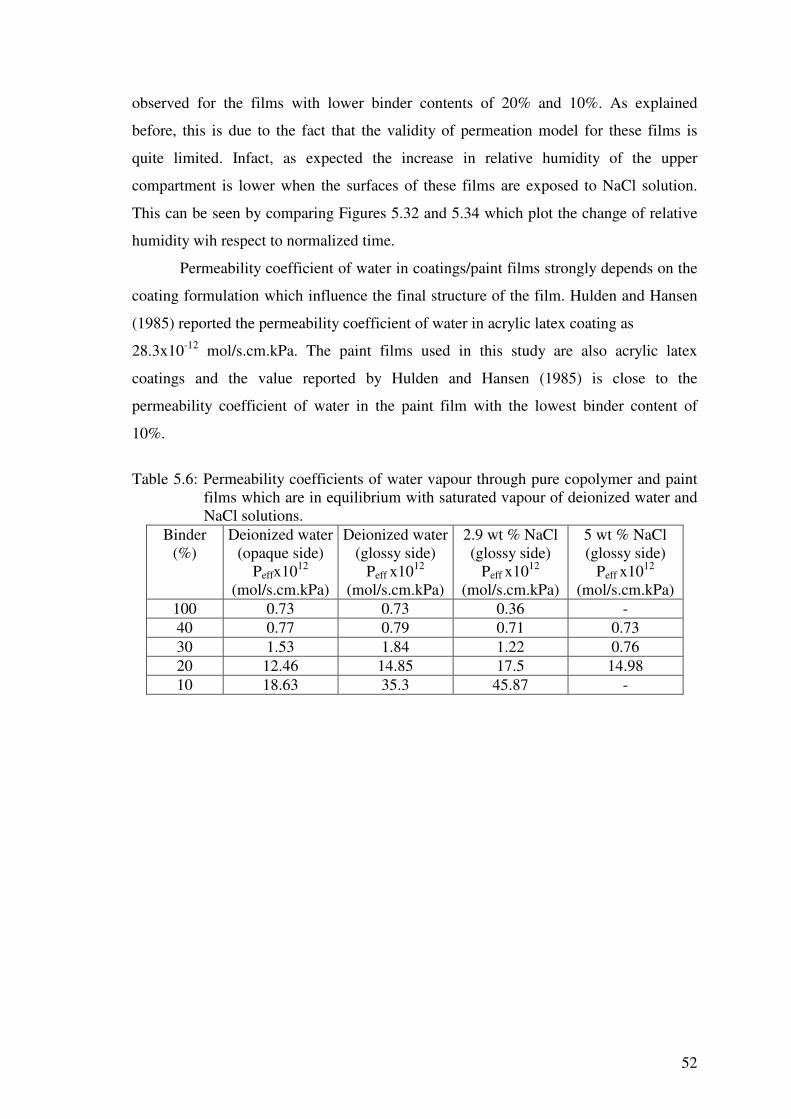
52
observed for the films with lower binder contents of 20% and 10%. As explained
before, this is due to the fact that the validity of permeation model for these films is
quite limited. Infact, as expected the increase in relative humidity of the upper
compartment is lower when the surfaces of these films are exposed to NaCl solution.
This can be seen by comparing Figures 5.32 and 5.34 which plot the change of relative
humidity wih respect to normalized time.
Permeability coefficient of water in coatings/paint films strongly depends on the
coating formulation which influence the final structure of the film. Hulden and Hansen
(1985) reported the permeability coefficient of water in acrylic latex coating as
28.3x10⁻¹² mol/s.cm.kPa. The paint films used in this study are also acrylic latex
coatings and the value reported by Hulden and Hansen (1985) is close to the
permeability coefficient of water in the paint film with the lowest binder content of
10%.
Table 5.6: Permeability coefficients of water vapour through pure copolymer and paint
films which are in equilibrium with saturated vapour of deionized water and NaCl solutions.
Binder (%)
Deionized water (opaque side)
Peffx1012 (mol/s.cm.kPa)
Deionized water (glossy side)
Peff x1012
(mol/s.cm.kPa)
2.9 wt % NaCl (glossy side)
Peff x1012
(mol/s.cm.kPa)
5 wt % NaCl (glossy side)
Peff x1012
(mol/s.cm.kPa) 100 0.73 0.73 0.36 - 40 0.77 0.79 0.71 0.73 30 1.53 1.84 1.22 0.76 20 12.46 14.85 17.5 14.98 10 18.63 35.3 45.87 -

53
Figure 5.32: The change in relative humidity in the upper compartment when glossy sides of the films are exposed to deionized water vapour.
Figure 5.33: The change in relative humidity in the upper compartment when opaque
sides of the films are exposed to deionized water vapour.
RH
(%)
(t/L)0.5(s/cm)0.5

54
Figure 5.34: The change in relative humidity in the upper compartment when glossy sides of the films are in equilibrium with the water vapour of aqueous 2.9 wt % NaCl solution.
5.4 Equilibrium Isotherms
Figures 5.35 through 5.38 gives the vapour-sorption equilibrium data for water-
paint systems. Volume fraction of water in the copolymer/paint was plotted against the
activity of the water vapour calculated from Equation (5.3);
=wa)(TP)(TP
columno
1
watero
1 (5.3)
Experimental data shows that water sorption capacity of the paint films
decreases as their binder content decreases indicating that water sorption in the paint
films takes place in the binder fraction. This result is in accordance with the expectation
since pigments are generally dense, inorganic compounds with hydrophobic nature.
Equilibrium isotherms of paint systems were successfully fitted by the Flory-
Huggins thermodynamic theory and the Flory-Huggins interaction parameters, χ, for the
paint films with the binder contents of 40%, 30%, 20% and 10% were found as 2.07,
2.07, 2.22, 2.61, respectively. All of the interaction parameters are greater than 0.5
indicating that water is not a good solvent for the paint films. Maximum water sorption
capacity of the films, corresponding to activity equals to one, cannot be determined
(t/L)0.5 (s/cm)0.5
RH
(%)
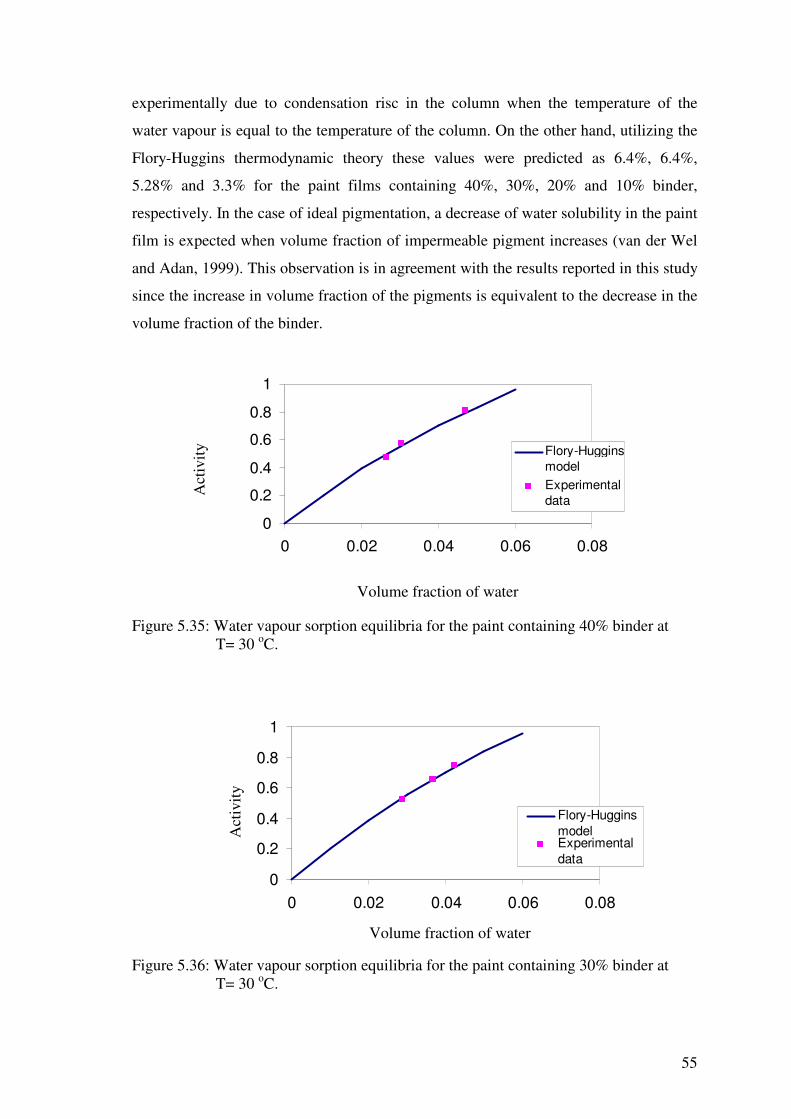
55
experimentally due to condensation risc in the column when the temperature of the
water vapour is equal to the temperature of the column. On the other hand, utilizing the
Flory-Huggins thermodynamic theory these values were predicted as 6.4%, 6.4%,
5.28% and 3.3% for the paint films containing 40%, 30%, 20% and 10% binder,
respectively. In the case of ideal pigmentation, a decrease of water solubility in the paint
film is expected when volume fraction of impermeable pigment increases (van der Wel
and Adan, 1999). This observation is in agreement with the results reported in this study
since the increase in volume fraction of the pigments is equivalent to the decrease in the
volume fraction of the binder.
Figure 5.35: Water vapour sorption equilibria for the paint containing 40% binder at T= 30 oC.
Figure 5.36: Water vapour sorption equilibria for the paint containing 30% binder at T= 30 oC.
Act
ivity
Volume fraction of water
0
0.2
0.4
0.6
0.8
1
0 0.02 0.04 0.06 0.08
Flory-HugginsmodelExperimentaldata
0
0.2
0.4
0.6
0.8
1
0 0.02 0.04 0.06 0.08
Flory-HugginsmodelExperimentaldata
Volume fraction of water
Act
ivity

56
Figure 5.37: Water vapour sorption equilibria for the paint containing 20% binder at
T= 30 oC.
Figure 5.38: Water vapour sorption equilibria for the paint containing 10% binder at
T= 30 oC.
Water vapour sorption equilibrium data in the pure copolymer is shown in
Figure 5.39. It was found that the sorption isotherm for the pure copolymer does not
obey the Flory-Huggins theory over the whole water activity range. At high water
activities, the water sorption increases faster than that predicted by the Flory-Huggins
theory. The isotherm over the whole activity range was fitted well by the ENSIC model
which takes into account the possibility of cluster formation. Using the sorption data at
T=30 oC and T= 40 oC, two parameters of the model were determined as ks= 4.372 and
kp= 0.00361. Based on these values the maximum water sorption capacity of the pure
0
0.2
0.4
0.6
0.8
1
0 0.02 0.04 0.06
Flory-Hugginsmodel
ExperimentalData
Volume fraction of water
Act
ivity
0
0.2
0.4
0.6
0.8
1
0 0.02 0.04
Flory-Hugginsmodel
Experimentaldata
Volume fraction of water
Act
ivity

57
copolymer was predicted as 6.43% slightly higher than the water sorption capacity of
the paint films with the binder contents of 40% and 30%.
Figure 5.39: Equilibrium isotherm of the pure copolymer for T= 30 oC and 40 oC.
A significant degree of upturn in sorption data at high activities can be due to
clustering of water molecules or plasticization of the polymer matrix induced by water
sorption (Schult and Paul, 1996). The extend of clustering of water molecules inside the
polymer matrix can be determined by the Zimm and Lundberg cluster integral
(Rodriguez et al., 2003). Figure 5.40 shows the clustering function, Gww/Vw as a
function of water vapour activity for the pure copolymer film. For all water activities,
Gww/Vw values are much greater than zero indicating that water molecules tend to
cluster. Figure 5.41 shows the variation of mean cluster size (MCS) as a function of the
volume fraction of water in the pure copolymer. The mean cluster size defines the mean
number of water molecules in excess of the mean water concentration in the
neighbourhood of a given water molecule (Rodriguez et al., 2003). The large increase in
the MCS with the volume fraction of water also shows a strong tendency for water to
form cluster in the pure copolymer. Infact, large value of ks (ks= 4.372) compared to kp
value (kp= 0.00361) indicates that mutual interactions between water molecules are
much more important than the interaction between the copolymer and water molecules.
0
0.2
0.4
0.6
0.8
1
0 0.02 0.04 0.06 0.08
T=30 C
T=40 C
ENSIC model
Act
ivity
Volume fraction of water
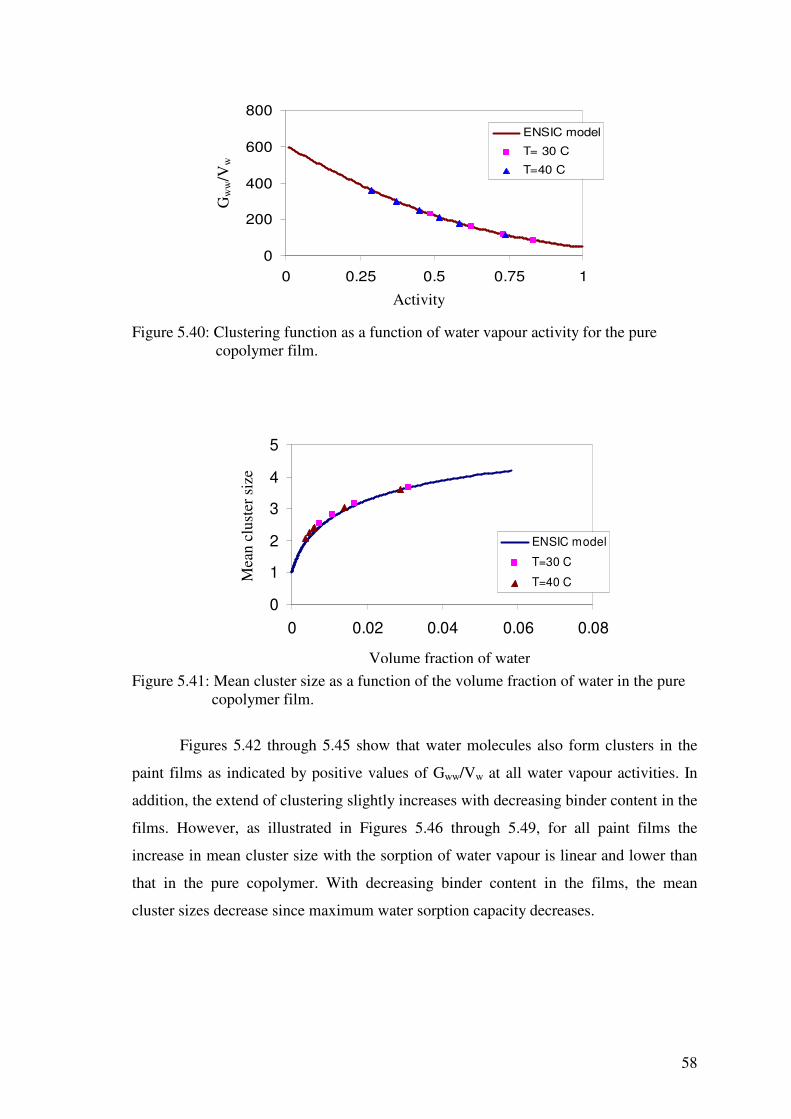
58
Figure 5.40: Clustering function as a function of water vapour activity for the pure
copolymer film.
Figure 5.41: Mean cluster size as a function of the volume fraction of water in the pure
copolymer film.
Figures 5.42 through 5.45 show that water molecules also form clusters in the
paint films as indicated by positive values of Gww/Vw at all water vapour activities. In
addition, the extend of clustering slightly increases with decreasing binder content in the
films. However, as illustrated in Figures 5.46 through 5.49, for all paint films the
increase in mean cluster size with the sorption of water vapour is linear and lower than
that in the pure copolymer. With decreasing binder content in the films, the mean
cluster sizes decrease since maximum water sorption capacity decreases.
0
200
400
600
800
0 0.25 0.5 0.75 1
ENSIC model
T= 30 C
T=40 C
Activity
Gw
w/V
w
0
1
2
3
4
5
0 0.02 0.04 0.06 0.08
ENSIC model
T=30 C
T=40 C
Volume fraction of water
Mea
n cl
uste
r siz
e
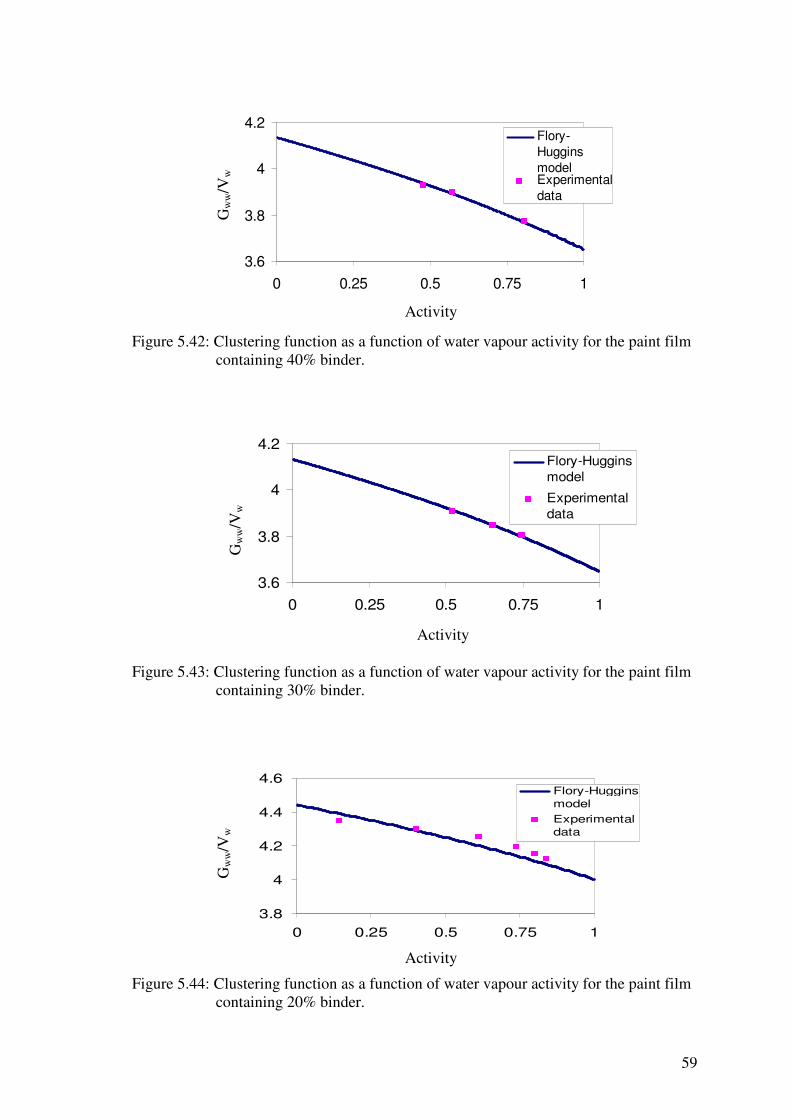
59
Figure 5.42: Clustering function as a function of water vapour activity for the paint film
containing 40% binder.
Figure 5.43: Clustering function as a function of water vapour activity for the paint film
containing 30% binder.
Figure 5.44: Clustering function as a function of water vapour activity for the paint film
containing 20% binder.
3.6
3.8
4
4.2
0 0.25 0.5 0.75 1
Flory-HugginsmodelExperimentaldata
Gw
w/V
w
Activity
3.6
3.8
4
4.2
0 0.25 0.5 0.75 1
Flory-Hugginsmodel
Experimentaldata
Activity
Gw
w/V
w
3.8
4
4.2
4.4
4.6
0 0.25 0.5 0.75 1
Flory-HugginsmodelExperimentaldata
Activity
Gw
w/V
w

60
Figure 5.45: Clustering function as a function of water vapour activity for the paint film
containing 10% binder.
Figure 5.46: Mean cluster size as a function of the volume fraction of water in the paint
film containing 40% binder.
Figure 5.47: Mean cluster size as a function of the volume fraction of water in the paint
film containing 30% binder.
Activity
Gw
w/V
w
0
0.05
0.1
0.15
0.2
0.25
0 0.02 0.04 0.06 0.08
Flory-Hugginsmodel
Experimentaldata
Volume fraction of water
0
0.05
0.1
0.15
0.2
0.25
0 0.02 0.04 0.06 0.08
Flory-Hugginsmodel
Experimentaldata
Volume fraction of water
Mea
n cl
uste
r siz
e
Mea
n cl
uste
r siz
e
4.8
5
5.2
5.4
0 0.25 0.5 0.75 1
Flory-Hugginsmodel
Experimentaldata

61
Figure 5.48: Mean cluster size as a function of the volume fraction of water in the paint
film containing 20% binder.
Figure 5.49: Mean cluster size as a function of the volume fraction of water in the paint
film containing 10% binder.
The tendency of water molecules to form clusters in the pure copolymer and the
paint films indicates that the water is not a good solvent for both pure copolymer and
the paint films and the copolymer –water interaction is weak.
5.5 Diffusion Studies
5.5.1 Diffusion Studies with Paint Films
Diffusion coefficients of water in the paint films were determined at T=30 oC
using magnetic suspension balance. For this purpose, normalized mass uptakes of the
0
0.05
0.1
0.15
0.2
0.25
0 0.02 0.04 0.06
Flory-Hugginsmodel
Experimentaldata
Volume fraction of water
Mea
n cl
uste
r siz
e
0
0.05
0.1
0.15
0.2
0 0.02 0.04
Flory-Hugginsmodel
Experimentaldata
Volume fraction of water
Mea
n cl
uste
r siz
e

62
films, o
ot
MMMM
−−
∞
were drawn against the square root of time, t , and the results are
shown in Appendix A in Figures A1 through A4. In these curves, model 1 corresponds
to analytical solution given by Equation 2.9, while model 2 represents the numerical
model discussed in section 2.2.2. First of all, diffusivities were calculated from the
analytical solution using all experimental data. In cases when data was not fitted by the
analytical solution, numerical model was adapted. In these cases, perfect fit of data with
model 2 indicated that diffusion coefficient within that particular activity step is not
constant. The concentration dependence of diffusion coefficient of water was described
by Equation 2.20 and the exponents 1� and 2� in this equation determined from the best
fit of the data were listed in Table 5.7. 1� and 2� both equal to zero corresponds to
constant diffusivity case (model 1). All uptake curves are concave with respect to the
t axis and the initial region is linear. These two observations suggest that sorption
kinetics of water vapour in the paint films may follow Fickian sorption.
Table 5.7 Parameters 1� and 2� in Equation 2.20 for varying water concentrations in paint films.
% Binder T (oC) average� 1� 2�
40 30 0.009 0.01 450
40 30 0.014 0 0
40 30 0.021 0 0
30 30 0.009 0.01 400
30 30 0.017 0.05 700
30 30 0.019 0 0
20 30 0.004 0.01 800
20 30 0.009 0.01 2000
20 30 0.012 0.01 2000
20 30 0.015 0.01 1500
10 30 0.006 0.01 770
10 30 0.001 0.05 3000
10 30 0.012 0.01 1900
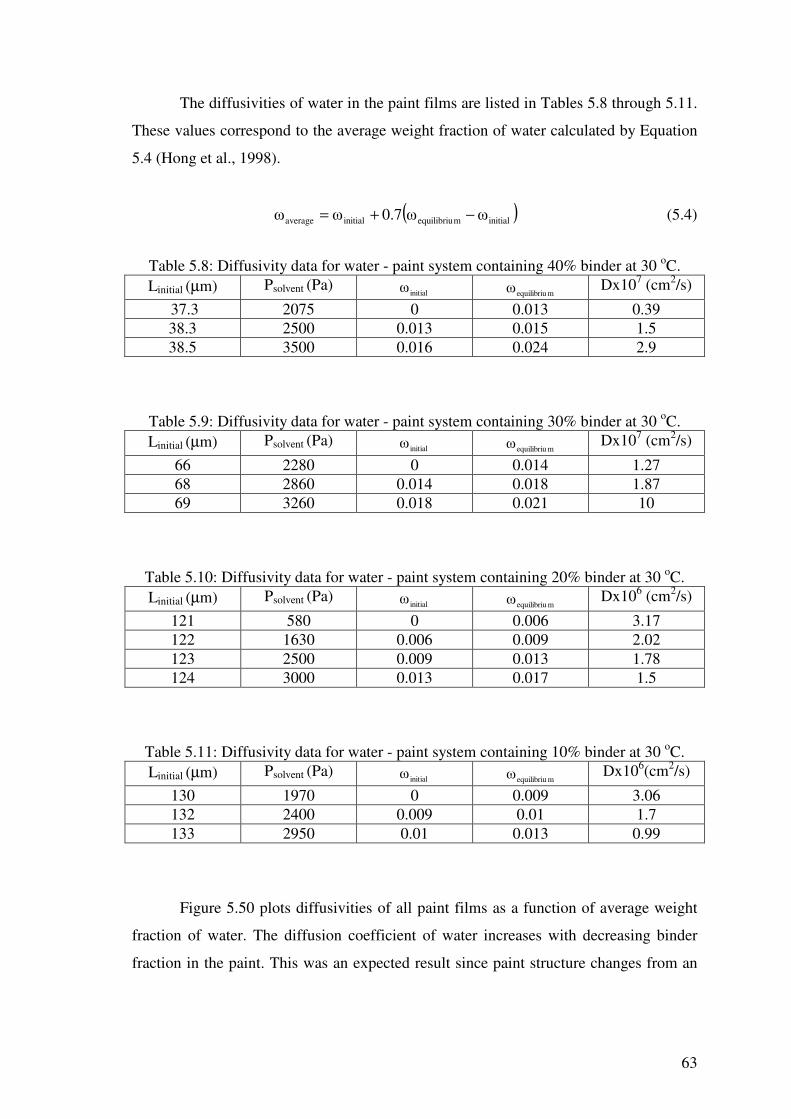
63
The diffusivities of water in the paint films are listed in Tables 5.8 through 5.11.
These values correspond to the average weight fraction of water calculated by Equation
5.4 (Hong et al., 1998).
( )initialmequilibriuinitialaverage ��0.7� −+=� (5.4)
Table 5.8: Diffusivity data for water - paint system containing 40% binder at 30 oC. Linitial (µm) Psolvent (Pa)
initial� mequilibriu� Dx107 (cm2/s)
37.3 2075 0 0.013 0.39 38.3 2500 0.013 0.015 1.5 38.5 3500 0.016 0.024 2.9
Table 5.9: Diffusivity data for water - paint system containing 30% binder at 30 oC. Linitial (µm) Psolvent (Pa)
initial� mequilibriu� Dx107 (cm2/s)
66 2280 0 0.014 1.27 68 2860 0.014 0.018 1.87 69 3260 0.018 0.021 10
Table 5.10: Diffusivity data for water - paint system containing 20% binder at 30 oC. Linitial (µm) Psolvent (Pa)
initial� mequilibriu� Dx106 (cm2/s)
121 580 0 0.006 3.17 122 1630 0.006 0.009 2.02 123 2500 0.009 0.013 1.78 124 3000 0.013 0.017 1.5
Table 5.11: Diffusivity data for water - paint system containing 10% binder at 30 oC. Linitial (µm) Psolvent (Pa)
initial� mequilibriu� Dx106(cm2/s)
130 1970 0 0.009 3.06 132 2400 0.009 0.01 1.7 133 2950 0.01 0.013 0.99
Figure 5.50 plots diffusivities of all paint films as a function of average weight
fraction of water. The diffusion coefficient of water increases with decreasing binder
fraction in the paint. This was an expected result since paint structure changes from an

64
almost nonporous to porous one as the binder amount decreases from 40% to 10% as
shown by the SEM pictures in Figure 5.9.
Figure 5.50: Diffusion coefficient of water in the paint films as a function of its average weight fraction at T=30 oC.
In paint films containing 20% and 10% binder, amount of binder is not sufficient
to wet the pigments, thus pigment flocculation and consequently pore formation is
clearly observed in these films, facilitating water transport. For paint films containing
20% and 10% binder, diffusivity decreases slightly while for the paint film containing
30% binder it increases almost one order of magnitude with increasing weight fraction
of water in the film. A slight increase in diffusivity with increasing water content was
observed for the paint film containing 40% binder. The increase in diffusion coefficient
is associated with the plasticization of the binder by the water, while the decrease in
diffusivity is due to clustering of water molecules. The results suggest that when the
binder fraction of the paint film is low (20% and 10% respectively), clustering is
dominant, thus diffusivity decreases. For the paint films containing 40% and 30%
binder, plasticization effect is dominant over the whole activity range, consequently,
diffusivity increases.
Perez et al. (1999) determined the diffusion coefficient of water in a water-borne
acrylic paint as 0.71x10⁻⁷ cm2/sec which has the same order of magnitude for the paint
film containing 40% binder.
Dx1
07 (cm
2 /s)
0.1
1
10
100
0 0.01 0.02 0.03
40% binder
30%binder
20% binder
10% binder
Average weight fraction of water

65
5.5.2 Diffusion Studies with Pure Copolymer Film
Diffusion coefficient of water in the pure copolymer film was determined at 30 oC and 40 oC. Experimental mass uptake curves are given in Figures A5 through A6.
Experimental data collected at 40 oC were all fitted well by the Crank’s analytical
solution (model 1) except the last activity step. However, deviation from the analytical
solution was observed in evaluating the data at 30 oC, thus diffusivities in these cases
were determined from the numerical model (model 2). The constants 1� and
2� determined from the fit of numerical model to the data are listed in Table 5.12 and
5.13. Water sorption in pure copolymer also follows Fickian diffusion since all uptake
curves are concave to the t axis and their initial initial regions are linear. The
diffusivities at 30 oC and 40 oC corresponding to average weight fraction of water in the
copolymer are listed in Tables 5.14 and 5.15, respectively and diffusion coefficient
values as a function of average weight fraction of water was represented in Figure 5.51.
The diffusivity increases with rising temperature due to an increase in mobility of water
molecules. At each temperature, plasticization effect of water molecules is dominant at
low activities, thus diffusivity increases and reaches to a maximum after which
clustering of water molecules becomes more important, consequently, diffusivity
decreases. The increase in diffusivity associated with the plasticization effect is due to
increased segmental polymer mobility caused by water molecules. On the other hand,
when water molecules form cluster its effective diameter increases, which decreases
mobility of the water molecules or the diffusion coefficient.
For pure copolymer films, the dominant effect of clustering at high activities is
an expected result since the large increase in mean cluster size with the sorption was
observed as shown in Figure 5.41.
Table 5.12: Parameters 1� and 2� in Equation 2.20 for varying water concentrations in pure copolymer film for T= 30 oC.
� average 1� 2�
0.005 0.05 700
0.009 0 0
0.025 0.05 300
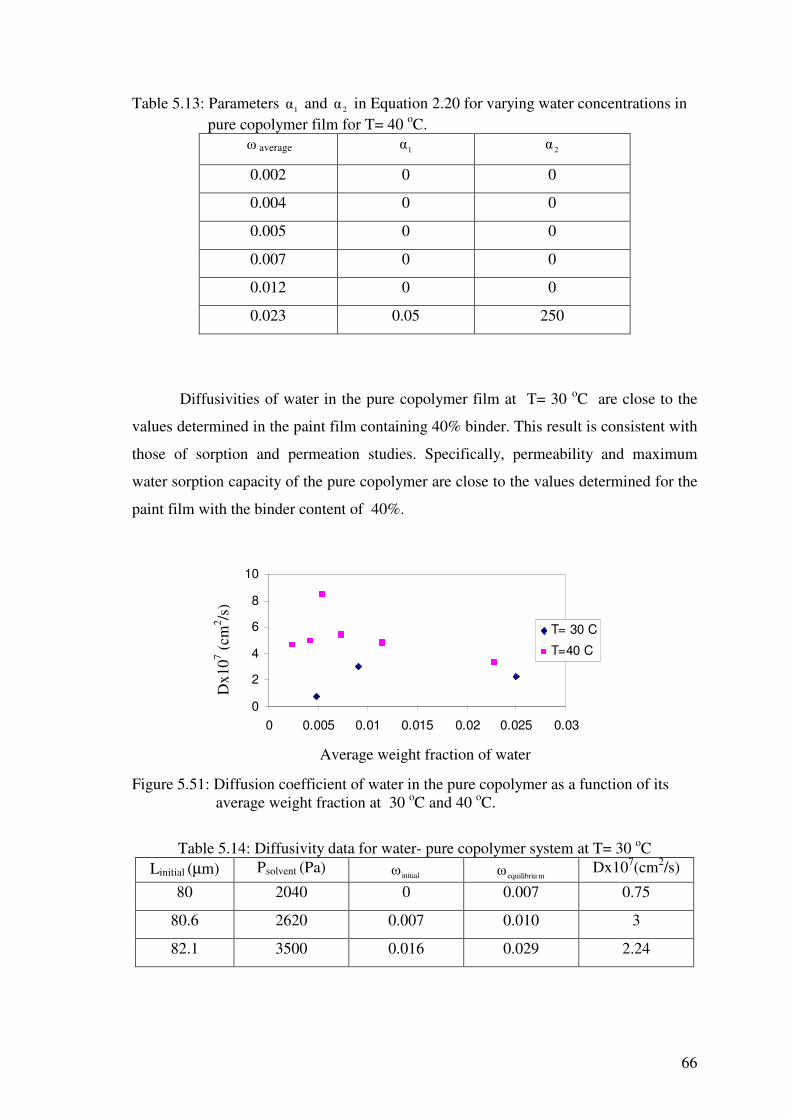
66
Table 5.13: Parameters 1� and 2� in Equation 2.20 for varying water concentrations in pure copolymer film for T= 40 oC.
� average 1� 2�
0.002 0 0
0.004 0 0
0.005 0 0
0.007 0 0
0.012 0 0
0.023 0.05 250
Diffusivities of water in the pure copolymer film at T= 30 oC are close to the
values determined in the paint film containing 40% binder. This result is consistent with
those of sorption and permeation studies. Specifically, permeability and maximum
water sorption capacity of the pure copolymer are close to the values determined for the
paint film with the binder content of 40%.
Figure 5.51: Diffusion coefficient of water in the pure copolymer as a function of its average weight fraction at 30 oC and 40 oC.
Table 5.14: Diffusivity data for water- pure copolymer system at T= 30 oC Linitial (µm) Psolvent (Pa)
initial� mequilibriu� Dx107(cm2/s)
80 2040 0 0.007 0.75
80.6 2620 0.007 0.010 3
82.1 3500 0.016 0.029 2.24
Average weight fraction of water
Dx1
07 (cm
2 /s)
0
2
4
6
8
10
0 0.005 0.01 0.015 0.02 0.025 0.03
T= 30 C
T=40 C

67
Table 5.15: Diffusivity data for water- pure copolymer system at T= 40 oC
Linitial (µm) Psolvent (Pa) initial� mequilibriu� Dx107(cm2/s)
80 2040 0 0.0034 4.68
80.3 2620 0.0034 0.0046 4.93
80.4 3160 0.0046 0.0058 8.50
80.5 3640 0.0058 0.008 5.44
80.7 4120 0.008 0.013 4.80
81.1 5200 0.013 0.027 3.34

68
CONCLUSIONS AND SUGGESTIONS FOR FUTURE
WORK
In this study, transport properties (permeability, solubility, diffusivity) of water
in water borne acrylic based paint and in methylmethacrylate-co-butylacrylate
copolymer used as a binder in the paint were measured. Furthermore, the structure of
the paint films which have the same formulation but differ in binder amount as 40%,
30%, 20% and 10% was determined using different characterization tools.
Paint samples were supplied by Akril Kimya A.�. and no information was
provided about the paint ingredients and their compositions except the composition of
the binder. Energy dispersive X-Ray (EDX) analysis allowed to determine common
elements in all paint films which can be listed as carbon, oxygen, calcium, titanium,
silicon, magnesium, aluminium, and sodium. According to the X-ray analysis, titanium
element in the paint is found as titania while calcium is in the form of calcite both of
which are mostly used as pigment and filler material in the paint formulations. Scanning
electron microscope pictures have shown that as the amount of binder decreases from
40% to 10%, the structure of the films changes from almost nonporous to a porous one.
Porous structure formation is a result of the pigment flocculation due to insufficient
wetting of pigments by the binder. Map diagrams of the paint films have shown that in
paint films with low contents of binder (20%, 10%) distribution of the pigments is not
homogeneous. Thermal gravimetric analysis indicated that pure copolymer degrades at
one step without leaving a thermally stable char, while paint films decompose at two
steps leaving thermally stable char which contains CaO and titania which are both
stable above 1000 oC. Based on differential scanning calorimetry analysis, it was
observed that the pure copolymer exhibits one endothermic decompositon peak while
paint films exhibit two exothermic decomposition peaks. Glass transition temperature of
the pure copolymer (Tg= 31.67 oC ) was found to be slightly lower than those of the
paint films (34.1 oC, 34.1 oC, 32.8 oC, 33.9 oC for the paint films in the order of
decreasing binder amount). Solid content of the paint films (%) increases from 72% to
75% as the amount of binder decreases from 40% to 10%.
Sorption data when presented by plots of o
ot
MMMM
−−
∞
as a function of t have
shown that sorption kinetics for both the paint films and the pure copolymer film may

69
be classified as Fickian type since the initial regions of the curves are linear and are
always concave with respect to axis above the linear portion. Diffusivities were
determined by fitting either the analytical or numerical model to the sorption data.
Diffusivities increase with increasing water content of the films due to plasticization
effect of water, while they tend to decrease when water molecules form clusters.
Predictions have shown that water form clusters both in the paint films and in the pure
copolymer. Degree of clustering and the change of mean cluster size with sorption
appears to be larger for the pure copolymer.
Diffusivity of water increases with decreasing binder fraction in the paint film.
This is due to pore formation and nonhomogeneous distribution of the pigments in the
paint films with low binder content.
Vapour-sorption equilibrium data were fitted by the Flory-Huggins theory and
ENSIC model for the paint films and the pure copolymer, respectively. Predictions from
these theories have shown that maximum water sorption capacity of the paint films
decreases with decreasing binder fraction in the paint film. Permeability coefficient of
water also increases as the amount of binder in the paint film decreases. Maximum
water sorption capacity, diffusivity and permeability of water in the paint film
containing 40% binder are similar to the corresponding values determined for the pure
copolymer film. This result suggests that the paint sample containing 40% binder
shows the best barrier property against water.
Combined with the characterization studies, it can be concluded that binder
fraction in the paint is important since it directly influences the homogeneous
distribution, flocculation of the pigments and pore formation in the structure,
consequently, the water transport and the barrier property of the paints.
Future work should involve the measurement of diffusivity and solubility of
monomers of the binder (methylmethacrylate and butylacrylate) and the atmospheric
gases (O2, N2) in the paint films. The former data are required to predict the emission of
these monomers from the paint while the latter data are required to further determine the
barrier property of the paint when it is applied on outdoor surfaces.
70
REFERENCES
Adan O.C.G, van der Wel G.K, Moisture in organic coatings-a review, Progress in
Organic Coatings, 37, (1999), 1.
Alsoy S, Duda J.L, Influence of swelling and diffusion-induced convection on polymer
sorption processes, A.I.CHE. J, 48, (2002), 1849.
Barbucci A, Delucchi M., Goretta. L., Cerisola G, Electrochemical and physico-
chemical characterization of flourinated organic coatings for steel and concrete
protection: influence of pigment volume concentration, Progress in Organic
Coatings, 33, (1998),139.
Barrie J.A, Water in polymers, In Diffusion in Polymers, Edited by J. Crank and G.S.
Park (Academic Press, London, 1968).
Bierwagen G.P, The science of durability of organic coatings: a foreword, Progress in
Organic Coatings, 15, (1987), 179.
Brisson A, Haber A, Factors affecting titanium dioxide dispersion in trade sales paints,
Journal of Coating Technology, 63, (1991), 59.
Brown R.G.F, Carr C, Taylor M.E, Effect of pigment volume concentration and latex
particle size on pigment distribution, Progress in Organic Coatings, 30,
(1997),185.
Burgos M, Langlet M, The sol-gel transformation of TIPT coatings: a FTIR study, Thin
Solid Films, 349, (1999),19.
Cannon L.A, Pethrick R.A, Comparison of the effect of reactive and non-reactive steric
stabilisers on the mechanism of film formation in methyl methacrylate/butyl
acrylate copolymer latexes. part 1. differential scanning calorimetry, dynamic
mechanical analysis and atomic force microscopy, Polymer, 43, (2002), 6421.
71
Corfias C, Pébere N, Lacabanne C, Characterization of a thin protective coating on
galvanized steel by electrochemical impedance spectroscopy and a
thermostimulated current method, Corrosion Science, 41, (1999), 1539.
Colthup N.B, Daly L.H, Wiberley S.E, Introduction to Infrared and Raman
Spectroscopy, Third ed., (Academic Press, Inc., California, 1990).
Crank J, The Mathematics of Diffusion, Second ed., (Oxford University Press, Oxford,
1975).
George S.C, Thomas S, Transport phenomena through polymeric systems, Progress in
Polymer Science, 26, (2001), 985.
Ghi P, Hill J.T.D, Whittaker K.A, Water sorption by poly(tetrahydrofurfuryl
methacrylate-co-2-hydroxyethyl methacrylate) I A mass uptake study, Journal
of Polymer Science: Part B: Polymer Physics, 38, (2000), 1939.
Hong S.U, Laurer J.H, Zielinski J.M, Samseth J, Smith S.D, Duda J.L, Spontak R.J,
Morphological and isothermal diffusive probe analyses of low molecular-weight
diblock copolymers, Macromolecules, 31, (1998), 2174.
Huldén M, Hansen C. M, Water permeation in coatings, Progress in Organic
Coatings, 13, (1985), 171.
Jeoung-Ah K, The characterisation of paper composite porcelain in a fired state by
XRD and SEM, Journal of the European Ceramic Society, 24, (2004), 3823.
Keddie J.L, Film formation of latex, Materials Science and Engineering: R: Reports,
21, (1997), 101.
Kristoffersson A, Roncari E, Galassi C, Comparison of different binders for water-
based tape casting of alumina, Journal of the European Ceramic Society, 18,
(1998), 2123.

72
Landolt D, Guillaumin V, Effect of dispersion agent on the degradation of a water borne
paint on steel studied by scanning acoustic microscopy and impedance,
Corrosion Science, 44, (2002), 179.
Le Pen C, Lacabanne C, Pébere N, Characterisation of water-based coatings by
electrochemical impedance spectroscopy, Progress in Organic Coatings, 46,
(2003), 77.
Liu B, Li Y, Lin H, Cao C, Effect of PVC on the diffusion behaviour of water through
alkyd coatings, Corrosion Science, 44, (2002), 2657.
Mamaliga I, Schabel W, Kind M, Measurements of sorption isotherms and diffusion
coefficients by means of a magnetic suspension balance, Chemical Engineering
and Processing, 43, (2004), 753.
Paul S, Surface Coatings: science and technology, ( John Wiley and sons, Chichester,
1985 ).
Perera D.Y, Effect of pigmentation on organic coating characteristics, Progress in
Organic Coatings, 50, (2004), 247.
Pérez C, Collazo A, Izquierdo M, Merino P, Novoa X.R, Characterisation of the barrier
properties of different paint systems: Part II. Non-ideal diffusion and water
uptake kinetics, Progress in Organic Coatings, 37, (1999), 169.
Perrin L, Nguyen Q.T, Sacco D, Lochon P, Experimental studies and modelling of
sorption and diffusion of water and alcohols in cellulose acetate, Polymer
International, 42, (1997), 9.
Prausnitz J.M, Lichtenthaler R.N, de Azevedo EG, Molecular Thermodynamics of
Fluid-Phase Equilibria, Second Ed., (Prentice-Hall, Inc., New Jersey, 1986).

73
Reigh F.B, Adelantado G.J.V, Moreno M.M.C.M, FTIR quantitative analysis of calcium
carbonate (calcite) and silica (quartz) mixtures using the constant ratio method.
Application to geological samples, Talanta, 58, (2002), 811.
Rodriguez O, Fornasiero F, Arce A, Radke C.J, Prausnitz J.M, Solubilities and
diffusivities of water vapor in poly(methylmethacrylate), poly(2-
hydroxyethylmethacrylate), poly(N-vinyl-2-pyrrolidone) and poly(acrylonitrile),
Polymer, 44, (2003), 6323.
Schult K.A, Paul D.R, Water sorption and transport in a series of polysulfones, J.
Polym. Sci. Part B: Polym. Phys., 34, (1996), 2805.
Sönmez �, Cebeci Y, Fundamental aspects of spherical oil agglomeration of calcite,
Colloids and Surfaces A: Physicochem. Eng. Aspects, 225, (2003), 111.
Tiarks F, Frechen T, Kirsch S, Leuninger J, Melan M, Pfau A, Richter F, Schuler B,
Zhao C. L, Formulation effects on the distribution of pigment particles in paints,
Progress in Organic Coatings, 48, (2003), 140.
Weismantel G.E, Paint Handbook, (McGraw-Hill, Inc., Newyork, 1981).
Vitala R.I, Langlet M, Simola J, Lindén M, Rosenholm J.B, Aerosol-gel deposition of
doped titania thin films, Thin Solid Films, 368, (2000), 35.

74
APPENDIX
Figure A1: Fractional mass uptake curves of the paint film containing 40% binder for water vapour pressures of (a): 2075 Pa, (b):2500 Pa, (c):3500 Pa
Frac
tiona
l mas
s up
take

75
Figure A2: Fractional mass uptake curves of the paint film containing 30% binder
for water vapour pressures of (a):2280 Pa, (b): 2860 Pa, (c): 3260 Pa.
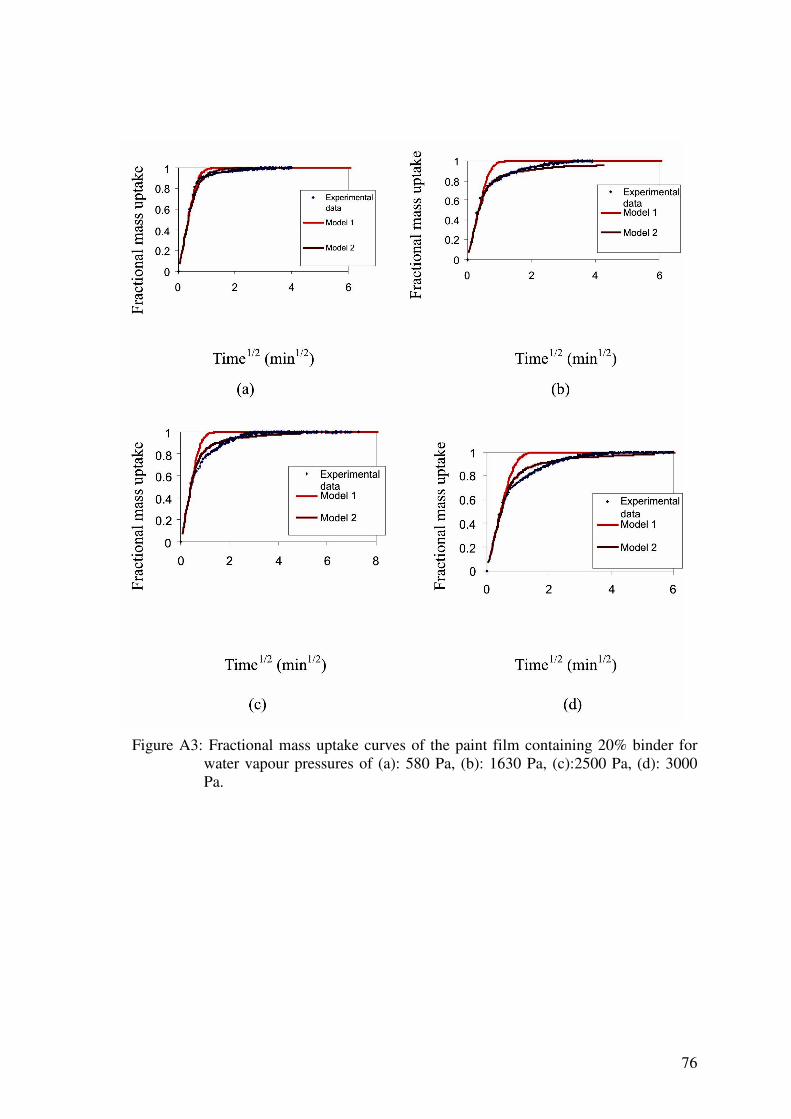
76
Figure A3: Fractional mass uptake curves of the paint film containing 20% binder for
water vapour pressures of (a): 580 Pa, (b): 1630 Pa, (c):2500 Pa, (d): 3000 Pa.

77
Figure A4: Fractional mass uptake curves of the paint film containing 10% binder for
water vapour pressures of (a):1970 Pa, (b): 2400 Pa, (c): 2950 Pa.
Frac
tiona
l mas
s upt
ake

78
Figure A5: Fractional mass uptake curves of the pure copolymer film at T= 30 oC for
water vapour pressures of (a): 2040 Pa, (b): 2620 Pa, (c): 3500 Pa.
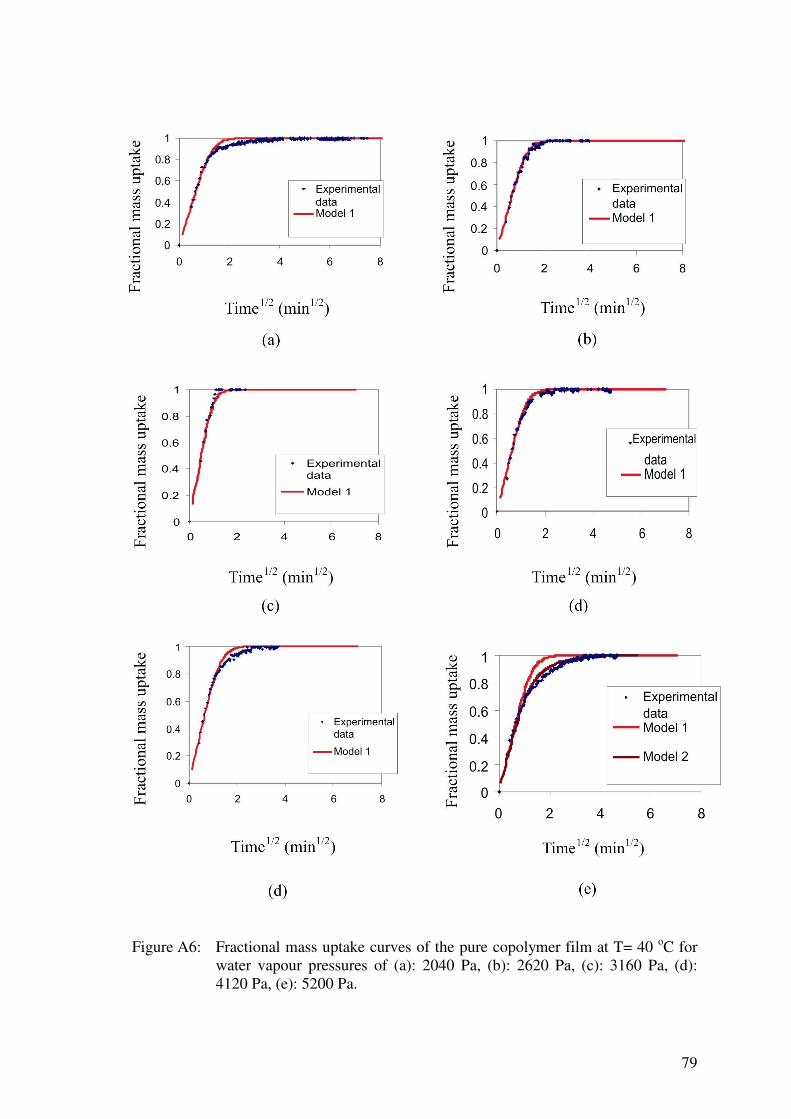
79
Figure A6: Fractional mass uptake curves of the pure copolymer film at T= 40 oC for
water vapour pressures of (a): 2040 Pa, (b): 2620 Pa, (c): 3160 Pa, (d): 4120 Pa, (e): 5200 Pa.