some results of 22-year monitoring (1982–2003) of sagittarius b2 in the 1.35-cm line
TRANSCRIPT

Astronomy Reports, Vol. 48, No. 12, 2004, pp. 965–978. Translated from Astronomicheskiı Zhurnal, Vol. 81, No. 12, 2004, pp. 1059–1073.Original Russian Text Copyright c© 2004 by Lekht, Ramırez Hernandez, Tolmachev.
Some Results of 22-Year Monitoring (1982–2003)of Sagittarius B2 in the 1.35-cm Line
E. E. Lekht1, O. Ramırez Hernandez2, and A. M. Tolmachev3
1Instituto Nacional de Astrofısica, Optica y Electronica, Luis Enrique Erro No. 1, Apdo Postal 51 y 216,72840 Tonantzintla, Puebla, Mexico
2Sternberg Astronomical Institute, Universitetskiı pr. 13, Moscow, 119992 Russia3Pushchino Radio Astronomy Observatory, Astro Space Center, Lebedev Physical Institute,
Russian Academy of Sciences, Pushchino, Moscow oblast, 142290 RussiaReceived February 14, 2004; in final form, July 15, 2004
Abstract—A catalog of λ = 1.35 cm water-vapor maser spectra in Sgr B2 obtained in 1992–2003 ispresented; this supplements our results for earlier observations in 1982–1992. Sgr B2 was monitored usingthe 22 m radio telescope of the Pushchino Radio Astronomy Observatory. The whole monitoring datasetfor 1982–2003 has been analyzed. The emission received is a superposition of radiation from various partsof the entire Sgr B2 region, but the main contribution is made by two sources: Sgr B2(M) and Sgr B2(N).The monitoring did not reveal any long-term component of the integrated maser flux variations with aperiod shorter than 20 years. The flare component of the flux variability and a short-period component withamean period of two years have been found. The latter are correlated with variations of the velocity centroid,supporting the reality of the short-period variations. It is likely that all the various types of variations areinherent to both Sgr B2(M) and Sgr B2(N), and represent a superposition of the variations occurring ineach of these sources. There is an alternation of maxima of the emission from Sgr B2(M) and Sgr B2(N).c© 2004 MAIK “Nauka/Interperiodica”.
1. INTRODUCTION
The source Sagittarius B2 forms a composite re-gion near the center of the Galaxy. All phenomenacharacteristic of active star-forming regions are ob-served there: very dense molecular material [1], com-plex molecules, ultracompact HII regions [2], hotcores [3], and H2O, OH, H2CO, CH3OH, and SiOmaser emission. There are two large centers of starformation (molecular-cloud cores): Sgr B2(M) andSgr B2(N). Massive outflows are associated withthese regions, which have been observed in lines ofthe NH3 [4, 5], HC3N [6], C18O [7], and CS [8]molecules.
The H2O maser emission in Sgr B2 comesfrom four separate areas. Three are associated withSgr B2(N), Sgr B2(M), and Sgr B2(S), while thefourth is between Sgr B2(N) and Sgr B2(M). Ac-cording to Kobayashi et al. [9], these regions containat least 39 maser spots. The strongest emissioncomes from two groups of maser spots: N and M.Lekht et al. [10] showed that, in 1984–1986, theemission from group N was more intense at radialvelocities of 40–80 km/s. The source N is associatedwith a rotating accretion disk of molecular gas [11] inwhich three ultracompact HII regions are embedded[2]. The bipolar molecular outflow is aligned with the
1063-7729/04/4812-0965$26.00 c©
disk rotation axis [4]. This outflow could be a source ofmaser excitation. A bipolar outflow was also observedin some molecular lines emitted in the main sourceSgr B2(M), and SiO line emission is observed only inthis source and not in Sgr B2(N) [12]. This suggeststhat a detectable amount of SiO has not yet formed inregion N, indicating that this region is younger thanregion M [12].
We present here an analysis of our entire set ofmonitoring data for the H2O maser source in Sgr B2carried out in 1982–2003.
2. OBSERVATIONS AND DATA ANALYSISWe have monitored the H2O maser source in
Sgr B2 (α1950 = 17h44m10s, δ1950 = −28◦22′00′′)using the 22-m radio telescope of the PushchinoRadio Astronomy Observatory from 1982 until thepresent. The results of our first decade of observations(1982–1992) were published in [10]. We present hereour analysis for the entire interval of our monitoringof Sgr B2.
We used a cooled FET 22-GHz amplifier for the1992–2003 observations. Symmetrical beam switch-ing was applied to lessen the effect of atmosphericradiation. The system noise temperature at low ele-vations was 150–250 K. The antenna beamwidth at
2004 MAIK “Nauka/Interperiodica”

966 LEKHT et al.
40 8050 60 70Radial velocity, km/s
Dec. 9, 1996
July 1, 1996
Mar. 21, 1996
July 3, 1995
Feb. 9, 1995
Nov. 10, 1994
Aug. 8, 1994
Mar. 29, 1994
Apr. 22, 1993
Mar. 2, 1993
Jan. 20, 1993
Oct. 6, 1992
200 Jy
(‡)
Flu
x de
nsity
, Jy
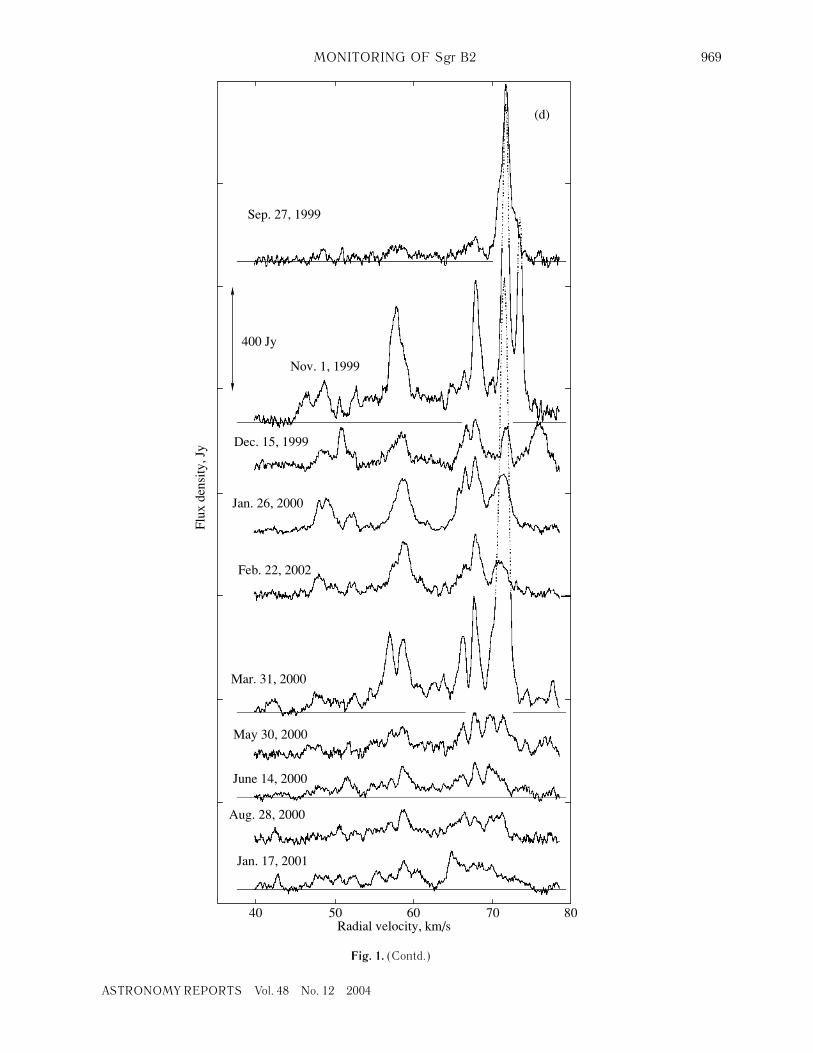
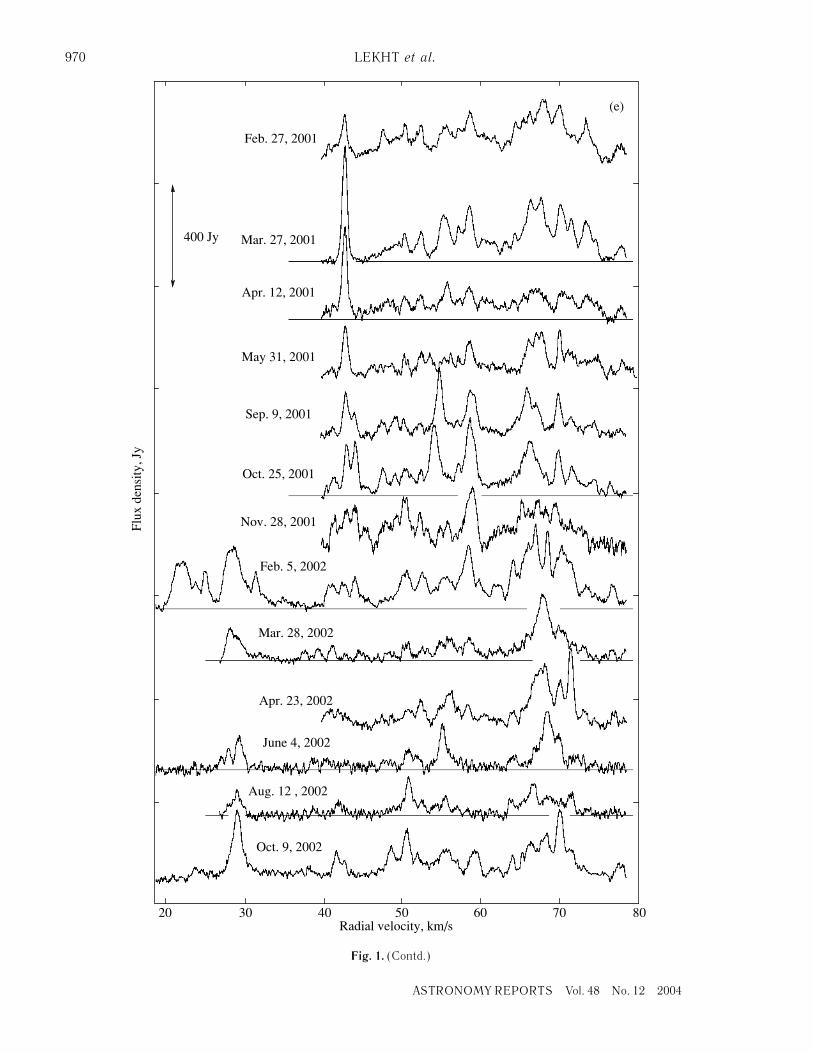
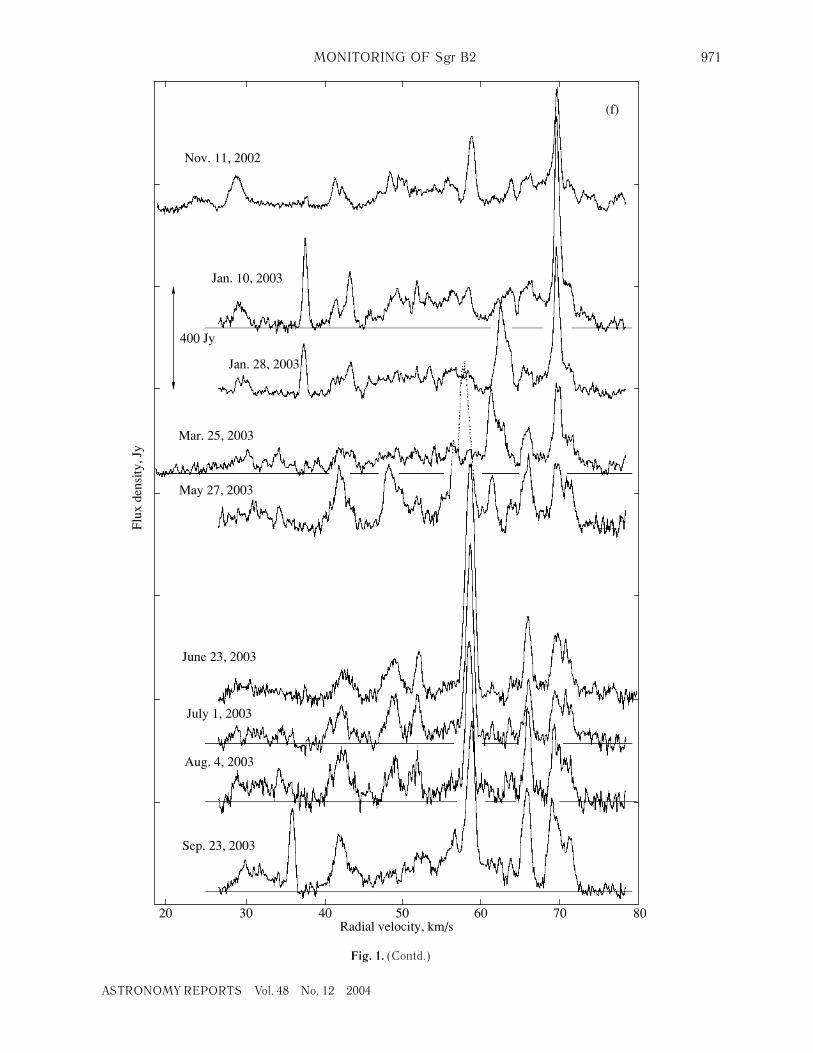
Fig. 1. Spectra of the H2O maser emission of Sgr B2 obtained in 1992–2003. The vertical arrows show the scale in Jy; thehorizontal axis plots the LSR velocity in km/s.
ASTRONOMY REPORTS Vol. 48 No. 12 2004

MONITORING OF Sgr B2 967
ASTRONO
40 8050 60 70Radial velocity, km/s
June 2, 1998
Mar. 25, 1998
Jan. 23, 1998
Sep. 15, 1997
Aug. 18, 1997
June 5, 1997
May 7, 1997
Apr. 1, 1997
Feb. 26, 1997
Jan. 21, 1997 (b)
Flux
den
sity
, Jy
200 Jy
Fig. 1. (Contd.)
MY REPORTS Vol. 48 No. 12 2004

968 LEKHT et al.
40 8050 60 70Radial velocity, km/s
Aug. 16, 1999
June 15, 1999
Mar. 31, 1999
Mar. 12, 1999
Jan. 19, 1999
Nov. 10, 1998
Oct. 6, 1998
Aug. 13, 1998
July 21, 1998
(c)
Flu
x de
nsity
, Jy
200 Jy
Fig. 1. (Contd.)
ASTRONOMY REPORTS Vol. 48 No. 12 2004
MONITORING OF Sgr B2 969
ASTRONO
40 8050 60 70Radial velocity, km/s
Jan. 17, 2001
Aug. 28, 2000
May 30, 2000
Feb. 22, 2002
Jan. 26, 2000
Dec. 15, 1999
Nov. 1, 1999
Sep. 27, 1999
(d)
June 14, 2000
Mar. 31, 2000
Flu
x de
nsity
, Jy
400 Jy
Fig. 1. (Contd.)
MY REPORTS Vol. 48 No. 12 2004
970 LEKHT et al.
8070Radial velocity, km/s
Mar. 27, 2001
Feb. 27, 2001
(e)
Flux
den
sity
, Jy
6050403020
Apr. 12, 2001
May 31, 2001
Sep. 9, 2001
Oct. 25, 2001
Nov. 28, 2001
Feb. 5, 2002
Mar. 28, 2002
Apr. 23, 2002
June 4, 2002
Aug. 12 , 2002
Oct. 9, 2002
400 Jy
Fig. 1. (Contd.)
ASTRONOMY REPORTS Vol. 48 No. 12 2004
MONITORING OF Sgr B2 971
8070Radial velocity, km/s
Nov. 11, 2002
(f)
Flu
x de
nsity
, Jy
6050403020
June 23, 2003
Sep. 23, 2003
July 1, 2003
Aug. 4, 2003
May 27, 2003
Mar. 25, 2003
Jan. 28, 2003
Jan. 10, 2003
400 Jy
Fig. 1. (Contd.)
ASTRONOMY REPORTS Vol. 48 No. 12 2004
972 LEKHT et al.
8000
6000
4000
2000
0
4000
2000
0
1984 1988 1992 1996 2000 2004 Years
(‡)
(b)2.5
2.0
1.5
0 2 4 6 8 10Running number N
Peri
od, y
ears
Inte
grat
ed f
lux,
Jy
km/s
M
M
MM
M
M
M
N
NN
N
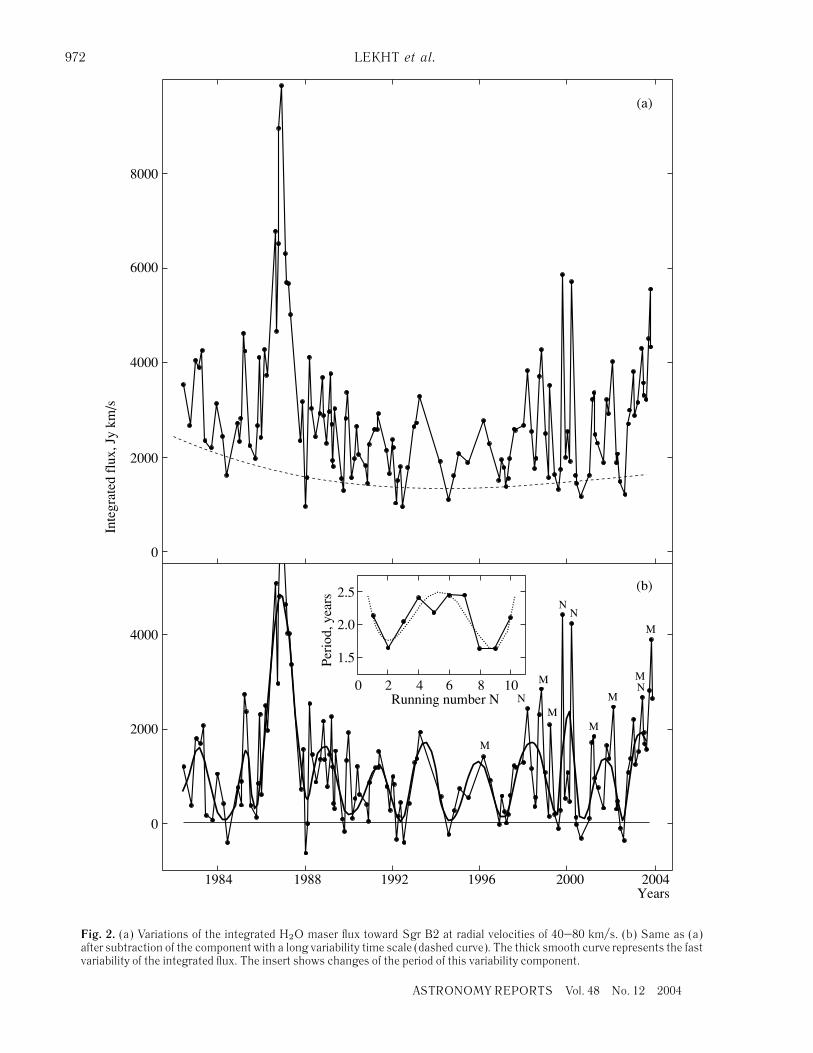
Fig. 2. (a) Variations of the integrated H2O maser flux toward Sgr B2 at radial velocities of 40–80 km/s. (b) Same as (a)after subtraction of the component with a long variability time scale (dashed curve). The thick smooth curve represents the fastvariability of the integrated flux. The insert shows changes of the period of this variability component.
ASTRONOMY REPORTS Vol. 48 No. 12 2004

MONITORING OF Sgr B2 973
Vel
ocity
cen
troi
d, k
m/s
1984 1988 1992 1996 2000 2004Years
(‡)
(b)
Fig. 3. Same as Fig. 2 for the velocity centroid (see text).
1.35 cm is 2.6′. For a pointlike source of unpolarizedemission, an antenna temperature of 1 K correspondsto a flux density of 25 Jy. The signal analysis wasperformed using a 96-channel (128-channel since1997) filter-bank spectrum analyzer with a resolutionof 7.5 kHz (0.101 km/s at 1.35-cm).
Figure 1 shows the H2O spectra of Sgr B2 cor-rected for absorption in the Earth’s atmosphere. The
ASTRONOMY REPORTS Vol. 48 No. 12 2004
horizontal axis plots the radial velocity with respect tothe Local Standard of Rest and the vertical axis theflux density in Jy. In view of the large range coveredby the signal, the figures are given on different scales.The vertical arrows show the scale intervals in Jy, andthe horizontal lines trace the zero levels of the spectra.
We have obtained most of the H2O spectra atvelocities of ≈40–80 km/s. Since the beginning of

974 LEKHT et al.
1984Years
Inte
grat
ed f
lux,
arb
. uni
tsV
eloc
ity c
entr
oid,
arb
. uni
ts
1988 1992 1996 2000 2004
F
int
V
c
Max
V
c
Max
F
int
Min
F
int
Min
V
c
Max
F
int
Min
F
int
Extrem
V
c
Extrem
V
c
Fig. 4. Top: normalized curves showing the fast variability of the integrated flux Fint (solid) and of the velocity centroid Vc
(dotted). Bottom: positions of the extrema of these curves (see text). The arrows mark flux extrema for which good correlationswith velocity-centroid extrema are observed.
2002, the studied range was extended toward lowervelocities, to 20–25 km/s. We have observed a num-ber of flares of individual components at velocities of20–40 km/s. The activity of the maser spots respon-sible for this emission decreased in 2003. Accordingto the VLBI observations of Kobayashi et al. [9],the emission at VLSR < 40 km/s comes primarily notfrom source N, but from other groups of maser spots.For this reason, we calculated the integrated flux andvelocity centroid for velocities of≈40–80 km/s.
Figure 2a shows the variations of the integratedH2O maser emission for the entire monitoring inter-val at velocities of ≈40–80 km/s. The dashed curveis a fitted smooth curve describing the slow flux vari-ations (the “base curve”). The curve obtained af-ter subtracting the base curve is shown in Fig. 2b.Strong, short-lived flares of emission are observed.However, we were able to fit a component exhibitingquasiperiodic changes in the integrated flux with amean separation between consecutive maxima (pe-riod) of two years. The maximum period is 2.45 years,and the minimum period 1.6 years. Each cycle ofactivity includes several (from one to three) bursts.The insert in Fig. 2b presents the time variations
of the period (the horizontal axis shows the runningnumber of the “wave” corresponding to the quasiperi-odic variations). The dashed curve is a fitted fourth-power polynomial. It is obvious that the variability ofthe periods is not random and displays a more or lessregular character.
Figure 3a presents the variations of the velocitycentroid, also for the entire monitoring interval. Thedashed curve is a fitted second-power polynomial.The result of subtracting this polynomial from thevelocity centroid curve is given in Fig. 3b. The thickcurve is a fitted composite curve reflecting the fastvariations of the centroid. As noted earlier in [10],we found no correlation between the long-term varia-tions of the integrated flux and the velocity centroidin the monitoring data for 1982–1992. The entiremonitoring data set (1982–2003) shows that the basecurve of the integrated flux and the slow variations ofthe centroid have similar characters, displaying slowchanges with a time scale considerably longer thanour monitoring interval, i.e., >22 years.
To search for correlations between the fast fluxvariations with a mean period of two years and thevelocity centroid, we normalized the flux and cen-troid variations. The variability of these parameters
ASTRONOMY REPORTS Vol. 48 No. 12 2004
MONITORING OF Sgr B2 975
of the H2O maser emission after this normalizationis shown in the top panel of Fig. 4. The verticalsegments at the bottom of the figure show (from topto bottom): (1) the position of the flux maxima (solid)and minima (dotted), (2) the same for the velocitycentroid, (3) a superposition of the flux maxima andcentroid extrema (maxima and minima), and (4) thesame for the flux minima. The arrows mark flux max-ima and minima for which good correlations withextrema of the velocity centroid are observed. Thedifferences in their positions do not exceed 0.2 periodsof the short-period variations.
3. DISCUSSION
The second stage of the monitoring shows strongvariability of the spectra, which always contain a largenumber of components (more than 30). The emissionof the components virtually always overlaps at veloci-ties of 45–75 km/s, forming a jagged total spectrum.However, emission features with high fluxes appearedquite frequently, whose fluxes, radial velocities, andlinewidths we could estimate. Studies of the variabil-ity of the integrated flux and velocity centroid are ofinterest for such composite spectra.
Our results can be understood as a consequenceof the fact that there are two main clusters of maserspots in Sgr B2: N and M, separated by only 45′′.With the beamwidth of the 22 m antenna (2.6′),we receive emission from N and M essentially as asingle source. As we showed earlier [10], the verystrong flare of 1986–1988 was probably associatedwith Sgr B2(N). This conclusion was based on theVLBI observations of Kobayashi et al. [9] in Decem-ber 1985.
Another difficulty is that there were no interfero-metric observations of Sgr B2 in 1992–2003. In ad-dition, our 1982–1992 observations revealed a strongradial-velocity drift for some emission features. Thiscomplicates an unambiguous identification of spec-tral components with the N and M sources basedpurely on the 1985 VLBI observations.
3.1. Main Results of the Monitoring
In spite of the difficulties noted above, we wereable to derive some results on the variability of theemission as a whole, reflecting the total activity of theregions of maser emission; i.e., the two main groupsof maser spots.
(1) We detected no slowly varying component ofthe integrated flux (at radial velocities of 40–80 km/s)with a period less than the duration of our monitoringinterval, 22 years. There is only one fairly pronouncedminimum in 1992–1994. If such long-term variabilityexists, its characteristic period will be considerably
ASTRONOMY REPORTS Vol. 48 No. 12 2004
30 40 50 60 70 80Radial velocity, km/s
Oct. 27, 2003
1
Flux
den
sity
, Jy
2
34
5
6
7
8
9
1011
1213
M N
52.6–65.4 km/s 65.5–78.4 km/s
M N
1
23
4
5
6
7
8
1013
12119
Flux
den
sity
, Jy
600
500
400
300
200
100
0
300
200
100
0
500
400
300
200
100
0
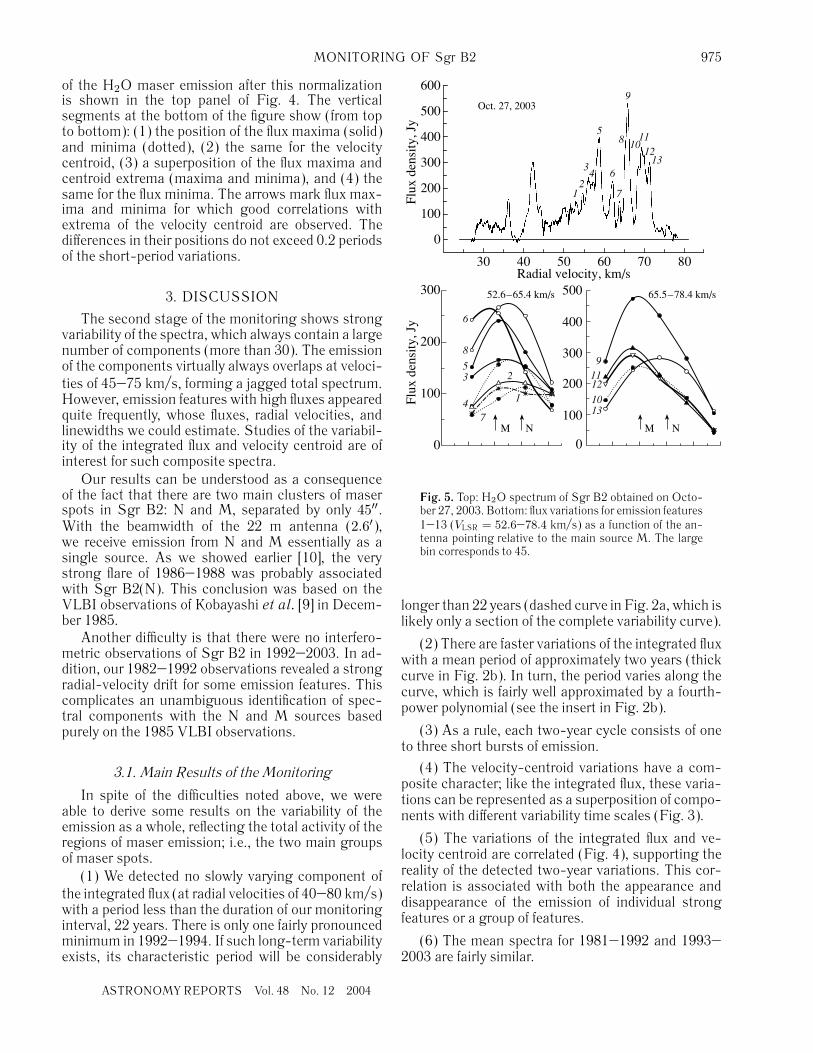
Fig. 5. Top: H2O spectrum of Sgr B2 obtained on Octo-ber 27, 2003. Bottom: flux variations for emission features1–13 (VLSR = 52.6–78.4 km/s) as a function of the an-tenna pointing relative to the main source M. The largebin corresponds to 45.
longer than 22 years (dashed curve in Fig. 2a, which islikely only a section of the complete variability curve).
(2) There are faster variations of the integrated fluxwith a mean period of approximately two years (thickcurve in Fig. 2b). In turn, the period varies along thecurve, which is fairly well approximated by a fourth-power polynomial (see the insert in Fig. 2b).
(3) As a rule, each two-year cycle consists of oneto three short bursts of emission.
(4) The velocity-centroid variations have a com-posite character; like the integrated flux, these varia-tions can be represented as a superposition of compo-nents with different variability time scales (Fig. 3).
(5) The variations of the integrated flux and ve-locity centroid are correlated (Fig. 4), supporting thereality of the detected two-year variations. This cor-relation is associated with both the appearance anddisappearance of the emission of individual strongfeatures or a group of features.
(6) The mean spectra for 1981–1992 and 1993–2003 are fairly similar.

976 LEKHT et al.
3.2. Structure of the Sources Sgr B2(N)and Sgr B2(M)
Both of the main sources—M and N—are com-posite, in terms both of their structure and the mostprobable interpretation of the observed maser emis-sion. The extent of the Sgr B2(N) region is 4′′ × 4′′,within which there are individual maser spots andgroups of spots [9]. Some of these form an elongatedstructure 4′′ × 2′′ in size (0.2 pc× 0.1 pc for a distanceto Sgr B2 of 10 kpc). This configuration is associatedwith a bipolar gaseous outflow from the accretion disk[4], which hosts the three ultracompact HII regionsK1, K2, and K3 [2].
The most intense H2O maser emission inSgr B2(M) is associated with a compact group ofmaser spots, which are projected against the ultra-compact HII region F. According to Kobayashi et al.[9], the maser spots occupy an area 0.04 pc× 0.04 pcin size (the distance to Sgr B2 adopted in [9] is8.5 kpc). It is supposed that the HII region F is thecenter of activity of the OH, H2CO, and H2Omasers.Later, Gaume et al. [2] showed that this regioncontains four subsources (F1–F4). The diameters ofeach are close to 0.01 pc, and their brightness tem-peratures are no lower than 23 400 K [13], whereas thestandard temperatures of HII regions in the Galaxyare 6000–9000 K. The radial velocity found from theH66α hydrogen radio recombination line emitted bythe source F as a whole is≈70 km/s [13].
The strongest emission in the H2O spectrum ofSgr B2(M) appeared at velocities of 60–70 km/s.This group of maser spots is located between thesubsources F1–F4 [7]. Another difficulty with themodel is that the Sgr B2(M) region contains a molec-ular outflow [6, 14], which is also associated withultracompact HII regions and maser sources [9]. Itcannot be excluded that the water vapor maser isnot located at the edge of any part of the regionF, but instead in the molecular outflow. Thus, themost intense H2O sources in Sgr B2(N) and (M)are probably associated with molecular outflows. Thedifference between them consists in the sizes of theregions hosting the main groups of H2O maser spotsand in the temperatures of the HII regions K and F.
3.3. Identification of Spectral Components
To identify the strongest spectral components withthe sources M and N, we carried out special ob-servations at several points along the line connect-ing these sources on October 27, 29, and 30, 2003.This line is exactly aligned with the declination ax-is. The spacing between the points was equal tothe projected distance between the sources M andN, 45′′. For 13 components at radial velocities of
52.6–78.4 km/s, we obtained flux curves for the var-ious antenna pointings in declination relative to themain source Sgr B2(M) (Fig. 5). The numbers indi-cate the strongest emission components. The arrowson the lower graphs show the positions of the sourcesM and N.
The H2O spectra of each of the sources are fairlycomplex, and contain emission features overlappingin velocity. For this reason, the maxima of the curvesusually do not coincide with the directions toward Mor N, but are instead somewhere between them. Theposition of the maximum is determined by the ratioof the emission from the two sources. We estimatedqualitatively the contribution of each of the sources tothe total spectrum. Some intense emission features in1992–1998 fall in gaps in the spectrum for October27, 2003. We were able to identify these in the spectraobtained by Kobayashi et al. [9].
We took the H2O spectra for 1992–2003, whichcorrespond to the maxima of the bursts, for identi-fication. We then estimated the contribution of eachof the sources to the integrated flux. The letters Mand N in Fig. 2b denote bursts in which the emissionof the corresponding source dominated. When theemission of both regions is comparable, both M andN are indicated (May 2003). We can see that theemission maxima for these sources alternate; this isimportant for our understanding of the integrated-fluxand velocity-centroid variations and, especially, thecomponent with the two-year period.
On December 4, 2003, we performed observationssimilar to Fig. 5 at velocities of 39.9–52.6 km/s.These observations show that this emission is as-sociated with the northern source. According toKobayashi et al. [9], most of the emission featuresbelong to the group of maser spots “j,” which islocated to the southwest of Sgr B2(N).
3.4. Variability of the Emission Fluxand Velocity Centroid
As we noted above, using the complete set ofmonitoring results (1981–2003), we can distinguishthree variability components in the integrated flux.The fastest variations—bursts of emission—wereobserved throughout the monitoring interval, withthe duration of a burst being approximately two tosix months. The structure of the whole spectrumchanged or was dominated by the emission of oneor two features. The bursts of groups of maser spotsassociated with the sources M and N alternated. Nocorrelation in the periodicity of this alternation wasobserved.
We believe the variations with amean period of twoyears are real, since they are correlated with variationsof the velocity centroid (Fig. 4). The spectra changed
ASTRONOMY REPORTS Vol. 48 No. 12 2004

MONITORING OF Sgr B2 977
strongly from period to period, resulting in variationsof the velocity centroid. The periods of fast variabil-ity of the integrated flux are not constant, but thesevariations display a more or less regular characterthat is fairly well approximated by a fourth-powerpolynomial. It is difficult to explain this, since theobserved emission is a superposition of the radiationfrom two comparable groups of maser spots.
We can also note a correlation between the flux andthe velocity centroid associated with slow variationsof the emission.
3.5. Mean Spectra
Since there was a minimum of the maser emissionin 1992–1994, we plotted mean H2O spectra for thetime intervals before and after this minimum. Thethick solid curve in Fig. 6 shows the mean spectrumfor 1981–1992. The dashed curve shows segmentsof this spectrum from which two components of thestrong flare of 1986–1987 (at 55.4 and 65.7 km/s) areeliminated. The thin curve represents the spectrumfor 1993–2003.
We note the following facts.—The H2O spectra are superpositions of the
emission from two more or less comparable sources(M and N).
—The structure of the spectrum undergoes strongtime variations.
—Spatial displacements of the maser spots insource N have been detected [14].
—A radial-velocity drift of individual emission fea-tures has been observed [10].
In spite of the noted variations of the emission,the two mean spectra are quite similar in both ampli-tude and structure, which is especially important. Theemission is present throughout the velocity range 45–73 km/s, but there is a large gap at 60.5 km/s during1982–1992. Individual peaks present in both spectrawere due to emission that was faint (for the Sgr B2maser) but continuously present in the spectra formany years. Some peaks were associated with strongsingle or repeated bursts of emission. Flares occurredduring the entire monitoring interval.
The observed drift of the components in space andin the H2O spectrum could indicate the presence of aradial-velocity gradient in themasing region. A shockwave from a stellar wind or molecular outflow prop-agating in such a medium will consecutively exciteregions with different radial velocities, giving rise tospatial and spectral drifts of maser spots.
Such structures have been detected, for example,as chains or filaments. The stellar wind from a centralstar or molecular outflow can also result in apprecia-ble motion of a maser spot with some acceleration.
ASTRONOMY REPORTS Vol. 48 No. 12 2004
45 50 55 60 65 70 75Radial velocity, km/s
1981–19921992–2003
Flux
den
sity
, Jy
500
400
300
200
100
0
Fig. 6. Mean H2O spectra of Sgr B2 calculated for thetwo time intervals 1981–1992 (thick curve) and 1993–2003 (thin curve).
As the effect of these factors subsides, the spot maybe decelerated in the interstellar medium.
The recurrence of the mean H2O spectra for vari-ous epochs suggests that the former effect is relevantfor the two main groups of maser spots associatedwith Sgr B2(M) and Sgr B2(N), although the possi-ble influence of the latter effect on the character of thespectral variability cannot be ruled out. The masingmedium is strongly fragmented, and such fragmentsmust be fairly stable.
Analysis of the variations of individual emissionfeatures for the entire interval of 1982–2003 couldbe important for refining models for the source. Theresults of such an analysis will be given in a separatepaper. Approximately two–three times per year, wealso included in our monitoring program observationsat several points similar to those observed on October29 and 30, 2003. This will enable us to derive spec-tra separately for Sgr B2(M) and Sgr B2(N), whichis very important for interpreting the integrated fluxvariations.
4. CONCLUSION
To conclude, we summarize our results.(1)We have presented a catalog of H2O spectra for
Sgr B2 obtained in 1992–2003.(2) The results of our monitoring in 1982–2003
reveal slow changes of the integrated flux, which has aminimum in 1992–1994, and of the velocity centroid

978 LEKHT et al.
(at radial velocities of 40–80 km/s). The 22-yearobservation interval proved to be too short to revealany periodic character of this long-term variability.
(3) There is an alternation of the emission maximafor Sgr B2(M) and Sgr B2(N). No periodicities werefound.
(4) We detected short-term variations of the in-tegrated flux with a mean period of two years, whichcorrelate with the velocity-centroid variations.
(5) All the detected types of variability are su-perpositions of variations in the emission from thetwo main groups of maser spots associated withSgr B2(M) and Sgr B2(N).
ACKNOWLEDGMENTS
Observations on the RT-22 radio telescope aresupported by the Ministry of Science, Industry, andTechnology of the Russian Federation (registrationnumber 01-10). The authors are grateful to the staffof the Pushchino Radio Astronomy Observatory forhelp with the observations.
REFERENCES1. S. Huttemeister, T. L. Wilson, C. Henkel, and
R. Mauersberger, Astron. Astrophys. 276, 445(1993).
2. R. A. Gaume, M. J. Claussen, C. G. De Pree, et al.,Astrophys. J. 449, 663 (1995).
3. P. de Vicente, J. Martin-Pintado, and T. L. Wilson,Astron. Astrophys. 320, 957 (1997).
4. S. N. Vogel, R. Genzel, and P. Palmer, Astrophys. J.316, 243 (1987).
5. R. A. Gaume and M. J. Claussen, Astrophys. J. 351,538 (1990).
6. D. C. Lis and P. F. Goldsmith, Astrophys. J. 356, 195(1990).
7. Y. J. Kuan and L. E. Snyder, Astrophys. J. 470, 981(1996).
8. D. M. Mehringer, Astrophys. J. 454, 782 (1995).9. H. Kobayashi, M. Ishiguro, Y. Chikada, et al., Publ.
Astron. Soc. Jpn. 41, 141 (1989).10. E. E. Lekht, O. Ramires Hernandes, A. M. Tol-
machev, and I. I. Berulis, Astron. Zh. 81, 195 (2004)[Astron. Rep. 48, 171 (2004)].
11. D. C. Lis and P. F. Goldsmith, Astrophys. J. 402, 238(1993).
12. S. Y. Liu, D. M. Mehringer, Y. Miao, and E. Snyder,Astrophys. J. 501, 680 (1998).
13. C. G. De Pree, R. A. Gaume, W. M. Goss, andM. J. Claussen, Astrophys. J. 464, 788 (1996).
14. M. J. Reid, M. H. Schneps, J. M. Moran, et al.,Astrophys. J. 330, 809 (1988).
Translated by G. Rudnitskiı
ASTRONOMY REPORTS Vol. 48 No. 12 2004