solutions for customer engagement, mobile workforce, and
TRANSCRIPT

5 Million Customers 3.4 Million Customers
85,000 Customers
2.2 Million Customers
CLIENTS
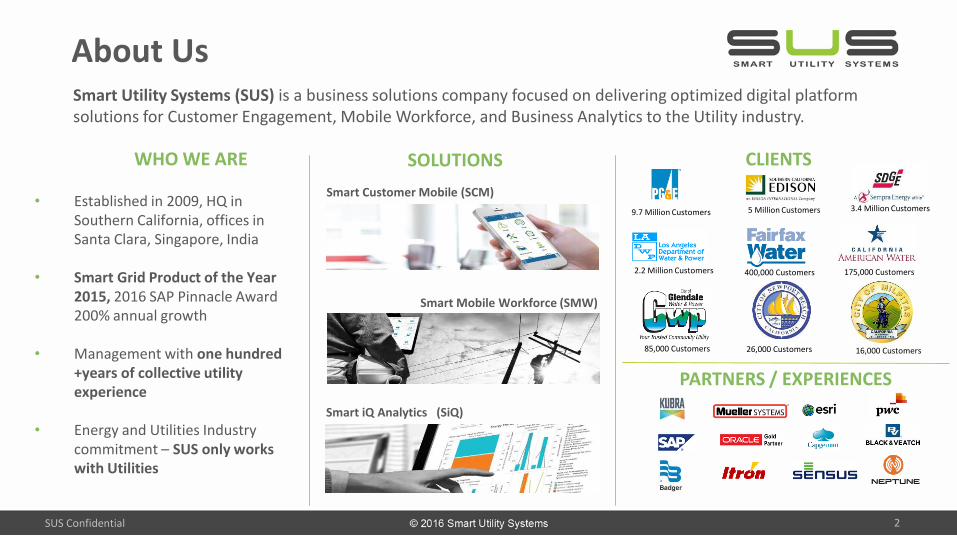
Smart Utility Systems (SUS) is a business solutions company focused on delivering optimized digital platform solutions for Customer Engagement, Mobile Workforce, and Business Analytics to the Utility industry.
• Established in 2009, HQ in Southern California, offices in Santa Clara, Singapore, India
• Smart Grid Product of the Year 2015, 2016 SAP Pinnacle Award 200% annual growth
• Management with one hundred +years of collective utility experience
• Energy and Utilities Industry commitment – SUS only works with Utilities
PARTNERS / EXPERIENCES
WHO WE ARE
9.7 Million Customers
SOLUTIONS
Smart Customer Mobile (SCM)
Smart Mobile Workforce (SMW)
Smart iQ Analytics (SiQ)
About Us
400,000 Customers
16,000 Customers
SUS Confidential
26,000 Customers
175,000 Customers
2

Unified Modules Across Devices iOS / Android / Windows Phone / Browser / Multilingual
SUS Confidential
English
Spanish / etc.
3

Utility Branded Portal
SUS Confidential
SUS Builds, Deploys and Maintains Portal with Your Branding
4

Utility Branded Mobile App
SUS Confidential
SUS Builds, Deploys and Maintains Mobile Apps with Your Branding
Cal American Water Home Screen
City of Newport BeachHome Screen
Cal American Water Report Water
Waste
City of Newport BeachModules
5

SUS Confidential
Ongoing Industry Recognition
April 16, 2016 LA Times
“Glendale has a consistent track record of implementing innovative programs to help our customers save money and conserve,” Steve Zurn, the utility’s general manager, said in the statement. “We are always looking for proven and verifiable technologies to better engage our customers.”
6
WATER SOFTENER RULES AND REGULATIONS REVISIONS

WATER SOFTENING 101
Water hardness is a measure of specific minerals in water that can impact the performance of various household and commercial functions
“Hard Water” is a measurement of mainly Calcium and Magnesium levels in water
Water Softener units use “ion exchange” technology to remove hardness
Brine and backwash discharge are byproducts of “regenerating water softeners” that enter sewer
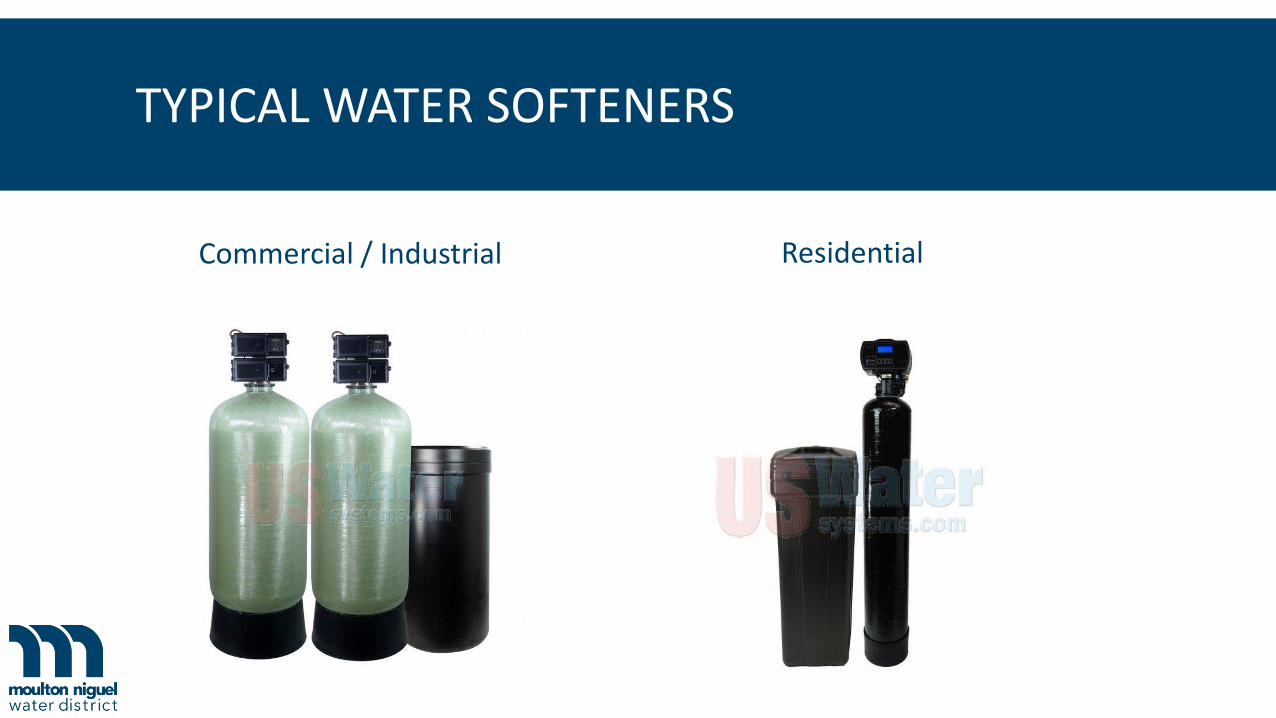
TYPICAL WATER SOFTENERS
ResidentialCommercial / Industrial

WATER SOFTENING PROCESS

WATER SOFTENING PROCESS
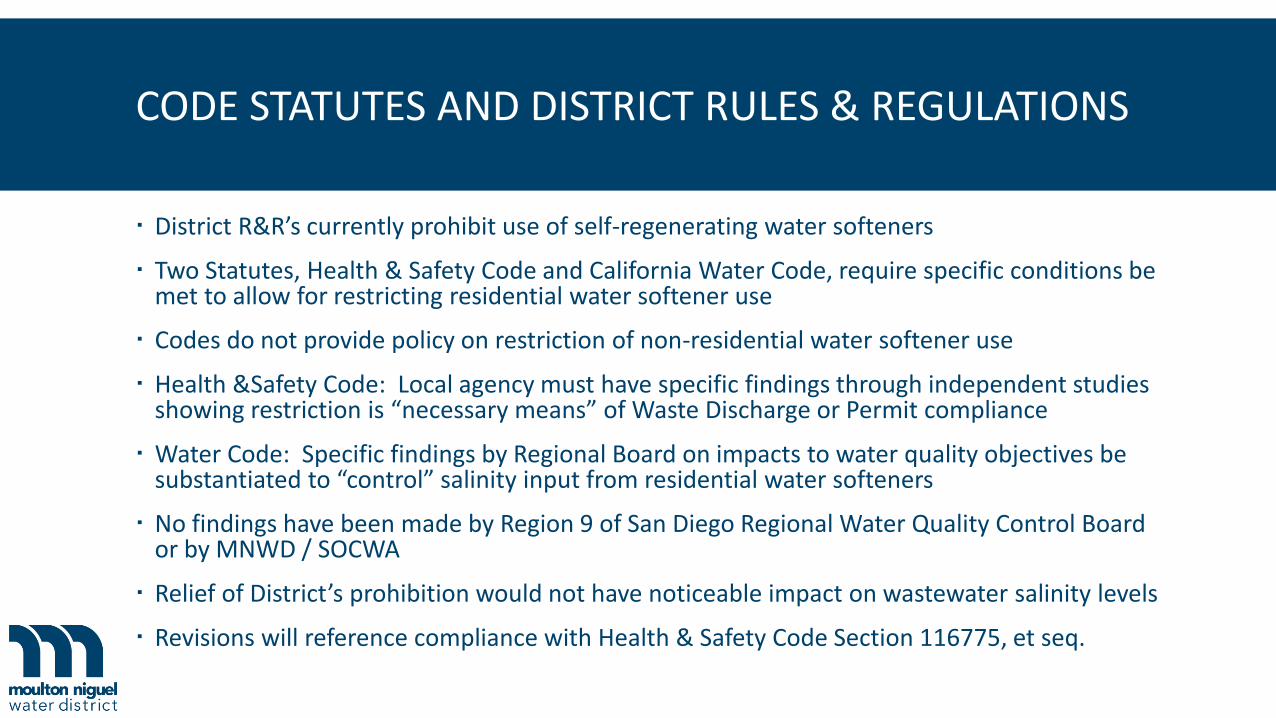
CODE STATUTES AND DISTRICT RULES & REGULATIONS
District R&R’s currently prohibit use of self-regenerating water softeners
Two Statutes, Health & Safety Code and California Water Code, require specific conditions be met to allow for restricting residential water softener use
Codes do not provide policy on restriction of non-residential water softener use
Health &Safety Code: Local agency must have specific findings through independent studies showing restriction is “necessary means” of Waste Discharge or Permit compliance
Water Code: Specific findings by Regional Board on impacts to water quality objectives be substantiated to “control” salinity input from residential water softeners
No findings have been made by Region 9 of San Diego Regional Water Quality Control Board or by MNWD / SOCWA
Relief of District’s prohibition would not have noticeable impact on wastewater salinity levels
Revisions will reference compliance with Health & Safety Code Section 116775, et seq.

STAFF RECOMMENDATION
Sections 5.B.2, 5.J.1.k, and 12 of District’s Rules and Regulations be modified (per Exhibit A) and adopted to comply with Health and Safety Code Section 116775, et seq

Questions?

Year
2013 2.54 2.88 4.08 4.79 5.99 6.07 5.81 6.53 5.26 3.92 2.52 2.49
2014 2.82 2.64 4.09 5.54 6.39 6.45 6.54 6.23 5.21 3.94 3.16 1.91
2015 2.52 3.02 4.96 5.31 4.48 5.75 5.69 6.27 5 3.88 3.24 2.35
2016 1.87 3.82 3.98 5.16 4.63 June 13, 2016
ET (Inches)
-
1,000
2,000
3,000
4,000
January February March April May June July August September October November December
Historical Monthly MNWD Water Purchases & EvapotranspirationAF

-
1,000
2,000
3,000
4,000
SWRCB Monthly Target & MNWD Water Purchases
2015/2016 Production 2013 Production SWRCB Target
AF
June 13, 2016

-
5,000
10,000
15,000
20,000
25,000
30,000
35,000
Cumulative Monthly Water Purchases versus SWRCB Allocation
2013/2014 Production SWRCB Target 2015/2016 Production
AF
June 13, 2016
0.0%
12.5%
25.0%
37.5%
50.0%
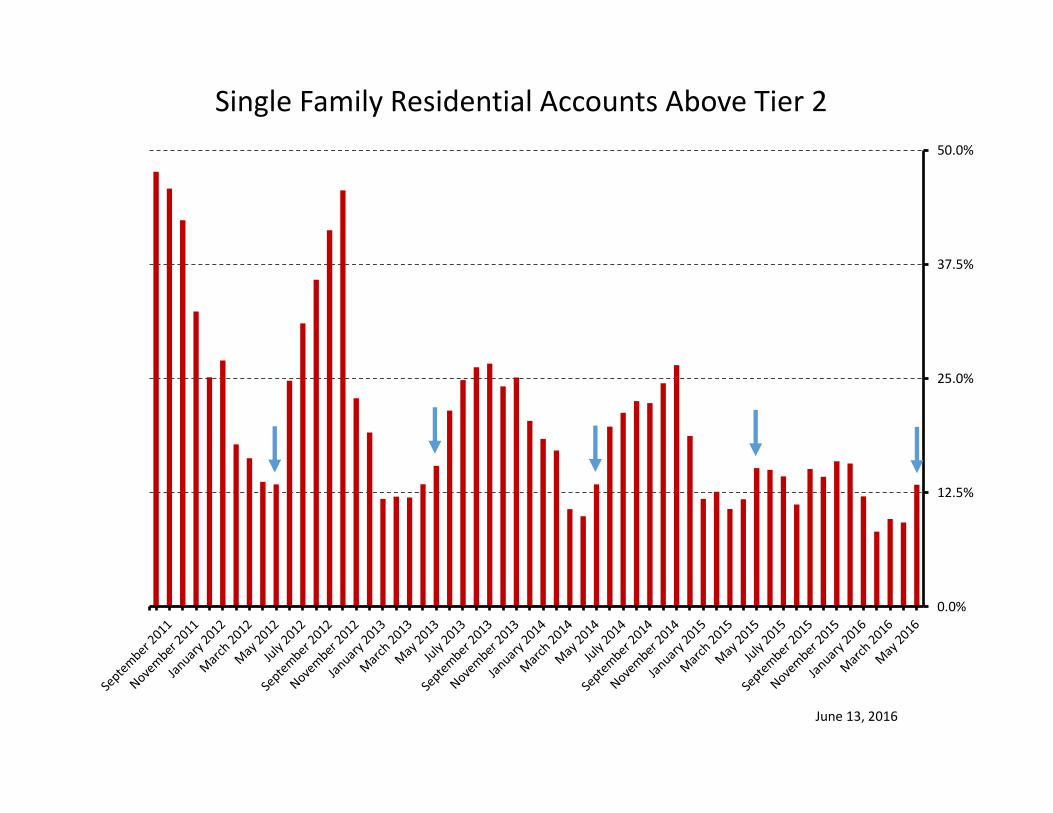
Single Family Residential Accounts Above Tier 2
June 13, 2016

94 89 101 154 131 159 102 148 134 187 173 110 70 78 83 119AF in Tier 3, 4, 5
0
250,000
500,000
750,000
1,000,000
1,250,000
Feb-15 Mar-15 Apr-15 May-15 Jun-15 Jul-15 Aug-15 Sep-15 Oct-15 Nov-15 Dec-15 Jan-16 Feb-16 Mar-16 Apr-16 May-16
Potable Usage by Tier
Tier 1 Tier 2 Tier 3 Tier 4 Tier 5
ccf
0%
25%
50%
75%
100%
Feb-15 Mar-15 Apr-15 May-15 Jun-15 Jul-15 Aug-15 Sep-15 Oct-15 Nov-15 Dec-15 Jan-16 Feb-16 Mar-16 Apr-16 May-16
Tier 5 1.5% 1.4% 1.1% 1.8% 1.6% 1.4% 4.3% 7.3% 7.0% 9.2% 9.6% 7.5% 5.6% 5.4% 5.0% 7.1%
Tier 4 1.4% 1.2% 1.1% 1.7% 1.7% 1.6% 0.3% 0.0% 0.0% 0.0% 0.0% 0.0% 0.0% 0.0% 0.0% 0.0%
Tier 3 3.3% 3.0% 3.0% 3.8% 4.1% 4.3% 0.8% 0.0% 0.0% 0.0% 0.0% 0.0% 0.0% 0.0% 0.0% 0.0%
Tier 2 23.8% 30.1% 36.1% 39.0% 40.0% 43.8% 41.9% 44.7% 40.4% 39.2% 36.2% 22.9% 26.8% 30.3% 33.7% 38.1%
Tier 1 70.0% 64.3% 58.7% 53.7% 52.6% 48.9% 52.6% 48.0% 52.6% 51.6% 54.3% 69.6% 67.6% 64.3% 61.3% 54.8%
Percent Potable Usage by Tier
Tier 1 Tier 2 Tier 3 Tier 4 Tier 5 June 13, 2016

0
400
800
1,200
Jan
-13
Mar
-13
May
-13
Jul-
13
Sep
-13
No
v-1
3
Jan
-14
Mar
-14
May
-14
Jul-
14
Sep
-14
No
v-1
4
Jan
-15
Mar
-15
May
-15
Jul-
15
Sep
-15
No
v-1
5
Jan
-16
Mar
-16
May
-16
Monthly MNWD RW ProductionAF
June 13, 2016

0
100
200
300
4001
1-2
01
0
1-2
01
1
3-2
01
1
5-2
01
1
7-2
01
1
9-2
01
1
11
-20
11
1-2
01
2
3-2
01
2
5-2
01
2
7-2
01
2
9-2
01
2
11
-20
12
1-2
01
3
3-2
01
3
5-2
01
3
7-2
01
3
9-2
01
3
11
-20
13
1-2
01
4
3-2
01
4
5-2
01
4
7-2
01
4
9-2
01
4
11
-20
14
1-2
01
5
3-2
01
5
5-2
01
5
7-2
01
5
9-2
01
5
11
-20
15
1-2
01
6
3-2
01
6
5-2
01
6
Total Turf Removal Applications by Month
Residential Commercial
Applications
June 13, 2016

0
500,000
1,000,000
1,500,000
11
-20
10
1-2
01
13
-20
11
5-2
01
17
-20
11
9-2
01
11
1-2
01
11
-20
12
3-2
01
25
-20
12
7-2
01
29
-20
12
11
-20
12
1-2
01
33
-20
13
5-2
01
37
-20
13
9-2
01
31
1-2
01
31
-20
14
3-2
01
45
-20
14
7-2
01
49
-20
14
11
-20
14
1-2
01
53
-20
15
5-2
01
57
-20
15
9-2
01
51
1-2
01
51
-20
16
3-2
01
65
-20
16
Total Turf Removal Application Size by Month
Residential Commercial
Square Feet
June 13, 2016

0
500,000
1,000,000
1,500,000
2,000,000
2,500,000
3,000,000
3,500,000
4,000,000
4,500,000
11
-20
11
1-2
01
2
3-2
01
2
5-2
01
2
7-2
01
2
9-2
01
2
11
-20
12
1-2
01
3
3-2
01
3
5-2
01
3
7-2
01
3
9-2
01
3
11
-20
13
1-2
01
4
3-2
01
4
5-2
01
4
7-2
01
4
9-2
01
4
11
-20
14
1-2
01
5
3-2
01
5
5-2
01
5
7-2
01
5
9-2
01
5
11
-20
15
1-2
01
6
3-2
01
6
5-2
01
6
Total Turf RemovedSquare Feet
June 13, 2016