solute inputs to soil and stream waters in...
TRANSCRIPT

Solute Inputs to Soil and Stream Waters in aSeasonally Snow-Covered Mountain Catchment
Determined Using Ge/Si, ⁸⁷SR/⁸⁶SR and MajorIon Chemistry: Valles Caldera, New Mexico
Item Type text; Electronic Thesis
Authors Porter, Courtney
Publisher The University of Arizona.
Rights Copyright © is held by the author. Digital access to this materialis made possible by the University Libraries, University of Arizona.Further transmission, reproduction or presentation (such aspublic display or performance) of protected items is prohibitedexcept with permission of the author.
Download date 04/06/2018 13:23:37
Link to Item http://hdl.handle.net/10150/265377

SOLUTE INPUTS TO SOIL AND STREAM WATERS IN A SEASONALLY SNOW-
COVERED MOUNTAIN CATCHMENT DETERMINED USING GE/SI, 87
SR/86
SR
AND MAJOR ION CHEMISTRY: VALLES CALDERA, NEW MEXICO
by
Courtney Porter
________________________
A Thesis Submitted to the Faculty of the
DEPARTMENT OF HYDROLOGY AND WATER RESOURCES
In Partial Fulfillment of the Requirements
For the Degree of
MASTER OF SCIENCE
WITH A MAJOR IN HYDROLOGY
In the Graduate College
THE UNIVERSITY OF ARIZONA
2012

2
STATEMENT BY AUTHOR
This thesis has been submitted in partial fulfillment of requirements for an
advanced degree at The University of Arizona and is deposited in the University Library
to be made available to borrowers under rules of the Library.
Brief quotations from this thesis are allowable without special permission,
provided that accurate acknowledgment of source is made. Requests for permission for
extended quotation from or reproduction of this manuscript in whole or in part may be
granted by the head of the major department or the Dean of the Graduate College when in
his or her judgment the proposed use of the material is in the interests of scholarship. In
all other instances, however, permission must be obtained from the author.
SIGNED: Courtney Porter
APPROVAL BY THESIS DIRECTOR
This thesis has been approved on the date shown below:
Jennifer McIntosh 11/30/2012
Jennifer McIntosh Date
Professor of Hydrology

3
ACKNOWLEDGMENTS
I would like to thank the people who have helped me with writing and the concepts in
this thesis; Jennifer McIntosh, Paul Brooks, Jon Chorover, Tom Meixner, Craig
Rasmussen, Julia Perdrial, David Vinson, Angelica Vazquez-Ortega, Xavier Zapata-Rios,
Jess Driscoll, David Huckle, Adrian Harpold, Ingo Heidbüchel, Caitlin Orem, and Cullen
Kortyna. I also want to recognize and thank Louis Derry, Gregg McElwee, Ashley
Tibbitts, and the lab at Cornell University for all of their help with my germanium and
strontium isotope samples. Thank you to the ALEC lab at University of Arizona for
running many of the samples used in this thesis. I would like to thank the National
Science Foundation and their Critical Zone Observatory Program for funding most of this
research.

4
DEDICATION
I would like to dedicate this thesis to my family; I cannot thank you enough for all that
you have done for me. My parents, Chris and Chuck, who have given every opportunity I
could ever ask for. Their love and support have gotten me to where I am today. And my
siblings, Ryan, Ashley, and Brett, I love you guys so much and feel so lucky to have you
in my life. You have also given me so much support and advice. You truly are my best
friends.

5
TABLE OF CONTENTS
ABSTRACT……………………………………………………………....................
7
1. INTRODUCTION……………………………………………………………… 8
1.1 Major and Trace Element Chemistry as a Tracer of Solute Sources…………... 10
1.2 Strontium Isotope Tracers Ratios as a Tracer of Solute Sources………………. 12
1.3 Ge/Si Ratios as a Trace of Solute Sources………………...........………………
13
2. STUDY AREA…………………………………………………………..……... 15
2.1 Geology….……………………………………………………………………... 15
2.2 Hydrology……………………………………………………………………….
16
3. METHODS……………………………………………………………………… 19
3.1 Soils…………………………………………………………………………….. 19
3.2 Bedrock….……………………………………………………………………... 22
3.3 Dust...…………………………………………………………………………... 22
3.4 Waters…..……………………………………………………………………….
23
4. RESULTS………………………………………………………………………... 26
4.1 Bedrock, Soils, and Dust Composition…………….......………………………. 26
4.2 Precipitation……...........……………………………………………………….. 27
4.3 Soilwaters……....………………………………………………………………. 29
4.4 Springs…...……………………………………………………………………... 30
4.5 Deeper Groundwater Endmember Outside La Jara Catchment…....................... 31
4.6 Stream Waters……...…………………………………………………………...
33
5. DISCUSSION…………………………………………………………………… 35
5.1 Elemental Depletion and Enrichment During Weathering….............................. 35
5.2 Mineral Weathering Reactions…………….…………………………………… 37
5.3 Subsurface Water Evolution…………….……………………………………… 38
5.4 Seasonal and Interannual Variations in Stream Water Solute Sources…...…….
39
6. CONCLUSIONS………………...………………………………………………
43
APPENDIX A: FIGURES…………….………………………………………….
45

6
TABLE OF CONTENTS - Continued
APPENDIX B: TABLES…………………….…………………………………...
68
APPENDIX C: SOIL CONCENTRATIONS…………………………………
70
APPENDIX D: DATA USED………………………………………...…………
73
REFERENCES……………………………………………………………………... 80

7
ABSTRACT
Weathering releases lithogenic elements to soil and stream waters that support life in
catchment ecosystems. Seasonal and inter-annual variations in hydrologic conditions
change subsurface flowpaths, modifying the influence of weathering on stream waters.
This study, over two climatically variable years, determined seasonal and inter-annual
changes in solute sources to streams using a multi-tracer approach including major
cations, strontium isotopes, germanium (Ge)/silica ratios, carbon species, and trace
metals. Stream water cations display constant concentrations although discharge response
was highly variable, suggesting that there is a consistent subsurface water supply.
However, Sr isotope ratios, and concentrations of Ge, Fe, Al, and dissolved organic
carbon, which originate from shallow soil waters, increase with the hydrograph during a
wet winter snowmelt. This indicates that during a year with a thick snowpack, stream
waters contain components of both shallow soilwater and groundwater during snowmelt,
whereas during all other times groundwater contributes predominantly to the stream.

8
1. INTRODUCTION
The Critical Zone (CZ) is the near-surface environment from the top of the
canopy to the water table, where majority of terrestrial life is located. Research in the
critical zone investigates the complex biogeochemical processes that support life. One of
these important processes is mineral weathering. Mineral weathering develops soils that
buffer acid rain, act as a long-term sink for atmospheric CO2, and regulate the release of
nutrient cations, such as calcium (Ca), sodium (Na), magnesium (Mg), and potassium (K)
to vegetation and waters (Brantley et al., 2007; Chadwick et al., 1999; Rasmussen et al.,
2010; Lugolobi et al., 2010). These solutes are key nutrients in soilwaters that improve
tree growth and freeze tolerance, while protecting against forest dieback, drought, and
disease (Watmough and Dillon, 2003). Solutes that are not taken up by organisms or
precipitated in secondary minerals leave the ecosystem via stream waters as chemical
denudation. Chemical denudation is defined as the net dissolved mineral mass flux from
the continents to the ocean (Balogh-Brunstad et al., 2008) and therefore encompasses
solutes transported out of a catchment via stream water, which contribute to larger rivers
downstream (Valett et al., 1997; Millot et a., 2002).
Transport of solutes through the CZ is dependent on subsurface flowpaths and
associated water-rock reactions. Subsurface waters acquire the chemical signature of
mineral-water interactions along its flowpath allowing chemical and isotopic tracers to
determine changes in mineral weathering reactions (Kurtz et al., 2010). Weathering can
be transport-limited or surface-reaction controlled depending on the rate at which water
flows along the preferential flow paths (Maher, 2010). Seasonal changes in hydrologic

9
conditions (i.e. snowmelt and monsoon rains), climate patterns, water sources, and
chemical reactions aided by organisms may affect subsurface flowpaths and water transit
times, altering mineral weathering contributions to stream chemistry (Church, 1997;
Rademacher et al., 2005; Godsey et al., 2009; Steefel and Maher, 2009; Maher, 2010,
2011). During dry periods, stream waters in many perennial mountain catchments are
dominated by groundwater discharge, whereas during snowmelt periods and heavy rains,
other solute sources, influence stream waters (Johnson et al., 1969; Clow and Drever,
1996). Clow et al. (1997) found that in Loch Vale, Colorado, waters infiltrated soils
during snowmelt periods, releasing a soilwater chemical signature to streams. In contrast,
Bain et al. (1998) observed that cation concentrations decrease during heavy rain events
in a small (0.44 km2), low elevation (297-508 m) catchment in Sourhope, Scotland due to
direct runoff of dilute rainwaters. These variations between study sites indicate that the
hydrologic and chemical processes within each catchment are unique (Anderson et al.,
1997). Multiple studies (Godsey et al., 2009; Clow and Mast, 2010; and Basu et al.,
2011) have investigated catchment discharge-concentration relationships and found that
stream discharge varies much more than concentration in many study sites, suggesting
chemostatic behavior.
This study aims to determine: 1) the chemical influence of solid soil production
on subsurface water; and 2) how changes in hydrologic conditions (variations between
seasons and years) alter the influence of weathering products on stream chemistry via
changes in subsurface flowpaths. This becomes difficult based solely on variations in
element concentrations alone due to the complexity and chemical similarity of potential

10
solute sources (Clow et al., 1997). Therefore, a multi-tracer approach is used to
investigate the major sources of solutes to a headwater stream in the seasonally-snow
covered Jemez Mountains in northern New Mexico. Major cation chemistry, strontium
(Sr) isotope ratios, and germanium (Ge) to silica (Si) ratios were monitored over 2
climatically variable years to determine solute sources to stream waters to elucidate
variations between seasons and wet versus dry years. This allows for better
understanding of how mineral weathering and therefore nutrient supply changes with
variations in climate.
1.1 Major and Trace Element Chemistry as Tracers of Solute Sources
The major cation composition of surface and subsurface waters is linked to the
intensity of mineral weathering reactions (Drever, 1988; Brown and Fuge, 1998). For
example, congruent weathering of Ca-rich plagioclase should produce Si/ Ca ratios of 1
to 2 in stream waters (Garrels and Mackenzie, 1967). However, using ion concentrations
alone to determine solute sources to stream waters is complicated by a multitude of solute
sources and processes: 1) atmospheric wet and dry deposition adds additional cations
unrelated to weathering (Kennedy et al., 1998; Chadwick et al., 2009; Pett-Ridge et al.,
2009); 2) presence of multiple mineral phases containing the same elements release non-
unique elemental signatures; 3) incongruent dissolution of soluble minerals has a greater
influence on water chemistry; 4) relative mineral weathering rates (i.e. calcite versus
plagioclase); 5) impure mineral stoichiometry that lead to trace element enrichment in
stream waters during weathering (Drever et al., 1988); 6) formation of secondary phases
11
(soil minerals) preferentially uptakes certain elements (i.e. Ge and Sr) altering stream
water chemistry; 7) decaying organic matter increases relative abundances of cations, like
Ca and K, in stream waters; and 8) dependency of Fe and Al on pH and whether they will
donate protons forming hydrogen ions in solution (Lewis acids) (Burgess, 1978) and bind
to functional groups (mainly carboxyl and phenolic) with dissolved organic matter
(DOM), increasing their concentration in stream waters (Perdue et al., 1976; Berggren
and Mulder, 1995; Benedetti et al., 1995; Kinniburgh, 1999; Tipping et al., 2002; Appelo
and Postma, 2005). Therefore multiple tracers are necessary to infer meaningful results of
solute sources to stream waters.
The carbon cycle, outlined briefly below, is important due to its influence on the
weathering process and the impact it can have on the behavior of solutes in the CZ.
Terrestrial plants take in C via photosynthesis where atmospheric CO2 and light energy is
used by autotrophs (e.g. trees) to produce biomass. Much of that C is released back to the
atmosphere by respiration, however what is not respired stays stored in the organism until
it dies. During decay of the plant, organic C is introduced to soils. The solid carbon forms
complexes (phenolic and carboxyl) and dissolves in water forming dissolved organic
carbon (DOC). Another route organic carbon can take is to be converted by soil
microorganisms (by means of heterotrophic respiration) to CO2 (inorganic carbon) which
can also be in a dissolved phase as DIC. DIC is not only produced during microbial
respiration but is also sourced from atmospheric CO2 (e.g. invasion or evasion) or
carbonate dissolution. Therefore, higher concentrations of DIC can also occur in soils
where the water is in close proximity to atmospheric CO2.

12
Due to the input of organic material into the top soil layers, DOC concentrations
are typically highest in shallow soils and decrease with depth. Because of the microbial
processing and mineral weathering, DIC concentrations are highest lower in the soil
profile (deeper soil waters) and groundwater.
1.2 Strontium Isotope Ratios as a Tracer of Solute Sources
Ca is an essential nutrient and most abundant base cation in many ecosystems
(Aberg et al., 1989. However, there are multiple sources of Ca, including dust,
precipitation, and mineral weathering that are not unique in chemical concentration and
ion ratios. Sr naturally occurs in concentrations too low to be an important nutrient but
due to the similarities in bonding properties and ionic radii of Ca and Sr, Sr has been
shown, in combination with elemental chemistry, to be an effective tracer of mineral
weathering (Blum et al., 1993; Clow et al., 1997; Frederickson, 2009). Sr isotopes are
also relevant tracers of other important base cations (Na, Mg, and K), as these elements
ultimately have the same sources (Kennedy et al., 2011).
Unlike the major elements, Sr isotopes exhibit negligible fractionation during
biogeochemical processes making the isotope ratio of 87
Sr/86
Sr a conservative tracer of
mineral weathering (Bacon and Bain, 1994). 87
Sr is produced from the radioactive decay
of 87
Rb, whereas 86
Sr is stable. Strontium isotope ratios (87
Sr/86
Sr) have been widely used
in catchment studies as conservative tracers because different strontium sources in the
environment exhibit distinctive 87
Sr/86
Sr, whereas isotopic fractionation affecting mixing
models is negligible (Aberg et al., 1989; Blum et al., 1994; Bain et al., 1994; 1998; Clow

13
et al., 1997; and Pett-Ridge et al., 2005). Individual minerals within crystalline rocks also
have distinctive 87
Sr/86
Sr ratios based on their initial Rb/Sr ratio and age, therefore the Sr
isotope ratio and Sr concentration released to waters from weathering is dependent on the
mixture of minerals that are undergoing weathering rather than the bulk rock isotopic
ratio. Minerals that have faster weathering rates, that are more abundant, and/or that have
higher Sr concentrations, have a greater influence on the Sr isotopic ratio of the
groundwater (Blum et al., 1994; White and Blum, 1995; White et al., 1999; White et al.,
2005). The Sr concentrations and isotope ratios of stream waters are not only a product of
individual minerals, but also all sources of Sr (i.e. atmospheric wet and dry deposition,
wet and dry throughfall, etc.), each with its own unique isotope ratio (McNutt, 2000).
1.3 Ge/Si Ratios as a Tracer of Solute Sources
Ge/Si ratios have been used to better understand the sources of silica to streams,
and thus silicate mineral sources of nutrients to catchments (Mortlock and Froelich, 1987;
Kurtz et al., 2002; Derry et al., 2006; Lugolobi et al., 2010, and Kurtz et al., 2011).
Germanium may substitute for Si in mineral structures due to elemental similarities
(Kurtz et al., 2011).
However, unlike Si, Ge has been found to have a positive correlation with
carboxylic acids and phenols, implying that Ge may form complexes with dissolved
organic matter (DOM; Povroski et al., 1998a, 1998b, 2000). Ge-DOM complexes were
found to account for 95% of total aqueous Ge, whereas Si-humic acid complexation was
<0.1% of aqueous Si (Povroski et al., 1998b). Therefore, interactions between Ge and

14
DOM increase concentrations of Ge in shallow soilwaters, where there is increased
organic matter.
Another difference between Ge and Si is that Ge tends to be retained in secondary
phases (e.g. soils) instead of being released to streams during primary mineral
weathering, causing partitioning to occur between Ge and Si (Kurtz et al., 2011).
Therefore, an alternative hypothesis for why Ge is enriched in soilwaters is that organic
acids break down clays, releasing Ge to surrounding waters and increasing Ge/Si ratios
(L. Derry, personal communication, June 7, 2012).
Both hypotheses allow for the use of Ge/Si ratios as a way to distinguish between
solutes sourced from primary versus secondary mineral weathering (Lugolobi et al.,
2010). Low Ge/Si ratios are derived from primary mineral weathering (Scribner et al.,
2006), which indicates deeper flowpaths dominating the streams at baseflow, whereas
higher ratios represent a shallow soilwater influence.

15
2. STUDY AREA
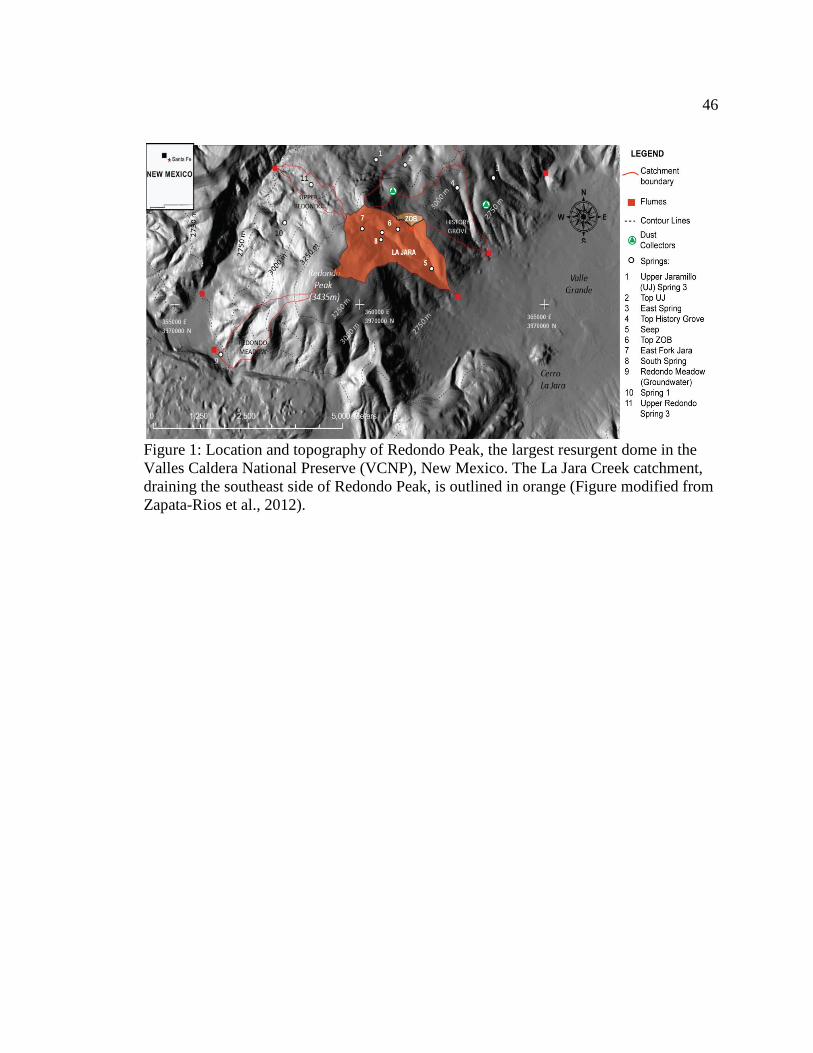
This study is focused on a small (3.29 km2) headwater catchment (La Jara Creek),
including a zero-order basin (ZOB; no stream channel), draining Redondo Dome
(elevation: 2,728 to 3,432m) in the Valles Caldera National Preserve (VCNP) in northern
New Mexico (Figure 1). The VCNP within the Jemez Mountains is the location of the
Jemez River Basin Critical Zone Observatory (JRB CZO; Chorover et al., 2011). The
Jemez Mountains are in the transition zone between the snow-dominated Rocky
Mountains and the monsoon-dominated southwest United States, resulting in bimodal
annual precipitation (Brooks and Vivoni, 2008). Snow accounts for about half the yearly
precipitation with an average maximum Snow Water Equivalence (SWE) of 257mm from
1989 to 2008 (Gustafson, 2008). The remaining half of the precipitation comes from
summer monsoon rains (Molotch et al., 2009; Broxton et al., 2009). The climate is
predominantly montane, but is also semi-arid causing it to be sensitive to drought and
climate change. Temperature and precipitation are recorded on Redondo with values
ranging from -15°C (low in winter) to 25°C (high in summer) (Broxton et al., 2009) and
575 mm (at 2550 m) and 725 mm (at 2900 m) (Broxton et al., 2009), respectively.
2.1 Geology
Most of Redondo Dome, including the ZOB, is underlain by Pleistocene aged
rhyolitic volcaniclastics of the Tewa Group
(http://geoinfo.nmt.edu/publications/maps/geologic/ofgm/). The bedrock within the ZOB
is comprised of rhyodacite (47%) and Bandelier Tuff (53%) (Figure 2), which contact in

16
the depression of the ZOB. Calcite is not present in the bedrock; however other studies
have shown that small concentrations of disseminated calcite can be present in volcanic
terrains, which may significantly influence stream water chemistry due to the high
solubility of calcite (Garrels and Mackenzie, 1967; White and Blum, 1995; Clow et al.,
1997; White et al., 1999; 2005).
Soils in the study area consist of alfisols, andisols, and inceptisols (Liu et al.,
2008; Broxton et al., 2009). Three soil complexes are located within the ZOB, the
Pasnorte-Origo Complex, Redondito-Sergent-Felsenmeers Complex, and the Vitrandic
Haplustoll (Soil Survey Staff, 2011; Perdrial et al., 2012). The upper 5 to 10 cm of most
of the soil profiles in the ZOB exhibits a signature of modern dust due to the mass input
from eolian dusts (Rasmussen et al., 2011).
2.2 Hydrology
Many local and regional groundwater systems are present in the Jemez Mountains
due to the heterogeneities in geology; however, the majority of past studies have focused
on the hydrothermal ground water systems (Vuataz and Goff, 1986; Lambert and Epstein,
1979). These larger scale (Valles Caldera) deep subsurface geothermal flow systems
show older tritium ages with waters that are recharged over long periods of time (>50
years) by precipitation whereas the streams and springs draining off of Redondo Dome
indicate younger (<5 years) tritium ages (Vuataz and Goff, 1986). Although geothermal
waters are present in the Valles Caldera, 2 km west of Redondo Dome in Sulfur Springs,

17
and just west in the Redondo Creek Reservoir (Broxton et al., 2009), there is no sign of
geothermal waters influencing La Jara Creek (Liu et al., 2008a).
Little is known about the subsurface hydrology on Redondo Dome. Broxton et al.
(2009) determined water transit times in catchments on Redondo Dome, including La
Jara, using stream water and precipitation stable water isotope signatures; water transit
times through La Jara were 109 to 153 days (higher in the catchment) to 110 to 163 days
(lower in the catchment). Using this information, in combination with other previous
research, conceptual models can be inferred. For example, Liu et al. (2008a, b) used
mixing models to determine that the majority of stream flow (71-86%) to La Jara Creek
is generated from lateral subsurface flow even during wet times of the year (snowmelt
and monsoon), and that soil moisture is the main control of subsurface pathways. Zapata-
Rios et al. (2012) went further to show that in a dry year (2011) the regional water table
is deeper, whereas in a wet year (2010) the regional water table is replenished and
contributes to stream flow. Infiltration of snowmelt waters creates a pressure head
pushing shallow soil waters to the stream (Harpold et al., in prep). Previous End-Member
Mixing analysis (EMMA) using Si and Cl was able to determine the contribution of 3
endmembers (precipitation, shallow groundwater, and deep groundwater) to stream flow.
Their results have shown that there are two dominant hydrologic sources to La Jara
Creek; deep groundwater and shallow groundwater (springs) (Liu et al. 2008b, Harpold et
al., in prep.). However, the influence of these two endmembers on stream waters is
dependent on seasonal variations. Chemical data presented in this study is in agreement
with these results.
18
The stream flow response to climatic influences was evident in the hydrograph for
La Jara Creek in 2010. Increased snowmelt from an abundant snowpack in 2010 resulted
in a discharge increase of at least an order of magnitude (peak of 2.01 mm/day) starting
in early April and spanned over about two months (Perdrial et al., submitted; Harpold et
al., in prep). Little response to the North American Monsoon (NAM) was observed in
2010. The snow season in 2011 in contrast was much shorter and the thin snowpack
allowed for soils to freeze, decreasing stream flow during snowmelt (maximum discharge
was 0.19 mm/day). Due to a wet NAM, peak discharges for 2011 in La Jara were
observed during the summer (peak of 0.25 mm/day; Perdrial et al., 2012, in review).
Based on the past literature and research described above, this study hypothesized that: 1)
During drier seasons (dry winter and summer) and years, stream water chemistry likely
reflects solute inputs from shallow ground water and direct dust deposition; and 2)
During wet seasons (monsoon rains and snowmelt), water infiltrates, flushing soil water
into the stream, resulting in a mix of soilwater and deeper ground water chemical
signatures in stream waters.

19
3. METHODS
In order to constrain endmember solute sources to stream waters, solid and liquid
samples were collected and analyzed from the ZOB, La Jara catchment, dust collectors,
and a spring at the base of Redondo Dome.
3.1 Soils
In September 2010, six soil pits were excavated and installed with soil solution
samplers in the ZOB, creating two east-west trending transects (Figure 2) as part of the
JRB-CZO. Soil samples were collected in all of the pits from each genetic horizon
(Figure 3), sealed in Zip-lock bags, and stored at 4°C. At UA soils were air dried, sieved
to recover <2 mm fraction, mixed for homogeneity, and stored at room temperature. Five
grams of each sample were mixed with a flux consisting of lithium tetraborate and
lithium metaborate, and fused. Total elemental concentrations were analyzed using
inductively coupled plasma (ICP) optical emission spectrometry (ICP-OES; Sr and Ge)
and ICP-mass spectrometry (ICP-MS; Si, Ca, Na, Mg, K, Fe, Al, and Mn) (Perkin Elmer
DRC II, Shelton, CT) (Activation Laboratories, Ancaster, Ontario).
In addition, two soil samples, one from each side of the rhyodacite-tuff contact
(Pits 4 and 6; Figure 2), were chosen to represent the two bedrock types and two different
aspects (east-facing and southwest-facing, respectively), and three additional samples
from the tuff pit (Pit 6) were chosen to represent the O, A, and B horizons.
For determination of Ge concentrations, soil samples were ashed for 30 min at
500°C in porcelain crucibles to oxidize organic matter present in the samples. Fifty mg of

20
the ashed material was measured into a disposable graphite crucible and mixed with 300
mg of flux consisting of a 1:1 ratio of lithium tetraborate and lithium metaborate. These
mixtures were fused in a muffle furnace at 1000°C for 10 minutes. The samples were
removed from the oven, swirled and then placed in the oven for another 10 minutes to
sinter the samples. The bead produced was put in 60ml acid-washed HDPE bottles that
were 2/3 full of 1N HNO3 to dissolve the glass. To aid dissolution, the bottles were
placed in a shaker until completely dissolved (~15 minutes). Samples were then hand-
filtered with a 0.45μm filter into another 60mL acid-washed HDPE bottle to remove any
leftover carbon particles. Milli-Q water was then used to dilute the sample in order to
achieve a Ge concentration of 250 ng/L. Germanium concentrations were analyzed using
the isotope-dilution, hydride-generation, ICP-MS technique (Mortlock and Froelich,
1996; Kurtz et al. 2002). About 0.750 g of 70
Ge spike was added, allowed to mix
overnight, and samples were evaporated down to about 1 mL. Samples were buffered
with a 6.55 pH Tris-HCl solution and the Germanic acid was reduced with a sodium
borohydride (NaBH4) to generate the volatile germane (GeH4). The sample was then
stripped from solution using helium and cryogenically trapped in a glass U-tube
immersed in liquid argon that was then torched allowing for a large enough Ge signal
with which the 70
Ge/74
Ge ratio could be measured. Ge concentrations were determined by
ICP-MS (Department of Earth and Atmospheric Sciences, Cornell University, Ithaca).
Sample Ge concentrations were calculated by mass balance using the natural 70
Ge/74
Ge
abundance ratio, the spike ratio, and the spike concentration to back-calculate the original
Ge concentration of the sample.

21
For strontium isotope analysis, two soil samples were completely dissolved, to
produce leachates (one sample from a depth of 48-85 cm from pit 4 and one sample from
a depth of 42-58 cm from pit 6), and analyzed. To prepare these samples, 100 mg of soil
was weighed and acid-digested with a solution of predominantly 4N hydrofluoric acid
(HF), 2 drops of perchloric acid (HClO4) and hydrogen peroxide (to oxidize organics),
then gently heated until completely dissolved. Samples were fully evaporated overnight
at low temperatures to remove SiF6 and HClO4 gases. When samples were completely
evaporated, 3.0 mL of QD (quartz distilled) HCl was added and samples were evaporated
two times. To complete the digestion, 1 mL of 2.5N QD HCl was added and the sample
was allowed to completely dissolve into acid before centrifuging for 15 minutes. Cation-
exchange chromatography was then used to collect the strontium present in the samples.
Samples were run through a column with resin and 15 mL HCl were collected and
allowed to evaporate. 5 μL of HCl was added to the sample and 1μL was loaded onto a
tungsten filament with 1μL HF. The filaments were loaded onto a turret and run on a
thermal ionization mass spectrometer (TIMS) (Department of Earth and Atmospheric
Sciences, Cornell University, Ithaca). Samples were run with a Sr reference material of
NBS 987. The precision of each analysis ranged from 0.0005 to 0.00002.
The development of soils in the CZ was approached by depicting the soil profile
as a one-dimensional column representing the development of regolith. Using an
immobile element allows for the identification of the weathering strain of multiple
elements within the soil profile. An element is normalized to the parent material by

22
relating the mass lost or gained to the element in the parent material (Figures 4) using the
equation from Chadwick et al. (2000, Eq. 2):
(2) j,w ( j,w
j,p
i,p
i,w
)
in which C is the concentration, j is the element in question, i is the immobile element, w
is the weathered material, and p is the parent material. For this study Titanium (Ti) was
used as the immobile element. Tau (τ) > 0 indicates that the element is enriched in the
soils whereas τ < 0 means that the element is depleted.
3.2 Bedrock
Surface stones were collected to be representative of the two dominant bedrock
types; the Bandelier tuff and the rhyodacite. The stones were crushed and the less
weathered sections in the center were used for mineralogical and geochemical analyses
by X-ray diffraction (PANalytical X’Pert Pro XRD, Lelyweg, The Netherlands). The
lithology of the ZOB is intermixed, so instead of using rhyodacite for the pits on the
west-side and tuff for the east-side of the ZOB weighted average bedrock was used for
mineral weathering calculations (as will be discussed in depth later), with 47% rhyolite
and 53% tuff (Vázquez-Ortega, in prep.). Representative Sr-isotope data for the bedrock
units were taken from Spell and Harrison (1993).
3.3 Dust
Dust was collected using traps at two locations; one at a high elevation on
Redondo Dome (3242 m, N35.88929’ W 106.53234’), and one at a lower elevation (2825

23
m, N 35.88555' W 106.51190') (Figure 1). Bulk samples were collected over a time
period from 7/26/11 to 10/15/11. Traps were installed on top of a 1.5 m above-ground
metal post and consisted of a circular cake pan (area of 450 cm2), filled with glass beads,
and covered in wire mesh (Reheis et al., 1999). Dust was collected in 1000 mL HDPE
bottles, and the pan and marbles were rinsed with deionized water. Samples were
centrifuged and air-dried before being subjected to a HF-HCL-HNO3 digestion and
analyzed by ICP-MS. An average of the dust chemistry at the two different elevations
was used in this study. Due to small sample size, Sr isotopes could not be determined for
dust samples.
3.4 Waters
To fully delineate the chemical and isotopic differences of waters between various
seasons, samples were taken during pre-snow melt, snow melt, summer dry period, and
summer monsoon. In 2010 stream waters were sampled monthly, whereas in 2011 a
higher frequency of sampling (weekly during snow melt) was implemented to better
characterize the stream water dynamics. Temperature (in °C), pH, dissolved oxygen (in
% of atmospheric saturation), and conductivity (in μS/cm) were determined in the field
using an Accumet AP84 (Fisher Scientific) multiprobe in the stream. Stream water and
springs for cation chemistry, trace metals, and strontium isotopes were collected in acid-
washed HDPE bottles. Stream water samples for DIC, DOC, and anion chemistry were
collected in combusted amber glass bottles. Sample bottles were packed on ice and
returned to the University of Arizona and filtered within two days of collection with 0.45

24
μm nylon filters, except for total nitrogen and total carbon which were filtered with a
combusted 0.7 glass-fiber filter. Two drops of high grade nitric-acid was added to 30 mL
splits of cations, trace metals, and Sr isotopes to preserve the sample.
Snow was collected in snow-pits weekly from March 13 to May 3, 2011, stored in
new 1 gallon Ziploc bags, kept frozen in the field, and allowed to melt overnight in the
laboratory at UA prior to filtering. Samples were filtered using 0.45-μm nylon filters
directly after melt.
Two rain collectors were used in this study, one located within the ZOB and the
other installed next to the flume (Figure 1). Bulk rain water samples were collected in DI-
washed HDPE bottles that were left over the period of a week during the monsoon
season. Bottles were packed on ice and sent to UA to be filtered within 2 days of
collection in the lab using 0.45-μm nylon filters.
Prenart lysimeters were installed at varying depths in the ZOB to sample soil
waters. Soilwater samples were hand-filtered in the field with a disposable 0.45 μm filters
into glass bottles, packed on ice, and sent to the UA. A low volume of soil waters were
produced, therefore a single soilwater sample, taken from Pit 4 on 4/27/11 from a depth
of 20 cm, was utilized for Sr isotope analysis. Due to lack of sample volume, Ge
concentrations were not run on this sample. Filtered sample splits for major cations, Sr
isotopes, and Ge were preserved in 30-ml acid-washed HDPE bottles with concentrated
Optima grade nitric acid. Major and minor cations (Si, Ca, Na, Mg, K, Fe, Al, and Mn)
were analyzed by ICP-MS in the Arizona Lab for Emerging Contaminants (ALEC),
University of Arizona (UA), Tucson. Dissolved inorganic carbon (DIC) and dissolved
25
organic carbon (DOC) were analyzed with a Shimadzu TOC-VCSH Carbon analyzer
(Shimadzu Scientific Instruments, Columbia, MD) in the Arizona Laboratory for
Emerging Contaminants (ALEC).
To determine Ge concentrations of water samples, 6 to 8 mL of sample was
evaporated to about half the original amount (3 to 4 mL). Samples were weighed before
and after to determine the exact amount of water evaporated. A 70
Ge spike of 0.17-0.65 g
was added to each sample depending on Si concentrations. Samples were then prepared
and analyzed using the same method as described for the soil digests.
Strontium isotope analysis was determined using a 5-15mL aliquot that was
gently heated until completely evaporated. Samples were then acidified with 3N nitric
acid (HNO3) and drained through a hydrochloric acid-washed column with resin (Sr-Spec
50-100 mesh, as explained in Horwitz et al., 1992). Two mL of deionized Milli-Q water
was put through the resin column, collected and gently heated until fully evaporated.
2mL of HCl was added to the beaker and once again gently heated until completely
evaporated. Strontium isotope samples were dissolved in 5μL HCl, of which 1μL was
loaded onto a tungsten filament with 1uL of concentrated HF and run as explained for the
solid soil leachates.

26
4. RESULTS
4.1 Bedrock, Soils, and Dust Composition
Cation concentrations of soils were constant with depth for all soil pits (figures in
Appendix C), and lower than the weighted average bedrock concentrations (shown by the
bottom point in each soil profile figure in Appendix C), with the exception of Si and Mg.
Cation concentrations of dust (shown above ground level in figures in Appendix C; table
in Appendix D) were lower than bedrock or soils. Silica was the dominant element in
bedrock, soils, and dust with values of 10,747 to 11,800 mmol/kg, 3,937 to 13,157
mmol/kg, and 119 mmol/kg reported as Si, respectively. Calcium concentrations ranged
from 220 to 445 mmol/kg in bedrock, 73 to 520 mmol/kg in soils, and 2 mmol/kg in dust.
Na concentrations were 165 to 1,432 mmol/kg in bedrock, 113 to 613 mmol/kg in soils,
and 20 mmol/kg in dust. Mg ranged from 70 to 150 mmol/kg in bedrock, 112 to 450
mmol/kg in soils, and was 4 mmol/kg in dust. Bedrock had Sr concentrations ranging
from 2 to 4 mmol/kg, soil Sr concentrations ranged from 1 to 2 mmol/kg in soils, and
dust Sr concentrations were 0.01 mmol/kg (Appendix D).
Aluminum, Fe, Mn, and Ge remained relatively stable in concentration throughout
the soil profile, except for the O horizon where concentrations decreased. Weighted
average bedrock concentrations of Al were higher than in the soils, whereas Fe, Mn, and
Ge were lower than what was observed in the soils. Trace element concentrations were
lowest in dust, as with major cations. Aluminum concentrations were higher in the
bedrock, soils, and dust than all other cations except for Si, with concentrations of 2,360
to 2,781 mmol/kg in bedrock, 940 to 2,689 mmol/kg in soils, and 49 mmol/kg in the dust.
27
Iron concentration ranged from 177 to 442 mmol/kg in bedrock, 160 to 635 mmol/kg in
soils, and 4 mmol/kg in the dust. Mn concentrations ranged from 4 to 9 mmol/kg in
bedrock, 4 to 48 mmol/kg in soils, and 13 mmol/kg in the dust. Ge concentrations were
low in the bedrock (17.8 to 27.4 μmol/kg), soils (0 to 30 μmol/k), as expected due to its
low natural abundance. No Ge was detected in the dust. Ge/Si ratios in solid soils
ranged from 1.7 to 2.3 μmol/mol (Figures in Appendix C; Table 1). The analyzed soils
were more radiogenic than the bedrock (presented in discussion) with a ratio of 0.71415
for pit 4 and 0.72228 for pit 6 (Figure 5; Table in Appendix D).
4.2 Precipitation
Due to instrument errors, rain samples were not analyzed for Sr isotopes. Field
parameters (pH and DO are the only ones reported in this study) were also not measured
for snowmelt waters or for monsoon rains. Only pH of snowmelt waters via lysimeters
and snow melted in the lab were measured in the lab and ranged from 4.29 to 8.47 (Table
2). These results are extremes, with the median pH value remaining near neutral. The
hydrochemical facies of rain (Ca-Na+K-HCO3) matches that of all the other water types.
However, snow is the only water type that is dominated by Mg instead of Na+K so its
facies were Ca-Mg-HCO3 (Figure 6).
Element concentrations of snow melted in the lab and snowmelt (via snow
lysimeters) collected in 2011 were very similar and were therefore averaged by day
giving time series concentration changes over the duration of the snowmelt period. Ge
concentrations in snow samples were below detection. Silica, Ca, Na, Mg, K, and Sr
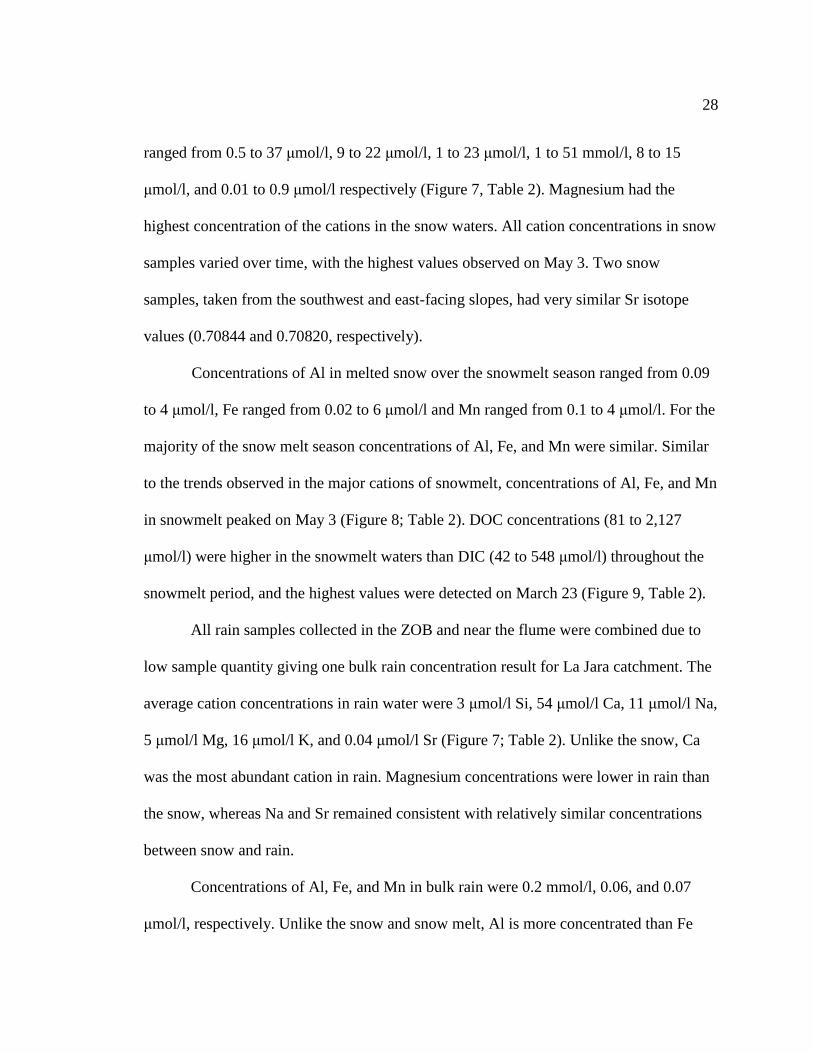
28
ranged from 0.5 to 37 μmol/l, 9 to 22 μmol/l, 1 to 23 μmol/l, 1 to 51 mmol/l, 8 to 15
μmol/l, and 0.01 to 0.9 μmol/l respectively (Figure 7, Table 2). Magnesium had the
highest concentration of the cations in the snow waters. All cation concentrations in snow
samples varied over time, with the highest values observed on May 3. Two snow
samples, taken from the southwest and east-facing slopes, had very similar Sr isotope
values (0.70844 and 0.70820, respectively).
Concentrations of Al in melted snow over the snowmelt season ranged from 0.09
to 4 μmol/l, Fe ranged from 0.02 to 6 μmol/l and Mn ranged from 0.1 to 4 μmol/l. For the
majority of the snow melt season concentrations of Al, Fe, and Mn were similar. Similar
to the trends observed in the major cations of snowmelt, concentrations of Al, Fe, and Mn
in snowmelt peaked on May 3 (Figure 8; Table 2). DOC concentrations (81 to 2,127
μmol/l) were higher in the snowmelt waters than DIC (42 to 548 μmol/l) throughout the
snowmelt period, and the highest values were detected on March 23 (Figure 9, Table 2).
All rain samples collected in the ZOB and near the flume were combined due to
low sample quantity giving one bulk rain concentration result for La Jara catchment. The
average cation concentrations in rain water were 3 μmol/l Si, 54 μmol/l Ca, 11 μmol/l Na,
5 μmol/l Mg, 16 μmol/l K, and 0.04 μmol/l Sr (Figure 7; Table 2). Unlike the snow, Ca
was the most abundant cation in rain. Magnesium concentrations were lower in rain than
the snow, whereas Na and Sr remained consistent with relatively similar concentrations
between snow and rain.
Concentrations of Al, Fe, and Mn in bulk rain were 0.2 mmol/l, 0.06, and 0.07
μmol/l, respectively. Unlike the snow and snow melt, Al is more concentrated than Fe

29
and Mn in the rain waters (Figure 8; Table 2). Rain concentrations of Al, Fe, and Mn
were also much more dilute than the snow waters. Once again there was insufficient Ge
to be analyzed; most Ge studies do not include precipitation because the concentrations
are commonly below the detection limit (Kurtz et al., 2001; Derry et al., 2006; Lugolobi
et al., 2009; Kurtz et al., 2011).
Concentrations of DIC and DOC were most dilute in rain waters compared to
snowmelt, soil waters, springs and surface waters, with average concentrations of 224
and 151 μmol/L respectively. During the monsoon wet season DIC was more
concentrated than DOC in wet atmospheric deposition, unlike the snow waters (Figure 9;
Table 2). During the cooler months wet season (snowmelt) DOC is relatively enriched
compared to DIC whereas during the warmer wet season months (monsoon) the opposite
was observed.
4.3 Soilwaters
Field parameters were not measured for soilwaters. However, pH was measured
in the lab when there was enough sample to do so (only 4 prenart samples) giving a
minimum pH of 5.22 in pit 5 to a maximum of pH of 7.11 in pit 5 (Table 2). Once again
average values of pH remained near neutral and dominant cations and anions were Ca-
Na+K-HCO3 (Figure 6).
Limited soilwater data were available because the prenart suction cups collected
small sample volumes. The lack of water collected via prenarts is likely due to the frozen
soils, from minimal snow cover, preventing water infiltration into soils. It is also due to

30
short sampling periods, prenart samplers were only held at suction during sampling (max
15 min). Only four of the soil pits (#2, 4, 5, 6) yielded sufficient data to generate results
for all of the elements investigated. Ge concentrations and Sr isotope ratios were not
analyzed for soilwaters because there was not enough volume collected from the soil
water samples. Si, Ca, Na, Mg, K, and Sr concentrations in soil waters ranged from 42 to
487 μmol/l, 68 to 2,172 μmol/l, 21 to 1,541 μmol/l, 12 to 1,317 μmol/l and 0.1 to 3
μmol/l respectively (Figure 10; Table 2). Only pits 2 and 4 sampled soilwaters in shallow
horizons and the concentrations of cations increased higher in the soil profile in pit 2.
Cation concentrations remained low and consistent with depth in all soil profiles.
Aluminum, Fe, and Mn concentrations ranged from 0.07 to 15 μmol/l, 0.06 to 85
μmol/l, and 0 to 0.6 μmol/l, respectively. Cations concentrations increased towards the
top of the soil profile, with the exception of Al that spiked in pit 2 at a depth of 52 cm
(Figure 11; Table 2). Concentrations of DOC (443 to 24,716 μmol/l) were higher than
DIC (15 to 2,768 μmol/l) in soilwaters from all four pits and increased towards the top of
the soil profile in pit 2 (Figure 12; Table 2).
4.4 Springs
The average and range of major cations in springs in La Jara catchment are
plotted below the soilwater data in figure 10. Major cation concentrations in spring
waters ranged from 151 to 829 μmol/l Si, 89 to 0.272 μmol/l Ca, 62 to 413 μmol/l Na, 14
to 45 μmol/l Mg,18 to 90 μmol/l K, and 0.2 to 0.5 μmol/l Sr (Table 2). The average field
pH of the spring samples was 6.95 and the average dissolved oxygen (DO) measurement
31
in the field was 66.63% of saturation (Table 2). Therefore, soilwaters remain near neutral
but are slightly acidic and are characterized as Ca-Na+K-HCO3 waters.
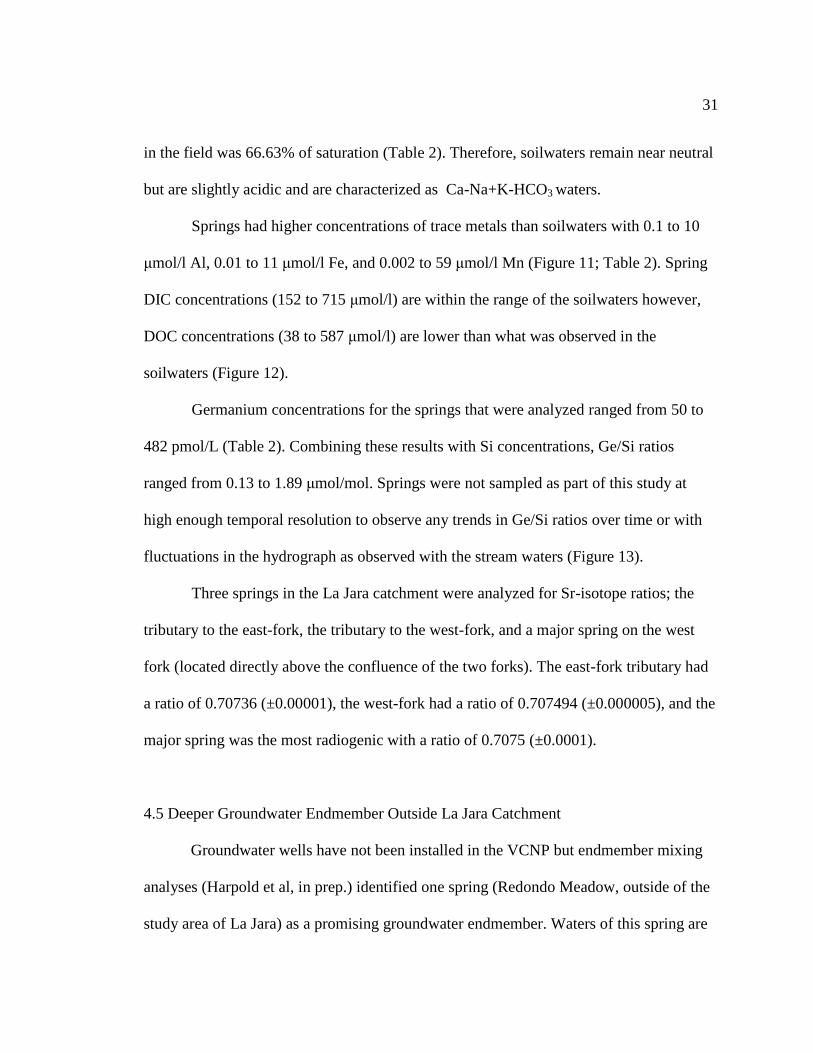
Springs had higher concentrations of trace metals than soilwaters with 0.1 to 10
μmol/l Al, 0.01 to 11 μmol/l Fe, and 0.002 to 59 μmol/l Mn (Figure 11; Table 2). Spring
DIC concentrations (152 to 715 μmol/l) are within the range of the soilwaters however,
DOC concentrations (38 to 587 μmol/l) are lower than what was observed in the
soilwaters (Figure 12).
Germanium concentrations for the springs that were analyzed ranged from 50 to
482 pmol/L (Table 2). Combining these results with Si concentrations, Ge/Si ratios
ranged from 0.13 to 1.89 μmol/mol. Springs were not sampled as part of this study at
high enough temporal resolution to observe any trends in Ge/Si ratios over time or with
fluctuations in the hydrograph as observed with the stream waters (Figure 13).
Three springs in the La Jara catchment were analyzed for Sr-isotope ratios; the
tributary to the east-fork, the tributary to the west-fork, and a major spring on the west
fork (located directly above the confluence of the two forks). The east-fork tributary had
a ratio of 0.70736 (±0.00001), the west-fork had a ratio of 0.707494 (±0.000005), and the
major spring was the most radiogenic with a ratio of 0.7075 (±0.0001).
4.5 Deeper Groundwater Endmember Outside La Jara Catchment
Groundwater wells have not been installed in the VCNP but endmember mixing
analyses (Harpold et al, in prep.) identified one spring (Redondo Meadow, outside of the
study area of La Jara) as a promising groundwater endmember. Waters of this spring are
32
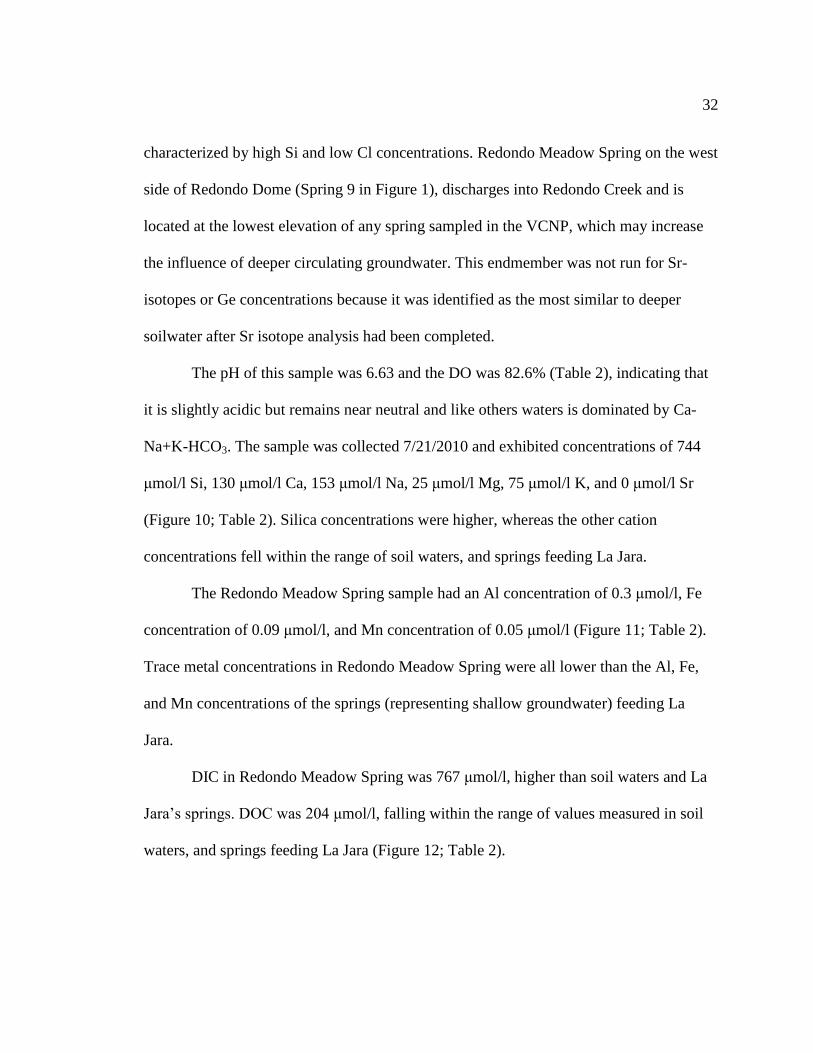
characterized by high Si and low Cl concentrations. Redondo Meadow Spring on the west
side of Redondo Dome (Spring 9 in Figure 1), discharges into Redondo Creek and is
located at the lowest elevation of any spring sampled in the VCNP, which may increase
the influence of deeper circulating groundwater. This endmember was not run for Sr-
isotopes or Ge concentrations because it was identified as the most similar to deeper
soilwater after Sr isotope analysis had been completed.
The pH of this sample was 6.63 and the DO was 82.6% (Table 2), indicating that
it is slightly acidic but remains near neutral and like others waters is dominated by Ca-
Na+K-HCO3. The sample was collected 7/21/2010 and exhibited concentrations of 744
μmol/l Si, 130 μmol/l Ca, 153 μmol/l Na, 25 μmol/l Mg, 75 μmol/l K, and 0 μmol/l Sr
(Figure 10; Table 2). Silica concentrations were higher, whereas the other cation
concentrations fell within the range of soil waters, and springs feeding La Jara.
The Redondo Meadow Spring sample had an Al concentration of 0.3 μmol/l, Fe
concentration of 0.09 μmol/l, and Mn concentration of 0.05 μmol/l (Figure 11; Table 2).
Trace metal concentrations in Redondo Meadow Spring were all lower than the Al, Fe,
and Mn concentrations of the springs (representing shallow groundwater) feeding La
Jara.
DIC in Redondo Meadow Spring was 767 μmol/l, higher than soil waters and La
Jara’s springs. DOC was 204 μmol/l, falling within the range of values measured in soil
waters, and springs feeding La Jara (Figure 12; Table 2).

33
4.6 Stream Waters
The average pH of the stream waters over the sampling period was 6.95 and the
DO value ranged from 59.6% to 76.6% of saturation, very similar to the average values
for the springs in the La Jara catchment (Table 2). Even though average values remain
near neutral, stream waters have been measured to have higher pH’s (max of 9.15), which
may be an outlier. Water chemistry is dominated by the same anions and cations as other
waters (Ca-Na+K-HCO3).
In 2010 cation concentrations in stream waters remained constant through the
snowmelt-induced hydrograph rise and recession. Greater variation of cation
concentration was observed in 2011 representing fluctuations that are only visible at
higher sampling frequency. The average values in 2010 were overall greater than 2011
for all cations and carbon species. Over the two study years, Ca concentrations ranged
from 86 to 150 μmol/l, Na ranged from 68 to 175 μmol/l, Mg ranged from 13 to 35
μmol/l, K ranged from 9 to 42 μmol/l, and Sr ranged from 0.2 to 0.3 μmol/l (Figure 14;
Table 2).
Unlike the major cations, there were detectable variations in DIC, DOC, Fe, Al,
and Ge concentrations with discharge (Figure 15-17). During peak flows in 2010, DOC,
Al, Fe, and Ge concentrations increased whereas DIC concentrations decreased.
However, during 2011 when less variation in discharge occurred, concentrations
remained relatively stable with minor variations captured by the higher frequency of
sampling. Over the two years, Al ranged from 0.3 to 1 μmol/l, Fe ranged from 0.05 to 4
μmol/l (Figure 15; Table 2), DIC concentrations varied between 115 and 783 μmol/l,

34
DOC ranged from 13 to 436 μmol/l (Figure 16; Table 2), and Ge ranged from 12 pmol/l
to 1143 pmol/l (Figure 17; Table 2). Mn and Si concentrations showed the same pattern
as cations and remained stable throughout the changes in the hydrographs of both years
with concentrations ranging from 0.003 to 0.05 μmol/l Mn (Figure 15; Table 2) and 147
to 567 μmol/l Si (Figure 17; Table 2). The lack of variation in Si concentrations along
with the changes in the Ge concentrations resulted in Ge/Si ratios that increased during
snow melt to a maximum of 3.11 μmol/mol and then decreased again during drier seasons
to a minimum of 0.07 μmol/mol (Figure 13).
Five stream water samples were analyzed for Sr-isotopes, 3 in 2010 and 2 in 2011,
to observe variations between years and seasons. Between the two years the stream water
samples varied between Sr-isotope ratios of 0.707497 (±0.000011) on March 13, 2010 to
0.707548 (±0.000007) on April 25, 2010. The lowest Sr-isotope ratio occurs directly
before the snowmelt, whereas the most radiogenic values were observed during the
snowmelt of 2010 (Figure 18).

35
5. DISCUSSION
5.1 Elemental Depletion and Enrichment During Weathering
The little concentration variation with depth in the soil profiles may be due to the
relatively young age (54 ka: Wolff et al., 2011) of the bedrock on Redondo Dome. There
has not been sufficient amount of time for the weathering front to advance and cause
depth depletion variations. Thick soils have formed on the bedrock, but there has been
minimal differential elemental loss within the soil profile. Therefore, as soils weather,
they continue to release solutes to soil waters and eventually to stream water (Stevens and
Walker, 1970; Chadwick et al., 1999; Brantley et al., 2007). This also indicates that
subsurface waters will have similar elemental concentrations.
The tau plots show the relative weathering of the soils compared to the bedrock
(Figures 19-21). Majority of elemental concentrations are consistently depleted with
depth in the soil profile (Figures 19-21). Elemental depletion in soils is due to the
weathering of primary minerals present in the bedrock like aluminosilicates, feldspars,
iron-silicates, et cetera. Ge is relatively less depleted with depth than Si because Ge in
more likely to go into secondary minerals whereas Si mobolizes into stream waters
during primary mineral weathering (Figure 21) (Derry et al., 2006).
However, some elements show variations from a consistent depletion in the top of
the soil profile. There is an increase the τ values of Ca, Mg, and Sr at the top of the soil
profile (Figure 19). This is due to the accumulation of organic material in the O-horizon
from the decomposition of organic litter that releases these cations back into the system
(April et al., 2011). High organic matter in the shallow soils also accounts for the

36
depletion of Ge. As previously mentioned, Ge forms complexes with DOM further
depleting Ge in shallow soils.
The enrichment of Mg, in some pits with depth, is a product of using a weighted
bedrock average for the parent material. The parent material that influences each pit
varies however future research to better characterize the bedrock chemical composition
will provide improved trend analyses with depth.
An increase in the τ value of Mn in the O-horizon that correlates with a large
depletion in Si and Ge can be explained by dust deposition (Figure 20 and 21). Mn is
greatly enriched in the regional dust (τ of 18); whereas Si and Ge are greatly depleted. In
most atmospheric dust there is less quartz present, which leads to a relative decreased
amount of deposited Si versus other elements on the surface of the soils (Pécsi, 1990).
This enrichment/depletion trend from dust is more noticable in pits 1-3 and 6, and may
be linked to specific catchment characteristics. For example, different types of vegetation
(grasses versus trees) intercept dust in a different ways, leading to variable enrichments
of Mn for the various pits.
The average Sr-isotope ratio for the tuff and rhyodacite was 0.7108 and 0.70642,
respectively (Figure 5; bedrock values taken from Spell and Harrison (1993)). Compared
to soil leachate Sr-isotope ratios, bedrock is unradiogenic indicating that more radiogenic
minerals are not weathered as easily. This also indicates that water composition produced
from the interaction of water with bedrock (groundwater) will be less radiogenic than
chemistries of water interacting with soils (soilwaters).
37
5.2 Mineral Weathering Reactions
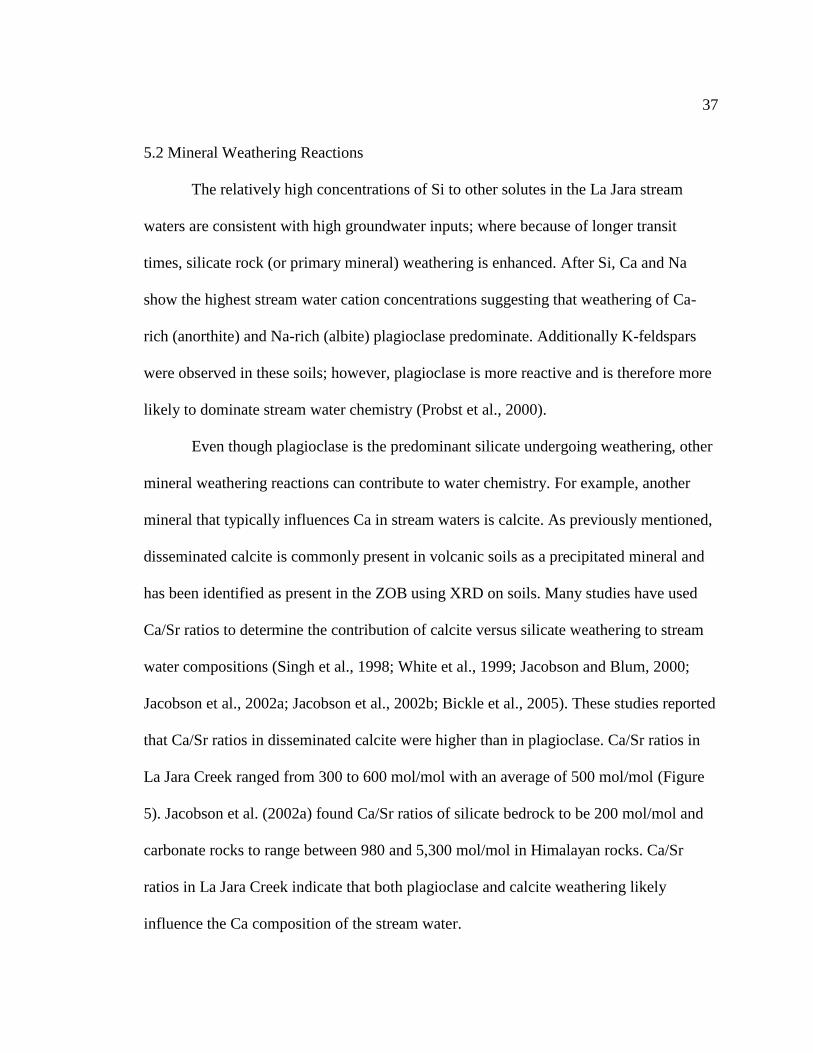
The relatively high concentrations of Si to other solutes in the La Jara stream
waters are consistent with high groundwater inputs; where because of longer transit
times, silicate rock (or primary mineral) weathering is enhanced. After Si, Ca and Na
show the highest stream water cation concentrations suggesting that weathering of Ca-
rich (anorthite) and Na-rich (albite) plagioclase predominate. Additionally K-feldspars
were observed in these soils; however, plagioclase is more reactive and is therefore more
likely to dominate stream water chemistry (Probst et al., 2000).
Even though plagioclase is the predominant silicate undergoing weathering, other
mineral weathering reactions can contribute to water chemistry. For example, another
mineral that typically influences Ca in stream waters is calcite. As previously mentioned,
disseminated calcite is commonly present in volcanic soils as a precipitated mineral and
has been identified as present in the ZOB using XRD on soils. Many studies have used
Ca/Sr ratios to determine the contribution of calcite versus silicate weathering to stream
water compositions (Singh et al., 1998; White et al., 1999; Jacobson and Blum, 2000;
Jacobson et al., 2002a; Jacobson et al., 2002b; Bickle et al., 2005). These studies reported
that Ca/Sr ratios in disseminated calcite were higher than in plagioclase. Ca/Sr ratios in
La Jara Creek ranged from 300 to 600 mol/mol with an average of 500 mol/mol (Figure
5). Jacobson et al. (2002a) found Ca/Sr ratios of silicate bedrock to be 200 mol/mol and
carbonate rocks to range between 980 and 5,300 mol/mol in Himalayan rocks. Ca/Sr
ratios in La Jara Creek indicate that both plagioclase and calcite weathering likely
influence the Ca composition of the stream water.

38
Pure phase minerals also are not common in variable terrains, such as for the La
Jara catchment. The presence of cations other than Ca and Na (e.g. Mg, K, and Fe)
implies that minerals other than plagioclase are contributing solutes to stream waters. For
example volcanic glass, which is present in the catchment, has a variable elemental
composition that likely influences the elemental composition of stream water.
5.3 Subsurface Water Evolution
Shallow soilwaters are characterized by high concentrations of Al, Fe, Ge, and
DOC (Figure 11-12). Aluminum and Fe bind to organic matter forming soluble
complexes, increasing these solutes’ concentrations in organic-rich, shallow soilwaters.
Ge is also enriched in shallow soilwaters because, as previously explained, it has a
positive correlation with DOC due to either the formation of complexes or the increased
weathering of Ge-rich secondary minerals by organic acids. The highest concentrations of
base cations in soilwaters occurs in the shallowest soilwaters in Pits 2 and 4. Divalent
cations like, Ca, Mg, and Sr are enriched in the most shallow soil waters due to the decay
of organic material as is also seen with the solid soil samples. The cations are able to
bridge different organic molecules together and form colloids (Oades, 1988).
Spring waters are characterized by moderate cation concentrations (Figure 10-12).
Si concentrations, which are higher with increased influence from bedrock weathering
(Uchida et al., 2003), are a good indicator of water residence times. Observed Si
concentrations in springs were higher than soilwater yet lower than groundwater. This
indicates that springs are sourced from a shallow groundwater that has longer residence

39
times than soilwaters but shorter residence times than deeper groundwater. From here
forth shallow groundwater is referred to as spring water.
Deep groundwater has the highest Si concentrations resulting from more extensive
water-rock interaction from longer residence times (Figure 10). DOC concentrations are
also very low in groundwater due to enhanced microbial processing and/or carbonate
dissolution further down the soil profile (Miller and Zepp, 1995).
5.4 Seasonal and Interannual Variations in Stream Water Solute Sources
Stream water chemical composition, comprised of elements that have not been
taken up by plants or precipitated as secondary minerals, was examined to analyze the
cycling of elements through the CZ. The little variation observed in the major cation
chemistry of stream water, in various years and seasons, shows that there is a dominant
water source or a consistent mixture of sources that control the chemical composition of
stream water.
High cation, Si, and DIC concentrations in correlation with low DOC, Al, and Fe
concentrations, and unradiogenic Sr-isotope ratios in stream waters indicates that this
prevailing elemental source is groundwater. Sr-isotope ratios and Ca/Sr ratios of the
stream waters plot closest to the sampled springs within the La Jara catchment (Figure 5),
showing that springs (shallow groundwaters) are the predominant input to stream waters.
However, deeper groundwater (not analyzed for Sr isotopes) also plays an important role
in sourcing of solutes to stream water. Groundwater also has high Ca/Sr ratios (due to its
Sr concentration that is below detection and Ca concentration of 130 μmol/L). Therefore

40
the higher Ca/Sr ratios of some stream water samples compared to the springs is
indicative of a deeper groundwater influence (Figure 23A). This is consistent with
previous endmember mixing analysis, which showed that the predominant endmember is
a mix of spring water and deep groundwater (Liu et al., 2008b; Harpold et al., in prep.).
In the 2010 water year, when there was a large response in the hydrograph during
snowmelt, there is no dilution of stream waters as would be expected by direct run-off
into the stream. Instead the stream water cation and Si concentrations remained constant
indicating that the two groundwaters were still the dominant sources of solutes. However,
the high concentrations of DOC, Al, Fe, and Ge, and high 87
Sr/86
Sr ratios indicate that
shallow soilwaters also had a significant influence on stream water chemistry.
Ge/Si ratios further demonstrate the change in solute sources during the 2010
snowmelt. Due to the inability to analyze soilwater Ge concentrations, representative
values from other studies are used. For example, Kurtz et al. (2011) found that shallow
soil waters exhibited the highest Ge/Si ratios, derived from the dissolution of kaolinite
that contains high concentrations of Ge (Lugolobi et al., 2010). High Ge/Si ratios may
also be present in soilwaters due to complexes formed between Ge and DOM (Povroski
et al., 1998a, 1998b, 2000). The shallow soil water endmember of Kurtz et al. (2011)
represented waters in contact with soils for longer periods of time, accumulating higher
Ge concentrations. One spring sample from La Jara exhibited a Ge/Si ratio of 3.0,
comparable to high values reported for kaolinite (up to 6.1 μmol/mol; Lugolobi et al.,
2010), which is the most abundant secondary mineral in the La Jara soils. Therefore, if
shallow soils, that are subjected to kaolinite dissolution or have high DOM, are flushed,

41
the Ge/Si ratio increases, as was observed during the 2010 snow melt. Immediately after
the peak in Ge/Si ratios (and discharge), Ge/Si ratios in stream waters decrease rapidly
(Figure 13) suggesting that the majority of the soil derived solutes (Ge, Fe, and Al) are
flushed at the beginning of the snow melt. This behavior is consistent with observations
made by Kurtz et al. (2011) who found that soil water concentration decreased with
decreasing contact time.
Soilwater signature that is present in stream waters during the 2010 snowmelt is
explained by melt infiltrating into the subsurface creating a pressure wave that “pushes”
the groundwater into the stream. Infiltration creates a vertical pressure that not only
forces the shallow groundwater (spring waters) into the deeper groundwater it also causes
lateral flow to the streams (Figure 23B). The lateral flow can be explained by a higher
relative hydraulic conductivity (K) in the lateral direction than in the vertical direction.
Therefore, cation and Si concentrations are still being controlled by the two groundwater
endmembers (springs and deep groundwater). However, shallow soils have the highest
relative K values and are also enriched in easily mobilized DOC, Fe, Al, and Ge.
Therefore, as the groundwater flows through the shallow soils it mobilizes these solutes
increasing their concentrations in stream waters and causing soilwater flushing to
streams, as known as a “hot moment” (McClain et al., 2003; Gu et al., 2011).
In 2011 however, the increased soilwater signature in stream waters was not
observed because the thin and inconsistent snowpack allowed for soil freezing and did
not provide enough melt waters to thoroughly flush the soils (Perdrial et al, in review).
Therefore, the main source of solutes to stream waters during the relatively dry year

42
(2011) remained predominantly shallow groundwater (springs) with a minor contribution
from deeper groundwater. This is also the case during summer monsoon rains. No change
in DIC, DOC, Al, Fe, Ge, or 87
Sr/86
Sr ratios was observed during the summer months.
This response is explained by evapotranspiration occurring before waters are able to
infiltrate and flush soilwaters, which was reflected by the relatively small increase in the
hydrograph during monsoons.
During the dry seasons (winter and summer) and monsoon seasons of both years,
the springs (shallow groundwater) remain the main contributor to stream waters.
Predominant flow of springs is laterally to the stream however gravity driven vertical
flow keeps the deeper groundwater table at a height that allows it to contribution slightly
to the stream. Therefore, the consistent mix of solute sources to stream waters is
predominantly shallow groundwater with minor groundwater influence.

43
6. CONCLUSIONS
By coupling element concentrations, 87
Sr/86
Sr ratios, and Ge/Si ratios this study
constrained the dominant geochemical and biological processes responsible for
development of the CZ from pedon to catchment scales in a semi-arid volcanic terrain.
Even though elemental chemistry of the solid soils remained primarily stable with depth,
depletion versus enrichment trends within the soil profile were observed relative to the
immobile element Ti. Solutes like Ca, Mg, and Sr are readily cycled by organisms and
were enriched in the very top of the soil profile. Dust deposition likely accounts for the
enrichment of Mn also observed in the top soil horizon. However, overall there was small
and constant depletion of elements with depth in the soil profile, which is attributed to the
young age of the volcanic bedrock. This led to subsurface waters with similar
chemistries.
The chemical composition of the soilwaters is dependent on depth. Shallow
waters have higher concentrations of DOC, Fe, and Al due to organic complexes formed
by these solutes. Germanium concentrations and Ge/Si ratios are enriched in shallow
soilwaters due to a combination of the weathering of secondary minerals that sequester
Ge over Si during primary mineral weathering, and/or Ge binding to DOM complexes.
Decreasing concentrations of Fe, Al, and DOC corresponding to increases in Si
concentrations in stream waters indicates that the water is being sourced from waters with
longer residence times and therefore deeper depths. High elevation spring waters have
chemistries representative of shallow groundwater, whereas the low elevation spring (at

44
the base of Redondo), has a chemical signature of deeper circulating groundwater; both
of which contribute to La Jara Creek.
Applying a multi-tracer approach to categorize different endmember waters
allowed for the identification of the main sources of solutes to the La Jara catchment.
Base cation concentrations indicate that a mix of shallow and deeper ground waters is the
predominant solute sources to stream waters for all seasons and years. Strontium isotope
ratios, Ge/Si ratios, soil cation tracers, and carbon species, however, show that during the
snowmelt of a wet year, the influence of shallow soilwaters to stream water composition
increases when deeper groundwater flushes easily mobilized complexes into stream
waters (Figure 23a). For other seasons, shallow groundwater remained the source of
solutes to stream water (Figure 23b). In the dry year (2011), frozen soils and poor
snowpacks prevented infiltration into the subsurface resulting in no signature of soilwater
flushing into the stream water. Overall, solute sources to stream waters are dependent on
seasonal and yearly hydrologic variability, indicating that as climate changes stream
water chemistry and discharge may also change.

45
APPENDIX A: FIGURES
Figure 1: Map of study site with sampling locations indicated.
Figure 2: Geology of the La Jara Creek zero-order basin.
Figure 3: Soil profiles of each of the pits installed in the ZOB.
Figure 4: Tau plot explanation.
Figure 5: 87
Sr/86
Sr ratios plotted versus Ca/Sr ratios for waters and solid samples.
Figure 6: Major ion composition of the different water types.
Figure 7: Cation concentrations in precipitation.
Figure 8: Concentrations of Al, Fe, and Mn for precipitation.
Figure 9: Concentration of carbon species for precipitation.
Figure 10: Cation concentrations in soilwaters, springs, and groundwater.
Figure 11: Al, Fe, and Mn concentrations in soilwaters, springs, and groundwater.
Figure 12: Carbon species concentrations in soilwater, springs, and groundwater.
Figure 13: Time series of solute Ge/Si ratios.
Figure 14: Time series of cation concentrations in La Jara Creek.
Figure 15: Times series of Fe, Al, and Mn concentrations in La Jara Creek.
Figure 16: Time series of dissolved carbon species in La Jara Creek.
Figure 17: Time series of Si and Ge concentrations in La Jara Creek.
Figure 18: Time series of solute 87
Sr/86
Sr ratios in La Jara Creek.
Figure 19: Cation tau plots of soils and dust.
Figure 20: Al, Fe, and Mn tau plots of soils and dust.
Figure 21: Si and Ge tau plots of soils and dust.
Figure 22: Conceptual models for seasonal and interannual solute sources.
46
Figure 1: Location and topography of Redondo Peak, the largest resurgent dome in the
Valles Caldera National Preserve (VCNP), New Mexico. The La Jara Creek catchment,
draining the southeast side of Redondo Peak, is outlined in orange (Figure modified from
Zapata-Rios et al., 2012).

47
Figure 2: Geology of the La Jara Creek zero-order basin (ZOB), instrumented as part of
the Jemez River Basin Critical Zone Observatory (location relative to Redondo Peak
shown in Figure 1). There are predominantly two bedrock types within the ZOB: the
Tschicoma Formation rhyodacite, and the Bandelier Tuff. Numbered locations represent
soil pits installed in 2011 with soil solution samplers.

48
Figure 3: Soil profiles of each of the pits installed in the ZOB. Horizons are separated by
a green line to show differences between soil development spatially in the ZOB.

49
Figure 4: Elemental depletion is best characterized by normalizing the soil horizons to the
bedrock, which is called a tau plot. Each point represents a soil horizon. Positive τ values
indicate that the element is enriched compared to the bedrock whereas negative τ values
indicate that the element is depleted compared to the bedrock. Dust was also analyzed to
see if it was enriched or depleted compared to the bedrock, it is represented by the points
above the y-axis. For this research a weighted average of the two bedrock types (tuff and
rhyodacite) was used for all of the pits, as seen in later figures. This example of a tau plot
is from Pit 3.

50
Figure 5:
87Sr/
86Sr ratios plotted versus Ca/Sr ratios for different waters and solid samples
in the VCNP. Soil leachates have low Ca/Sr ratios but have higher 87
Sr/86
Sr ratios. The
averages of ratios are plotted for both bedrock types and the grey ovals represent the
ranges of bedrock compositions. Groundwater had a Sr concentration of 0 μmol/L and
was not sampled for Sr isotopes, so that sample is not plotted. However, groundwater
would be expected to fall near the bedrock. Snow samples that were analyzed are plotted
here but due to their low concentrations, it is difficult to verify whether these are
representative values. Snow samples also are complicated because due to the 80-20 rule,
where 80% of solutes in snow are flushed out in the first melt. Sr isotope ratios were not
measured on dust; however their Ca/Sr ratios are plotted. Stream waters plot closest to
seep/springs but their Ca/Sr ratios show more variation and they are slightly more
radiogenic indicating another source of solutes to stream waters.

51
Figure 6: Major ion composition of the different water types present on Redondo. All
waters have Ca as their dominant cation and bicarbonate as their major anion. However,
relative abundances are different for each water type. Snow waters are the most dilute
whereas soilwaters have the highest concentration of Ca and groundwater has the highest
concentration of bicarbonate (DIC). Soilwaters may be charge balanced by organic acids.
52
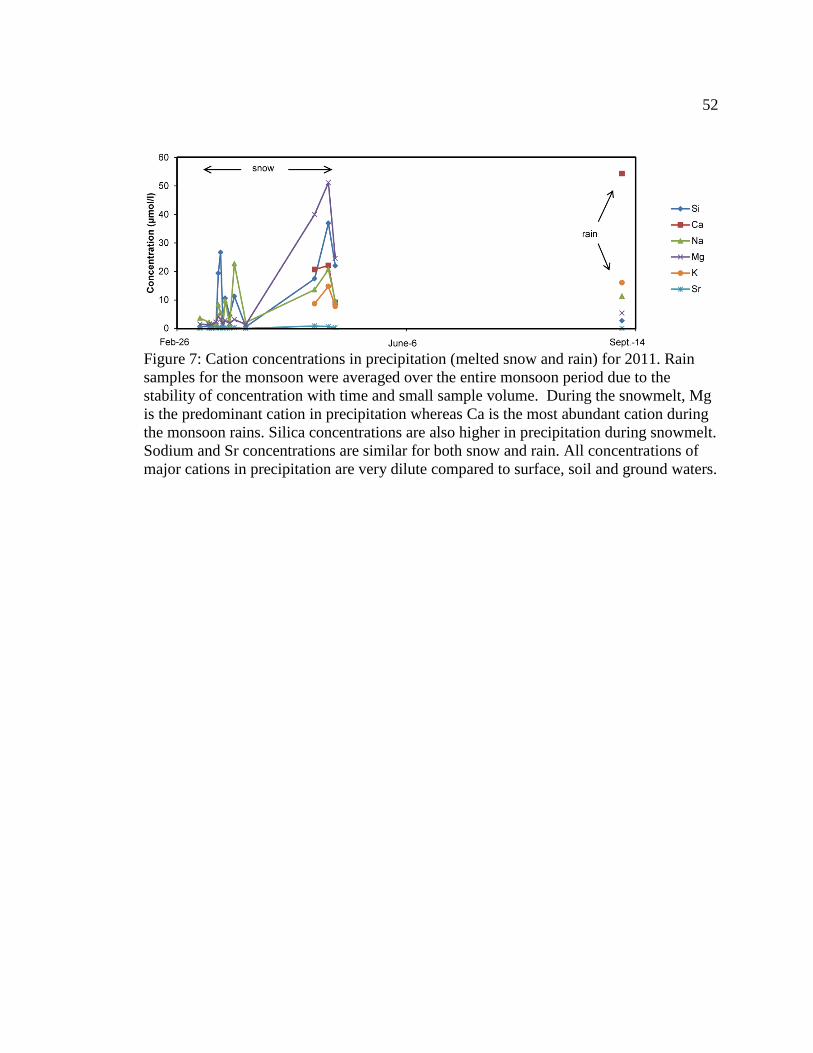
Figure 7: Cation concentrations in precipitation (melted snow and rain) for 2011. Rain
samples for the monsoon were averaged over the entire monsoon period due to the
stability of concentration with time and small sample volume. During the snowmelt, Mg
is the predominant cation in precipitation whereas Ca is the most abundant cation during
the monsoon rains. Silica concentrations are also higher in precipitation during snowmelt.
Sodium and Sr concentrations are similar for both snow and rain. All concentrations of
major cations in precipitation are very dilute compared to surface, soil and ground waters.

53
Figure 8: Concentrations of Al, Fe, and Mn for snow and rain during 2011. Snow and
snow melt concentrations are variable whereas rain are consistent and dilute.
Concentrations of Mn, Al, and Fe are relatively high in the snow and snow melt
compared to rain water.

54
Figure 9: Concentration of carbon species for precipitation (snow, snow melt, and rain) in
2011. In snow melt DOC concentrations are higher than DIC, whereas the opposite is
observed for rain waters. Concentrations are low throughout the year except for a peak in
DOC in snowmelt on March 23.

55
Figure 10: Cation concentrations of soilwaters for the 4 soil pits that produced water from
prenart samplers. The bottom two depths represent the average and range of the springs
feeding La Jara Creek, and the groundwater endmember respectively. Si concentrations
are the highest in the groundwater, whereas other concentrations of Ca, Na, Mg, K, and
Sr are within the range of soil and seep/spring waters.

56
Figure 11: Aluminum, Fe, and Mn concentrations in soilwaters, springs feeding La Jara,
and the groundwater endmember. Groundwater is dilute in Al, Fe, and Mn compared to
springs, but fall within the concentration range of soilwaters.

57
Figure 12: Carbon species concentrations in soilwater, springs feeding La Jara, and
groundwater. Groundwater is more enriched in DIC than soilwater and the springs,
whereas DOC concentrations are the lowest of the three water types.

58
Figure 13: Time series of solute Ge/Si ratios. Different springs and seeps vary in their
ratio at various times of the year. The high Ge/Si ratio of the seep/ spring in August of
2011 shows that the peak in the Ge/Si ratio of the streams in April of 2010 has the
potential to come from springs and seeps influenced by soil water.

59
Figure 14: Time series of cation concentrations in La Jara Creek for (a) 2010 and (b)
2011 overlain on the hydrograph (black line). Peak stream flow occurred during the snow
melt in 2010, but due to lack of snow in 2011, this trend is not observed. Even during an
increase in the hydrograph cation concentrations remain stable indicating a consistent
source of solutes to stream water throughout the year. More variation in concentration is
observed in 2011, which is attributed to the increase in sampling frequency.

60
Figure 15: Iron, Al, and Mn concentrations in La Jara Creek for (a) 2010 and (b) 2011.
There are two mechanisms that cause an increase in Fe and Al; (1) Fe and Al form
complexes with organic-rich material in the soils and are released to stream waters when
soils are flushed; and (2) Changes in redox conditions during the saturation of soils
causes these elements to become mobile. Iron and Al concentrations increase in 2010
during the snow melt rise in the hydrograph suggesting a soil water influence to streams.
No correlation between the hydrograph and concentrations are observed in 2011 due to
the lack of snowmelt. Similar to the patterns observed for DIC and DOC, large variations
in concentrations of Al, and Fe in the monsoon of 2011 are attributed to the Las Conchas
fire. Peak Fe concentration was 35.0 μmol/l.

61
Figure 16: Dissolved carbon species in La Jara Creek from (a) 2010 and (b) 2011. During
2010 DOC concentrations correlated with discharge and peaked during the snowmelt,
which is attributed to soilwater flushing during the onset of the snowmelt. DIC
concentrations peaked during low flows indicating a deeper water source of solutes to
stream waters. With the lack of variation in the hydrograph in 2011, little response is
observed in the DOC and DIC concentrations of La Jara Creek. Large variations in DIC
and DOC concentrations during the monsoon season of 2011 may be due to influences
from the Las Conchas Fire that occurred from June 26 to June 29, 2011 near the study
site.

62
Figure 17: Silica and Ge concentrations in (a) 2010 and (b) 2011. Germanium
concentration trends correlate with Fe and Al, indicating a change in sources of solutes to
stream waters during the snowmelt in 2010. Al, Fe, and Ge are enriched in soils;
therefore this other water source is believed to be soilwater. However, Si concentrations
remain stable, like other cations produced from primary mineral weathering, showing that
there is still a source of solutes from waters with longer residence times to La Jara.

63
Figure 18: Time series of solute
87Sr/
86Sr ratios. Isotope ratios peak during the snowmelt
of 2010, similar to Al, Fe, DOC, and Ge concentrations.

64
Figure 19: Cation concentrations normalized to the parent material (tau plots) using the
immobile element Ti for the 6 soil pits in the ZOB. Point above zero on the y-axis
represents dust. Enrichment of Ca, Mg, and Sr high in the soil profile is due to decaying
organic matter (i.e. leaf litter). Mg enrichment can be attributed to high clay content
within the soils.

65
Figure 20: Aluminum, Fe, and Mn normalized to the weighted average parent bedrock
using the immobile element Ti. Aluminum and Fe are predominantly depleted throughout
the soil profile. Aluminosilicate weathering causes depletion of Al higher in the soils
profile. Iron depletion is caused from the weathering of pyroxenes. The increase of Fe in
the O-horizon observed in some pits is due to Fe forming insoluble complexes with DOM
and from enriched dust deposition. The enrichment of Mn high in the soil profile is
attributed to the deposition of Mn-rich dust (tau value of 18, not plotted due to scaling).

66
Figure 21: Silica and Ge concentrations normalized to the weighted average parent
bedrock using Ti as an immobile element. Depletion of both Si and Ge in the soil profile
is attributed to the weathering of aluminosilicates. This is more apparent higher in the soil
profile where soils are more weathered.

67
Figure 22: Conceptual model of wet seasons (snow melt) versus dry seasons (summer
and winter) and year solute sources to La Jara stream waters. Throughout all seasons and
years a mix of shallow and deep groundwater is the main solute source to stream waters,
however seasonal and climatic variations control the contribution to stream waters from
each of these endmembers (A) During drier seasons and years, predominantly shallow
groundwater with some influence from deeper groundwater dominant stream water
chemistry. (B) During periods of intense snowmelt, infiltrating waters create a pressure
wave that moves older groundwater into the streams. As this water flows to the stream it
flushes shallow soils mobilizing solutes like Al, Fe, Ge, and DOC from organic-rich soils
into the stream.

68
APPENDIX B: TABLES
Table 1: Average solid soil chemistry.
Table 2: Chemistry averages, minimums, and maximums for different water types.
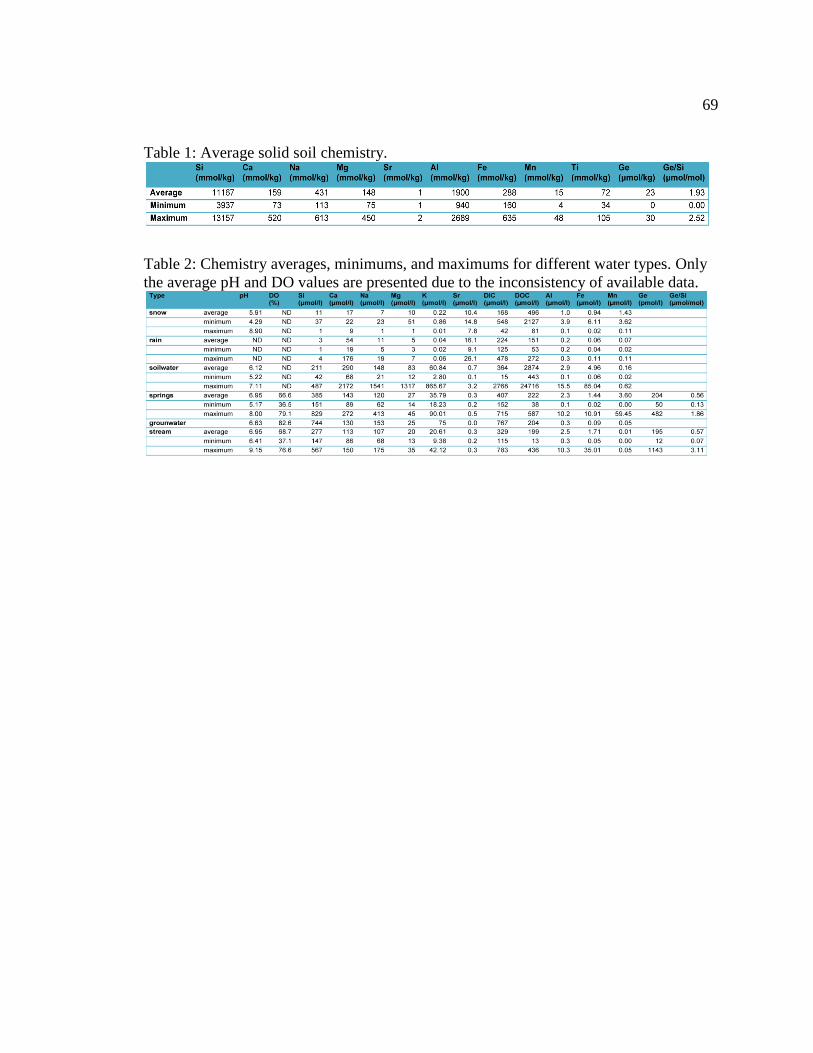
69
Table 1: Average solid soil chemistry.
Table 2: Chemistry averages, minimums, and maximums for different water types. Only
the average pH and DO values are presented due to the inconsistency of available data.
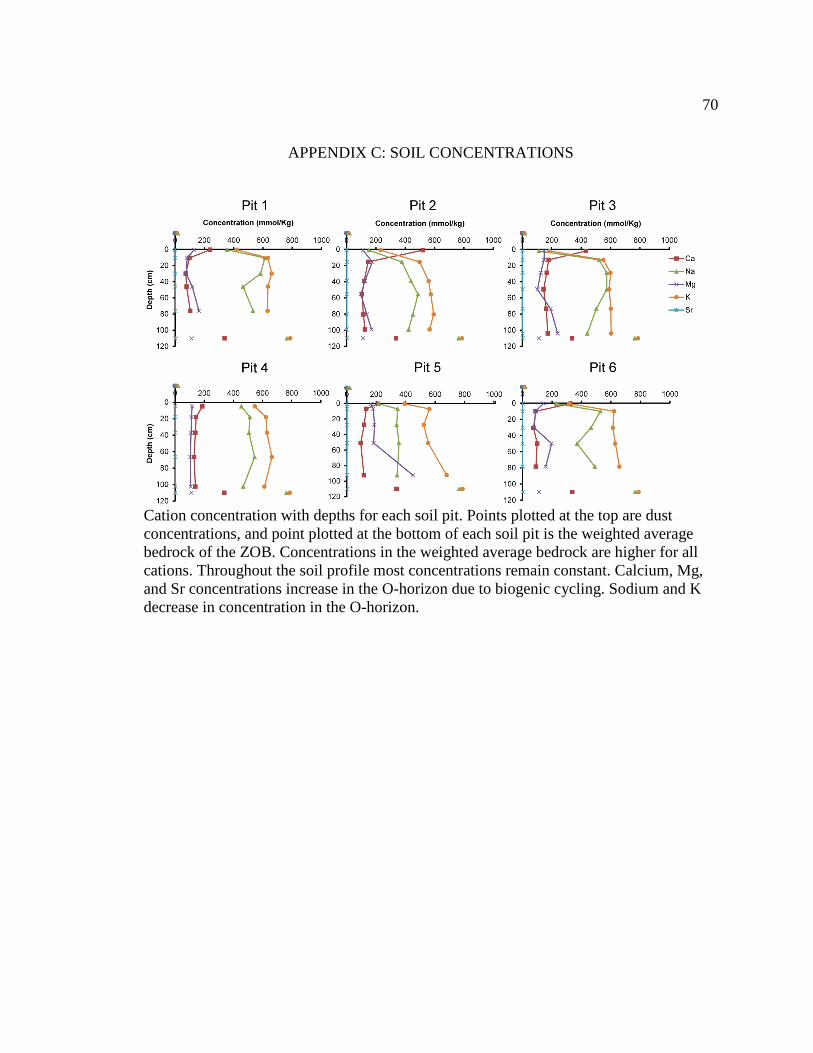
70
APPENDIX C: SOIL CONCENTRATIONS
Cation concentration with depths for each soil pit. Points plotted at the top are dust
concentrations, and point plotted at the bottom of each soil pit is the weighted average
bedrock of the ZOB. Concentrations in the weighted average bedrock are higher for all
cations. Throughout the soil profile most concentrations remain constant. Calcium, Mg,
and Sr concentrations increase in the O-horizon due to biogenic cycling. Sodium and K
decrease in concentration in the O-horizon.

71
Concentration of Al, Fe, and Mn with depths for each soil pit. Points plotted at the top are
dust concentrations, and point plotted at the bottom of each soil pit is the weighted
average bedrock of the ZOB. Higher concentrations of Al in the soils than Fe or Mn. For
most pits Al concentrations in the weighted average bedrock is higher due to
aluminosilicate weathering.

72
Silica and Ge concentrations with depths for each soil pit. Points plotted at the top are
dust concentrations, and point plotted at the bottom of each soil pit is the weighted
average bedrock of the ZOB. Higher Ge concentrations in the soils compare to the
bedrock is observed until the very top of the profile. Silica concentrations remain stable
and similar to the weighted average of the bedrock until the O-horizon in the soils.

73
APPENDIX D: DATA USED
Chemistry of bedrock, soils, and dust.

74
Chemistry of snow from snowmelt lysimeters.

75
Chemistry of snow from grab samples that were melted in the lab.
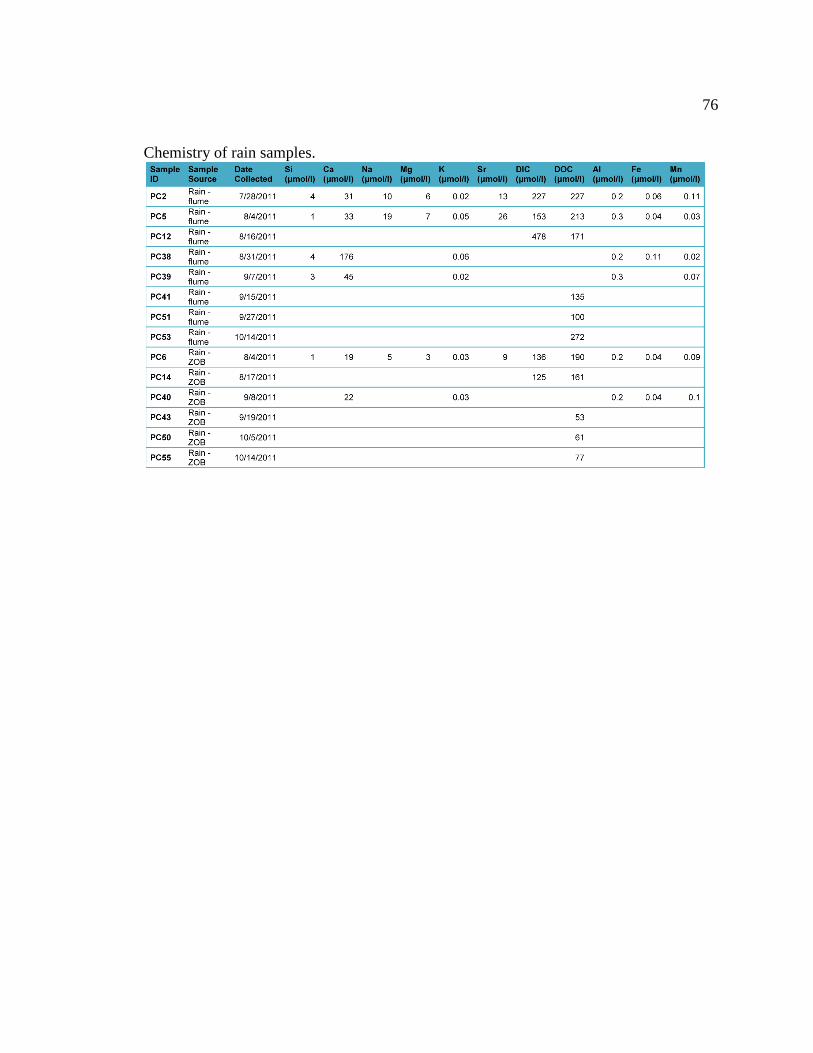
76
Chemistry of rain samples.
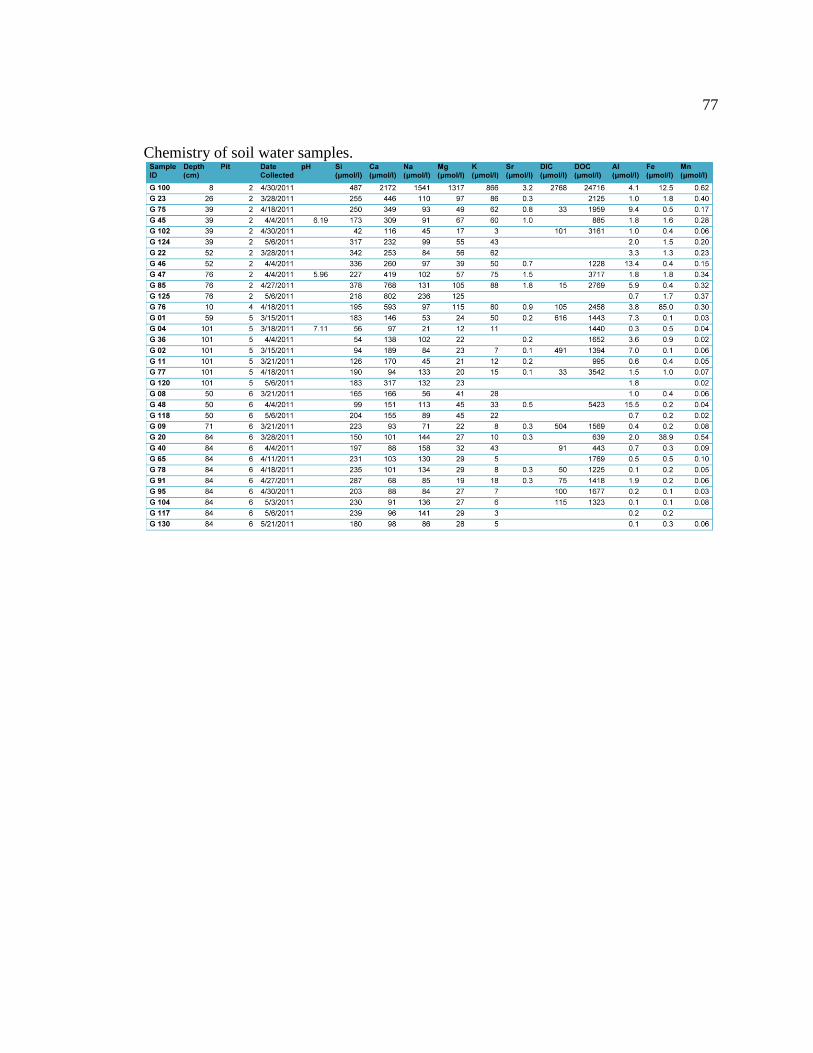
77
Chemistry of soil water samples.

78
Chemistry of springs and deeper soil water (Redondo Meadow Spring).

79
Chemistry of grab sample from La Jara Creek.

80
REFERENCES
Aberg, G., Jacks, G., and Hamilton, P. J., 1989. Weathering rates and 87
Sr/86
Sr ratios: an
isotopic approach. Journal of Hydrology 109, 65-78.
Anderson, S.P., Dietrich, W.E., and Torres, R., 1997. Concentration-discharge
relationships in runoff from a steep, unchanneled catchment. Water Resources
Research 33, 211-225.
Appelo, C.A.J., and Postma, D., 2005. Geochemistry, groundwater and pollution 2nd
edition, CRC Press Taylor & Francis Group, Boca Raton, Fl. p 315.
April, R.H., Lemon, S., and Keller, D., 2001. Shale to Soil. Geochemistry and clay
mineral transformation (abstract), Goldschimdt Conference Abstract Poster (14a)
3001.
Bain, D. C., and Bacon, J. R., 1994. Strontium isotopes as indicators of mineral
weathering in catchments. Catena 22, 201-214.
Bain, D. C., Midwood, A. J., and Miller, J. D., 1998. Strontium Isotope ratios in streams
and the effect of flow rate in relation to weathering catchments. Catena 32, 143-
151.
Balogh-Brunstad, A, Keller, C.K., Borman, B.T., O’Brien, R., Wang, D., and Hawley,
G., 2008. Chemical weathering and chemical denudation dynamics through
ecosystem development and disturbance. Global Biogeochemical Cycles 22,
doi:10.1029/2007GB002957.
Basu, N.B., Thompson, S.E., and Rao, P.S.C., 2011. Hydrologic and biogeochemical
functioning of intensivel managed catchments. A synthesis of top-down analyses.
Water Resources Research 47, doi:10.1029/2011WR010800, 2.
Benedetti, M.F., Milne, C.J., Kinniburgh, D.G., van Riemsdijk, W.H., and Koopal, L.K.,
1995. Metal Ion Binding to Humic Substances: Application of the Non-Ideal
Competitive Adsorption Model. Envrionmental Science and Technology 29, 446-
467.
Berggren, D., and Mulder, J., 1995. The role of organic matter in controlling aluminum
solubility in acidic mineral soil horizons. Geochimica et Cosmochimica Acta 59,
4167-4180.
Bickle, M.J., Chapman, H.J., Bunbury, J., Harris, N.B.W., Fairchild, I.J., Ahmad, R., and

81
Pomiès, C., 2005. Relative contributions of silicate and carbonate rocks to riverine
Sr fluxes in the headwaters of the Ganges. Geochimica et Cosmochimica Acta 69,
2221-2240.
Blum, J.D., Erel, Y., and Brown, K., 1994. 87
Sr/86
Sr ratios of Sierra Nevada stream
waters: Implications for relative mineral weathering rates. Geochimica and
Cosmochimica 58, 5019-5025.
Brantley, S.L., Goldhaber, M.B., Vala Ragnarsdottir, 2007. Crossing Disciplines and
scales to Understand the Critical Zone. Elements 3, 307-314.
Bricker, O. P., Paces, T., Johnson, C. E., and Sverdrup, H., 1994. Weathering and
erosion Aspects of Small Catchment Research. In: Biogeochemistry of Small
catchments: A Tool for Environmental Research, John Wiley and Sons,
Chichester, UK, p. 85-105.
Brooks, P. D., and Vivoni, E. R., 2008. Mountain ecohdrology: quantifying the role of
vegetation in the water balance of montane catchments. Ecohydrology 1, 187-192.
Brown, G. H., and Fuge, R., 1998. Trace element chemistry of glacial meltwaters in an
Alpine Headwater catchment. In: Hydrology, Water Resources and Ecology in
Headwaters, International Association of Hydrological Sciences, Wallingford,
UK, p. 435-442.
Broxton, P.D., Troch, P.A., and Lyon, S.W., 2009. On the role of aspect to quantify water
transit times in small mountainous catchments. Water Resources Research 45,
doi:10.1029/2008WR007438.
Bullen, T. D., Krabbenhoft, D. P., and Kendall, C., 1996. Kinetic and mineralogic
controls on the evolution of groundwater chemistry and 87
Sr/86
Sr in a sandy
silicate aquifer, northern Wisconsin, USA. Geochimica et Cosmochimica Acta 60,
1807-1821.
Burgess, J.,1978. Metal Ions in Solution. Chichester: Elles Horwood. ISBN 0-85312-
0277.
Chadwick, O.A., Derry, L.A., Vitousek, P.M., Huebert, B.J., and Hedin, L.O., 1999.
Changing sources of nutrients during four million years of ecosystem
development. Nature 397, 491-497.
Chadwick, O.A., Derry, L.A., Bern, C.R., and Vitousek, P.M., 2009. Changing sources of
strontium to soils and ecosystems across the Hawaiian Islands. Chemical Geology
267, 64-76.
82
Church, M. R., 1997. Hydrochemistry of forested catchments. Annu. Rev. Earther Sci.
25, 23-59.
Clow, D. W., and Drever, J. I., 1996. Weathering rates as a function of flow through
alpine soil. Chemical Geology 132, 131-141.
Clow, D.W., Mast, M.A., Bullen, T.D., and Turk, J.T., 1997. Strontium 87/strontium 86
as a Tracer of mineral weathering reactions and calcium sources in an
alpine/subalpine watershed, Loch Vale, Colorado. Water Resources Research 33,
1335-1351.
Clow, D.W., and Mast, M.A., 2010. Mechanisms for chemostatic behavior in catchments:
Implications for CO2 consumption by mineral weathering. Chemical Geology
269, 40-51.
Derry, L.A., Pett-Ridge, J.C., Kurtz, A.C., and Troester, J.W., 2006. Ge/Si and 87
Sr/86
Sr
tracers Of weathering reactions and hydrologic pathways in a tropical granitoid
system. Journal of Geochemical Exploration. 88, 271-274.
Drever, J. I., 1988, The Geochemistry of Natural Waters: Second Edition. Prentice Hall,
Englewood Cliffs, NJ.
Fridricksson, T., Arnorsson, S., and Bird, D.K., 2009. Processes controlling Sr in surface
and ground waters of Tertiary tholeiitic flood basalts in Northern Iceland.
Geochimica et Cosmochimica Acta 73, 6727-6746.
Frisbee, M.D., Phillips, F.M., White, A.F., Campbell, A.R., Liu, F., 2012. Effect of
Source Integration on the Geochemical Fluxes from Springs. Applied
Geochemistry, doi: http://dx.doi.org/10.1016/ j.apgeochem.2012.08.028.
Garrels, R.M., and Mackenzie, F. T., 1967. Origin of the chemical compositions of some
springs and lakes. In: Advances in Chemistry Series, No. 67, Gould, R.F., ed.,
American Chemical Society, Washington, D.C., p. 222-242.
Goff, F., Reneau, S.L., Lynch, S., Goff, C.J., Gardner, J.N., Drakos, P., and Katzman, D.,
2005. Preliminary Geologic Map of the Bland Quadrangle, Los Alamos and
Sandoval Counties New Mexico. New Mexico Bureau of Geology and Mineral
Resources, Open-file Digital Geologic Map OF-GM 112.
Godsey, S.E., Kirchner, J.W., and Clow, D.W., 2009. Concentration-discharge
relationships reflect chemostatic characteristics of US catchments. Hydrological
Processes 23, 1844-1864.
Gooseff, M.N., McKnight, D.M., Runel, R.L., and Vaughn, B.H., 2002. Determining

83
long time scale hyporheic zone flow paths in Antarctic streams. Hydrological
Processes17, 1691-1710.
Gu, C., Anderson, W., and Maggi, F., 2011. Riparian biogeochemical hot moments
induced by stream fluctuations; Water Resources Research 48,
doi:10.1029/2011WR011720.
Gustafson, J.R., 2008. Quantifying spatial variability of snow water equivalent, snow
chemistry, and snow water isotopes-Applications to Snowpack water balance.
Master’s Thesis, University of Arizona.
Hornung, M., Adamson, J.K., Reynolds, B, and Stevens, P.A., 1986. Influence of mineral
weathering and catchment hydrology on drainage water chemistry in three upland
sites in England and Wales. Journal of Geological Society, London 143, 627-634.
Horwitz, E.P., Chiarizia, R., and Dietz, M.L., 1992. A novel strontium-selective
extraction chromatographic resin. Solvent Extraction Ion Exchange 10, 313-336.
Jacks, G., Aberg, G, and Hamilton, P.J., 1989. Calcium Budgets for Catchment as
Interpreted by Strontium Isotopes: Nordic Hydrology 20, 85-96.
Jacobson, A.D., ad Blum, J.D., 2000. Ca/Sr and 87
Sr/86
Sr geochemistry of disseminated
calcite in Himalayan silicate rocks from Nanga Parbat: Influence on river-water
chemistry. Geology 28, 463-466.
Jacobson, A.D., Blum, J.D., Chamberlain, C.P., Poage, M.A., and Sloan, V.F., 2002a.
Ca/Sr and Sr isotope systematics of a Himalayan glacial chronosequence:
carbonate versus silicate weathering rates as a function of landscape surface age.
Geochimica and Cosmochimica Acta 66, 13-27.
Jacobson, A.D., Bum, J.D., and Walter, L.M., 2002b. Reconciling the elemental and Sr
isotope composition of Himalayan weathering fluxes: insight from the carbonate
geochemistry of stream waters. Geochimica and Cosmochimica Acta 66, 3417-
3429.
Janda, R.J., 1971. An Evaluation of Procedures Used in Computing Chemical Denudation
Rates. Geological Society of America Bulletin 82, 67-80.
Jansen, B., Nierop, K.G., and Verstraten, J.M., 2003. Mobility of Fe(II), Fe (III), and Al
in acidic forest soils mediated by dissolved organic matter: influence of solution
pH and metal/organic carbon ratios. Ecological aspects of dissolved organic
matter in soils 113, 323-340.
Janzen, H.H., 2004. Carbon cycling in earth systems-a soil science perspective.

84
Agricuture Ecosystems and Environment 104, 399-417.
Johnson, N.M., Likens, G.E., Borman, F.H., Fisher, D.W., and Pierce, R.S., 1969. A
Working Model for the Variation in Stream Water Chemistry at the Hubbard
Brook Experimental Forest, New Hampshire. Water Resources Research 5, 1353-
1363.
Judson, S., and Ritter ,D.F., 1964. Rates of Regional Denudation in the United States.
Journal of Geophysical Research 69, 3395-3401.
Kennedy, M.J., Chadwick, O.A., Vitousek, P.M., Derry, L.A., and Hendricks, D.M.,
1998. Changing sources of base cations during ecosystem development, Hawaiian
Islands. Geology 26, 1015-1018.
Kinniburgh, D.G., van Riemsdijk, W.H., Koopal, L.K., Borkovek, M., Benedetti, M.F.,
and Avena, M.J., 1999. Ion binding to natural organic matter: competition,
heterogeneity, stoichiometry and thermodynamic consistency; Colloids and
Surfaces A. Physiochemical and Engineering Aspects 151, 147-166.
Kurtz, A. C., Derry, L. A., and Chadwick, O. A., 2002. Germanium-silicon fractionation
in the weathering environment. Geochimica et Cosmochimica Acta 66, 1525-
1537.
Kurtz, A.C., Lugolobi, F., and Salvucci, G., 2011. Germanium-silicon path tracer:
Application to the Rio Icacos watershed. Water Resources Research 47, doi:
10.1029/2010WR009853.
Lambert, S.J., and Epstein, S., 1979. Stable isotope investigation of an active geothermal
system in Valles Caldera, Jemez Mountains, New Mexico. Journal of
Volcanology and Geothermal Research 8, 111-129.
Lugolobi, F., Kurtz, A. C., and Derry, L. A., 2010. Germanium-silicon fractionation in a
tropical, granitic weathering environment. Geochimica et Cosmochimica Acta 74,
1294-1308.
Liu. F., Parmenter, R., Brooks, P.D., Conkin, M.H., and Bales, R.C., 2008a. Seasonal and
Interannual variation of streamflow pathways and biogeochemical implications in
semi-arid, forested catchments in Valles Caldera, New Mexico. Ecohydrology 1,
239-252.
Liu, F., Bales, R. C., Conklin, M.H., and Conrad, M.E., 2008b. Streamflow generation
from snowmelt in semi-arid, seasonally snow-covered, forested catchments,
Valles Caldera, New Mexico. Water Resources Research 44,
doi:10.1029/2007WR006728.
85
Maher, K., 2010. The dependence of chemical weathering rates on fluid residence times.
Earth and Planetary Science Letters 294, 101-110.
Maher, K., 2011. The role of fluid residence time and topographic scales in determining
chemical fluxes from landscapes. Earth and Planetary Science Letters 312, 48-58.
McClain, M.E., Boyer, E.W., Dent, C.L., Gergel, S.E., Grimm, N.B., Groffman, P.M.,
Hart, S.C., Harvey, J.W., Johnston, C.A., Mayorga, E., McDowell, W.H., and
Pinay, G., 2003. Biogeochemical Hot Spots ad Hot Moments at the Interface of
Terrestrial and Aquatic Ecosystems. Ecosystems 6, 301-312.
McNutt, R.H., Strontium Isotopes, in Environmental Tracers in Subsurface
Hydrology, ed. by P. Cook and A.L. Herczeg, Kluwer Academic Publishers,
Norwell, MA, 2000.
Miller, W. L., and Zepp, R.G., 1995. Photochemical production of dissolved inorganic
carbon from terrestrial organic matter: Significance to the oceanic organic carbon
cycle. Geophysical Research Letters 22, 417-420.
Molotch, N.P., Brooks, P.D., Burns, S.P., Litvak, M., Monson, R.K., McConnell, J.R.,
and Musselman, K., 2009. Ecohydrological controls on snowmelt partitioning in
mixed-conifer sub-alpine forests. Ecohydrology 2, 129-142.
Mortloch, R.A., and Froelich, P.N., 1987. Continental weathering of germanium: Ge/Si in
the global river discharge. Geochimica et Cosmochimica Acta 51, 2075-2082.
Mortloch, R. A., and Froelich, P. N., 1996. Determination of germanium by isotope
dilution Hydride generation inductively coupled plasma mass spectrometry.
Analytica Chimica Acta 332, 277-284.
Pécsi, M., 1990. Loess is not just the accumulation of dust. Quaternary International
7/8, 1-21.
Perdrial, J N, Perdrial, N, Harpold, A, Gao, X, LaSharr, K M and Chorover, J., 2012.
Impacts of sampling dissolved organic matter with passive capillary wicks versus
aqueous soil extraction. Soil Science Society of America Journal, accepted.
Perdrial, J., McIntosh, J., Harpold, A., Brooks, P., Zapata-Rios, X, Porter, C., Ray, J.,
Troch, P., Chorover, J., in review. Impact of winter climate change and catchment
aspect on carbon dynamics in snow-dominated headwater streams. Submitted.
Pett-Ridge, J. C., Derry, L.A., and Kurtz, A. C., 2009. Sr isotopes as a tracer of

86
weathering processes and dust inputs in a tropical granitoid watershed, Luquillo
Mountains, Puerto Rico. Geochimica et Cosmochimica Acta 73, 25-43.
Pokrovski, G.S., and Schott, J., 1998a. Thermodynamic properties of aqueous Ge(IV)
hydroxide complexes from 25 to 350°C: Implications for the behavior of
germanium and the Ge/Si ratio in hydrothermal fluids. Geochimica et
Cosmochimica Acta 62, 1631-1642.
Pokrovski, G. S., and Schoff, J., 1998b. Experimental study of the complexation of
silicon and germanium with aqueous organic species: Implications for germanium
and silicon transport and Ge/ Si ratio in natural waters. Geochimica et
Cosmochimica Acta 62, 3413-3428.
Pokrovski, G. S., Martin, F., Hazeman, J., and Schott, J., 2000. An X-ray absorption fine
structure spectroscopy study of germanium-organic ligand complexes in aqueous
solution. Chemical Geology 163, 151-165.
Purdue, E.M., Beck, K.C., and Reuter, J.H., 1976. Organic complexes of iron and
aluminum in natural waters. Nature 260, 418-420.
Oades, J.M., 1988. The retention of organic matter in soils. Biogeochemistry 5,
35-70.
Qualls, R.G., and Haines, B.L., 1991. Geochemistry of Dissolved Organic Nutrients in
Water Percolating through a Forest Ecosystem. Soil Science of America Journal
55, 1112-1123.
Rademacher L. K., Clark, J. F., Clow, D. W., and Hudson, G. B., 2005. Old groundwater
influence on stream hydrochemistry and catchment response times in a small
Sierra Nevada catchment: Sagehen Creek, California. Water Resources Research
41, doi:10.1029/2003WR002805.
Rasmussen, C., Troch, P.A., Chorover, J., Brooks, P., Pelletier, J., and Huxman, T.F.,
2010. An open system framework for integrating critical zone structure and
function. Biogeochemistry, doi:10.1007/s10533-010-9476-8.
Rasmussen, C., Meding, S. M., Vasquez, A., Chorover, J., 2011. Domes, Ash and Dust –
Controls on soil genesis in a montane catchment of the Valles Caldera, New
Mexico. American Geophysical Union Fall Meeting 2011, abstract #EP51B-0845.
Reheis MC, Budahn JR, Lamothe PJ. 1999. Elemental analysis of modern dust in
Southern Nevada and California. USGS OFR 99-53.
Ren, M., 1997. Composition variation within and eruption dynamics of the El Cajete

87
Series, Valles Caldera, New Mexico. MS Thesis Baylor University, Waco, Texas.
Scribner, A. M., Kurtz, A. C., and Chadwick, O. A., 2006. Germanium sequestration by
soil: Targeting the roles of secondary clays and Fe-oxyhydroxides. Earth and
Planetary Science Letters 243, 760-770.
Singh, S.K., Trivedi, J.R., Pande, K., Ramesh, R., and Krishnaswami, S., 1997. Chemical
and strontium, oxygen, and carbon isotopic compositions of carbonates from the
Lesser Himalaya: Implications to the strontium isotope composition of the source
waters of the Ganga, Ghaghara, and Indus rivers. Geochimica and Cosmochimica
Acta 2, 743-755.
Soil Survey Staff, 2011. Keys to Soil Taxonomy. N. R. C. S. United States Department
of Agriculture, 339.
Spell, T. L., and Harrison, T. M., 1993. 40
Ar/39
Ar Geochronology of Post-Valles Caldera
Rhyolites, Jemez Volcanic Field, New Mexico. Journal of Geophysical Research
Solid Earth 98, 8031-8051.
Steefel, C.I., and Maher, K., 2009. Fluid-Rock Interaction: A Reactive Transport
Approach. Reviews in Mineralogy and Geochemistry 70, 485-532.
Stevens, P.R., and Walker, T.W., 1970. The chronosequence concept and soil formation.
The Quarterly Review of Biology 45, 333-350.
Tipping, E., Rey-Castro, C., Bryan, S.E., and Hamilton-Taylor, J., 2002. Al(III) and
Fe(III) binding by humic substances in freshwaters, and implications for trace
metal speciation. Geochimica et Cosmochimica Acta 66, 3211-3224.
Uchida, T., Asano, Y., Ohte, N., and Mizuyama, T., 2003. Seepage area and rate of
bedrock groundwater discharge at a granitic unchanneled hillslope. Water
Resources Research 39, doi:10.1029/2002WR001298.
Vázquez-Ortega, A., Perdrial, J., Harpold, A., Zapata-Rios, X., Rasmussen, C., McIntosh,
J., Schaap, M., Pelletier, J., Brooks, P., Amistadi, M.K., and Chorover, J., Rare
earth elements as reactive tracers of biogeochemical weathering in the Jemez
River Basin Critical Zone Observatory, in preparation.
Vuataz, F. D., and Goff, F., 1986. Isotope geochemistry of thermal and nonthermal
waters in the Valles Caldera, Jemez Mountains, northern New Mexico. Journal of
Geophysical Research 91, 1835-1853.
Watmough, S.A., and Dillon, P.J., 2003. Calcium Losses in from a Forested Catchment in

88
South Central Ontario, Canada. Environmental Science and Technology 14, 3085-
3089.
White, A.F., and Blum, A.E., 1995. Effects of climate on chemical weathering in
Watersheds. Geochimica et Cosmochimica Acta 59, 1729-1747.
White, A.F., Bullen, T.D., Vivit, D. V., Schulz, M. S., and Clow, D.W., 1999. The role of
disseminated calcite in the chemical weathering of granitoid rocks. Geochimica et
Cosmochimica Acta 63, 1939-1953.
White, A.F., Schulz, M.S., Lowenstern, J.B., Vivit, D.V., and Bullen, T.D., 2005. The
ubiquitous nature of accessory calcite in granitoid rocks: Implications for
weathering, solute evolution, and petrogenesis. Geochimica et Cosmochimica
Acta 69, 1455-1471.
Wolff, J A, Brunstad, K A and Gardner, J N, 2011. Reconstruction of the most recent
volcanic eruptions from the Valles caldera, New Mexico. Journal of Volcanology
and Geothermal Research 199, 53-68.
Zapata-Rios, X., Troch, P.A., McIntosh, J.C., Broxton, P.D., Brooks, P.D., 2012. The
effect of terrain aspect on interannual variability of hydrologic response in
mountainous catchments in New Mexico (abstract) AGU conference San
Francisco, USA.