solubility screening by uplc/ms/ms - waters corporation
TRANSCRIPT
SO LU BI L I T Y S C R E ENING BY U P L C / M S / MS
Darcy Shave and Pete Alden Waters Corporation, Milford, MA, U.S.A.
INT RODUCT ION
Determining solubility has become an essential step in the early
stages of the drug discovery process. Solubility is important
because the ratio of the anticipated dose of a given drug to its
solubility, together with the dissolution rate, determine the fraction
of the dose available for absorption. Because gastric and intestinal
fluids are a complex mixture of natural surfactants, salts, and
buffers, it is also important to determine the effect of pH, salts, and
surfactants on a drug’s solubility.
Potentiometric titration and nephelometry are two popular methods for
the fast determination of drug solubility. While these methods may be
high throughput, the solubility range is limited by the sensitivity of the
detection methods and the concentration of the stock DMSO solutions.
Results obtained via these methods are also less reliable for
designing in vivo animal toxicity and drug metabolism and
pharmacokinetics (DMPK) studies, in which solubilization of the
drug substance in proper media is often required to prepare liquid
formulations at various concentrations.
UltraPerformance LC® (UPLC®) technology can be used to measure
compound solubility in either an aqueous buffer solution or mixtures
of co-solvents with relatively high-throughput capability, while
maintaining adequate accuracy of results.
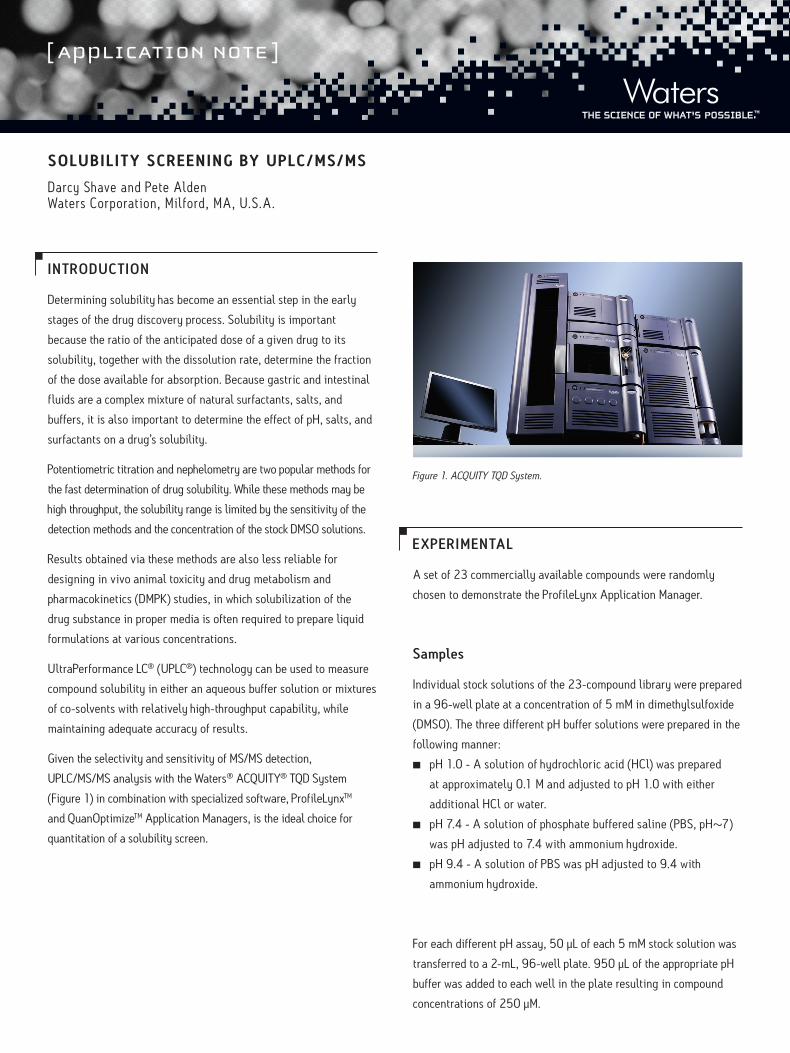
Given the selectivity and sensitivity of MS/MS detection,
UPLC/MS/MS analysis with the Waters® ACQUITY® TQD System
(Figure 1) in combination with specialized software, ProfileLynxTM
and QuanOptimizeTM Application Managers, is the ideal choice for
quantitation of a solubility screen.
Figure 1. ACQUITY TQD System.
EX PERIMENTAL
A set of 23 commercially available compounds were randomly
chosen to demonstrate the ProfileLynx Application Manager.
Samples
Individual stock solutions of the 23-compound library were prepared
in a 96-well plate at a concentration of 5 mM in dimethylsulfoxide
(DMSO). The three different pH buffer solutions were prepared in the
following manner:
n pH 1.0 - A solution of hydrochloric acid (HCl) was prepared
at approximately 0.1 M and adjusted to pH 1.0 with either
additional HCl or water.
n pH 7.4 - A solution of phosphate buffered saline (PBS, pH~7)
was pH adjusted to 7.4 with ammonium hydroxide.
n pH 9.4 - A solution of PBS was pH adjusted to 9.4 with
ammonium hydroxide.
For each different pH assay, 50 µL of each 5 mM stock solution was
transferred to a 2-mL, 96-well plate. 950 µL of the appropriate pH
buffer was added to each well in the plate resulting in compound
concentrations of 250 µM.

The plate was shaken gently on a shaker for 1.5 hours at room
temperature. The well contents were transferred to a SiroccoTM
plate and were vacuum-filtered for ~30 to 60 seconds into a
collection plate.
The sample/pH buffer solutions were diluted 1:100 in 50:50
acetonitrile/water, resulting in sample concentrations of a maximum
of 2.5 µM (assuming that the compound was completely soluble at
250 µM in pH buffer). Samples were injected (5 µL injections) at
this concentration.
Standards
A three-point calibration of standards was used for quantitation
of the sample solutions. Standards were prepared at concentrations
of 0.25 µM, 1.25 µM, and 2.5 µM. 5 mM stock solutions of the
compounds in DMSO were diluted 1:100 in 50:50 acetonitrile/
water to a concentration of 50 µM.
The 50 µM stock solutions were diluted 1:20 in 50:50 acetonitrile/
water resulting in the 2.5 µM standard solutions. The 2.5 µM standard
solutions were diluted 1:10 to give 0.25 µM standard solutions, which
were then diluted 1:2 to give 1.25 µM standard solutions.
These samples and standards were analyzed by UPLC/MS/MS.
The QuanOptimize Application Manager was used for the automated
optimization of the MS multiple reaction monitoring (MRM)
conditions for each compound.
LC conditions
LC system: Waters ACQUITY TQD System
Column: ACQUITY UPLC® BEH C18 Column
2.1 x 50 mm, 1.7 µm
Column temp: 40 °C
Flow rate: 600 µL/min
Mobile phase A: 0.1% Formic acid in water
Mobile phase B: 0.1% Formic acid in acetonitrile
Gradient: 5 to 95% B/1.3 min
MS conditions
MS system: Waters TQ Detector
Ionization mode: ESI Positive
Capillary voltage: 3200 V
Source temp: 150 °C
Desolvation temp: 450 °C
Desolvation gas: 900 L/hr
Cone gas flow: 50 L/hr
Inter-scan delay: 20 ms
Inter-channel delay: 5 ms
Dwell: 200 ms
Acquisition range: 100 to 1000 m/z
Calculations
Because the solubility assay of the compounds is carried out at
250 µM and the samples are diluted 1:100 before UPLC analysis,
the concentrations determined by UPLC/MS/MS must be multiplied
by a factor of 100 to get the final solubility. If this final measured
concentration is 250 µM, then the compound has a solubility
greater than or equal to 250 µM at the pH of the buffer.
Figure 2. Flowchart of solubility assay procedure.
5 mM Samples in DMSO
Shake for 1.5 hours at room temperature.
Filter through Sirocco™ plate.
Dilute filtrate 1 to 100 in 50/50 can/H2O.
Analyze and quantitate against standards.
5 mM Samples in DMSO
Shake for 1.5 hours at room temperature.
Filter through Sirocco™ plate.
Dilute filtrate 1 to 100 in 50/50 can/H2O.
Analyze and quantitate against standards.
Shake for 1.5 hours at room temperature.
Filter through Sirocco™ plate.
Dilute filtrate 1 to 100 in 50:50 can/H2O.
Analyze and quantitate against standards.
50 µL
950 µL 0.1 mM HCl
950 µL pH 7.4Buffer
950 µL pH 9.0Buffer
50 µL50 µL

DISCUSSION
Solubility was determined using MassLynxTM Software’s ProfileLynx
Application Manager. Each compound was identified within the sample
list and the sample type (standard or analyte) was specified. The
solubility concentration of the analytes was determined using a cali-
bration curve generated by a concentration series of each standard.
Any solubility values outside of a specified minimum and maximum
range were automatically flagged within the ProfileLynx Results
Browser (Figure 3). For this experiment, the minimum was set at
0.0 mg/mL and the maximum at 2.5 mg/mL.
The interactive browser allowed for the editing of peak integration.
Peak assignments were easily changed and peak integrations were
quickly optimized. Results were then exported in a format amenable
to the corporate database.
The data in Figure 3 show a typical solubility result. The solubility
of Oxybutynin is nearly 10-fold lower at high pH than at low pH.
Table 1 summarizes the solubility results for all 23 compounds
tested.
In addition to determining any pH effects on the solubility of the
various compounds, this assay will ensure that all samples have
sufficient solubility to remain in solution under the conditions used
for subsequent ADME assays.
All of the compounds exhibited high solubility such that the mea-
sured apparent solubility was greater than 250 µM for all samples.
If the actual intrinsic solubility for these compounds is required,
an equilibrium solubility assay using saturated solutions at an
appropriate pH should be employed to ensure the compounds
are not ionized.
Figure 3. Results for Oxybutynin displayed in the ProfileLynx browser.

Waters Corporation 34 Maple Street Milford, MA 01757 U.S.A. T: 1 508 478 2000 F: 1 508 872 1990 www.waters.com
Table 1: Summary of Solubility Data
CONCLUSION
The 23 compounds were analyzed with a UPLC/MS/MS protocol
including MS multiple reaction monitoring (MRM) parameter
optimization, MS acquisition method creation, data acquisition, data
processing, and report generation.
Data generated from the variety of assays were all automatically
processed with the same software. A single report was created for
the 23 compounds containing the solubility results, enabling the
researcher to analyze results quickly, thus increasing laboratory
throughput. Results are displayed in an interactive, graphical
summary format based on sample or experiment.
Using the method outlined here, compounds can be quickly and
easily screened for solubility. MS detection ensures that the correct
compound is being analyzed, while UPLC separation allows for the
analysis of impure samples.
The results from this screening can then be used to determine those
candidates with solubility levels consistent with the bioavailability
levels needed to proceed down the development pipeline.
Using ProfileLynx and QuanOptimize Application Managers
allowed for:
n Automated MS method development and data acquisition
n Single approach for data processing and report generation
from multiple assays
n Complete automated analysis, processing, and reporting
n Increased laboratory throughput
Waters, ACQUITY, ACQUITY UPLC, UltraPerformance LC, and UPLC are registered trademarks of Waters Corporation. ProfileLynx, QuanOptimize, and The Science of What’s Possible are trademarks of Waters Corporation. All other trademarks are the property of their respective owners.
©2008 Waters Corporation. Poduced in the U.S.A.May 2008. 720002612en AG-PDF
Injection µM Final µM Injection µM Final µMSOLUBILITY SOLUBILITY SOLUBILITY SOLUBILITY
Alprenolol pH 1.5 17.436 >250 µM Nortriptyline pH 1.5 15.576 >250 µM
Alprenolol pH 7.4 16.776 >250 µM Nortriptyline pH 7.4 13.873 >250 µM
Alprenolol pH 9.4 14.826 >250 µM Nortriptyline pH 9.4 11.548 >250 µM
Amitriptyline pH 1.5 15.581 >250 µM Oxprenolol pH 1.5 14.377 >250 µM
Amitriptyline pH 7.4 13.282 >250 µM Oxprenolol pH 7.4 13.618 >250 µM
Amitriptyline pH 9.4 6.923 >250 µM Oxprenolol pH 9.4 13.151 >250 µM
Betaxolol pH 1.5 16.771 >250 µM Oxybutynin pH 1.5 13.889 >250 µM
Betaxolol pH 7.4 16.611 >250 µM Oxybutynin pH 7.4 10.329 >250 µM
Betaxolol pH 9.4 14.406 >250 µM Oxybutynin pH 9.4 2.891 >250 µM
Caffeine pH 1.5 12.989 >250 µM Pindolol pH 1.5 11.423 >250 µM
Caffeine pH 7.4 14.25 >250 µM Pindolol pH 7.4 11.093 >250 µM
Caffeine pH 9.4 12.955 >250 µM Pindolol pH 9.4 10.726 >250 µM
Colchicine pH 1.5 16.051 >250 µM Propranolol pH 1.5 13.158 >250 µM
Colchicine pH 7.4 16.838 >250 µM Propranolol pH 7.4 12.264 >250 µM
Colchicine pH 9.4 15.842 >250 µM Propranolol pH 9.4 11.249 >250 µM
Diltiazem pH 1.5 15.738 >250 µM Sulfadimethoxine pH 1.5 14.94 >250 µM
Diltiazem pH 7.4 14.309 >250 µM Sulfadimethoxine pH 7.4 15.426 >250 µM
Diltiazem pH 9.4 12.692 >250 µM Sulfadimethoxine pH 9.4 15.272 >250 µM
Diphenylamine pH 1.5 22.981 >250 µM Timolol pH 1.5 15.618 >250 µM
Diphenylamine pH 7.4 16.101 >250 µM Timolol pH 7.4 14.44 >250 µM
Diphenylamine pH 9.4 17.7 >250 µM Timolol pH 9.4 13.529 >250 µM
Doxepin pH 1.5 15.492 >250 µM Tolazamide pH 1.5 8.985 >250 µM
Doxepin pH 7.4 13.986 >250 µM Tolazamide pH 7.4 18.217 >250 µM
Doxepin pH 9.4 10.82 >250 µM Tolazamide pH 9.4 13.894 >250 µM
Lidocaine pH 1.5 14.352 >250 µM Tolbutamide pH 1.5 24.375 >250 µM
Lidocaine pH 7.4 13.519 >250 µM Tolbutamide pH 7.4 28.877 >250 µM
Lidocaine pH 9.4 13.078 >250 µM Tolbutamide pH 9.4 27.486 >250 µM
Loperamide pH 1.5 13.344 >250 µM Verapamil pH 1.5 13.956 >250 µM
Loperamide pH 7.4 10.836 >250 µM Verapamil pH 7.4 13.072 >250 µM
Loperamide pH 9.4 --- --- Verapamil pH 9.4 9.151 >250 µM
Metoprolol pH 1.5 14.818 >250 µM Zolpidem pH 1.5 14.657 >250 µM
Metoprolol pH 7.4 13.77 >250 µM Zolpidem pH 7.4 13.656 >250 µM
Metoprolol pH 9.4 13.183 >250 µM Zolpidem pH 9.4 13.113 >250 µM
Nephazoline pH 1.5 14.035 >250 µM
Nephazoline pH 7.4 12.724 >250 µM
Nephazoline pH 9.4 12.903 >250 µM
COMPOUND BUFFER COMPOUND BUFFER