solubility measurements of multicomponent solids … report on isopiestic... · technical progress...
TRANSCRIPT

TECHNICAL PROGRESS REPORT
Solubility Measurements of Multicomponent Solids via Isopiestic
Method
Date submitted:
February 16, 2015
Principal Investigator:
Leonel E. Lagos, Ph.D., PMP®
Florida International University Collaborators:
Yelena Katsenovich, Ph.D. Claudia Cardona, PhD candidate, DOE Fellow
Submitted to:
U.S. Department of Energy Office of Environmental Management
Under Cooperative Agreement # DE-EM0000598

DISCLAIMER
This report was prepared as an account of work sponsored by an agency of the United States
government. Neither the United States government nor any agency thereof, nor any of their
employees, nor any of its contractors, subcontractors, nor their employees makes any warranty,
express or implied, or assumes any legal liability or responsibility for the accuracy,
completeness, or usefulness of any information, apparatus, product, or process disclosed, or
represents that its use would not infringe upon privately owned rights. Reference herein to any
specific commercial product, process, or service by trade name, trademark, manufacturer, or
otherwise does not necessarily constitute or imply its endorsement, recommendation, or favoring
by the United States government or any other agency thereof. The views and opinions of authors
expressed herein do not necessarily state or reflect those of the United States government or any
agency thereof.

FIU-ARC-2015-800000438-04c-225 Solubility Measurements via Isopiestic Method
iii
TABLE OF CONTENTS
List of Figures .............................................................................................................................................. iv
List of Tables ............................................................................................................................................... iv
Introduction ................................................................................................................................................... 1
Materials and Methods .................................................................................................................................. 3
Results and Discussions ................................................................................................................................ 7
Fabrication of a new isopiestic chamber ................................................................................................. 12
Future Work ................................................................................................................................................ 15
Acknowledgments ....................................................................................................................................... 15
References ................................................................................................................................................... 16

FIU-ARC-2015-800000438-04c-225 Solubility Measurements via Isopiestic Method
iv
LIST OF FIGURES
Figure 1. Isopiestic chamber to conduct solubility experiments; aluminum block with holes to hold nickel
crucibles. ....................................................................................................................................................... 3
Figure 2. Analytical balance weighing covered crucible. ............................................................................. 4
Figure 3. Isopiestic chamber to conduct solubility experiments connected to the acquisition system. ........ 5
Figure 4. Changes of water activities vs. molality for LiCl and CaCL2 standards. ...................................... 8
Figure 5. Osmotic coefficient for multicomponent samples as a function of water activities, aw, using
LiCl as a standard. ....................................................................................................................................... 10
Figure 6. Osmotic coefficient for multicomponent samples as a function of water activities, aw, using
CaCl2 as a standard. .................................................................................................................................... 10
Figure 7. Water activities against molalities for the multicomponent samples using CaCl2 standard. ....... 11
Figure 8. Osmotic coefficient vs. molalities for the multicomponent samples using CaCl2 standard ........ 12
Figure 9. Aluminum block to fit crucible cups. .......................................................................................... 13
Figure 10. The underside of the chamber plate. .......................................................................................... 13
Figure 11. The full assesmbly of the isopiestic chamber with crucibles inside. ......................................... 14
Figure 12. Drawing of the isopiestic chamber final assembly. ................................................................... 14
Figure 13. Fabricated new isopiestic chambers to continue the solubility experiments. ............................ 15
LIST OF TABLES
Table 1. Sample Composition ....................................................................................................................... 6
Table 2. Reference and Multicomponent Samples - Weights, Solute Content, and Molalities at the
Beginning of Experiment .............................................................................................................................. 7
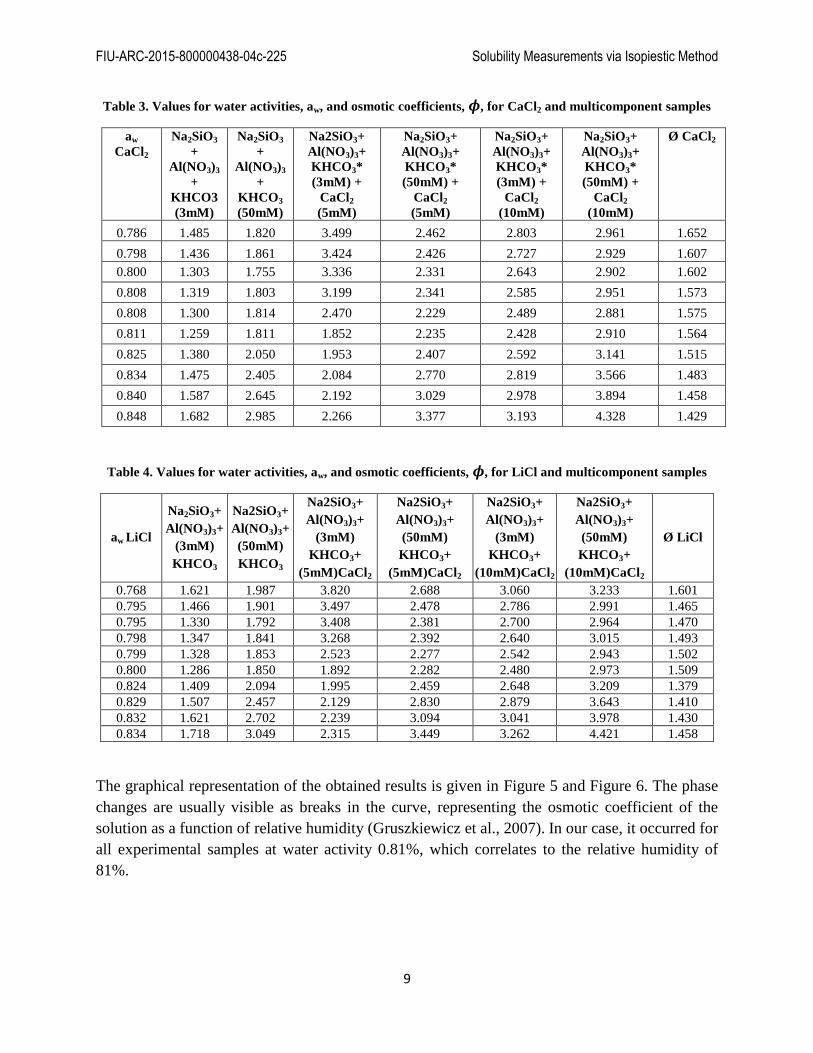
Table 3. Values for water activities, aw, and osmotic coefficients, 𝝓, for CaCl2 and multicomponent
samples .......................................................................................................................................................... 9
Table 4. Values for water activities, aw, and osmotic coefficients, 𝝓, for LiCl and multicomponent
samples .......................................................................................................................................................... 9

FIU-ARC-2015-800000438-04c-225 Solubility Measurements via Isopiestic Method
1
Introduction
Remediation of radionuclides residing in the Hanford Site vadose zone (VZ) is a challenging task
due to the depth of the contaminants, which makes it difficult to reach with near-surface
remediation techniques. Uranium is one of the key contaminants of the Hanford Site VZ. Uranyl
carbonates are the predominant uranium (VI) aqueous species in Hanford’s pore water and due to
their high mobility are considered as a potential source of contamination for the underlying
aquifer. So, in-situ remediation methods require sequestration of uranium in the subsurface to
prevent further spreading of mobile uranium species. The technology under consideration to
sequester U(VI) is a manipulation of soil pH via ammonia gas injection by creation of alkaline
conditions in the uranium-contaminated soil. The soil pH manipulation causes uranium co-
precipitation during mineralogical changes and the formation of uranium-bearing precipitates in
the treated vadose zone soil. The injection of reactive gases such as NH3 can reduce the potential
for radionuclide mobility in the subsurface without water addition causing undesired downward
migration of contaminants. This technology allows the transformation of mobile uranium species
to lower solubility precipitates that are stable in the natural environment (Szecsody et al., 2012).
The formation of a relatively insoluble mineral complex that integrates uranium is a desired
outcome of the VZ remediation efforts at Hanford because the more immobile the contamination
is, the less it will spread in the subsurface. However, there is a need for a better understanding of
the stability of the U-bearing precipitates created in the soil as a result of ammonia gas remedial
actions. This information would help to accurately predict the mobility of U(VI) in the post-
treated vadose zone soil.
Traditionally, solubility measurements are conducted in batch experiments to measure the
amount of solute that can be dissolved in a solvent until the system reaches equilibrium
(Giammar et al., 2002; Rai et al., 2005; Gorman-Lewis et al., 2008). This method is better suited
to measure solubility of minerals with respect to the groundwater saturated conditions; however,
it doesn’t allow accurately quantifying the solubility of minerals for the unsaturated vadose zone
conditions. Evaluation of literature suggests that the isopiestic method can closely mimic the
mineral deliquescence process, which refers to the formation of an aqueous solution by the
absorption of water by hygroscopic salt minerals (Carroll et al., 2005). Thus, isopiestic
measurements may be the most appropriate way to quantify mineral solubility for the unsaturated
vadose zone conditions. This method is considered very accurate, helping to make more realistic
predictions of contaminant fate and transport in vadose zone environments. Experimental
deliquescence data are limited for mixed salts (Gruszkiewicz et al., 2007) and especially scarce
for uranium-bearing multicomponent mixtures.
The tendency for solutes to deliquesce depends on their solubility and is influenced by the
particular character of solute-solvent interactions described according to Raoult's law in vapor-
pressure lowering ability. The basic features of the method include isothermal equilibration of
samples of known masses and known initial concentrations through a common vapor phase. In

FIU-ARC-2015-800000438-04c-225 Solubility Measurements via Isopiestic Method
2
the closed system, the solvent is distilled isothermally from one crucible to another until each
solution reaches the same chemical potential. All of the solutions at equal vapor pressure or
isopiestic equilibrium have the same solvent activities. These conditions can be rewritten as
lnas=lnaref. By equilibration, the samples with a standard of known solvent activities under the
conditions of the experiment as a function of molality can be used to determine the solvent
activity of another solution (Rard, 1985). If two or more solutions of different salts are in
isopiestic equilibrium, the osmotic coefficient of a test solution, фx, is calculated from the
reference solution, фref, from the fundamental equation for isopiestic equilibrium:
𝜙𝑠 = 𝑣𝑟𝑒𝑓𝑚𝑟𝑒𝑓𝜙𝑅𝑟𝑒𝑓
𝑣𝑠𝑚𝑠 Eq 1
The water activities 𝑎𝑤 of the reference solution can be calculated using the following equation:
ln 𝑎𝑤 = −0.001 𝑣𝑠𝑚𝑠𝑀𝑤𝜙𝑟𝑒𝑓 Eq 2
Where vs is the number of ions formed by the complete dissociation of one molecule of the
reference standard, and for NaCl and KCl, v=2, Mw is molar mass of H2O, and φ is the practical
osmotic coefficient of the reference standard. Eq. 2 is defined for mixtures, as well as for single-
salt solutions (Rard and Platford, 1991). The ratio (𝑚𝑟𝑒𝑓
𝑚𝑠) is called the isopiestic ratio. The
osmotic coefficient can be measured with 0.1%-0.3% accuracy at molalities down to 0.1 mol/kg.
So, all solutions in the isopiestic chamber that are allowed to exchange solvent until isopiestic
equilibrium is reached will have the same solvent activity with a value of (∑ 𝑣𝑖𝑚𝑖)𝜙𝑖 .
Relative humidity, RH, is related to the activity of water through the partial pressure of water
vapor as follows:
RH = pw/pwo
Eq 3
Where pw is the partial pressure of water vapor over an aqueous solution and pw0 is the partial
pressure of water vapor over pure water. The activity of water in aqueous solutions relates to its
fugacity by equation (Rard and Clegg, 1997):
aw=f w / fwo Eq 4
Where fw is the fugacity of water vapor over an aqueous solution and fw0 is the fugacity of water
vapor over pure water. It is usually assumed that, in ambient temperature and moderate pressure,
water vapor behaves ideally and the fugacities can be replaced by partial pressure (Reid et al.,
1987):
fw/fwo= pw/pw
o Eq 5
yielding:
RH=aw Eq 6

FIU-ARC-2015-800000438-04c-225 Solubility Measurements via Isopiestic Method
3
The RH is commonly expressed as a percentage; thus RH%=100*aw .
This report summarizes preliminary results from isopiestic measurements of the deliquescence
behavior of no- uranium multicomponent precipitates combined from major pore water
constituents such as Na+, SiO3
-, Al
+, NO3
-, K
+, HCO3
-, Ca
2+, and Cl
- .
Materials and Methods
Rard and Platford (2000) presented detailed general descriptions of the isopiestic method with an
emphasis on experimental aspects. In brief, the isopiestic apparatus used for the experiments was
fabricated from a pressure pot and contained an aluminum heat-transfer block that has a good
thermal conductivity, able to maintain a uniform temperature distribution inside the chamber
(Figure 1).
Figure 1. Isopiestic chamber to conduct solubility experiments; aluminum block with holes to hold nickel
crucibles.
The aluminum block contained fourteen holes drilled part way through to tightly hold the
crucible cups containing standards and multicomponent precipitate samples. Isopiestic method
procedures require for the isopiestic cups to be made of material that is chemically inert to the
experimental solutions and have excellent thermal conductivity. In the experiments, 15-mL
nickel cups were used; to avoid evaporation losses, tightly fitted light nickel lids were
immediately added when the chamber was open. Then, the crucibles with lids were placed on
balances for weighing. Metler Toledo analytical balances XS205DU with a precision of no less
than 1×10⁻⁵
g were used for weighing the crucibles cups covered with lids (Figure 2).

FIU-ARC-2015-800000438-04c-225 Solubility Measurements via Isopiestic Method
4
Figure 2. Analytical balance weighing covered crucible.
The isopiestic method is a mostly gravimetric method that relies on the assumption that only one
volatile component is present. The mass of the empty crucible along with the number of moles of
electrolyte in each sample was accurately calculated. Therefore, any gains or losses in mass
during isopiestic equilibration are only possible due to gains or losses of solvent. The observed
changes in mass were used in the calculation of the solution molalities at isopiestic equilibrium
(Rard and Platford, 2000).
Every time the system reached equilibrium, the isopiestic chamber was opened to weigh the
samples. Then, when the chamber was re-closed, the air was evacuated until the pressure reached
around 4.5 kPa (Blanco et al., 2006). After the gas is evacuated in a closed vessel, the volatile
component is transported through the vapor phase until the solutions reach equilibrium. The
apparatus was equipped with a high accuracy pressure transducer with a range of 0-30 psia
(Omega Engineering, Inc.) to provide a measurement of water vapor pressure, allowing for
monitoring as the system approached equilibrium. The transducer was connected to the
acquisition system to collect vapor pressure data. Labview code, used to record the direct vapor
pressure measurements, was updated to show pressure in inches of mercury (in of Hg) and in
Torr. The code was also modified to indicate when the system was under vacuum.
The vessel was constantly kept in the environmental chamber to control a stable temperature of
25oC (Figure 3).

FIU-ARC-2015-800000438-04c-225 Solubility Measurements via Isopiestic Method
5
Figure 3. Isopiestic chamber to conduct solubility experiments connected to the acquisition system.
The reference standards were used to obtain osmotic coefficients for the low water activity
values in the multicomponent salt systems. Stock solutions for standards were prepared by
weight using deionized water from a Barnstead NANOpure water purification system or plasma
grade water. Initially, the experiments were started with NaCl as a reference. Due to an inability
to calculate water activities for the high molality values of NaCl, the experiment was extended to
include two new reference standard solutions, calcium chlorine (CaCl2) and lithium chlorine
(LiCl), known for their high solubility. The most soluble is LiCl; its maximum molality to obtain
an osmotic coefficient value for the water activity calculations is 19.219 mol/kg. The CaCl2 and
LiCl salts were “ultra dry” grade chemicals with metal-basis purities specified by Alfa Aesar as
0.99 and 0.995, respectively. Powdered salts were received sealed in argon-filled glass ampoules.
Preparation of the reference solutions included breaking the glass ampoules and transferring their
contents rapidly to polyethylene bottles containing weighed amounts of water. To avoid
moisture, two samples of each reference standard solution were prepared in an anaerobic glove
box. The masses of the reference standards were measured carefully to limit variations between
two identical standard samples: 0.04685g and 0.03465 g for CaCl2 and 0.02548g and 0.02541g
for LiCl.
The multicomponent precipitate samples prepared to measure a moisture-induced phase
transformation from solid phase to solution and determine water activity and osmotic coefficient
at the deliquescence point were combined from Na+, SiO3
-, Al
+, NO3
-, K
+, HCO3
-, Ca
2+, and Cl
-
ions. All of these elements are found in the pore water of the Hanford Site 200 Area and their

FIU-ARC-2015-800000438-04c-225 Solubility Measurements via Isopiestic Method
6
concentrations used for the preparation of experimental mixtures were based on the
characterization studies performed by Serne et al. (2008) on vadose zone sediments from
borehole 299-E33-45 at the Hanford 200 Area. Uranium (VI) was not included in these
experiments. Preparation of the samples started from the stock solutions made in deionized water
(DIW) by dissolving preliminary dried in the oven Na2SiO3.9H2O, Al(NO3)3
.9H2O, KHCO3, and
CaCl2.2H2O salts into 50 mL vials. All multicomponent precipitate samples kept a constant ratio
of Si/Al=20 by means of Si and Al concentrations of 100 mM and 5 mM, respectively.
Bicarbonate concentrations used for the preparation of the solution mixture were 3 mM and 50
mM. Each bicarbonate concentration was combined with 0, 5, and 10 mM of calcium
concentrations. The multicomponent solutions in the amount of 10 mL were prepared directly
into the nickel crucibles by mixing the required stock solutions and DIW. The weights of the
solutions were recorded using balances with an accuracy of 1x10⁻⁵
g. After mixing, all crucibles
containing the multicomponent solutions were placed in an oven and dried at 40oC for at least
48h until a stable weight of dried precipitates was obtained. The concentrations of the stock
solutions were maintained the same as in the previously conducted studies to investigate the
effect of Si and Al concentration ratios on the removal of U(VI) in alkaline conditions. The
amounts of each stock solution used in the preparation of six samples are presented in Table 1.
Table 1. Sample Composition
Amount of Stock Solution and DIW (uL)
Na2SiO3·9H2O = 2368 and Al(NO3)3·9H2O = 1000
Crucible Sample KHCO3 CaCl2·2H2O DIW
7 3 mM KHCO3,
no Calcium 75 0 6657
8 50 mM KHCO3,
no Calcium 1250 0 5382
9 3 mM KHCO3,
5 mM Calcium 75 20 6537
10 50 mM KHCO3,
5 mM Calcium 1250 20 5362
11 3 mM KHCO3,
10 mM Calcium 75 20 6537
12 50 mM KHCO3,
10 mM Calcium 1250 20 5362
The solute contents in each crucible were calculated as a summation of the total number of moles
corresponding to the salt formula. In the experiments, ten nickel crucibles were used; two
contained duplicate reference solutions of CaCl2, another two contained reference solutions of
LiCl and six contained the multicomponent solids samples. Table 2 summarizes the
compositions of the CaCl2 and LiCl reference standards, solute contents, and initial molalities of
the reference and experimental samples.

FIU-ARC-2015-800000438-04c-225 Solubility Measurements via Isopiestic Method
7
Table 2. Reference and Multicomponent Samples - Weights, Solute Content, and Molalities at the Beginning
of Experiment
Cup
#
Standard/Solute
Multicomponent
Standard and
Sample Weight (g)
Solute Content
(Mm)
Pure Water in
Sample (µl)
Initial Sample
Molality mol/Kg
1 CaCl2 0.04685 0.42215 100 4.22
2 CaCl2 0.03465 0.31222 100 3.12
3 LiCl2 0.02548 0.60103 100 6.01
4 LiCl2 0.02541 0.59938 100 5.99
5 Na2SiO3+ Al(NO3)3+
*KHCO3 0.19860 0.24206 0.13099 1.85
6 Na2SiO3+ Al(NO3)3+
**KHCO3 0.23900 0.30433 1.15473 0.26
7 Na2SiO3+ Al(NO3)3+
*KHCO3 + †CaCl2
0.20150 0.24216 0.17987 1.35
8 Na2SiO3+ Al(NO3)3+
**KHCO3 + †CaCl2
0.24340 0.30443 0.16542 1.84
9 Na2SiO3+ Al(NO3)3+
*KHCO3+ ††
CaCl2 0.21020 0.24226 0.15091 1.61
10 Na2SiO3+Al(NO3)3+
**KHCO3+ ††
CaCl2 0.25610 0.30453 0.18382 1.67
* 3 mM and ** 50 mM of KHCO3 † 5 mM and
††10 mM of CaCl2
Deliquescence behavior of multicomponent solids was studied by starting from uranium-free
solid salt mixtures via a progressive increase in the relative humidity. It was achieved by
incremental addition of 20-50 µL of DIW water to the standards, helping to increase the
humidity of the system and find water activity values closer to the eutonic point, where the
lowest relative humidity coexists with a liquid solution.
Results and Discussions
This progress report presents the experimental results on solid-liquid transitions of the synthetic
multicomponent precipitate samples prepared from synthetic porewater solutions mimicking
conditions at the Hanford Site. Several parameters were taken into consideration for studying
deliquescence behavior of dry solids with the most important being water activity and osmotic
coefficients. Two samples were prepared for each standard, CaCl2 and LiCl, and the osmotic
coefficients (𝜙𝑠𝑡𝑎𝑛𝑑) were estimated for each standard using an average value between the two
samples. At each isopiestic measurement recorded, molalities of standards were interpolated
from the literature data (Bert and Nuttall, 1977; and Hamer and Wu, 1972) to obtain their
corresponding osmotic coefficients. The water activity (aw) values for each standard were
calculated as follows:
𝑙𝑛𝑎𝑤 = (∑ 𝑣𝑖𝑚𝑖)𝜙𝑖 Eq 7.
The measured water activities of the LiCl-H2O and CaCl2 – H2O against the standards molality
values obtained throughout the isopiestic experiments are shown in Figure 4.

FIU-ARC-2015-800000438-04c-225 Solubility Measurements via Isopiestic Method
8
Figure 4. Changes of water activities vs. molality for LiCl and CaCL2 standards.
The standards values for molality, osmotic coefficient, and water activity calculated according to
the Eq. 2 for each isopiestic measurement are presented in Table 3 and Table 4. The variation
between water activity values obtained for the two standards, CaCl2 and LiCl, was calculated as
1.4% (0.848 for CaCl2 and 0.834 for LiCl). By the end of the experiments, crucibles with LiCl
standards showed little corrosion spots inside the cups, which might have contributed to the
difference in the osmotic coefficient values between the two standards. While the results for the
water activities for both standards are in reasonable agreement, we consider that more accurate
data were obtained with CaCl2.
The molality of each multicomponent sample was calculated based on the solute content and
water weight measurements. Then, the osmotic coefficients for multicomponent samples (𝜙)
were calculated according to Eq.1. The water activities at equilibrium for all multicomponent
samples were equal to the water activity of the standard at each isopiestic measurement recorded
(Table 3 and Table 4).
FIU-ARC-2015-800000438-04c-225 Solubility Measurements via Isopiestic Method
9
Table 3. Values for water activities, aw, and osmotic coefficients, 𝝓, for CaCl2 and multicomponent samples
aw
CaCl2
Na2SiO3
+
Al(NO3)3
+
KHCO3
(3mM)
Na2SiO3
+
Al(NO3)3
+
KHCO3
(50mM)
Na2SiO3+
Al(NO3)3+
KHCO3*
(3mM) +
CaCl2
(5mM)
Na2SiO3+
Al(NO3)3+
KHCO3*
(50mM) +
CaCl2
(5mM)
Na2SiO3+
Al(NO3)3+
KHCO3*
(3mM) +
CaCl2
(10mM)
Na2SiO3+
Al(NO3)3+
KHCO3*
(50mM) +
CaCl2
(10mM)
Ø CaCl2
0.786 1.485 1.820 3.499 2.462 2.803 2.961 1.652
0.798 1.436 1.861 3.424 2.426 2.727 2.929 1.607
0.800 1.303 1.755 3.336 2.331 2.643 2.902 1.602
0.808 1.319 1.803 3.199 2.341 2.585 2.951 1.573
0.808 1.300 1.814 2.470 2.229 2.489 2.881 1.575
0.811 1.259 1.811 1.852 2.235 2.428 2.910 1.564
0.825 1.380 2.050 1.953 2.407 2.592 3.141 1.515
0.834 1.475 2.405 2.084 2.770 2.819 3.566 1.483
0.840 1.587 2.645 2.192 3.029 2.978 3.894 1.458
0.848 1.682 2.985 2.266 3.377 3.193 4.328 1.429
Table 4. Values for water activities, aw, and osmotic coefficients, 𝝓, for LiCl and multicomponent samples
aw LiCl
Na2SiO3+
Al(NO3)3+
(3mM)
KHCO3
Na2SiO3+
Al(NO3)3+
(50mM)
KHCO3
Na2SiO3+
Al(NO3)3+
(3mM)
KHCO3+
(5mM)CaCl2
Na2SiO3+
Al(NO3)3+
(50mM)
KHCO3+
(5mM)CaCl2
Na2SiO3+
Al(NO3)3+
(3mM)
KHCO3+
(10mM)CaCl2
Na2SiO3+
Al(NO3)3+
(50mM)
KHCO3+
(10mM)CaCl2
Ø LiCl
0.768 1.621 1.987 3.820 2.688 3.060 3.233 1.601
0.795 1.466 1.901 3.497 2.478 2.786 2.991 1.465
0.795 1.330 1.792 3.408 2.381 2.700 2.964 1.470
0.798 1.347 1.841 3.268 2.392 2.640 3.015 1.493
0.799 1.328 1.853 2.523 2.277 2.542 2.943 1.502
0.800 1.286 1.850 1.892 2.282 2.480 2.973 1.509
0.824 1.409 2.094 1.995 2.459 2.648 3.209 1.379
0.829 1.507 2.457 2.129 2.830 2.879 3.643 1.410
0.832 1.621 2.702 2.239 3.094 3.041 3.978 1.430
0.834 1.718 3.049 2.315 3.449 3.262 4.421 1.458
The graphical representation of the obtained results is given in Figure 5 and Figure 6. The phase
changes are usually visible as breaks in the curve, representing the osmotic coefficient of the
solution as a function of relative humidity (Gruszkiewicz et al., 2007). In our case, it occurred for
all experimental samples at water activity 0.81%, which correlates to the relative humidity of
81%.

FIU-ARC-2015-800000438-04c-225 Solubility Measurements via Isopiestic Method
10
Figure 5. Osmotic coefficient for multicomponent samples as a function of water activities, aw, using LiCl as a
standard.
Figure 6. Osmotic coefficient for multicomponent samples as a function of water activities, aw, using CaCl2 as
a standard.
All experimental water activities as a function of total molality for each multicomponent sample
were plotted in Figure 7.
Deliquescence point of
multicomponent samples
Deliquescence point of
multicomponent samples

FIU-ARC-2015-800000438-04c-225 Solubility Measurements via Isopiestic Method
11
Figure 7. Water activities against molalities for the multicomponent samples using CaCl2 standard.
The results show that the water activities for all multicomponent samples are similar and follow
the same trend as the molality of the samples increased. There is some variability in the water
activity data for a non-calcium sample comprised of 3 mM of bicarbonate [Na2SiO3+Al(NO3)3+
3mM KHCO3]. However, starting from water activity value of 0.81, the visible break in the
curve occurs for all samples. These results suggest that as humidity in the system increased, the
deliquescence points for all multicomponent samples were obtained for RH ≥81%.
Figure 8 shows plots of the measured values of the osmotic coefficients against the molality of
multicomponent samples. From Figure 8 it can be seen that as 𝜙 decreased with the increase in
samples molality, a change in the slope indicates a possible solid –liquid transition. As an
example, an arrow on Figure 8 represents the deliquescence point for the sample that contains
Na2SiO3+Al(NO3)+ 50mMHCO3 and 10mMCaCl2. Similar changes in slope are visible for other
sample compositions presented on Figure 8.
Deliquescence
point

FIU-ARC-2015-800000438-04c-225 Solubility Measurements via Isopiestic Method
12
Figure 8. Osmotic coefficient vs. molalities for the multicomponent samples using CaCl2 standard
The evaluation of the multicomponent samples indicated that the amount of sodium silicate
comprises the major molar fraction for about 77-97%, depending on the samples’ composition. It
might be that the deliquescence behavior of the multicomponent precipitates is governed by the
solubility of alkali silicate gel formed by the silicate ion polymerization reaction. The literature
data on the deliquescence of polymerized silica is rather scarce and the isopiestic data can
provide important insights on the solubility behavior of the multicomponent precipitates created
in alkaline conditions as a result of the recrystallization of minerals due to ammonia gas injection
in the subsurface. A sample of sodium silicate will be prepared in the next set to compare the
solubility of dried silicate solids formed by the silicate ion polymerization with other
multicomponent samples.
Fabrication of a new isopiestic chamber
The experiments performed with the isopiestic chamber fabricated from the commercially
available pressure pot showed some limitations in the design. The chamber height was tall
enough to hold an aluminum block with recessed holes to fit 15-mL crucibles. To reduce the
weight of the chamber, the underside of the aluminum block was fabricated with slots, leaving
some void space beneath the block. The block was tightly fit inside the chamber; however, it still
has the possibility of accumulating water vapor in the voids on the underside of the aluminum
block. To avoid this flaw in future experiments and to lower the weight of the chamber, a new
design was initiated. In addition, decreasing the void spaces in the chamber and reducing the
headspace above the crucibles cups would help to reach system equilibrium faster. Two identical
chambers were designed from 6061 T6 aluminum to include 12 recesses for crucible cups in
each vessel. The depth of each recess was designed the same (1.26 in) as in the previous chamber
Deliquescence
point

FIU-ARC-2015-800000438-04c-225 Solubility Measurements via Isopiestic Method
13
fabricated from the pressure pot. The distance between each row was determined by the
dimensions of the nickel crucible lids. The negative rectangular boss was designed to house a
sealing gasket of silicone with a shore durometer of 50A. The top and lateral port is for
degassing. The lateral port is threaded to receive a 1/4” male NPT thread to add a vacuum rated
valve and a hose barb to connect to a vacuum line (Figure 9).
Figure 9. Aluminum block to fit crucible cups.
The underside of this plate consists of slots to reduce the overall weight and 1/4-20 threaded
holes to mount the legs as seen in Figure 10.
Figure 10. The underside of the chamber plate.
The design for the top required there to be a head space of about 2 cm above the lids of the
crucibles. Since there will be a gasket to seal the chamber, the max height was set to 2 cm (0.787
in) and the minimum depth to about 1.86 cm (0.731 in) to prevent over compression of the
gasket.

FIU-ARC-2015-800000438-04c-225 Solubility Measurements via Isopiestic Method
14
Figure 11. The full assesmbly of the isopiestic chamber with crucibles inside.
On the top of the lid, there is a ¼ NPT port for a gauge. On the bottom portion, there is a boss
used to compress the gasket. Finally, for ease of closing the lid, toggle clamps were used and set
on the legs as seen in Figure 11. The final assembly drawing is presented in Figure 12. The
fabrication of the two new isopiestic chambers was completed and they are undergoing testing
(Figure 13).
Figure 12. Drawing of the isopiestic chamber final assembly.

FIU-ARC-2015-800000438-04c-225 Solubility Measurements via Isopiestic Method
15
Figure 13. Fabricated new isopiestic chambers to continue the solubility experiments.
Future Work
Future work will focus on the deliquescence experiments using U-bearing solids. Two reference
solutions, CaCl2 and LiCl, will be used to obtain values of osmotic coefficients and water
activities for the experimental samples. A new set of dry precipitates, composed of Si-Al-Ca-
HCO3 and U(VI), will be prepared to investigate the solid-liquid transitions in the uranium-
bearing multicomponent salt systems. The concentration of uranium will be 2 ppm, similar to
what was used in the study to investigate the effect of Si and Al concentration ratios on the
removal of U(VI) in alkaline conditions by NH3 conducted earlier. Samples will be prepared
with the same concentrations, applying a Si/Al ratio of 20 (100 mM of Si and 5 mM of Al), two
bicarbonate (3 and 50 mM) and three calcium (5 mM, 10 mM and 15mM) concentrations. A
sample will be prepared using 100 mM of sodium silicate to investigate if the solubility for
multicomponent samples is following the same trend as for polymerized Si. Sample preparation
procedures will follow the same method as for the current study. Dried samples together with
calcium chloride and lithium chloride samples will be placed in the isopiestic chamber and kept
at a 25oC constant temperature. The isopiestic chamber will be opened to weigh the samples
when the system reaches equilibrium in order to investigate the deliquescence behavior of
uranium-bearing multicomponent solids. The obtained results will be compared with the
deliquescence data obtained for the current study.
Acknowledgments
Funding for this research was provided by U.S. DOE Cooperative Agreement number DE-
EM0000598. We truly appreciate Dr. Mirosław Gruszkiewicz from ORNL for the valuable
suggestions on these experiments. The isopiestic chamber was designed and fabricated in ARC’s
machine shop with the support of Amer Awwad and Jairo Crespo. We are thankful to Peggy
Shoffner for her valuable comments and suggestions.

FIU-ARC-2015-800000438-04c-225 Solubility Measurements via Isopiestic Method
16
References
Blanko LH, Amadoa E, Avellaneda JA, 2006. Isopiestic determination of the osmotic and
activity coefficients of dilute aqueous solutions of the series MeEt3NI to HepEt3NI at
298.15K. Fluid Phase Equilibria 249, 147–152.
Carroll, Alai M, Craig L, Gdowski G, Hailey P, Nguyen AQ, Rard J, Staggs K, Sutton M,
Wolery T, 2005. Chemical Environment at Waste Package Surfaces in a High-Level
Radioactive Waste Repository. Lawrence Livermore National Laboratory, report UCRL-
TR-212566.
Giammar DE, and JG Hering, 2002. Equilibrium and Kinetic Aspects of Soddyite Dissolution
and Secondary Phase Precipitation in Aqueous Suspension." Geochimica Et
Cosmochimica Acta. 66,18 p.3235-3245.
Gorman-Lewis D, Burns PC, Fein JB, 2008. Review of Uranyl Mineral Solubility
Measurements. J. Chem. Thermodynamics, 40, p.335–352
Gruszkiewicz MS, Palmer DA, Springer RD, Wang P, Anderko A, 2007. Phase Behavior of
Aqueous Na–K–Mg–Ca–Cl–NO3 Mixtures: Isopiestic Measurements and
Thermodynamic Modeling. J Solution Chem, 36, p. 723–765
Hamer, WJ and Yung-Chi Wu, 1972. Osmotic coefficients and mean activity coefficients of uni-
univalent eletrolytes in water at 25o C. J. Phys. Chem Ref Data, vol. 1, 4.
Rai D, Xia Y, Rao L, Hess N J, Felmy A R, Moore DA, and McCready DE, 2005. Solubility of
(UO2)3(PO4)2·4H2O in H+-Na+-OH−-H2PO− 4 -HPO2− 4 -PO3− 4 -H2O and Its
Comparison to the Analogous PuO2+ 2 System. Journal of Solution Chemistry 34, 4.
DOI: 10.1007/s10953-005-5216-4
Rard J, 1985. Solubility determinations by the isopiestic method and application to aqueous
lanthanide nitrate at 25oC. Journal of Solution Chemistry, 14, 7, p.457-471.
Rard J and Platford R, 2000. Experimental method: isopiestic, Chapter 5 in Activity coefficients
in the electrolyte solutions edited by K.Pitzer, CRC press, Boca Raton, Florida
Rard JA and Platford R F, 1991. Experimental Methods: Isopiestic. In Activity Coefficients in
Electrolyte Solutions, 2nd ed.; Pitzer, K. S., Ed.; CRC Press: Boca Raton, FL, Chapter 3.
Rard, J. A., and Clegg, S. L., 1997. Critical Evaluation of the Thermodynamic Properties of
Aqueous Calcium Chloride. J. Chem. Eng. Data, 42, 819–849.
Reid, R.C., Prausnitz, J.M., and Poling, B.E., 1987. The properties of gases and liquids (4 th ed).
New York, McGraw-Hill. Serne RJ, MJ Lindberg, SR Baum, GV Last, RE Clayton, KN
Geiszler, GW Gee, VL LeGore, CF Brown, HT Schaef, RD Orr, MM Valenta, DC
Lanigan, IV Kutnyakov, TS Vickerman, CW Lindenmeie, 2008. Characterization of
Vadose Zone Sediment: Borehole 299-E33-45 Near BX-102 in the B-BX-BY Waste
Management Area. 2002. PNNL-14083. Contract DE-AC06-76RL01830.

FIU-ARC-2015-800000438-04c-225 Solubility Measurements via Isopiestic Method
17
Staples B. and Nuttall R, 1977. The activity and osmotic coefficients of aqueous calcium
chloride at 298.15 K. J. Institute for Materials Research, National Bureau of Standards,
Washington, DC 20234.
Szecsody JE, Truex MJ, Zhong L, Johnson TC, Qafoku NP, Williams MD, Greenwood WJ,
Wallin EL, Bargar, JD, Faurie DK, 2012. Geochemical and Geophysical Changes during
Ammonia Gas Treatment of Vadose Zone Sediments for Uranium Remediation. Vadose
Zone Journal, 11, 4. doi: 10.2136/vzj2011.0158