solid removal schemes and the rotating biological
TRANSCRIPT

Louisiana State UniversityLSU Digital Commons
LSU Historical Dissertations and Theses Graduate School
1995
Solid Removal Schemes and the RotatingBiological Contactor in Recirculating Fish CultureSystems.Aurelio Alfonso Delos reyes JrLouisiana State University and Agricultural & Mechanical College
Follow this and additional works at: https://digitalcommons.lsu.edu/gradschool_disstheses
This Dissertation is brought to you for free and open access by the Graduate School at LSU Digital Commons. It has been accepted for inclusion inLSU Historical Dissertations and Theses by an authorized administrator of LSU Digital Commons. For more information, please [email protected].
Recommended CitationDelos reyes, Aurelio Alfonso Jr, "Solid Removal Schemes and the Rotating Biological Contactor in Recirculating Fish CultureSystems." (1995). LSU Historical Dissertations and Theses. 5948.https://digitalcommons.lsu.edu/gradschool_disstheses/5948

INFORMATION TO USERS
This manuscript has been reproduced from the microfilm master. UMI films the text directly from the original or copy submitted. Thus, some thesis and dissertation copies are in typewriter face, while others may be from any type of computer printer.
The quality of this reproduction is dependent upon the quality of the copy submitted. Broken or indistinct print, colored or poor quality illustrations and photographs, print bleedthrough, substandard margins, and improper alignment can adversely affect reproduction.
In the unlikely event that the author did not send UMI a complete manuscript and there are missing pages, these will be noted. Also, if unauthorized copyright material had to be removed, a note will indicate the deletion.
Oversize materials (e.g., maps, drawings, charts) are reproduced by sectioning the original, beginning at the upper left-hand comer and continuing from left to right in equal sections with small overlaps. Each original is also photographed in one exposure and is included in reduced form at the back of the book.
Photographs included in the original manuscript have been reproduced xerographically in this copy. Higher quality 6" x 9" black and white photographic prints are available for any photographs or illustrations appearing in this copy for an additional charge. Contact UMI directly to order.
A Bell & Howell Information Company 300 North Zeeb Road, Ann Arbor. Ml 48106-1346 USA
313/761-4700 800/521-0600


SOLID REMOVAL SCHEMES AND THE ROTATING BIOLOGICAL CONTACTOR IN RECIRCULATING FISH CULTURE SYSTEMS
A Dissertation
Submitted to the Graduate Faculty of the Louisiana State University and
Agricultural and Mechanical College in partial fulfillment of the
requirements for the degree of Doctor of Philosophy
in
The Interdepartmental Programs in Engineering
byAurelio A. delos Reyes, Jr.
B.S.A.E., University of the Philippines Los Banos, 1979 M. Eng., Asian Institute of Technology, 1982
May 1995

UHI Number: 9538728
UMI Microform 9538728 Copyright 1995? by UMI Company. All rights reserved.
This microform edition is protected against unauthorized copying under Title 17? United States Code.
UMI300 North Zeeb Road Ann Arbor? MI 48103

ACKNOWLEDGEMENTS
I would like to express my sincere thanks and appreciation to all
persons and institutions who in one way or another, directly or indirectly,
contributed to the successful completion of my study a t LSU.
My heartfelt gratitude and appreciation to my adviser, Dr. Thomas B.
Lawson, for his trust, patience, understanding, guidance, and support during
my entire graduate program at LSU.
Special thanks and recognition to Dr. Fereydoun Aghazadeh and Dr.
Robert P. Romaire, my minor professors, Dr. Charles W. Lindau, Dr. Ronald
F. Malone, Dr. Lalit R. Verma, and Dr. Malcolm E. Wright, for serving as
members of my academic advisory committee.
More thanks to Dr. Lalit R. Verma, Chairman, and special thanks to
the faculty, staff, and fellow students at the Department of Biological and
Agricultural Engineering, and also at the Ben Hur Aquacultural Research
Facility, for their friendly and supportive accommodation. Special mention
to Wendi, Tom, Don, Jonathan, Jay, Cathy, and Carmen, whose assistance I
so often required.
My gratitude to the Department of Biological and Agricultural
Engineering, Louisiana Agricultural Experiment Station, and the LSU
Agricultural Center for providing facilities and funding for my research and
graduate assistantship, and also to the University of the Philippines Los
Banos for granting my study leave.

My many thanks and warm appreciation to all our friends - to our
hosts Jack and Dotty Stubbs, to John Junius, to fellow students from the
Philippines, and to the members of the Filipino-American community of
Baton Rouge, whose support, encouragement, friendship, and hospitable
accommodation has made my and my family’s stay an easier and wonderful
experience. Special mention to Lilia who also helped me prepare slides for
my presentation.
My very sincere thanks to all my relatives, especially my parents,
brother, sisters, in-laws, and lola for their morale support and
encouragement. Special mention to Yet and Leah, my attomey-in-facts, for
taking great care of all my concerns and interests in the Philippines.
My love and deepest appreciation to the best thing tha t ever happened
to me, my wife Raquel, and also to our children Raquelyn, Rayland, and
Raynard - you have all been with me every step of the way.
Finally, praises to GOD almighty who transcend all boundaries, and
whose graces are great and abundant to everybody!

TABLE OF CONTENTS
ACKNOWLEDGEMENTS............................................................................. ii
LIST OF TABLES......................................................................................... vii
LIST OF FIG U RES...................................................................................... ix
ABSTRACT.................................................................................................... xi
INTRODUCTION ......................................................................................... 1BACKGROUND.................................................................................. 1OBJECTIVES .................................................................................... 2
REVIEW OF LITERATURE ; . . . 4WATER QUALITY REQUIREMENTS IN RECIRCULATING
SYSTEM S................................................................................ 4Requirements of T ilap ia ......................................................... 5Requirements for Nitrification ........................................... 9Impact of Fish on Water Q u a li ty ......................................... 13
SETTLERS . . . i ............................................................................. 16EXPANDABLE GRANULAR MEDIA FILTERS........................... 20
Pressurized Downflow Sand Filters .................................... 21Floating Bead Filters ........................................................... 22
ROTATING BIOLOGICAL CONTACTORS .................................. 26NITRIFICATION KINETICS AND M ODELLING....................... 31
MATERIALS AND METHODS .................................................................. 35RECIRCULATING SYSTEM S......................................................... 35
Rearing T a n k ........................................................................... 35Bead Filter ............................................................................. 40Tube S e ttle r ............................................................................. 41Sand Filter ............................................................................. 41Rotating Biological Contactor................................................ 42Aeration and Disinfection....................................................... 43Pumps and Water Recirculation........................................... 43Temperature, pH and Alkalinity C o n tro l........................... 44
SYSTEM STARTUP........................................................................... 44STOCKING AND F E E D IN G ........................................................... 44WATER QUALITY MEASUREMENTS ......................................... 47SYSTEM EXPERIMENTS AND ANALYSIS ................................ 49
System I .................................................................................. 49System I I .................................................................................. 50System I I I ................................................................................ 53
iv

RESULTS AND DISCUSSION .................................................................. 54FILTER ACCLIMATION.................................................................. 54STOCK PERFORMANCE ................................................................ 56SYSTEM I: BEAD FILTER-RBC COMBINATION ..................... 58
General System Conditions .................................................. 58Diel Variations in Water Quality and TAN Excretion . . . . 62Effects of Feeding Rate ......................................................... 67
Effects on TAN, N 02-N, and DO .............................. 67Effects on FBF Pressure and F lo w ............................ 69
Effects of FBF Backwashing on System I ............................ 70Effects on DO, TAN, N 02-N, and Turbidity ............ 70Effects on TSS and TSS Capture, Sludge Removal,
FBF Pressure and F lo w .................................. 74Effects on System Performance ................................ 79Effects on Bead Filter and RBC Perform ance 81
Implications on System Design and O peration .................. 90SYSTEM II: TUBE SETTLER-RBC COMBINATION................ 93
General System Conditions .................................................. 93Effects of Feeding Rate on TAN, N 02-N and DO .............. 97System Performance and Comparisons with System I . . . 97
Rearing Tank and Operational C onditions.............. 97System TAN and N 02-N Removal................................101Tube Settler and RBC Perform ance........................... 101
Implications on System Design and O peration .................... 109SYSTEM III: SAND FILTER-RBC COMBINATION.................... I l l
General System Conditions ....................................................I l lEffects of Feeding Rate ...........................................................114
Effects on TAN, N 02-N and D O ..................................114Comparison With Systems I and I I ............................. 116Effects on Sand Filter Pressure and F low ..................122
System Performance ............................................................... 125Sand Filter and RBC Perform ance.........................................125
TAN, N 02-N, and DO Removal.................................... 125Solids Removal............................................................... 129
Implications on Design and O peration ..................................131TUBE RBC PERFORMANCE AND MODELLING.........................132
Effect of Tube Size on RBC Perform ance............................. 132Modelling of RBC Performance............................................... 136
SUMMARY AND CONCLUSIONS .............................................................146
RECOMMENDATIONS................................................................................. 150
BIBLIOGRAPHY.............................................................................................152
v
APPENDIX A: Tabulations of Raw Data for System I ..................... 159
APPENDIX B: Tabulations of Raw Data for System I I ................... 174
APPENDIX C: Tabulations of Raw Data for System III .................186
V IT A .................................................................................................................193

LIST OF TABLES
1. Components of the pilot scale recirculating systems.............................. 39
2. Schedule of stocking, number and size of fish in each system............... 46
3. Stock performance and mortalities in each system................................. 57
4. Water quality and operational conditions in System I duringthe entire study.......................................................................................61
5. Diel variations in water quality in System 1.......................................... 64
6. Rearing tank water quality in System I as affected bybackwashing.......................................................................................... 73
7. Effects of backwashing treatment on TSS and TSS capture, sludgeTSS removal, and FBF pressure and flow in System 1...................... 75
8. Effects of backwashing treatment on TAN and N 02-N removalin System 1...............................................................................................80
9. Bead filter and RBC removal efficiency, and DO removala t different backwashing treatment................................................... 82
10. Water quality and operational conditions in System II........................ 95
11. Rearing tank water quality in System II compared withSystem I at a feeding rate of 3.0 kg/day. ........................................ 100
12. TAN and NOa-N removal in System II compared withSystem I a t a feeding rate of 3.0 kg/day........................................... 102
13. Filter TAN and NOz-N removal efficiency, DO removal, andTSS removal in System II compared with System I at afeeding rate of 3.0 kg/day................................................................... 103
14. Water quality and operational conditions in System III........................ 113
15. Comparison of the coefficients in the equations of feed effectson TAN, N 02-N, and DO among Systems I, II, and III................. 117
16. Sand filter, RBC and overall TAN and N 02-N removal inSystem III a t feeding rates of 0.5 and 1.0 kg/day............................ 126
vii

17. Parameter changes and TSS removal by the sand filter a tfeeding levels of 0.5 and 1.0 kg/day. ...................................
18. Sand filter and RBC performance in System III a t feedinglevels of 0.5 and 1.0 kg/day.................................................... .
19. Rearing tank water quality and operational conditions inSystem II during the RBC comparison study......................
20. Mean RBC flow, TAN and N 02-N loading, and performancecomparison of the two RBC sizes (n=38)...............................

LIST OF FIGURES
1. Schematic diagram of System 1................................................................. 36
2. Schematic diagram of System II................................................................ 37
3. Schematic diagram of System III.............................................................. 38
4. Schematic diagram of System II during the RBC size comparisonstudy......................................................................................................... 52
5. System acclimation curves...........................................................................55
6. Daily variations in water quality in System 1......................................... 59
7. Diel variations in water quality in System 1......................................... 63
8. Diel variation in TAN excretion in System 1......................................... 66
9. Effects of feeding on TAN, N 02-N, and DO in System 1......................... 68
10. Relationship between feeding rate and bead filter pressure................. 71
11. Relationship between bead filter pressure and flow............................... 72
12. Effects of backwashing on bead filter pressure, flow, andTSS removal............................................................................................ 77
13. Relationship between bead filter and RBC TAN removal..................... 87
14. Relationship between bead filter and RBC N 02-N removal.................. 88
15. Daily variations in water quality in System II....................................... 94
16. Effects of feeding on TAN, N 02-N, and DO in System II...................... 98
17. Relationship between tube settler and RBC TAN removal.................. 106
18. Relationship between tube settler and RBC N 02-N removal............... 107
19. Daily variations in water quality in System III.................................... 112
20. Effects of feeding on TAN, N 02-N, and DO in System III.................... 115

21. Comparison of predicted levels of TAN in each systemas a function of feeding ra te . ............................................................. 118
22. Comparison of predicted levels of N 02-N in each systemas a function of feeding rate............................................................... 119
23. Comparison of predicted levels of DO in each systemas a function of feeding rate............................................................... 120
24. Relationship between feeding rate and sand filter pressure............... 123
25. Relationship between sand filter pressure and flow............................. 124
26. Relationship between RBC TAN loading and removal.......................... 141
27. Relationship between RBC N 02-N loading and removal...................... 142
28. Plot of predicted RBC TAN and N 02-N removal withloading rate......................................................................................... 144

ABSTRACT
The performance of combinations of the ftorpac® tube RBC with a bead
filter (System I), a tube settler (System II), and a sand filter (System III) in
pilot scale recirculating systems stocked with tilapia were evaluated and
compared. Good fit empirical equations were obtained relating TAN and N 02-
N (both exponential), and DO (linear) with daily amount of feed. Likewise,
linear equations relating bead filter or sand filter pressure with feed, and flow
with pressure were obtained.
Systems I and II maintained favorable water quality up to the maximum
feed load studied of 3 kg/day. System III effectively handled only 1.2 kg/day
because the sand filter clogged a t higher feed rates. At this feeding level, the
sand filter removed most of the TAN and N 02-N leaving the RBC substrate-
limited and ineffectual.
Performance of the bead filter-RBC combination was found to be affected
by the backwashing process. In the combination, the bead filter removed TAN
but not N 02-N, and functioned primarily as a solids removal filter, and the
RBC handled most of the nitrification. The best backwashing option studied
was 30-second propeller agitation with daily backwashing.
A hydraulic overflow rate of 119.5 m3/m2-day was suitable for settling
with the Bio Strata media, with a retention time of 7-11 minutes. Mean
sludge TSS harvest rate was 249.9 g dry solids/kg feed, significantly higher
than tha t of the bead filter (175 g dry solids/kg feed) as a result of the flushing

procedure followed. The settler produced TAN and N 02-N so the RBC was
predominately responsible for nitrification in System II.
There was no significant difference in TAN and NOa-N removal by the
one-inch and the two-inch diameter tube RBC. The RBC was shown to have
a good aeration capacity, which was higher for the two-inch RBC. Modified
Monod expressions were derived that closely described the relationship
between the areal TAN or N 02-N loading with removal rate, and was used to
determine the recommended design value of TAN or N 02-N removal of 0.357
g/m2-day a t 36.5 percent efficiency for the tube RBC.

INTRODUCTION
BACKGROUND
For over two decades there has been considerable interest in water
recirculating systems for fish culture. A multitude of schemes exists for
water treatment that are applicable to recirculating systems as reported in
the scientific literature. I t is clear that the success of a recirculating system
largely depends on how it effectively handles fish wastes resulting from
intensive stocking and feeding. The most critical of these wastes are solid
and nitrogenous wastes. For fish to thrive, water reuse systems require
capable solid waste removal filters and biological filters together with other
components necessary to maintain a favorable system environment.
The rotating biological contactor (RBC) has documented success in
aquaculture applications (Westerman et al., 1993; Libey, 1991; Rogers and
Klemetson, 1985; Miller and Libey, 1985). The overall nitrification has been
better than other biofilter types. The RBC must be used in conjunction with
a solids removal filter, however, since it has no capability for removing solid
wastes.
The present research examined combinations of the RBC with a sand
filter, a tube settler, and a floating bead filter in pilot scale recirculating
systems stocked with tilapia (Oreochromis niloticus). The RBCs were made
of one-inch or two-inch diameter latticed tube media (ftorpac® tubing, NSW
Corporation, Roanoke, VA), and the design has yet no performance data
1

2reported in the literature. The sand filter was a typical pressurized downflow
swimming pool filter. The tube settler employed the Bio Strata media which
are generally recommended as a biofilter or trickling filter media but had not
been fully explored as a settling device for recirculating fish culture.
The floating bead filter is capable of ammonia removal that compares
favorably with other fixed film nitrification filters (Malone et al., 1993;
Malone and Coffin, 1991; Wimberly, 1990), although high solids removal is
one of its distinctive features. Malone et al. (1993) recognizes, however, that
there is an inherent conflict between the solids capture and nitrification mode
of the bead filter at high feed loadings, particularly in excess of 24 kg/m3
media per day. The use of other biofilters to lend nitrification support was
recommended. This project examined the combination of a bead filter and
RBC.
OBJECTIVES
The general objective of the study was to establish design and
operational criteria associated with the solids removal filter and RBC
combinations. Specifically, the objectives of the study were:
1) to evaluate and compare the performance of combinations of the
Norpac® tube RBC with a bead filter, a tube settler, and a
pressurized sand filter;
2) to evaluate and compare the performance of the one-inch and the
two-inch ftorpac® tube RBC;

3) to evaluate and compare the performance of the bead filter, tube
settler, and sand filter;
4) to develop empirical models tha t predict filter performance, and
5) to make design and operational recommendations.

REVIEW OF LITERATURE
Interest in water reuse or recirculating systems has steadily increased
for over two decades. A paramount objective is their economic application to
commercial scale production of food fish. While proper management is
required and economic viability is a vital challenge, part of the interest
appears to be the result of the advantages and evident technical feasibility
of recirculating systems. Recirculating systems allow the elimination of
significant water resource and space requirements; flexibility in siting;
environmental control (hence, adaptability in what may be cultured); year-
round production; and product quality control (Van Gorder, 1991; Wortman
and Wheaton, 1991; Wheaton, 1977). Recirculating systems can also be a
viable solution to future constraints on increased aquaculture production,
particularly waste discharge regulations and decreasing water quality in
natural waters (Wortman and Wheaton, 1991). The more self sustained the
system is, the lesser the threat to the environment.
WATER QUALITY REQUIREMENTS IN RECIRCULATING SYSTEMS
In recirculating systems, environmental factors are not only important
to the metabolism and growth of the fish but also to the efficiency of the
water purification process, primarily solid waste removal and nitrification.
Bacteria involved in the biological filtration process can grow over a wide
range of environmental conditions. Of foremost concern, therefore, is the
requirements of the fish. The following review will show that the water
4

quality requirements of a warmwater fish or tropical fish like tilapia
correspond well with the requirements of nitrifying bacteria.
Requirements of Tilapia
Fish culture systems in general should satisfy the requirements for fish
to thrive. These requirements may be classified as physical, chemical, and
biological factors (Parker and Davis, 1981) any of which may be limiting in
the aquatic environment. Biological factors may be either intrinsic (e.g.,
nutrition, physiology of the fish and its response to the environment) or
extrinsic like pathogens or in natural habitats, predators and competing
species (Parker and Davis, 1981). Physical and chemical factors pertain to
environmental (culture water) factors, among the more important of which
are temperature, pH (and alkalinity), dissolved oxygen, and nitrogenous
toxicants.
A hardy tilapia species was chosen as the waste source for this study.
Hence, the pilot systems were operated to suit their requirements. There is
keen interest worldwide in the culture of tilapia. They are important not only
for their food value but also for their usefulness in biological vegetation and
mosquito control, and other minor roles as a bait fish, a sport fish, a feed for
other fishes, and an aquarium fish (Balarin and Haller, 1982; Dupree and
Huner, 1984). Tilapias are characterized by their amenability to
intensification, fast growth, efficient use of natural and other aquatic foods
including organic domestic and agricultural wastes, propensity to consume a

variety of supplemental feeds, ease of reproduction in captivity, resistance to
diseases and handling, resistance to poor water quality, and tolerance to wide
ranges of environmental conditions (Balarin and Haller, 1982; Lim, 1989).
Balarin and Haller (1982) assessed the suitability of tilapia for
intensive culture and reviewed their tolerance limits to various environmental
factors. They reported that the temperature range for growth of tilapia is 20-
35°C (68-95°F), with an optimum between 28-30°C (82-86°F) (or as cited by
Luquet (1991), 28-31°C). Tilapias generally are not able to survive a water
temperature below approximately 8-12 °C (46-54 °F) depending on species,
and their activity and feeding become reduced below 20°C (68 °F; Lim, 1989;
Balarin and Haller, 1982; Chervinski, 1982). Feeding stops around 16°C (61
°F; Dupree and Huner, 1984; Lim, 1989). Tilapias can grow over a pH range
of 5 to 11 (Balarin and Haller, 1982; Chervinski, 1982; Lim, 1989) although
a pH range of 7.0 to 8.0 is recommended (Chervinski, 1982).
Some species of tilapia have been shown to survive dissolved oxygen
concentrations of 0.1 mg/L (Lim, 1989; Chervinski, 1982), although in general,
oxygen levels of 0.1-3.0 mg/L are critical, and may adversely affect growth
and feeding (Balarin and Haller, 1982). Oxygen levels above 3 mg/L are
considered optimal (Luquet, 1991), with 2-3 mg/L cited by Muir (1982) as the
lowest levels for growth.
Ammonia, particularly the unionized form, and nitrite are the forms
of nitrogen toxic to fish (Russo and Thurston, 1991). Tilapia can tolerate an

unionized ammonia nitrogen (NH3-N) concentration of 2.35 mg/L (Balarin and
Haller, 1982; Chervinski, 1982; Lim, 1989). I t should be noted that chemical
analyses generally measure total ammonia nitrogen (TAN). The portion that
is unionized is a function of pH, temperature and salinity. From calculations
illustrated by Huguenin and Colt (1989), 2.35 mg NH3-N/L is equivalent to
a total ammonia nitrogen (TAN) concentration of 32-420 mg/L at a pH and
temperature range of 8.0-7.0 and 25-30°C, respectively. Balarin and Haller
(1982) listed the lethal TAN limit as greater than 20 mg/L. Chervinski (1982)
cited that tilapia was observed to tolerate up to 11 mg TAN/L a t pH 8 and 27
°C in experimental ponds. Westerman et al. (1993) reported hybrid tilapia
surviving levels of 20-40 mg TAN/L and 10-20 mg N 02-N/L for extended
periods in full-scale intensive recirculating systems with typical pH values
of 7.2-7.5 and temperature of 28-30 °C. Based on their experience in
recirculating tilapia systems, however, Drennan and Malone (1992)
recommend a TAN and NOa-N level of less than 5 mg/L in the culture tank.
For most other fishes in general, a TAN concentration less than or equal to
1 mg/L (based on experience from salmonid culture) is recommended by Colt
(1991), Stickney (1979), and Wheaton (1977).
Under closed culture, all nutrients required by tilapia have to be
supplied through feeds. At grow-out size of 30 grams or more, the minimum
dietary level of an amino acid-balanced protein required for optimum growth
in the absence of natural food is about 35 percent; and a feeding rate of 3 to

4 percent of fish weight fed 3 to 4 times daily is recommended (Lim, 1989).
Based on reviews conducted by Luquet (1991), however, the most economical
dietary protein content, even if it does not support maximum growth, is close
to 28 percent; and for Oreochromis niloticus, the optimal number of feedings
per day is nine for juvenile and six for 100 g or larger fish (because of the
continuous feeding behavior and small stomach capacity of tilapias). Kubaryk
(1980; cited in Lim, 1989), however, determined that O. niloticus grew faster
when fed four times daily than when fed two times daily, but did not grow
faster when fed eight times daily.
Tilapias have been shown to tolerate very high stocking densities in
tank culture. Balarin and Haller (1982) reported densities of up to 100 kg/m3
in experimental tank culture, while Lightner et al. (1988) reported the
experimental culture of various tilapia species with no major problem in high
densities ranging from 20 to 115 kg/m3 in fresh and saline water recirculating
systems. Westerman et al. (1993) aimed for stocking intensities of 90 kg/m3
in various full-scale recirculating systems. In practice, for fish tha t tolerate
crowding like tilapia, the maximum practical density will depend on water
quality considerations and system management. With adequate water
treatment and aeration in a three biofilter test system, Miller and Libey
(1985) achieved a density for catfish of up to 226.8 kg/m3. As a general rule,
Huguenin and Colt (1989) suggest maximum densities for production of 1-2
lb/ft3 or 16-32 kg/m3 assuming good water quality and amenability to

9
crowding. Balarin and Haller (1982) recommend 50 kg/m3 (>3 lb/ft3) as
normal for intensive tilapia production tha t will still take advantage of
enhanced individual growth rates.
Requirements for Nitrification
A principal element for water treatment is biological filtration,
primarily nitrification. Nitrification is a two step biological oxidation process
where fish-excreted ammonia is first oxidized to nitrite (both ammonia and
nitrite are toxic to fish) by Nitrosomonas spp. of bacteria, and then nitrite is
oxidized to nitrate (basically nontoxic) by Nitrobacter spp. of bacteria.
Equations 1 and 2 show the basic chemical conversion processes, while
Equation 3 describes the overall oxidation process with cell growth, as
commonly cited in the literature (Wheaton et al., 1991a,b; Hochheimer and
Wheaton, 1991; Wheaton, Hochheimer and Kaiser, 1991).
NH4* + 1.5 0 2 -* 2 H* +2 H20 + N 0 2 (1)
N 0 2 + 0.5 0 2 - N 0 3- (2)
NH4* + 1.83 0 2 + 1.98 HC03' -> 0.021 C & O J t + 0.98 N 0 3'+ 1.041 H20 + 1.88 H2C03 (3)
Detailed discussions and comprehensive reviews of nitrification in general
and mostly in wastewater engineering had been presented by Tchobanoglous
and Burton (1991) and Sharma and Ahlert (1977). As applied to aquaculture
systems, design considerations and the effects of different parameters on
biofilter performance are adequately presented in the literature (Wheaton et

10al., 1991a,b; Hochheimer and Wheaton, 1991; Petit, 1990; Huguenin and
Colt, 1989; Kaiser and Wheaton, 1983; Wheaton, 1977). Among the critical
factors (interrelated and with complex interactions) identified tha t affect
biofilter performance are temperature, pH, alkalinity, dissolved oxygen,
ammonia and nitrite concentrations, particulate or suspended solids, and
biofilter attributes and operational parameters.
Wheaton et al. (1991a,b) observed that there is considerable
disagreement in the literature on the effects of temperature, citing studies
that suggest that bacteria will acclimate to a variety of temperatures.
However, within a range of temperature, nitrification proceeds a t a faster
rate a t warmer temperatures, and considered optimum for nitrification are
temperatures in the range of 28-36 °C (Sharma and Ahlert, 1977). The
results of the study by Wortman and Wheaton (1991) using a rotating
biodrum filter showed that nitrification performance was linearly related to
temperature in the range from 7 to 35°C. But because of nitrite accumulation
a t higher temperatures, they recommend 25°C as optimum for biodrum
operation under similar operating conditions as those used in their study.
Sharma and Ahlert (1977) cited that the thermal death point of Nitrosomonas
is between 54-58°C, and tha t little or no growth of nitrifying bacteria is
expected below 4°C.
Keeping adequate DO levels in the biological filter is very important,
especially in submerged filters where the only source of oxygen for bacteria

11is the water flowing through the filter. Nitrifying bacteria (Nitrosomonas and
Nitrobacter) are generally considered strict aerobes even though there is
evidence that Nitrobacter may be facultative (Sharma and Ahlert, 1977). The
availability of oxygen is, therefore, necessary for efficient nitrification.
Theoretically, 4.57 mg 0 2 is required per mg ammonia nitrogen. However,
studies have shown that the actual ratio of oxygen consumed to nitrogen
oxidized is generally less than stoichiometric requirements (Sharma and
Ahlert, 1977). The difference can usually be explained by the overall process
of bacterial cell synthesis and oxidation. Kaiser and Wheaton (1983) cited
tha t Haug and McCarty (1971) using synthetic ammonia waste, had shown
that as long as nitrification’s oxygen requirement is met, nitrification rate is
independent of DO concentration. Aquacultural wastewater is nowhere near
to containing ammonia only, and has a lot of organics which exert
considerable oxygen demand and which are consumed by other competing
bacteria (heterotrophs). Kaiser and Wheaton (1983) also cited studies that
showed better nitrification rates a t higher DO concentrations. Manthe et al.
(1988) demonstrated that oxygen may be the principal limiting factor for
submerged biological filter efficiency. There is not enough scientific evidence
to ascertain the required minimum oxygen level for aquacultural biofilters,
however. Based on results from wastewater treatment, DO levels above 2
mg/L are recommended by the Water Pollution Control Federation for safe
operating conditions (Kaiser and Wheaton, 1983; Hochheimer and Wheaton,

121991). Malone and Burden (1988) and Drennan and Malone (1992)
emphasized, however, that the DO level of 2 mg/L is for the filter effluent.
There has been a wide range of pH optima reported, but literature
values cited by Wheaton et al. (1991a,b) and Hochheimer and Wheaton
(1991) showed that a pH range of 6 to 9 is most suitable for nitrifying
bacteria. Painter (1970; cited in Muir, 1982) reported pH 8.0-8.5 as optimum,
with marked inhibition outside of pH 6-9. Thomasson (1988) studied the
effects of pH in the range of 7.0-8.5 in a bench scale recirculating fluidized
(sand) bed system and found pH 7.S-8.5 as optimum for nitrification. To be
on the alkaline side but low enough to reduce unionized ammonia, he
recommended that the pH be maintained between 7.5-8.0.
Alkalinity is consumed during the nitrification process. Bisogni (1991)
showed from stoichiometry that nitrification has an alkalinity destruction
rate of about 0.143 equivalents (7.14 g as CaC03) per gram of TAN removed
(6.0-7.4 g as CaC03 per g NH/-N according to Sharma and Ahlert, 1977).
Wheaton et al. (1991a,b) cited that an alkalinity of 75 mg CaCCyL is
sufficient to maintain maximum nitrification rates. To ensure sufficient
supply, an alkalinity of at least 150 mg/L as CaC03 is recommended by
Drennan and Malone (1992). Allain (1988) developed a pH management
diagram showing pH and alkalinity conditions that may be expected in
aquaculture systems and which indicated methods that may be employed to
maintain optimum pH and alkalinity.
13
Impact of Fish on Water Quality
In recirculating systems, the waste load results from fish excreta and
wasted feed. Muir (1982) recognized the difficulty in quantifying uneaten
food in aquaculture conditions, tha t hardly any allowance is provided for it
or the effects of its breakdown. In general, waste production can be
estimated based on total amount of feed supplied assuming all was consumed.
Hopkins and Manci (1989) illustrated that on a dry basis, only about 20
percent of the weight of feed is incorporated into the fish, and more than 80
percent is waste. Colt (1991) estimated tha t for every kilogram of feed
consumed, fish in general require 250 g 0 2, and excrete 340 g C02, 30 g TAN,
and 500 g fecal solids. The above values were probably estimated averages
from values observed by others through excretion studies and
characterization of waste discharged from culture systems.
Wimberly (1990) determined that for catfish that weighed from 195 to
612 g and fed 35 percent protein feed at 1 percent of body weight per day,
waste excretion averaged 20.3 g TAN, 430 g total suspended solids (TSS), and
430 g biochemical oxygen demand (BOD5) per kg feed per day. There was
high variation in the parameters measured which he attributed to varying
metabolic rates of the fish tested, but values were in the range of those
reported by Page and Andrews (1973) and Ruane et al. (1977) (i.e., 18 to 36
g TAN, 180 to 690 g TSS, 100 to 400 g BOD5 per kg feed). Based on mass
balance analysis in a recirculated water system for red tilapia fed 22 percent

14
protein feed a t 1.5 percent ofbodyweight, Suresh and Lin (1992) obtained an
apparent ammonia excretion rate of about 160 mg TANZkg fish-day or 11 g
TAN/kg feed-day, and an oxygen consumption rate of2,330 mg OJkg fish-day
or about 155 g CX/kg feed-day.
A number of relationships have been based on the simplified
assumption of metabolic effects being proportional to feed input within
normal ranges of food demand (Muir, 1982). This is supported by results
from several studies. While the approach is generally valid for overall effects,
there is significant diurnal variation in metabolic activity depending
primarily on the time of feeding (Colt, 1991; Heinsbroek and Kamstra, 1990;
Bovendeur et al., 1987; Muir, 1982). Liao and Mayo (1974) noted tha t waste
excretion rates vary with fish size or weight but tend to be fairly constant in
terms of waste excreted per unit weight of feed. Based on values obtained for
salmonids, they developed equations from which metabolic rates may be
estimated as 547 g 0 2, 103-450 g C02, 29 g NH4-N, 520 g TSS, and 600 g
biochemical oxygen demand (BODe) per kilogram feed. Colt and Armstrong
(1981) noted that the ammonia production is a function of the feed protein
content and is proportional to feeding rate, and suggested the following
equation to estimate the excretion rate:
TAN={1.0-PCF) * P L * 1 0 0 0 /6 .2 5 (4)
where:
TAN = TAN production in g/kg feed-day

15
PCF = protein conversion factor (effectively utilized by fish; average
values vary from 0.65 to 0.8)
PL = feed protein content (in decimal)
Assuming a PCF value of 0.65, Equation 4 yields 19.6 and 12.3 g
TAN/kg feed-day for 35 percent and 22 percent protein feed, respectively,
which compares very well with the values observed by Wimberly (1990) and' w
Suresh and Lin (1992) above.
Solid wastes produced by fish consist of both suspended (settleable and
non-settleable) and dissolved solids. Suspended solids have long been
recognized as one of the major problems in recirculating systems, and their
removal can be the most critical aspect of water reuse. They are
characterized by a broad size spectrum, high organic content, and low density
(Chen and Malone, 1991). Muir (1982), Coffin (1993), Chen and Malone
(1991), and Liao and Mayo (1974) all recognized tha t solids may physically
block filtration systems, and their breakdown or decomposition exerts an
additional load (as oxygen demand and generation of ammonia) on water
treatment systems, particularly biofilters. Suspended solids can also directly
affect the fish through gill damage and consequently, reduced disease
resistance (Stickney, 1979).
Wimberly’s (1990) work with channel catfish waste characterization
illustrated the important role of solids removal in greatly reducing the waste
load in recirculating water treatment. By filtering water samples, he showed

16
that total Kjeldahl nitrogen (TKN) and BOD6 could be reduced by
approximately 58.4 percent and 76.9 percent, respectively. Liao and Mayo
(1974) also observed tha t organic solids contribute about 70 percent of the
ammonia nitrogen, and by settling fish culture water for one hour, a
reduction of 20 percent was achieved. Manthe et al. (1988) reported tha t
improvements in carrying capacity of a submerged rock filter for blue crab
shedding can be realized by solids removal which was shown to reduce filter
oxygen demand by approximately 30 percent.
SETTLERS
Detailed discussions of solid removal processes, design and operational
considerations are available in Tchobanoglous and Burton (1991). The
primary methods employed in aquacultural recirculating systems involve
sedimentation and/or filtration processes. Processes and equipment
specifically for aquaculture applications have been reviewed by Wheaton
(1977), Huguenin and Colt (1989), Chen and Malone (1991), and Losordo et
al. (1992).
Settling or sedimentation tanks are the simplest equipment for
removing settleable solids from the culture water. Particle settling can be
analyzed by means of the classic laws of sedimentation formed by Newton
and Stokes. Both theory and design were presented by Tchobanoglous and
Burton (1991) in full detail. The basic operating principle of settlers is that
the solid particles that will settle have terminal velocities greater than the

settler overflow rate. From actual measurements on settleable solids from
channel catfish and striped bass culture tanks, Parker (1981) observed that
more than 90 percent of the solids settled a t an average rate of 13-16.7
cm/min, while the smallest visible particles settled a t 1.7-3.4 cm/min.
Chesness et al. (1975) studied the settling characteristics of channel catfish
raceway effluent and obtained much lower values. They found that
approximately 40 percent of the solids have settling velocities equal to or
greater than 3.048 cm/min, and only about 20 percent are computed to have
settling velocities greater than 13 cm/min. Chen et al. (1992) characterized
the suspended solids from recirculating systems and obtained a particle
specific gravity of 1.19. With this value, they estimated that, depending on
sedimentation water depth (up to 2 m), a retention time of 30-40 minutes is
required for particles 100 microns or greater, which are about the smallest
size tha t sedimentation can remove (Chen and Malone, 1991). Liao and Mayo
(1974), however, found that a settling basin with a retention time greater
than 15 minutes was sufficient to remove most of the settleable solids.
Actual settler performance should vary because of differences in
construction, waste concentration and interaction, and hydraulics of different
systems. Lomax and Wheaton (1978) reported tha t a settling basin with a
20.7 minute retention time removed 119 g settleable solids/kg feed per day
a t an overflow rate of 36 m3/m2-day. Based on recorded range of particle
velocities in fish farm effluent, Muir (1982) estimated overflow rates ranging

18
from 20-50 m3/m2-day for simple sedimentation basins, but cited considerable
settlement a t rates of 30-90 m3/m2-day in a tube-flow settler he studied.
McLaughlin (1981) reported a range of 108-380 g dry solids recovered in
sludge per kg feed in linear concrete clarifiers operated a t an overflow rate
of 57-59 m3/m2-day and 15 minutes retention time for trout raceways.
Mudrak (1981) obtained positive correlation between the amount of feed and
amount of sludge accumulated in concrete rectangular clarifiers, citing
recoveries of 183-258 g dry solids per kg feed. He recommended a maximum
overflow rate of 40.8 m3/m2-day and a minimum retention time of 30 minutes
a t peak hourly flow. Chesness et al. (1975) obtained an average 48 percent
solids removal in a shallow model settling basin operated a t an overflow rate
of 4.4 m3/m2-day and 2.94 minutes retention time.
To greatly reduce basin size and increase solids removal efficiency,
settlers may incorporate Lamellar/plate or tube settling media. Culp and
Conley (1970) discussed the successful use of tube settlers on plant scale
water treatment systems, and cited tha t higher overflow rates of 175-293
m3/m2-day were permissible for a tube basin while upper limits of 59 m3/m2-
day are common for conventional upflow clarifiers. Plate or tube settlers are
usually set a t an angle between 45 and 60 degrees above the horizontal
because of sludge accumulation within the plates or tubes a t less than 45
degrees, and reduced efficiency a t angles greater than 60 degrees
(Tchobanoglous and Burton, 1991). McLaughlin (1981) reported a sludge

harvest range of44-238 g/kg feed for Lamellar settlers operated at 30 m3/m2-
day overflow, which was relatively less than those observed for linear
clarifiers mentioned above. He attributed the large variations in the 30-day
sludge harvest to variations in sludge decomposition occurring in the settlers
he examined. Petit (1990) reported 23 percent suspended solids removal in
a Lamella settler with a hydraulic retention time of 5 minutes and loading
rate of 82 m3/m2-day. Bovendeur et al. (1987) observed that irrespective of
the hydraulic loading up to 50 m3/m2-day, about 70-75 percent of the
suspended solids chemical oxygen demand was removed by Lamella settlers
loaded with catfish tank effluent. However, they observed high standard
deviations for hydraulic loading rates exceeding 20 m3/m2-day due to varying
particle size distribution, probably caused by disintegration of the original
fecal material due to water and fish movements in the fish tank. They,
therefore, recommended hydraulic loading rates of 20 m3/m2-day or less for
Lamella settlers, adding that 10 m3/m2-day may be preferred in order to
prevent accumulation of small suspended particles.
McLaughlin (1981) also reported significant TSS and total Kjeldahl
nitrogen (TKN) removal across the clarifiers. The most consistent data were
observed during raceway cleaning, with TSS and TKN removal efficiencies of
79.2-91.2 percent and 38.2-61.3 percent, respectively, reported for the linear
clarifiers, and 65.6-77.9 percent and 20.4-48.2 percent for the Lamella
separators. For a linear clarifier, he reported that TKN removal efficiency

20
was lower (14.3 percent) during fish feeding compared to measurements
during cleaning. As with the performance of the Lamella settlers compared
with the linear settlers, the lower efficiencies may be attributed to the very
low influent concentrations approaching lower test limits.
Libey (1993) reported the performance of a multi-tube clarifier
employing Biodek 19060 as media. At an overflow rate of 177 m3/m2-day and
about 10 minutes retention time, average overall TSS removal efficiency was
56 percent. Performance was best for particles over 70 microns in size, with
an average removal efficiency of 81 percent. He observed, however, that the
relatively poor removal of particles below 30 microns in size resulted in a
culture water dominated by increasing levels of fine, largely organic particles
which he recommended to be removed due to the potential harmful effect on
fish. The clarifier basin dimensions were 1.52 m wide x 1.52 m long x 1.22
m high. At 8 kg feed/day of hybrid striped bass grower formulation, the
clarifier required approximately 950 liters of water for washdown and 1,900
liters replacement water daily.
EXPANDABLE GRANULAR MEDIA FILTERS
Expandable granular filters have gained acceptance as both physical
and biological filters. Unlike settlers, these filters permit higher hydraulic
loading rates and better removal of small particles to greater than 20 microns
(Chen et al., 1993). In practice, the effectiveness of granular filters is limited
by backwashing requirements, head loss through the media, clogging and
biofouling (Chen and Malone, 1991).

21
Pressurized Downflow Sand Filters
Sand and gravel filters have been used extensively for aquaculture
applications, and commercially available sand filters designed for swimming
pools have been readily adapted for use (Stickney, 1979). When extremely
high loading is applied to sand filters, clogging becomes a problem, and the
filter requires frequent backwashing. Losordo et al. (1992) described the
problems associated with the use of a pressurized downflow sand filter. In
systems requiring large quantities of feed, the consequent solids buildup
would require frequent backwashing. Bacterial growth can also create
gelatinous masses within the filter that are impossible to clean with
hydraulic backwashing, necessitating chemical or mechanical cleaning of the
filter. When the filter clogs, flow will be reduced or stopped. Stickney (1979)
suggested that if backwashing is necessary more than once daily, sand filters
of larger capacity should be utilized. Thus, pressurized downflow sand filters
have been widely used especially in systems with few fish or low feed rates
(Losordo et al., 1992). Other than general descriptions, no design and
performance data is available from the scientific literature. Performance of
the upflow sand filter can, however, provide an indication of their potential
capacity. Malone and Burden (1988) estimated that an upflow sand filter can
remove about 50 percent of the solid waste in a recirculating system with
proper backwashing, and in addition, the filter serves as an effective
biological filter. Areal TAN removal was estimated by Malone and Coffin

22
(1991) a t 64 mg/m2 media-day for coarse sand with a specific surface area of
2,350 m7m3.
Floating Bead Filters
Floating, low density granular bead filters employed in an upflow,
pressurized configuration facilitate solids capture and biofiltration in a unit
process, providing an opportunity to reduce the cost of water treatment in
recirculating systems (Malone et al., 1993). The bead filter is capable of
ammonia removal that compares favorably with other fixed film nitrification
filters (Malone et al., 1993; Malone and Coffin, 1991; Wimberly, 1990). High
solids removal is a positive feature. I t becomes obvious that much higher
solids removal rates are obtained with more frequent backwashing.
Operation of a bead filter for clarification is straightforward with the
avoidance of excessive headloss (consequently, reduced flow) as the principal
criterium (Malone et al., 1993). However, for integrated treatment, the
carrying capacity of bead filters is controlled by their nitrification ability.
Malone et al. (1993) recognizes tha t there is an inherent conflict between the
solids capture and nitrification mode of the bead filter. Greater solids
removal require more vigorous and frequent backwashing while maintaining
a healthy nitrifying bacteria population requires a critical sludge retention
time. The relationships between backwashing intensity and frequency, and
nitrification are still not clearly understood. For feed loadings in excess of 24
kg/m3 media per day, Malone et al. (1993) recommend the use of other
biofilters to lend nitrification support to the bead filter.

23
Wimberly (1990) first demonstrated the biofiltration capacity of the
floating bead filter (FBP). Problems with the cylindrical tank design, and
limitations of the hydraulic method of backwashing became apparent from his
study. However, he demonstrated the significant influence of backwashing
frequency on biofiltration. The study indicated tha t more frequent
backwashing resulted in better ammonia oxidation capacity, a facet that
Wimberly (1990) attributed to rapid organic solids removal and the
consequent reduction of nitrifying bacteria competition (for space and oxygen)
from heterotrophs. At an optimal 8 backwashes per day, he showed that the
FBF has a TAN removal rate of nearly 430 g TAN/m3 media per day or 350
mg TAN/m2 media-day, at an average per pass removal efficiency of 17.8
percent. The filter was estimated to have a carrying capacity of about 2,189
kg catfish/m3 media when fed 1 percent of body weight per day, which is
equivalent to about 22 kg feed/m3 media. Mean per pass N 02-N removal was
calculated to be 8.2 percent. The data showed that both TAN and N 02-N
removal were intermittently inhibited, especially during the latter part of
Wimberly’s experiment. The frequent backwashing which was necessitated
by the filter design was suspected to have affected the bacterial residence
time such that nitrification capability was reduced. Hydraulic flux rate
averaged 1,344 Lpm/m2 during Wimberly’s study, which was required to
insure proper media mixing during backwashing.
With limitations of the cylindrical tank configuration and hydraulic
backwashing apparent from Wimberly’s study, bubble-washed and propeller-

24
washed versions of the bead filter were later developed and continually
investigated by Dr. R. F. Malone of the Department of Civil Engineering,
Louisiana State University and his team. Chitta (1993) examined the effects
of backwash frequency on nitrification in a laboratory scale, propeller-washed
filter following a fixed duration of propeller agitation which resulted in a
mean TSS removal of 44.6 percent (sludge harvest fraction) in a single wash.
He obtained average per pass TAN, N 02-N, and TSS removals of 26.5
percent, 26 percent, and 82 percent, respectively. Backwashing every 2 days
resulted in higher average per pass TAN removal (34.6%) than backwashing
every day (24.1%) and backwashing four times a day (17.9%) Likewise, he
illustrated the concept of the areal nitrification coefficient normalized for
influent TAN concentration (based on nitrification kinetics a t steady state
with reasonable assumptions, this is the slope in the linear relationship
between areal TAN removal rate and influent TAN concentration; the
coefficient has a unit of g TAN/m2 media-mg TAN/L-day) where he showed
that the rate of TAN oxidation increased with reduced backwashing frequency
(see also Malone et al., 1993). He obtained coefficients of 240, 422, and 547
g TAN/m2 media-mg TAN/L-day for 4 backwashings per day, 1 backwashing
per day, and 1 backwashing every 2 days, respectively. The rate of increase
in TAN oxidation decreased as backwashing frequency is decreased,
suggesting that there was a point of optimum rate. He observed peak
nitrification rates at 1.5 days when the filter was not backwashed, after

25
which, he contended that inhibition of nitrifiers takes place due to the
accumulation of organic solids and heterotrophic biomass, i.e., the TSS and/or
organic loading rather than the TAN loading limit peak capacities of the bead
filter (Malone et al., 1993). Chitta (1993) obtained TAN removal rates similar
to Wimberly (1990) of up to about 350 mg/m2 media-day (366 g/m3 media-day)
depending on backwashing frequency and influent TAN concentrations.
Malone et al. (1993) summarized the areal nitrification rates (from 50-350
mg/m2 media-day) tha t may be assumed to size bead filters as a function of
desired influent TAN concentrations and backwashing frequency. The results
obtained by Chitta (1993) seemed contrary with that of Wimberly (1990) but
this can most probably be explained by consequences of the differences in
feeding rates and in washing intensity attained with propeller washing used
by the former and hydraulic washing by the latter. Chitta (1993) maintained
a hydraulic flux rate through the filter of approximately 204 Lpm/m2.
The nitrite aspect of bead filter performance, however, had not been
reported as thoroughly as its ammonia and solids removal performance.
Without presenting any areal N 02-N removal rate, Malone and Coffin (1991)
noted tha t the bead filter lags behind the RBC and fluidized bed filters.
Intermittent high nitrite levels were reported in the studies done by
Wimberly (1990) and Chitta (1993). In commercial scale, high nitrite levels
greater than 6 mg N 02-N/L (which became worse) in a system employing two
FBFs was also apparent from a study by Westerman et al. (1993). The

26
performance of the floating bead filters were variable, with high TAN
concentrations and suspended solids build-up also noted within the system.
The problem was attributed to improper backwashing. TAN and N 02-N
removal rates obtained were 122-164 and -83 (i.e., net gain)-ll g/m3 media-
day, respectively. Compared with other filters, however, the bead filter, with
a media volume of 0.28 m3,was most effective and consistent in removing
solids at a rate of 5-6 kg TSS/m3 media-day.
Chen et al. (1993) reported that the total solids generated in sludge
from a system employing the bead filter was directly related to feeding rate,
obtaining 124 g dry solids per kg moist feed or 140 g on a dry basis. This
value was lower than the reported fish excretion (e.g., Wimberly (1990)
obtained an excretion rate of 430 g TSS/kg feed for channel catfish) which
they attributed to solids decay in the system.
ROTATING BIOLOGICAL CONTACTORS
Antonie (1976) adequately described the operation of the rotating
biological contactor (RBC; see also Tchobanoglous and Burton, 1991) for
domestic wastewater treatment. The RBC is slowly rotated while
approximately 40 percent of the surface area is submerged in the wastewater
a t any one time which provides vigorous contact of the biological growth with
the water, constant mixing, efficient self aeration (continuous gas exchange
and/or stripping), a positive means of continuously stripping or sloughing
excess biomass (hence, non-clogging), and stable, high degrees of treatment.

27
Libey (1991) reviewed the use of rotating biological contactors (RBC)
in recirculating aquaculture systems. He observed tha t the optimum
combinations of various factors influencing RBC performance as an
aquaculture biofilter have not yet been established. The factors identified
include hydraulic loading, mass loading, retention time, number of stages,
rotational velocity, waste concentration, and water temperature. For
secondary or biological treatment of wastewater, Weng and Molof (1974) have
studied the effects of influent loading, flow rate, rotational speed, rotational
direction (no significant effects), retention time, disk surface area, submerged
disk depth (no significant effects), and liquid temperature on a six-stage RBC
performance. They employed multiple regression analysis to develop
empirical equations relating the fraction of influent loading remaining with
flow rate, influent loading, surface area, rotational speed, retention time, and
submerged disk depth; however, the latter three factors were found not to
significantly contribute to the regression equation. Results obtained from
conventional wastewater treatment do not necessarily apply to fish culture
water, however, because of the differences in waste loads.
In domestic wastewater treatment, the rotating biological contactor
process has been found to demonstrate first order kinetics for the removal of
carbonaceous BOD, ammonia nitrogen, and removal of ultimate oxygen
demand (Antonie, 1976). This means that at a specific hydraulic loading, a
specific percentage removal of BOD will occur independent of influent

28
concentration. Because of this, the primary design criterion is hydraulic
loading (flow per unit time per unit of surface area covered by biological
growth), and not organic loading as is often practiced with the activated
sludge and trickling filter process.
The retention time of wastewater within the RBC tanks is an
important factor affecting performance. The optimum tank volume of 4.9 L/m2
of media surface (0.12 gal/ft2) has been determined for domestic wastewater
up to 300 mg/L BOD (Antonie, 1976). In aquaculture systems, Libey (1991)
reported that for a given mass loading, increasing the water retention time
increased the TAN removal rate. Removal efficiency also increased with
retention time, however, a specific percentage was removed regardless of
mass loading. No practical means exist to control the amount of biomass for
the RBC, but the biomass that develops will be tha t best suited to treating
the wastewater (Antonie, 1976). Sludge age is exceptionally long. Excess
biomass is continuously sloughed due to the continuously rotating media. For
domestic wastewater treatment, the optimum RBC peripheral speed was
recommended by Antonie (1976) as 18.3 m/min (60 ft/min). That is, for a disc
diameter of 1.0 m, a rotational speed of 5.8 rpm is needed to attain this
peripheral speed. Direction of media rotation has no effect on treatment
efficiency and is not a factor in selecting rotational velocity. Weng and Molof
(1974) observed increasing nitrification efficiency with increasing peripheral
speed between 5 to 20 m/min. Lewis and Buynak (1976) were among the

29
early researchers to describe the use of the RBC in recirculated fish culture.
They, however, used only 6 rpm for a 0.51 m diameter (9.6 m/min peripheral
speed) RBC with good results.
A number of studies have been made to evaluate and compare the
performance of the RBC with other types of biological filters, generally
showing better performance by the RBC. Lewis and Buynak (1976)
established a carrying capacity of 2 kg fish/m2 of surface area in a two-stage
disc RBC at a hydraulic loading of 0.52 m3/m2 media-day. Fish were fed 2
percent of their body weight. Each RBC consisted of 30 plates of corrugated
fiberglass with a total surface area of 12.5 m2. Assuming 20 g TAN/kg feed,
the estimated TAN removal rate is 800 mg/m2 media-day, which is
comparable to other values reported here. Kaiser and Wheaton (1983)
reviewed and compared 9 recirculating systems which included the
submerged upflow filter, trickling filter, RBC, and rotating biodrum, and they
concluded tha t the biodrum and the RBC performed best. Rogers and
Klemetson (1985) evaluated four biofilters (RBC, biodrum, trickling filter,
submerged filter) using synthetic feedstock solution simulating fish and
invertebrate culture waste. The RBC, consisting of 16 plexiglass discs in 4
stages (0.254 m diameter, 1.66 m2 total surface area), provided the best
treatment in terms of ammonia and BOD removal over the greatest range of
hydraulic loads, removing over 90 percent of the ammonia a t hydraulic loads
up to 0.06 m3/m2 media-day. The biodrum removed over 80 percent of the

30ammonia for a hydraulic loading of 0.05 m3/m2-day, while the trickling filter
removed 50 percent up to 0.012 m3/m2-day. The ammonia removal rate
obtained for the RBC was 2.83 g/m2-day.
Westerman et al. (1993) evaluated various types and combinations of
biofilters (four upflow sand filters, an upflow sand filter and two fluidized bed
sand filters, two floating bead filters, an upflow sand filter and an RBC) in
an operating full-scale intensive tilapia production facility. The most stable
and reliable nitrifying filter was the RBC, which provided the highest TAN
removal although the rate per unit volume of media was lower than other
biofilters. TAN and N 02-N removal rates were 101 and 195 g/m3 media-day
or about 270 and 527 mg/m2 media-day, respectively. Using common water
from channel catfish culture, Miller and Libey (1985) evaluated the
comparative performance of the RBC, the fluidized bed reactor, and the
packed tower. The RBC provided the best nitrification efficiency, and they
obtained TAN removal rates of 190, 630, and 780 mg/m2-day, and ammonia
removal efficiencies of 76, 82, and 74 percent for TAN loadings of 250, 768,
and 1,054 mg/m2-day, respectively, a t 15.4 minutes retention time. Nunley
and Libey (in Libey, 1991) using striped bass obtained TAN removal rates of
125,173, and 296 mg/m2-day for TAN loadings of570, 690, and 1,480 mg/m2-
day, respectively, a t 5.8 minutes retention time. The values correspond to an
ammonia removal efficiency of 22, 25, and 20 percent, respectively.
Parker (1981) described a commercial RBC with 1,394 m2 disc surface
(arranged in four stages so that operation can be as a 1-, 2-, 3- or 4-stage

unit) which was part of a water reuse system employing a subsurface silo and
plate clarifiers. No performance data was available from his report. Knosche
(1994) reported the performance of the Stahlermatic® system which is a
combination of the rotating biodisc with an activated sludge system. The
setup obtained an RBC nitrification rate of 1,400 mg/m2 disc surface-day, with
a maximum observed at 2,300 mg/m2-day.
The results of the study by Wortman and Wheaton (1991) on the
rotating biodrum may also provide relevant indication of the potential
performance of the Norpac® tube RBC which is of interest in this study
considering the significant likeness of the two rotating biofilters. Using
synthetic wastewater, they observed a daily ammonia removal rate a t 25°C
of 1,300 mg TAN/m2 of 1" diameter Jaeger tri-packs media (Hart Enterprise,
Fairfield, CT; 278.83 m2/m3 specific surface area).
NITRIFICATION KINETICS AND MODELLING
The empirical hyperbolic Monod expression describing nitrification
kinetics (Equation 5) is generally accepted and used in biological filter
modelling studies (Knowles et al., 1965; Sharma and Ahlert, 1977; Kaiser and
Wheaton, 1983; James, 1984; Tchobanoglous and Burton, 1991; Wheaton et
al., 1991a,b):

32
where:
dC/dt = rate of change in substrate concentration, g/L-day;
jimax = maximum specific growth rate of bacteria, day*1;
X = concentration of microorganisms, g bacteria/L;
Y = bacterial yield coefficient, g bacteria grown per g substrate utilized;
C = limiting substrate concentration, g/L; and
Kc = Monod half-velocity constant or substrate concentration a t half
the maximum growth rate, g/L.
Sharma and Ahlert (1977) cited several studies where first-order and
zero-order kinetics appear to fit nitrification rate data. They emphasized that
the nature of the Monod expression need to be noted. At low concentrations
of the limiting substrate (Kg» C ) , it reduces to a first-order expression. At
high substrate concentrations (C»K c), it becomes a zero-order expression.
Because of the hyperbolic nature of the equation, depending on the range of
substrate concentrations studied, it is also conceivable to get good fit of a
half-order expression. There were also studies cited by Sharma and Ahlert
(1977) where the process was effectively modelled by a two-step, sequential
reaction following first-order kinetics.
In domestic wastewater treatment, Antonie (1976) had shown that the
RBC may demonstrate first-order kinetics for the removal of ammonia
nitrogen. This also means that at a specific hydraulic loading, a specific
percentage removal of ammonia will occur independent of influent

33
concentration. In freshwater recirculation systems, Bovendeur et al. (1987)
showed that nitrification for a submerged upflow filter and a trickling filter
(both employing plastic filter media) can be described by a sequential half
order or zero-order kinetics in relation to the ammonium concentration. In
sea-water recirculation systems, biofilm kinetics in a trickling filter was
described accurately by the half-order/ zero-order kinetic model in a study by
Nijhof and Bovendeur (1990), although at much lower rates than in
freshwater systems. In both cases, however, the plots of removal rate with
ammonium concentration conforms with that of the Monod profile. A
modification of the Monod expression (Equation 6) was cited by Sharma and
Ahlert (1977), Kaiser and Wheaton (1983), and Wheaton et al.(1991a) where
a constant specific activity is assumed in lieu of pmnx/Y. Specific activity was
defined as the maximum amount of substrate utilized per gram of
microorganism per day.
f ’ k X K ^ C (6)where:
k = jimax/Y = specific activity, g substrate/g microorganism per day.
I t was noted by Kaiser and Wheaton (1983) and Wheaton et al.
(1991a,b), however, that nitrifier growth rate and nitrification rate are more
a function of the substrate loading and not simply the substrate
concentration. They cited studies which supported the principle that

34
substrate removal is a t the same efficiency with the same total substrate
loading, regardless of whether loading is accomplished by high flow rate and
low substrate concentration or a low flow rate at a high substrate
concentration. For example, Brune and Gunther (1981) demonstrated that
for a particular inlet ammonia concentration, ammonia removal rate is higher
a t shorter filter retention times, which is equivalent to a higher flow rate
through the filter and hence, higher loading rate. Increased flow rate results
to an increase in substrate availability to bacteria.

MATERIALS AND METHODS
RECIRCULATING SYSTEMS
The schematic diagrams of the pilot scale recirculating systems are
shown in Figure 1 for the bead filter-RBC combination, Figure 2 for the tube
settler-RBC combination, and Figure 3 for the sand filter-RBC combination.
Table 1 summarizes the important features of each system, hereafter referred
to as System I, System II and System III, respectively. Each of the three
culture systems consisted of a fiberglass rearing tank, a solid removal filter,
an RBC, a UV sterilizer, a water pump, and the necessary PVC piping and
valves. All systems were housed at the Aquacultural Engineering Laboratory,
Ben Hur Aquaculture Research Facility, Louisiana State University
Agricultural Center, Baton Rouge.
Rearing Tank
In each system, the 2.30 m diameter x 0.91 m (7.5 ft diameter x 3 ft)
rearing tank was filled to a depth of 0.84 m (33 in), providing a volume of
approximately 3,365 liters. It had a 7.62 cm (3 inch) center drain fitted with
a 46 cm (18 inch) long overflow pipe. Water was drawn from the tank bottom
through a screened 15.24 cm diameter x 91 cm high (6 in x 36 in) stand pipe
sleeved around the overflow pipe, a setup referred to by Meske (1985) as the
overflow suction pipe system or by Balarin and Haller (1982) as the central,
constant overflow stand-pipe. Volume was maintained through a float valve
directly connected to an overhead laboratory water supply, mostly to replace
35

Return LinesBlower Air
B e a dF ilte r
U.V.
Figure 1. Schematic diagram of System I.

Blower Air Return Lines
Tube Sett er
WjmxmwMw?/-Fish Tank
IDrain
Pum pU.V.
Figure 2. Schematic diagram of System II.

4
R B C
Return LinesBlower A i r ^
Fish Tank
P u m p S a n d F ilterFlow
U .V .
Figure 3. Schematic diagram of System HI.
90

39
Table 1. Components of the pilot scale recirculating systems.
Item System I System II System III
Rearing Tank
Circular fiberglass, 2.30 m dia. x 0.91 m inside (Rowland,Ingleside, TX)
Central drain, constant overflow stand pipe
Filled volume of 3.365 m3
Solids Removal Filter
Bead filter (PBF-6, Armant, Vacherie, LA)
Tube settler (Bio Strata, Part LS42A,
Aquatic Eco- Systems,Inc. Apopka, FL)
Sand filter (Triton TR100, Pac-Fab, Sanford, NC)
Media Volume: Surface Area: Cross-section:
0.170 m3 178 m2 0.46 m2
0.453 m3 62.5 m2 1.54 m2
(1.24 sq. x 0.76m deep tank)
0.076 m3 178 m2 0.46 m2
RBC (Norpac® tube media) Dimension:
Surface Area: Rotation:
Submergence: Tank:
Filled Volume:
One-inch
0.91 m dia. x 1.22 m 197 m2 3 rpm 0.37 m1.47 x 1.32 x 0.76 m
1.41 m3
Two-inch 1.22 m dia.
x 1.22 m 197 m2 3 rpm 0.52 m
1.47 x 1.32 x 0.76 m
1.41 m3
UV Sterilizer Model 120IL (Aquanetics Systems, Inc., San Diego, CA)
Water Pump1.12 kW Jacuzzi-Magnum,
Little Rock, AR0.56 kW Teel Water Systems, Chicago, IL
System Volume 5.12 m3 5.71 m3 5.05 m3

40
water lost through evaporation, minor leaks, and splashing during feeding.
When the systems were backwashed, replacement water was pumped from
a continuously aerated holding tank using a submersible pump (Little Giant
Model 6-CIM-R, Oklahoma City, OK) in addition to the overhead water
supply.
Bead F ilter
The propeller-washed FBF (Model PBF-6, Armant Aquaculture, Inc.,
Vacherie, LA) in System I contained 0.170 m3 (6 ft?) of low density
polyethylene bead media. Based on data from Chitta (1993), the media has
a specific surface area of 1,046 m2/m3 or 319 ft2/ft3 and a porosity of 35.45
percent. Therefore, the bead filter used had a total surface area of
approximately 178 m2 (1,914 ft2). Throughout the experiment backwashing,
when required, was manually performed at 0930 hours. The propeller driven
backwash sequence as described and illustrated by Malone et al. (1993) was
implemented, with a slight variation. The FBF media was propeller agitated
for the required duration (i.e., 20, 30 or 45 seconds), and allowed to settle for
10 minutes before being backwashed into a sludge tank. However, about half
of the water exchanged was backflow from the RBC, intended to wash down
some of the sludge and biofloc trapped in the bead bed prior to draining the
filter completely. Water exchange was approximately 196 liters daily or 3.8
percent of the total system volume. The exchange volume was kept constant
even if the FBF was not propeller agitated and backwashed.

41
Tube Settler
The tube settler in System II consisted of four rectangular blocks of
0.305 m square x 1.219 m long (1 ft square x 4 ft) Bio S trata media (Part No.
LS42A, 138 m2/m3 (42 ft2/ft3), Aquatic Eco-Systems, Inc., Apopka, FL), a cross*
flow packing media. The media formed a total surface area of 62.5 m2 (672
ft2). The media can be described as constructed from ribbed, corrugated black
PVC glued in a block that form crisscrossing tubes a t a 60 degrees angle with
the horizontal. They were supported 10 cm from the bottom of a wooden,
epoxy-painted tank. The tank had inside dimensions of 1.24 m square x 0.76
m depth. It was filled to a depth of 0.61 m during operation, containing
about 938 liters of water, representing 16.8 percent of the total system
volume. Thus, when flushed every two days, the equivalent water exchange
was 8.4 percent of the system volume per day.
Rearing tank water flowed by gravity (head difference of 0.13 m) into
the settler tank bottom through two 2-inch PVC pipe inlets a t one end. The
same openings were used to drain sludge during flushing. A split, perforated
6-inch PVC pipe 50 cm long shrouded each inlet, and was effective in
reducing turbulence and distributing the incoming water flow (containing
suspended solids) below the settler media. Pumped water was drawn from
just above the settler media, a t the end opposite the settler tank inlets.
Sand F ilter
A Triton high rate sand filter model TR100 (Pac-Fab, Sanford, NC) was
used in System III. The downflow filter was filled with 130 kg (286 lbs) of

42
coarse silica sand (#12 or 8/16; bulk density of 1,713.5 kg/m3; specific surface
area of 2,345 m2/m3 or 715 ft2/ft3; porosity of 33.2 %) to have a similar media
surface area of 178 m2 as the bead filter. Fitted with an electrical valve
actuator (Model JVA2440 Jandy, Novato, CA), the sand filter was controlled
through a Chrontrol "CD" model wall timer to backwash automatically at
0945 and 2145 hours daily. Water exchange was approximately 480 liters per
day or 9.5 percent of the total system volume per day.
R o ta ting Biological C ontactor
For each of Systems I and II, the prefabricated cylindrical RBC, 0.91
m diameter x 1.22 m long (3 ft x 4 ft), was constructed from 2.5 cm (1 in)
diameter latticed tube (Norpac® tubing, NSW Corporation, Roanoke, VA)
having a specific surface area of 246 m2/m3. The RBC media, which formed
a total media surface area of 197 m2 (2,120 ft2), was mounted on a 4.5 cm
diameter stainless steel shaft. The shaft was supported by pillow block
bearings on both ends across the narrow section of the rectangular RBC tank
(the same size for each RBC). The two RBCs were rotated at 3 rpm with a
chain and sprocket drive powered by a 0.19 kW (1/4 hp) Dayton gearmotor.
The wooden, epoxy-painted RBC tank had inside dimensions of 1.47 m length
x 1.32 m width x 0.76 m depth. It was filled to a depth of 0.72 m, thus
contained about 1,410 liters water. A 0.32 cm (1/8 inch) thick aluminum
plate baffle 0.28 m high was placed a t the center bottom of the tank directly
below the RBC to reduce short circuiting. Water returned from the RBC back
to the rearing tank by gravity, with a head difference of 0.2 m.

43
The RBC in System III was 1.22 m diameter x 1.22 m long (4 ft x 4 ft).
I t consisted of 5.0 cm (2 in) latticed tube having a specific surface area of 138
m2/m3, and had a total media surface area of 197 m2 similar to the one-inch
tube RBCs used in Systems I and II. The height of the aluminum plate baffle
in the RBC tank was 0.13 m. A splash guard was provided on each side of
the two-inch RBC tank.
A eration an d D isinfection
Continuous blower aeration was provided directly in each rearing tank
through four dispersed airstones. Air was supplied by a single, continuously
running 1.12 kW (1.5 hp) Rotron model DR454R72 blower. Supplemental
oxygen was later provided (on day 174) by direct bubbling through one of the
airstones in each of Systems I and II. Pure oxygen was continuously
generated on-site by an AMOX model B-21 (Louisville, ICY) oxygen generator.
A Mino-Saver agitator (120 watts, Model AA2R100K, Commerce Welding and
Mfg. Co.Inc, Dallas, TX) was provided in System I (on day 206) for additional
aeration.
Disinfection was provided in each system by a Model 120IL ultraviolet
(UV) sterilizer (Aquanetics Systems, Inc., San Diego, CA).
Pum ps and W ater R ecircu lation
To permit the use of only one pump in each system, recirculating water
was passed through the solids removal filter, then flow was divided between
the RBC and the UV sterilizer. Water circulation was achieved in Systems
I and II with a 1.12 kW (1.5 hp) centrifugal pump (Jacuzzi-Magnum, Little
44
Rock, AR) equipped with a strainer. The high capacity of the 1.12 kW pump
requires bypassing much of the flow back to the tank which, however,
ensured good water velocity in the tank, completely mixed conditions, and
effective self-cleaning. A 0.56 kW (0.75 hp) centrifugal pump (Teel Water
Systems, Chicago, IL) was used in System III.
T em perature, pH an d A lkalinity Control
Temperature of the systems was maintained within limits of 28-30 °C
by utilizing the laboratory air heating and venting system. Alkalinity and pH
were regulated through the addition of sodium bicarbonate.
SYSTEM STARTUP
Systems startup began on July 6, 1993. Test runs were conducted to
ensure that all components were functioning properly, and to determine flow
settings. After one week of successful test runs, all systems were acclimated
chemically by the addition of ammonium chloride and sodium nitrite to yield
approximately 12 mg/L of both total ammonia nitrogen (TAN) and nitrite
nitrogen (N02-N), and 70 mL of Aiken Clear-Flo 1200 concentrated bacteria
(an aquarium conditioner described by the manufacturer as a synergistic
blend of live bacteria including Nitrosomonas andNitrobacter). The systems
were not backwashed or flushed during the entire acclimation period.
STOCKING AND FEEDING
The systems were stocked with hormone treated, sex-reversed tilapia
(Oreochromis niloticus) purchased from Til-Tech Aqua Farm, Robert, LA on

September 17 and 24, 1993. Additional fish (9 fish/kg; 111 g/fish) were
stocked on October 27, 1993 which brought the level to 480 fish in each
system. The number of fish was later increased in Systems I and II to 640
fish averaging 174 grams on December 4, 1993 (density of 190 fish/m3, 35
kg/m3 of tank water volume) by transferring fish from System III which had
to be operated at reduced feeding rate after reaching its operational limit.
Table 2 shows the fish stocking schedule, number and size of fish in each
system, not counting a total of 156 fish lost as jump outs from all systems the
day after stocking on September 17, 1993.
The fish were fed a 35% protein diet (Clover brand floating catfish
fingerling pellets). Feed was provided four times daily a t 0600,1000, 1400,
and 1800 hours with calibrated Sweeney AF7 vibratory feeders controlled
through a Chrontrol "CD" model wall timer. To study the effects on water
quality in the rearing tank and to minimize shock loading, the amount of
feed in each system was provided at increasing levels while keeping
temperature, pH, alkalinity, air supply, and flow settings consistent, and
following a fixed backwashing or flushing schedule for each system.
Regression models were used for each system to establish the relationship
between feeding rate and TAN, NOz-N, and DO concentration in the rearing
tank, and compared using analysis of covariance (Neter et al., 1985; SAS
Institute, Inc., 1988).

46
Table 2. Schedule of stocking, number and size of fish in each system.
DateDayNo. Item
System
I II m
9/17/93 0
No. Added 132 132 137
Wt./Fish (g/fish) 41 41 41
System Total Number 132 132 137
9/24/93 7
No. Added 261 260 255
Wt./Fish (g/fish) 28 28 28
System Total Number 393 392 392
10/27/93 39
No. Added 90 88 89
Wt./Fish (g/fish) 111 111 111
System Total Number 479 480 481
12/04/93 77
No. Added 161 160 -321
Wt./Fish (g/fish) 174 174 174
System Total Number 640 640 152
Note: System Total Number of fish is as of indicated date. Total of new fish added plus previous total may not match because of mortalities.

47
WATER QUALITY MEASUREMENTS
Water in the rearing tank of each system was monitored daily between
0845 to 0930 hours for temperature, dissolved oxygen (DO), pH, total
ammonia nitrogen (TAN), and nitrite (N02-N); weekly for alkalinity, and
biweekly for nitrate (N03-N).
Filter performance was evaluated by examining the change in TAN,
N 02-N, DO, and total suspended solids (TSS) across each solid removal filter
and RBC. At least a week of monitoring showed no detectable water quality
change across the UV units, hence, the UV effluent was considered as
essentially of the same quality as the solid removal filter effluent. Flow rates
were measured with a calibrated bucket and a stop watch by measuring the
time it took to fill 7.57 liters (2 gallons). Sludge TSS was also measured to
quantify the amount removed during backwashing or flushing.
Temperature and DO were measured using a YSI Model 58 DO meter
calibrated daily according to manufacturer instructions. The meter was
periodically checked for accuracy by comparing results for temperature with
a mercury thermometer, and for DO with the azide modification of the
Winkler method with a digital titrator using 60 mL BOD bottle (Hach, 1989).
pH was measured with a portable Model 43800 Hach One pH meter.
TSS was determined gravimetrically according to Standard Methods
(APHA, 1989). Water samples for TAN, N 02-N, NOa-N, and alkalinity were
analyzed immediately using the Hach DREL/2000 portable laboratory,

48
equipped with a DR 2000 direct reading spectrophotometer, according to
methods presented in Hach (1989). All determinations were done in
triplicate.
Ideally, there should be continuous monitoring throughout the day to
obtain the average daily performance but this was not possible with present
resources. To observe variation during a 24-hour period, and to have an
estimate of the TAN excretion rate, System I was monitored every hour for
a complete 24-hour cycle beginning 1200 hours on December 11,1993. Based
on similar techniques employed by Heinsbroek and Kamstra (1990) and
Suresh and Lin (1992), the apparent rate of TAN excretion was calculated
using Equation 7 which was based on a mass balance analysis across the
rearing tank assuming steady-state conditions in System I :
&TAN = ~p [0R (CT~CR) +Ou{CT-CB) ] (7)
where:
Etan = TAN excretion rate, mg/kg feed-day
F = amount of feed, kg
Qr = flow through the RBC, L/day
Q0 = flow through the U.V. unit, L/day
CT = tank effluent TAN concentration, mg/L
CR = RBC effluent TAN concentration, mg/L
CB = FBF effluent TAN concentration, mg/L

49
Values were computed for each hourly measurement and averaged to get the
daily TAN excretion rate.
SYSTEM EXPERIMENTS AND ANALYSIS
System I
Based on literature values on biofilter performance (Libey, 1991;
Malone, et al., 1993; Rogers and Klemetson, 1985; Wimberly, 1990), a daily
TAN removal rate of 250 mg/m2 of media surface is reasonable. Assuming a
daily excretion rate of 30 g TAN/kg feed (Huguenin and Colt, 1989 and Colt,
1991), the total media surface area of 375 m2 of the FBF-RBC combination
was estimated to handle a. feed loading of 3 kg/day. Backwash studies were
made at this feeding level throughout, which was also observed as virtually
the maximum the tilapia would consume under the rearing conditions.
The studies conducted by Chitta (1993) on a laboratory scale propeller-
washed bead filter indicated that backwashing every day to every two days
work well a t a daily feed loading of 24 kg/m3 of media (at 3 kg feed/day, the
equivalent daily feed loading for the FBF used here was 18 kg/m3 of media).
Thus, to determine the effects of backwashing on water quality parameters,
system and component performance, six backwashing treatment combinations
of three durations of propeller agitation (20, 30, and 45 seconds) and two
frequencies of backwashing (daily and every two days) were planned, and
randomly sequenced. However, only four backwashing treatments can be
implemented (in random sequence, 30/2 or 30 seconds propeller

50
agitation/backwashed every 2 days from day 115-151; 30/1 or 30 seconds
propeller agitation/backwashed everyday from day 152-185; 45/1 or 45
seconds propeller agitation/backwashed everyday from day 186-220; and 20/1
or 20 seconds propeller agitation/backwashed everyday from day 221-247)
when it became apparent tha t backwashing every 2 days was not sufficient.
The scale of the systems did not allow replication, however, the system was
operated for at least 26 days for each particular backwashing treatment (at
3.8% water exchange per day, the system water turnover was 26.3 days). In
transition between treatments, 30 percent of the system volume was replaced
to diminish any residual effect of the previous treatment. Further, a seven
day allowance was made for system adjustment to each new treatment, and
data for a t least that period (taken for monitoring purposes) were excluded
in the statistical comparisons. Wortman and Wheaton (1991) examined the
literature and based on restabilization times in pH, ammonia loading, and
DO studies, they estimated a 7-day adjustment period which they applied,
and found reasonable, in their study of temperature effects on biodrum
nitrification. Water quality and filter performance data were compared by
analysis of variance using the General Linear Models procedure (GLM, SAS
Institute, Inc., 1988; Petersen, 1985; Steel and Torrie, 1980).
System II
An a priori decision was to limit the water exchange in each pilot
system to 10 percent or less of the system volume per day, which is the norm

51
for recirculating systems. Hence, System IPs tube settler was flushed every
two days at the most, which proved sufficient. Flushed water represented
16.8 percent of the total system volume, thus, the equivalent water exchange
was 8.4 percent of the system volume per day. At a feeding level of 3 kg/day,
the steady-state mean performance of System II and its component Alters at
this flushing rate was compared with tha t of System I by analysis of variance.
A head-to-head comparison of the one-inch and the two-inch tube RBC
was performed. On April 1, 1994 (day 195 after stocking) the two-inch RBC
(RBC-2) was piped to System II (Figure 4) in parallel with the one-inch RBC
(RBC-1). The two sizes of RBC were tested simultaneously in System II. The
two-inch RBC was chemically acclimated beginning 3/08/94 (day 171) by the
regular addition of ammonium chloride (to 2 mg TAN/L), scrapings from other
RBCs, and water from System II. The system and the RBCs (particularly
RBC2) were allowed to stabilize in the new setup until steady performance
was observed in both RBCs by day 215. Nearly identical flow rates to the
RBCs were maintained. To examine the effect of feed/waste loading on the
RBCs, three feeding levels in random order (3.0, 1.5, and 2.0 kg feed/day)
were applied during the head-to-head study. Differences (at the 5 percent
level of signiflcance) between the RBCs and their performance at different
loading rates were determined by analysis of variance. Regression models
were used to describe the relationship between waste loading and waste
removal rate.

Blower Air
RBC-1
Return Lines
Tube Settler
Fish Tank
%
Pump U.V.
Figure 4. Schematic diagram of System II during the RBC size comparison study.

System III
Comparisons between the three systems were planned a t the feeding
level of 3 kg/day. I t became apparent, however, that a t two backwashing per
day (water exchange of 9.5 percent), System III can effectively handle 1.2 kg
feed/day a t the most because of clogging problems. Mean performance of the
sand filter, the RBC, and the combination was evaluated and compared at
feeding levels of 0.5 and 1.0 kg/day by analysis of variance assuming a 5
percent level of significance.

RESULTS AND DISCUSSION
FILTER ACCLIMATION
The chemical acclimation method and the liquid concentrated bacteria
used proved very effective. Acclimation was rapid (Figure 5), with system
equilibrium occurring in 8 days in System I (Figure 5a), and 13 days in both
Systems II and III (Figures 5b and 5c, respectively). Three days after these
periods, the systems were spiked to a level of 3 mg TAN/L by adding
ammonium chloride. The N 02-N levels hardly increased in all systems, and
was completely depleted on the third or fourth day, assuring acclimation. To
ensure an active bacterial population, ammonium chloride was added to
supply about 2 mg TAN/L daily until the systems were stocked with fish.
The 2 mg/L was estimated as more than needed to simulate the ammonia
load when fish are stocked.
The acclimation periods observed here compare reasonably with results
from previous studies. Generally, acclimation of new biological filters for
aquaculture systems takes 30 days or more (Hirayama, 1974) when allowed
to proceed naturally through the introduction of cultured animal (20-35 days
according to Wheaton, Hochheimer and Kaiser, 1991). By seeding new
biofilters with wet media from an established filter, Carmigiani and Bennett
(1977) showed that acclimation time of an aquarium gravel bed can be
reduced by an average of 14 days (13 vs. 27 days). Bower and Turner (1984;
cited in Hochheimer and Wheaton, 1991) found that by adding 10 percent wet
54

TAN N02-N
t-
Oay Number
(a) System I
N02-N
t -
Day Number
(b) System II
N02-NTAN
i * -
29
Day Number
* Spiked with NH«C1 to 3 mg TAN/L
(c) System III
Figure 5. System acclimation curves.

56
filter media from established seawater systems, a startup reduction compared
to controls of 81 percent (4 days compared to 21 days) and 89 percent (4 days
compared to 37 days) for ammonia and nitrite removal, respectively, can be
attained. Comparably, Manthe and Malone (1987) found tha t the chemical
addition of ammonium chloride and sodium nitrite to 12 mg/L of TAN and
N 02-N together with concentrated nitrifying bacteria reduced the acclimation
period in submerged rock filters. They achieved acclimation in 26 days in an
experimental crab shedding system, which was 10 days faster than systems
acclimated by loading crabs only.
STOCK PERFORMANCE
The growth of tilapia was not a primary objective of this project.
However, the stocking performance and mortalities in each system are shown
in Table 3. When it became apparent that the operational limit of System III
had been reached (see later discussions), fish in the system was reduced on
day 77 (see Table 2) to only 152 fish compared with 640 in each of systems
I and II. The larger fish size at the end of the experiments and the higher
feed conversion ratio in System III can therefore be expected. In general,
however, the feed conversion ratios of 2.47, 2.53, and 2.17 for System I, II,
and III, respectively were reasonable for the stocking densities attained.
Suresh and Lin (1992), for example, obtained mean feed conversion ratios
(dry feed weight/wet fish weight gain for red tilapia fed 22% protein feed) of
2.25, 2.57, and 2.61 for stocking densities of 50, 100, and 200 fish/m3,

Table 3. Stock performance and mortalities in each system.
57
ItemSystem
I II i n
Maximum Number of Fish 640 640 478
Mass/Fish, g“ 488.3 466.4 554.7
Maximum Fish Mass, kg° 308.6 297.6 83.2
kg/m3 Rearing Tank 91.3 87.5 24.7
No7m3 Rearing Tank . 190 190 142
kg/m3 System Volume 60.0 51.5 16.5
No./m3 System Volume 125 112 95
Mortalities1* 187 118 2
Feed Conversion Ratio® 2.47 2.53 2.17
Notes:a. As of 6/12/94; based on average mass of 30 samples from each system.b. Losses were due to occasional "jump-outs" (all 2 from System HI were) but majority
of the mortalities from Systems I and II were due to Aeromonas spp. (John Hawke, LSU Vet. Med., personal communication) during the period from 6/9/94 and later.
c. Based on the total mass of moist feed (12% MC) and gain in mass from 12/04/93 (day 77) to 6/12/94 (day 267).

58
respectively. Noticeable mortalities in Systems I and II were observed
beginning the first week of June 1994, which was attributed to Aeromonas
spp. (John Hawke, LSU Veterinary Medicine, personal communication). The
high stocking densities, experimental and intermittent water quality changes,
occasional downtimes (i.e., power irregularities, pump stoppage, leak repairs,
blower failure), harvestable size of fish, and reduced efficacy of the U.V. units
(while kept clean, lamps were not changed during the 260 days study) could
have all contributed to fish stress and susceptibility in systems I and II.
System I with the most mortalities was subjected to more experimental
changes than the other systems.
SYSTEM I: BEAD FILTER-RBC COMBINATION
G eneral System Conditions
A wide range of water quality conditions occurred in System I during
the study. However, water conditions were generally within desirable levels
for both tilapia and nitrifying bacteria. Raw data for System I are tabulated
in Appendix A. Figure 6 shows the daily changes in temperature, pH, DO,
TAN, and N 02-N in System I. The system had noticeable response to a
sudden increase in feeding from a prior 2 kg to 3 kg/day beginning a t day
115. TAN peaked to just over 2 mg/L at day 115-116, while NOa-N
accumulated and peaked a t 5.7 mg/L by day 120, until the system finally
restabilized by day 130. That filters need to restabilize after a significant
load change is documented in the literature, and Wheaton et al. (1991a,b)

•^Temperature, °C -°-D0, mg/L + p H ^T A N , mg/L ‘♦ 'N 02-N , mg/L
Backwash 30/1 M -------------- 3 0 /2 -------------- M —30/1 —►'<—45/1 — M — 20/1Increasing feed rate — 2 kg/day—M ---------------------3 kg/day ------------------------ ►
Day 63 115 151 185 220
0 25 5 0 7 5 1 00 125 150 175 2 0 0 2 25 25 0
Days S in ce Stocking
Figure 6. Daily variations in water quality in System I.
Tem
pera
ture
,°C

60
observed that depending on the magnitude of change, this takes about 10
days or longer. The spike on day 221 during the transition from backwashing
45/1 (too much bead agitation) to 20/1 resulted from overcleaning. TAN and
N 02-N spikes on days 205 and 234 resulted from the water pump tripping off.
The overall average water quality in the rearing tank and operational
conditions throughout the entire study for System I are shown in Table 4.
Outlying values (there were instances when the air blower or water pump
malfunctioned, and when leaks had to be repaired) were excluded in the
summary. The rearing tank concentrations of DO, TAN, N 02-N, and TSS
were affected by the backwashing treatment as will be discussed later in
more detail. The average water temperature (30.6 °C), pH (7.85), DO (5.0
mg/L), and alkalinity (169 mg CaCOg/L) in System I are well within desirable
levels both for tilapia and nitrifying bacteria. Balarin and Haller (1982)
reported that the range for growth of tilapia is 20-35°C, with a reported
optimum between 28-30°C. A pH range of 7.0-8.0 is recommended for tilapia
according to Chervinski (1982), while based on literature values reported by
Wheaton et al. (1991) and Hochheimer and Wheaton (1991), a satisfactory pH
range for nitrifying bacteria is 6 to 9. Thomasson (1988) determined a pH
range of 7.5 to 8.5 as optimum for nitrifying bacteria.
The periodic addition of sodium bicarbonate proved very successful in
maintaining desirable pH and alkalinity. The alkalinity levels were very
good, and concur well with the recommended minimum of 75 mg CaCOg/L

61
Table 4. Water quality and operational conditions in System I during the entire study.
Parameter Range Mean Std.Dev.
n
Temperature, °C 27.0-33.6 30.6 1.2 206
DO, mg/L 3.0-7.8 5.0 1.1 206
pH 7.03-8.76 7.85 0.35 209
Alkalinity, mg CaCOa/L 97-248 169 38 36
TAN, mg/L 0.02-2.12 0.87 0.37 204
NOz-N, mg/L 0.004-8.250 1.100 1.380 204
NO3-N, mg/L 8.1-110.0 48.5 27.9 14
TSS, mg/L 1.2-15.3 5.3 3.5 28
Turbidity, NTU 0.2-4.4 1.3 0.4 111
Qfbf> Lpm 46-198 128 27 136
Qrbc> Lpm 25-109 66 15 136
PBF Pressure, kPa 55-221 117 34 127

62
cited by Wheaton et al. (1991) as sufficient to attain maximum nitrification
rates. The DO levels were generally above 3 mg/L which is optimal for tilapia
according to Luquet (1991), and which normally provided adequate DO levels
particularly across the bead filter. There is minimal concern, therefore, for
any of the above parameters inhibiting the nitrification performance of the
filters studied.
In the range of experiments conducted, up to a maximum feeding rate
of 3.0 kg 35% protein feed/day, the system was able to maintain TAN and
N 02-N levels which are very satisfactory. In general, the high values of TAN
and N 02-N reported were observed during transition periods between
operational or experimental treatment changes. There was no significant
N 03-N accumulation as manifested by the highest recorded value of 110 mg
N 03-N/L, suggesting that the water exchange rate of 3.8 percent/day was
sufficient. I t is also possible that with the low and variable FBF effluent DO
(2.17±0.66 mg/L), anaerobic pockets, therefore, denitrification, existed in the
bead filter. A good indication is the production of N 02-N across the bead
filter generally more than the TAN removed (see later discussions).
Diel V ariations in W ater Q uality an d TAN E xcretion
The diel water quality fluctuations are apparent in Figure 7. There
was much less variation (defined as the ratio of actual divided by the mean
value) in temperature and pH (with variations of 0.99-1.01) compared to DO,
TAN and N 02-N (Table 5). Declines in DO were noticeable at one hour after

TAN
or N
02-N
, m
g/L
63
2.0 5.5Feeding Time
1.8- -5.0Mean DO
1 .6 --4.5
1.4--4.0
1.2-Mean TAN -3.5
1.0-
-3.00 .8-
-2.5Mean N02-N0.6-
0.4 i i i i ■" i i --■(■■■"i" i—i— i i i i i i i i i i "i i i "i 2.0 1200 1400 1600 1800 2000 2200 2400 200 400 600 800 1000 1200
1300 1500 1700 1900 2100 2300 100 300 500 700 900 1100Hour of Day
- m - TAN —•— N02-N DO
Figure 7. Diel variations in water quality in System I.DO
, m
g/L

64
Table 5. Diel variations in water quality in System I.
ParameterTemp.,
°CpH DO,
mg/LTAN,mg/L
n o 2-n ,mg/L
Mean 30.3 7.38 4.72 1.08 0.591
Std. Dev. 0.31 0.04 0.50 0.13 0.091
% C.V. 1.02 0.50 10.63 11.89 15.47
Maximum 30.7 7.46 5.50 1.45 0.785
Minimum 29.9 7.31 3.59 0.80 0.432
Maximum/Mean 1.01 1.01 1.17 1.34 1.33Minimum/Me an 0.99 0.99 0.76 0.74 0.73

65
each feeding period, with a diel fluctuation of 0.76-1.17 of the mean daily
value. The drop in DO just after feeding agrees with the observation cited by
Petit (1990) that oxygen consumption increases and may more than double
over a period of 20 minutes to several hours after feeding.
The TAN and N 02-N concentration was highest a t 2200 and 2300
hours, respectively, four and five hours after the last feeding period at 1800
hours. Daily fluctuations were basically the same for both, ranging from
0.73-1.34 times the mean value. It is clear that any single measurement,
particularly on DO, TAN and N 02-N, does not reflect the average condition
for the entire day. The water quality readings at 0900 hours appear to be
well within reasonable ranges, however. As with numerous studies of this
nature, single daily measurements are utilized for practical reasons.
The variation in TAN excretion is shown in Figure 8. A general
increasing trend in TAN production can be seen for about 16 hours (from
0600 to 2200 hours), starting 1 hour after feeding began. The pattern and
magnitude of diel variation (the range varied from 0.5-1.6 times the mean
value of 30.2 g TAN/ kg feed-day) agrees well with the observation of
Heinsbroek and Kamstra (1990) in recirculation systems for eels, (1.3-2.3
peak/mean) and that peaks occur 4-8 hours after feeding. Similar trends
were reported by Bovendeur et al. (1987). They developed a design concept
where they considered this diel variation in waste production together with
waste removal kinetics and fish water quality requirements to determine
corresponding recirculation flow.

TAN
Excr
etio
n, g
/kg
feed
-day
66
55.0* Feeding Time
50.0-
45.0-
40.0-
35.0-
Mean = 30.2 g TAN/kg feed-day30.0-
25.0-
20.0 -
15,01200 1400 1600 1800 2000 2200 2400 200 400 600 800 1000 12001300 1500 1700 1900 2100 2300 100 300 500 700 900 1100
Time, hours
Figure 8. Diel variation in TAN excretion in System I.

Effects o f Feeding Rate
Effects on TAN, NOa-N, and DO
The TAN, N 02-N, and DO levels in the rearing tanks as affected by the
daily amount of feed are shown in Figure 9. A fixed backwashing treatment
of 30-second prop-washing and daily backwashing and consistent air supply
was maintained during this period when feeding rate was varied. Both
rearing tank TAN and N 02-N concentration were found to have close fit
exponential relationships with daily feed, while DO concentration decreased
linearly with feeding rate. The relationships can be described by the
following equations:
CTAN = 0 . 0 4 6 S e 1-5226i:’ ( r 2= 0 . 9 3 8 8 ) (8)
C ^ - O . o m ^ ( r 2= 0 .7 7 0 2 ) (9)
C q q = 7 . 4 4 8 - 1 . 0 5 9 F ( r 2=0 . 7 4 1 1 ) (10)
where:
CXAN ss rearing tank TAN concentration, mg/L;
CN02.n = rearing tank N 02-N concentration, mg/L;
CD0 = rearing tank DO concentration, mg/L; and
F = daily feed rate, kg.
Such empirical models have practical applications in predicting water quality
based simply on feeding rate, the bottom line being that all wastes in a
recirculating system originate from feed. In the equations for TAN and N 02-

0.0 0.2 0.4 0.6 0.8 1.0 1.2 1.4 1.6 1.8 2Feeding Rate, kg/day
■ Actual TAN - S - Predicted TAN E) Actual N02-N- X - Predicted N02-N + Actual DO - + - Predicted DO
Figure 9. Effects of feeding on TAN, N 02-N, and DO in System I.

69
N, of the form C = C0 ekp, the coefficient C0 can be interpreted as a baseline
concentration in mg/L when fish are not fed. The feed coefficient k (1/kg
feed) is the net rate of change in concentration with feed. For DO, with the
equation in the form CD0 = n - m F, the coefficient n represents the
maximum DO level attainable when fish are not fed at the given air supply
and system conditions, while m (mg DO/L-kg feed) represents the net
reduction rate in DO level per kg increase in amount of feed. The rates (or
slopes) are considered net because for TAN and N 02-N, they have
incorporated the effects of fish excretion and filter removal, while for DO, the
effects of oxygen consumption by fish and by biological filtration, and the air
supply and the aeration achieved by the RBC are included. To illustrate, the
estimated fish oxygen consumption ranges from 250-550 g/kg feed in the
literature (Liao and Mayo, 1974; Colt, 1991). For System I’s volume of 5.12
m3, the value obtained for m of 1.059 mg/L-kg feed is equivalent to a
reduction rate of 5.4 g DO for every additional kg of feed. Similar equations
were obtained for System II and System III. The equations will be compared,
and discussed later in more detail.
Effects on FBF P ressu re and Flow
The wide range and variability of flow through the filter are apparent
from Table 4, as well as is the change in pressure across the solid removal
filters. During the feed effects study when valve opening settings were
maintained, the bead filter exhibited a noticeable increase in pressure with

70
increased feeding rate. The relationship is shown in Figure 10. Flow through
the filter consequently decreased with the increase in pressure as shown in
Figure 11. The effect of daily feed (F in kg; up to 2 kg which is equivalent to
11.75 kg/m3 of bead media) on FBF pressure, and of pressure on bead filter
flow can be described by the following close fit linear equations:
Pebf = 5 2 . 4 7 + 1 8 . 1 8 F ( r 2=0 . 9 4 2 1 ) d D
= 2 7 1 . 1 0 1 - 1 . 3 6 7 PraF ( r 2=0 . 9 4 1 2 ) (12)
where:
Pfbp = bead filter gauge pressure, kPa;
Qfbf = flow through the bead filter; and
F = daily feed rate, kg.
Although also a function of backwashing intensity and frequency, it is
typical in pressurized granular media filters like the bead filter that
accumulated solids and bacterial buildup increases headloss, therefore,
pressure, and consequently, decreases flow (Chen and Malone, 1991).
Effects o f FBF Backwashing on System I
Effects on DO, TAN, NOa-N, and Turbidity
Table 6 shows the rearing tank DO, TAN, N 02-N, TSS and turbidity
a t 3.0 kg feed/day as affected by different backwashing treatments. Except
for turbidity, there was significant difference in DO, TAN, and N 02-N among
backwashing treatments. Mean DO was highest a t 20/1 backwashing (20-
second propeller-wash, backwashed everyday) partly because additional

FBF
Pres
sure
, kP
a ga
uge
71
85-
80-PFBF= 52.47 + 18.18 F
75- (r 2 = 0.9421)
70-
65-
60-
55-
Feeding Rate, kg/day
Figure 10. Relationship between feeding rate and bead filter pressure.

Flow
Thro
ugh
FBF,
Lpm
72
200
190
180-
170-QFBF= 271.101 -1.367 P fb f
160- (r2 = 0.9412)
150-
14055
FBF Pressure, kPa gau g e
Figure 11. Relationship between bead filter pressure and flow.

73
Table 6. Rearing tank water quality in System I as affected by backwashing.
ParameterBackwashing Treatment
P > F30/2 30/1 45/1 20/1
DO(mg/L)
X 3.77“ 3.78“ 4.92b 5.38°
0.0001se 0.120 ' 0.108 0.113 0.124
n 17 21 19 16
TAN(mg/L)
X 0.886“ 1.054b 1.017b 1.054b
0.0322se 0.045 0.041 0.043 0.047
n 17 21 19 16
n o 2-n(mg/L)
X 0.610“ 0.738" 3.126b 1.131°
0.0001se 0.135 0.121 0.127 0.139
n 17 21 19 16
Turbidity(NTU)
X 1.327“ 1.350" 1.381“ 1.228“
0.5696se 0.084 0.075 0.086 0.079
n 22 28 21 25
Notes:1. For each parameter, means followed by the same letter are not significantly different
at the 5% level.2. The backwashing treatments were as follows:
30/2: 30-second propeller-wash, backwashed every 2 days 30/1: 30-second propeller-wash, backwashed everyday 45/1: 45-second propeller-wash, backwashed everyday 20/1: 20-second propeller-wash, backwashed everyday
3. Symbols X = mean; se = standard error; n = number of observations.

74
aeration with a surface agitator was provided during this study period when
it became available. Likewise, mean DO level was higher a t 45/1
backwashing compared to 30/2 and 30/1 partly because the on-site generated
oxygen became available only in the latter part of the backwash 30/1 period.
TAN and N 02-N levels were a function of system TAN and N 02-N removal,
and will be discussed later.
Effects on TSS and TSS Capture, Sludge Removal, FBF Pressure, and Flow
The effects of backwashing treatment on rearing tank TSS, TSS
capture (determined through mass balance, i.e., from FBF flow and difference
in influent and effluent TSS concentration) and TSS removal from sludge are
shown in Table 7. Mean tank TSS was highest a t 20/1, and had highly
significant difference with other backwash treatments. TSS was lowest at
30/1 backwashing. No significant differences in TSS capture among
backwashing treatment was obtained due to the high variability of data and
limited number of observations. TSS capture was about twice higher at 63.27
g/kg feed at backwash 20/1, however, and the lowest was 23.95 g/kg feed at
45/1 backwashing. There were significant differences among the backwashing
treatments in sludge TSS removal, with the trend opposite tha t of TSS
capture. Similar to what has been observed here, Coffin (1993) has shown
that variation in backwashing frequency, which govern solids retention time,
leads to a change in solids production rate as well as accumulation in a
recirculating system.

75
Table 7. Effects of backwashing treatment on TSS and TSS capture, sludge TSS removal, and FBF pressure and flow in System I.
ParameterBackwashing Treatment
P > F30/2 30/1 45/1 20/1
TSS
X 5.102ab 3.662“ 7.975bc 10.775°
0.0006se 0.881 0.881 1.079 1.079
n 6 6 4 4
TSS Capture (g/kg feed)
X 33.391“ 32.538“ 23.953“ 63.265"
0.3844se 13.658 13.658 16.727 16.727
n 6 6 4 4
Sludge TSS Removal
(g/kg feed)
X 115.48“ 174.85b 172.80b 57.39°
0.0001se 9.15 8.47 11.20 11.20
n 6 7 4 4
Pressure(kPa)
X 132.16“ 90.91b 106.65° 179.62d
0.0001se 3.52 3.16 3.33 3.62
n 17 21 19 16
Q fbf(Lpm)
X 122.79“ 128.85“ 126.69" 86.22b
0.0001se 3.18 2.86 3.01 3.28
n 17 21 19 16
Q rbc(Lpm)
X 65.90“ 66.81“ 65.42“ 49.8 l b
0.0001se 1.88 1.69 1.78 1.94
n 17 21 19 16
Notes:1. Means followed by the same letter are not significantly different at the 5% level.2. Symbols X = mean; se = standard error; n = number of observations.

76
The effects on FBF pressure and flow are also shown in Table 7. An
attempt was made to maintain the same flow as much as possible by
adjusting valve settings, thus, there were no significant differences in flow
among backwash treatments 30/2, 30/1, and 45/1. Flow through the bead
filter (hence, also the EBC) was significantly reduced a t backwash 20/1,
however, and the bead filter operated at significantly different pressures at
each backwash treatment. With careful monitoring, the bead filter was
operated at pressures much higher than the manufacturer recommended
maximum of 100 kPa (15 psi) at backwash 30/2 and 20/1 without any
noticeable problems. This aspect alone shows tha t the above backwashing
regimes are insufficient, and this is further supported by later discussions.
Note that for a laboratory scale propeller-washed bead filter, Chitta (1993)
reported that backwashing up to every 2 days worked well up to a feed
loading of 24 kg/m3 of bead media with good TAN and N 02-N removal, and
without apparent pressure problems. Here, the daily feeding rate of 3 kg is
equivalent to a feed load of only 18 kg/m3 of beads. This raises the question
tha t there must be a significant difference in the intensity of bead agitation
achieved in laboratory scale (Chitta used 6 seconds propeller agitation for a
1.42 liter bead volume) that cannot compare with results obtained in an
actual filter.
The pattern of effects of backwashing intensity and frequency can
clearly be seen in Figure 12. As backwashing intensity (propeller agitation)

77
30/2 30/1Backwashing Treatment
H Pressure, kPa ^ FBF Flow, LpmBS3 TSS Capture, g/kg feed E3 TSS Removal, g/kg feed
Figure 12. Effects of backwashing on bead filter pressure, flow, and TSS removal.

78
and frequency increases, pressure and TSS capture decreases, however,
resulting in an increase in sludge TSS removal. The highest average TSS
capture (63.3 g/kg feed) was observed at backwash 20/1. However, bead
agitation was insufficient a t this intensity which resulted in the lowest sludge
TSS removal. Because of solids accumulation in the filter, which is also
evidenced by high bead filter pressure, flow is greatly reduced. With more
flow bypassing the filter, the system consequently accumulates solids. This
is confirmed by the highest rearing tank TSS observed at 20/1 backwashing.
Across the FBF, however, a larger drop in TSS resulted, which is why TSS
capture was higher. Backwash 30/2 was also inadequate and resulted in high
FBF pressures. By personal observation of the nature of the sludge removed
at 20/1, however, gelling is strongly suspected. This is probable because 20
seconds of propeller agitation was merely sufficient to move the beads without
thorough mixing. In general, the sludge TSS removal rates obtained conform
with observations by Chen et al. (1991) of 10-25 percent of the weight of feed.
For a bubble-washed bead filter, Chen et al. (1993) reported a sludge harvest
rate of 12.4 percent or 124 g TSS/kg feed. Best solid removal performance
(sludge TSS removal of 174.85 g/kg feed) was achieved a t backwash 30/1,
which had slightly better but not significantly different TSS capture and
removal than 45/1. The TSS level in the rearing tank was also the lowest
a t 30/1 backwashing. The amount of TSS removed is much less than the
excretion rate of about 500 g/kg feed (Colt, 1991). However, TSS did not

79
accumulate in the system, suggesting substantial sludge stabilization and
heterotrophic activity in the bead filter. The above observations also have
ramifications on the TAN and N 02-N removal performance and DO
consumption of the bead filter, and therefore, the FBF-RBC combination.
Effects on System P erform ance
The effects of backwashing treatment on the TAN and N 02-N removal
of the FBF-RBC combination, the FBF, and the RBC are shown in Table 8.
There were significant differences in TAN removal but not N 02-N removal by
the combination (system), the bead filter, and the RBC among the
backwashing treatments.
High overall or system TAN removal rates were obtained a t 30/1 and
20/1 backwashing, where the respective values of 51.83 and 53.62 g TAN/day
were not significantly different. With no significant differences in system
N 02-N removal among backwashing treatment, the system removal capacity
may be estimated as 50 g TAN or N 02-N per day. System per pass TAN and
N 02-N removal efficiencies (percent of influent loading) were significantly
different, with highest mean values for TAN of 44.2 percent and N 02-N of
37.9 percent obtained a t 20/1 and 30/2 backwashing, respectively (Table 8).
As will be noted from later discussions, these values are associated with the
TAN and N 02-N removal performance of the FBF and the RBC and how they
are affected by backwashing.
The average TAN excretion rate was determined from the diel study
as 30 g TAN/kg feed-day. With a system removal rate of 50 g TAN/day, it

80
Table 8. Effects of backwashing treatment on TAN and N 02-N removal in System I.
ParameterBackwashing Treatment
P > F30/2 30/1 45/1 20/1
TotalTAN
Removal(g/day)
X 43.08* 51.83b 43.06* 53.62b
0.0087se 2.77 2.50 2.774 2.86
n 17 21 17 16
TotalNOj-N
Removal(g/day)
X 57.26* 54.69* 61.27* 60.21*
0.6596se 4.27 3.88 4.27 4.41
n 17 21 17 16
System TAN Removal
Efficiency (%)
X 27.94* 27.01*b 23.28b 44.19*
0.0001se 1.63 1.47 1.63 1.68
n 17 21 17 16
System NOa-N Removal
Efficiency (%)
X 37.89* 29.88b 10.63* 33.84*b
0.0001se 1.91 1.72 1.91 1.97
n 17 21 17 16
FBF TAN Removal (g/day)
X -11.26* 12.65b 7.60b 31.60*
0.0001se 3.92 3.52 3.92 4.04
n 17 21 17 16
RBC TAN Removal (g/day)
X 54.27* 39.17b 35.45b 22.02'
0.0001se 2.60 2.34 2.60 2.68
n 17 21 17 16
FBF N 0 2-N Removal (g/day)
X -21.91* -17.75* -11.39* -10.27*
0.2361se 4.55 4.09 4.55 4.69
n 17 21 17 16
RBC NOa-N Removal (g/day)
X 79.17* 72.44* 72.66* 70.48*
0.3402se 3.54 3.18 3.54 3.65
n 17 21 17 16
Notes: 1. Means followed by the same letter are not significantly different at the 5% level.2. Negative removal means a net gain.3, Symbols X s mean; se = standard error; n = number of observations.

81
would seem that the present FBF-RBC combination can only handle the
waste produced by about 2 kg feed/day. Obviously, a t the present feeding
rate of 3 kg/day, the system was able to maintain good water quality (average
of 0.87 mg TAN/L and 1.12 mg N 02-N/L for all backwashing treatments).
For highly tolerant fish like tilapia, the system can in fact be expected to
handle a higher feed load. The removal rate of 50 g TAN/day from 3 kg feed
amounts to 17 g TAN/kg feed, which interestingly corresponds closely to the
excretion rate of about 20 g TAN/kg feed a t 900 hours, obtained during the
diel study (see Figure 8). This observation highlights the limitation of
instantaneous performance (mass-balance) measurements, results of which
depend highly on the time of observation. This limitation had been
recognized by Heinsbroek and Kamstra (1990) who, however, commended the
practical importance of such approach.
Effects on Bead F ilter and RBC Perform ance
TAN but not N 02-N removal rates of the bead filter and the RBC were
significantly affected by backwashing treatm ent as can be seen in Table 8.
Actually, there was net N 02-N production rather than removal across the
bead filter in all treatments. Per pass TAN removal efficiency of both the
FBF and the RBC were significantly different among backwashing treatments
as can be seen in Table 9. In general, the nitrification performance of the
bead filter in the combination was highly variable. Values of mean coefficient
of variation (standard deviation/mean) of all TAN removal and NOz-N

82
Table 9. Bead filter and RBC removal efficiency, and DO removal a t different backwashing treatments.
ParameterBackwashing Treatment
P > F30/2 30/1 45/1 20/1
FBF TAN Removal
Efficiency (%)
X -7.69“ 6.92b 3.28b 25.24c
0.0001se 2.70 2.43 2.55 2.78
n 17 21 19 16
FBF N 02-N Removal
Efficiency (%)
X -29.32" -11.96b -3.77b -7.20b
0.0007se 4.53 4.07 4.28 4.67
n 17 21 19 16
RBC TAN Removal
Efficiency (%)
X 61.82" 41.5 l b 38.42b 39.034b
0.0001se 1.90 1.71 1.79 1.96
n 17 21 19 16
RBC N 02-N Removal
Efficiency (%)
X 67.53" 58.61b 22.82c 58.44b
0.0001se 1.90 1.71 1.79 1.96
n 17 21 19 16
FBF DO Removal (g/day)
X 314.91* 336.40* 372.95b 433.04c
0.0001se 16.91 15.22 16.00 17.43
n 17 21 19 16
RBC DO Removal (g/day)
X -253.34" -250.99“ -206.78“ -227.02“
0.0400se 11.61 10.45 10.99 11.97
n 17 21 17 16
Notes: 1. Means followed by the same letter are not significantly different at the 5% level.2. Negative removal means a net gain.3. Symbols X = mean; se = standard error; n = number of observations.

83
production were 122 and 128 percent, respectively. In systems employing the
bead filter alone, intermittent performance were also reported by Chitta
(1993), Westerman et al. (1993), and Wimberly (1990). The best nitrification
performance of the bead filter with the highest mean TAN removal of 31.6
g/day (0.17 g/m2-day or 177.9 g/m3-day) at 25.2 percent efficiency, and the
least N 02-N production of 10.3 g/day was recorded a t backwash 20/1. The
worst was a mean production of 11.3 g TAN and 21.9 g N 02-N/day at 30/2
backwashing. Intermediate performance was recorded at 30/1 and 45/1
backwashing. The FBF TAN removal value was much lower compared to its
TAN removal rate when operated alone as was observed in other studies. For
example, for hydraulic washed bead filters, a t an optimal 8 backwashes per
day, Wimberly (1990) showed that the FBF can have a TAN removal rate of
nearly 0.350 g/m2-day or 430 g/m3- day, a t an estimated average removal
efficiency of 25 percent. On the other hand, Malone and Coffin (1991)
reported a value of 0.291 mg/m2-day or 308 g/m3-day for a propeller-washed
filter. At a hydraulic flux rate of 204 Lpm/m2 and with backwashing every
two days, Chitta (1993) obtained an average TAN removal rate of about 0.312
g/m2-day or 326 g/m3-day a t an average per pass removal efficiency of 26.5
percent.
Chitta (1993) demonstrated that in an experimental propeller-washed
bead filter, the rate of TAN oxidation increases with a decrease in
backwashing frequency, an aspect he attributed to longer sludge and bacterial

84
residence time. However, TAN removal rates increased only up to a certain
period, with peaks occurring a t about 1.5 days of sludge retention, after
which, inhibition of nitrification takes place due to the accumulation of
organic solids and increased heterotrophic activity. This must have been
happening a t 30/2 backwashing where net TAN production as observed. On
the other hand, while there was least solids removal and solids accumulation
was worst a t backwash 20/1, bead filter nitrification was the best, which is
contrary to the above relationships. It is believed tha t 20 seconds propeller
agitation is gentle enough to allow longer cell residence, but as mentioned
earlier, not vigorous enough to completely mix the beads and the solids
captured, that gelling occurs. Hence, the very low sludge harvest. When this
happens and heterotrophic activity is concentrated in the gel mass, the beads
will be mostly nitrifying. Something similar was observed with the sand
filter which handled most of the nitrification in System III despite
channelization and gelling.
N 02-N removal rates were all negative, meaning in all backwashing
treatments, the bead filter had a net production of N 02-N, suggesting that the
bead filter is unable to support a good Nitrobacter population. Mean N 02-N
production ranging from 10.3-21.9 g/day (0.058-0.123 g/m2-day) was obtained.
Observed N 02-N production instead of removal is a stark contrast to the N 02-
N removal of 0.444 g/m2-day or 465 mg/m3-day at 26 percent removal
efficiency obtained by Chitta (1993) for a laboratory-scale propeller washed

85
bead filter. Westerman et al. (1993), however, obtained comparable results
with this study in a full-scale intensive tilapia production facility employing
two bead filters, where mean N 02-N production as high as 23.2 g/day can be
computed from their data. As a result of which they had high rearing tank
N 02-N levels of up to about 16 mg/L. Table 8 also demonstrates tha t N 02-N
production from the bead filter generally exceeded the amount of TAN
removed. With the low and highly variable FBF effluent DO (2.17±0.66
mg/L), it is probable that N 02-N is produced by denitrification in anaerobic
layers or pockets in the bead filter.
The TAN removal performance of the RBC was significantly different
among backwashing treatments (Table 8), however, N 02-N removal was not.
There were also significant differences in TAN and N 02-N per pass removal
efficiencies among backwash treatments (Table 9). The highest mean TAN
and N 02-N removal rates of 54.3 and 79.2 g/day (equivalent to 0.275 and
0.402 g/m2-day), respectively, were recorded at 30/2 backwashing. Respective
per pass removal efficiencies were 61.8 and 67.5 percent. With a mean flow
of 65.9 Lpm, mean water retention time in the RBC tank (volume = 1.41 m3)
was 21.4 minutes a t this backwashing treatment. Regardless of the
backwashing treatment, the RBC was very stable in removing N 02-N (more
than 70 g N 02-day or 0.355 g/m2-day) suggesting a well established
Nitrobacter population. This may be expected in a serial filter arrangement
when the prior filter has TAN removal ability. The performance of the RBC

86
in the combination both in terms of TAN and N 02-N removal compare
reasonably well with results from other studies, even if different RBC media
were employed. For example, in a full-scale system stocked with hybrid
tilapia, Westerman et al. (1993) reported for the RBC a TAN removal rate of
0.250 g/m2-day a t 67 percent efficiency. From their data, N 02-N removal was
computed as 0.483 mg/m2-day at 59 percent efficiency.
Changes in the performance of the RBC was not due to the
backwashing treatment per se, but specifically on the effect it had on the
bead filter. As demonstrated by the results of the comparisons in Table 8,
RBC TAN removal performance improved with a decline in bead filter
performance, showing that its performance was compensatory, removing
whatever TAN and/or N 02-N that is not handled or produced by the bead
filter. A scatter plot (Figure 13) of all FBF TAN removal rates and
corresponding RBC TAN removal rates clearly shows this trend. A similar
but less notable trend for N 02-N removal can be seen in Figure 14. The
relationships may be described by the following linear equations:
R B C t a n = 4 3 .7 5 5 - 0 .587 F B F TM f (r2 = 0 .7 01 8 ) (13)
= 6 8 .7 1 0 - 0 . 345F£FMji_n ( r 2 = 0 .2 7 52 ) (14)
where:
RBCtan = RBC TAN removal, g/day;
FBFN02.N = bead filter TAN removal, g/day;

RBC
TAN
Rem
oval
, g/
day
87
60-RBCtan = 43-755 - 0.587 FBFTAn
50- (r2 =0.7018)
40-
4 ■30-
20-
10-
FBF TAN Removal, g/day
Figure 13. Relationship between bead filter and RBC TAN removal.

RBC
N02-
N Re
mov
al,
g/da
y
88
130
120-
110-
100-
90-
80-
70-RBCN02.n = 68.170 - 0.345 FBFN02.
60-
50-
40-
FBF N02-N Removal, g/day
Figure 14. Relationship between bead filter and RBC N 02-N removal.

89
RBCW n = RBC N 02-N removal, g/day; and
FBFN02.N = bead filter N 02-N removal, g/day.
There was good correlation between RBC and bead filter TAN removal. The
slope in Equation 13 implies that TAN removal by the RBC decreases by
0.587 g/day for every g/day increase in bead filter TAN removal. Much lower
correlation was obtained with N 02-N removal mainly because N 02-N removal
was mostly accomplished by the RBC. This is apparent in Figure 14 where
majority of the data points for bead filter N 02-N removal are less than zero.
As previously indicated, different backwashing treatments caused changes in
flow through the bead filter and its performance. This also caused changes
in TAN and N 02-N loading to the RBC, which in turn affected its removal
rate.
DO dropped by an average of 2.25±0.78 mg/L across the bead filter.
This was offset by an average DO increase of 2.62±0.62 mg/L through the
RBC. There were significant differences in total oxygen consumed (DO
removal) across the bead filter as well as the RBC (the RBC provided
aeration, hence, removal values were negative) among the backwashing
treatments as can be seen in Table 9. The highest oxygen consumption
across the bead filter of433 g/day (2.43 g/m2-day or 2.55 kg /m3 of media per
day) occurred at 20/1 backwashing when it also exhibited the highest TAN
removal rate of 31.6 g/day. Lowest DO consumption in the FBF of 315 g/day
also corresponded to its lowest removal of-11.3 TAN g/day (negative, meaning

90
production) a t backwash 30/2. DO removal in the bead filter in all cases was
higher than the aeration rate (207-251 g/day or 1.05-1.27 g/m2-day) provided
by the RBC.
In general, bead filter DO consumption was higher than the
stoichiometric consumption (4.57 g DO/ g TAN converted to N 03-N) that is
estimated due to nitrification. For example, for data a t 20/1 backwashing the
oxygen consumption due to nitrification can be estimated as 144 g/day which
is only approximately 33 percent of the actual mean DO consumption of 433
g/day across the bead filter. This is further indication tha t there is a high
organic oxygen demand and heterotrophic activity in the bead filter, similar
to what Chitta (1993) and Malone et al. (1993) had observed.
Im plications on System D esign an d O peration
The study showed the ability of the bead filter and the RBC
combination to maintain favorable water quality, attaining practically
complete TAN and N 02-N removal a t a feed load of 3 kg feed/day. Overall
mean concentrations of 0..87 mg TAN/L and 1.10 mg N 02-N/L were
maintained in the rearing tank. Equations 8, 9, and 10 were obtained
relating TAN, N 02-N, and DO with daily amount of feed, respectively, which
should be useful in predicting these parameters for a particular feeding rate
and set of operating conditions. Likewise, Equations 11 and 12 relating bead
filter pressure with feed, and flow with pressure, respectively, can provide a
quick estimate of this important operational conditions.

91
Performance of the filters has been shown to be affected by the bead
filter backwashing process. In the range of backwashing treatments studied,
there were no problems with TAN, N 02-N, and TSS accumulation in the
system. However, problems with solids accumulation, pressure build-up, and
impeded flow through the bead filter occurred when backwashing was
insufficient. Additional tank aeration must also be ensured because the bead
filter DO consumption of 1.8-2.4 g/m2-day (1.9-2.5 kg/m3 beads per day) which
was higher than the RBC’s aeration capacity of 1.0-1.3 g/m2-day, resulted to
a net DO consumption across the filter combination of 80-206 g/day or 27-69
g DO/kg feed per day. DO dropped by an average of 2.25±0.78 mg/L across
the bead filter.
The bead filter contributed to system TAN removal but this was greatly
affected by backwashing. Its nitrification performance proved considerably
much lower compared to reported values when utilized solely, and in all
instances, it generated a mean N 02-N load to the system. In the filter
combination, therefore, the bead filter functioned primarily as a solids
capture device, while the RBC performed bulk of the nitrification. The
results suggest substantial sludge stabilization and heterotrophic activity in
the bead filter which resulted to its low TAN removal, N 02-N production, and
additional DO consumption. TAN and N 02-N removal of the RBC was shown
to be affected by the performance of the bead filter. The relationships were
described by Equations 13 and 14. Among the backwashing treatments

92
studied, the best option was 30-second propeller agitation with daily
backwashing, considering the overall effects on system nitrification, rearing
tank water quality, and operational conditions particularly recirculation flow
and operating bead filter pressure. For the present feed loading of 3 kg/day
(18 kg/m3-day), 30-second agitation proved optimum in still gaining TAN
removal in the bead filter, while a t the same time obtaining highest sludge
TSS harvest equivalent to 175 g/kg feed, or 1.03 kg/m3 of media per day. The
system removal capacity is estimated to be 50 g TAN or N 02-N per day, with
a per pass removal efficiency of 30 percent of system loading, a t a mean
recirculation flow rate of 129 Lpm. At this recommended backwashing
procedure, the mean areal TAN removal for the bead filter was 0.071 g/m2-
day (75 g/m3-day) with a per pass removal efficiency of 6.9 percent, a t a mean
hydraulic flux rate (flow per unit area of filter cross section) of 280 Lpm/m2.
A mean NOa-N production of 0.100 g/m2-day (104 g/m3-day) resulted from the
bead filter.
The range of mean bead filter TAN removal and N 02-N production
were -0.063-0.178 g TAN/m2-day and 0.058-0.123 g N 02-N/m2-day,
respectively. The range of mean RBC areal removal rate was 0.199-0.275 g
TAN/m2-day at 38-62 percent per pass removal efficiency. Areal N 02-N
removal rate was fairly consistent a t 0.370 g N 02-N/m2-day, however, a t
varying efficiencies of 23-68 percent. Attained flow rates through the RBC
resulted to hydraulic retention times of 21-28 minutes.
93
SYSTEM II: TUBE SETTLER-RBC COMBINATION
General System Conditions
The daily changes in rearing tank temperature, pH, DO, TAN, and
N 02-N in System III are shown in Figure 15. The settler tank leaked on day
184, and had to be bypassed overnight resulting to the poor water quality for
a few days thereafter. The water quality and operational conditions
throughout the study for System II are summarized in Table 10. The rearing
tank water quality tend to fluctuate according to the flushing schedule, with
TAN and N 02-N generally higher prior to flushing and lower the day after.
This can be explained by the combined effects of dilution (16.8 percent of the
system volume was replaced only during flushing days) and sludge removal,
therefore, reduced sludge decay which contributes to the TAN and N 02-N
load as will be shown later. The raw data for System II are tabulated in
Appendix B. Despite the wide range of variation, mean water quality values
were generally at desirable levels. As with System I, the feeding rate was
increased from 2 kg/day to 3 kg/day at day 115. It took a period of 44 days
until the system restabilized by day 159, more than three times longer than
it took System I. A plausible reason is that there is 31 percent less total
media surface (for biofiltration) in the tube settler-RBC combination (259.5
m2) of System II than the FBF-RBC combination (375 m2) in System I.
Another reason is that the flushing procedure of the tube settler itself
represented a considerable disturbance every 2 days. The whole process
entailed stopping the system for at least 40 minutes to shake and remove the

Temperature, °C -°-D0, mg/L + p H -°-TAN, mg/L + N02-N, mg/L
A------------ Flushed every 3 days ► A---------------- Flushed every 2 days ►Increasing feed rate ----- — 2 kg/day ► A--------------3 k g /day ---------------------►
0 25 5 0 75 100 125 150 175 20 0Days Since Stocking
Figure 15. Daily variations in water quality in System II.
Tem
pera
ture
,

95
Table 10. Water quality and operational conditions in System II.
Parameter Range Mean s.d. n
Temperature, °C 24.8-30.3 27.9 1.1 165
DO/mg/L 4.0-7.8 5.5 1.0 165
pH 7.18-8.58 7.90 0.34 165
Alkalinity, mg CaCOg/L 89-218 161 40 26TAN, mg/L 0.02-2.68 1.01 0.52 165
N 02-N, mg/L 0.006-5.600 1.154. 1.408 165NOs-N, mg/L 7.6-131.0 52.1 35.8 10
TSS, mg/L 1.8-9.7 5.8 2.7 18Turbidity, NTU 0.2-3.2 2.2 0.6 69
Q ts, Lpm 121.5-203.3 136.1 11.5 72
Qubc, Lpm 64.8-95.0 75.4 7.0 72
96
Bio Strata media, chlorinate the sludge (done to sludge in all systems as a
legal requirement for growing the exotic fish to ensure tha t no live tilapia
eggs or fry escape from the systems), drain the settler tank, washdown
leftover sludge and ensure negligible residual chlorine (this process required
an estimated 300 L water), replace the media, and refill. Without the need
for chlorination, the process should take at least 25 minutes. Clearly,
however, the process of flushing the tube settler is a big disadvantage
compared with backwashing of the bead filter in System I.
There was no flow control problems in System II unlike in System I
where pressure build-up due to sludge accumulation reduced recirculation
rates. Mean recirculation flow rates were comparable but was more variable
in System I (128.57±0.50 in System II compared to 125.92±5.62 in System I).
Note that water simply flowed by gravity from the rearing tank into the tube
settler in System II. During the initial phases of the study, faster recirculation
rates were possible (up to 200 Lpm). Increased sludge production a t higher
feeding rates, however, resulted to increased head loss and impeded gravity
flow, and resulted to a lower water level in the tube settler during operation.
Since the pump draws water from above the settler media, pumping a t higher
flow rates than were maintained results to the pump sucking air. Flows
higher than about 140 Lpm also tend to stir the accumulated sludge resulting
to more sludge floating. Combined with low water level, this resulted to sludge
recirculating in the system.

97
Effects o f Feeding Rate on TAN, NOa-N and DO
The response of System II in terms of rearing tank quality to changes
in amount of daily feed is similar to tha t of System I as shown in Figure 16.
Good fit exponential relationships between feeding rate and TAN and N 02-N,
and a linear relationship between feeding rate and DO were obtained as
follows:
CTAlf o 0 .041 .4 e 1-7120f’ ( r 2=0 . 9 3 1 8 ) (15)
CwQj-n = 0 . 0 1 5 0 s 1-5423 F ( r 2=0 . 7 0 6 8 ) (16)
Cjjq = 7 .91 9 - 1 . 1 6 9 F ( r 2=0 . 7 7 6 9 ) (17)
where:
CTAN = rearing tank TAN concentration, mg/L;
CN02.n = rearing tank N 02-N concentration, mg/L;
CD0 = rearing tank DO concentration, mg/L; and
F ss daily feed rate, kg.
I t will be shown later that similar equations were obtained for System III.
Comparisons among the three systems are presented later.
System Perform ance and Comparisons w ith System I
R earing Tank and Operational Conditions
Data for System II during the stable period of operation from day 159-
184 were used in the comparisons with System I operated a t the recommended
30-second propeller agitation and daily backwash (30/1). Mean water quality

TAN
or N
02-N
, m
g/L
98
0.0 0.2 0.4 0.6 0.8 1.0 1.2 1.4 1.6 1.8 2.0Feeding Rate, kg/day
■ Actual TAN -O- Predicted TAN El Actual N02-N-X - Predicted N02-N ■+• Actual DO —t— Predicted DO
Figure 16. Effects of feeding on TAN, N 02-N, and DO in System n .DO
, m
g/L

99
conditions are summarized in Table 11. Mean DO was higher and mean
temperature was lower in System II than System I, which may be explained
by the open configuration the tube settler in System II. A slight increase (0.1
°C) in temperature across the bead filter was observed while there was no
change in temperature across the tube settler. A mean DO drop (influent DO
minus effluent DO) of 1.89±0.18 mg/L was recorded across the bead filter in
System I which was more than three times the DO drop of 0.61±0.17 across
the tube settler. With comparable flow rates, there is more DO consumption
across the bead filter than the tube settler. This is further discussed when
individual filter performance is compared.
The mean TSS level of 7.99 mg/L in System II was more than twice as
high as the 3.66 mg TSS/L in System I, a highly significant difference, but
should still be no cause for concern. The literature is not clear on the safe
upper limits for suspended solids, although the observed values here are much
lower than the recommended limit of 20-40 mg/L cited by Muir (1982).
Turbidity was likewise higher in System II (2.40 NTU), nearly twice as high
as tha t of System I (1.34 NTU).
Mean TAN level in the rearing tank in System II was significantly
higher a t 1.30 mg/L compared to 1.05 mg/L in System I. N 02-N levels were
not significantly different at about 0.73 mg/L. There were no significant
differences between pH and alkalinity between the two systems. In both
systems, mean recirculation flow rate was 129 Lpm (through the solids
removal filter), and mean flow through the RBC was 66 Lpm.

100
Table 11. Rearing tank water quality in System II compared with System I a t a feeding rate of 3.0 kg/day.
ParameterSystem
I IIP > F
Temperature(°C)
X 30.82* 28.26b
se 0.13 0.13 0.0001n 30 30
DO(mg/L)
X 3.78* 4.40b
se 0.09 0.10 0.0001n 21 17
X 7.43* 7.43*
pH se 0.03 0.03 0.9885n 30 30
Alkalinity (mg CaCOa/L)
X 154* 148*
se 9.87 9.87 0.6749n 30 30
TAN(mg/L)
X 1.05* 1.30b
se 0.04 0.04 0.0001n 21 17
NOa-N(mg/L)
X 0.738* 0.724*
se 0.059 0.066 0.8817n 21 17
TSS(mg/L)
X 3.66* 7.99b
se 0.62 0.50 0.0001n 6 9
Turbidity(NTU)
X 1.34* 2.40b
se 0.05 0.05 0.0001n 29 27
Notes: 1. Means followed by the same letter are not significantly different at the 5% level.2. Symbols X = mean; se = standard error; n = number of observations.

101
System TAN an d NOa-N Rem oval
The performance of System I compared with System II is presented in
Table 12. Per pass removal efficiencies of individual filters are shown in Table
13. TAN and N 02-N removal rates across the tube settler-RBC combination
in System II (50 g/day) were lower but not significantly different with tha t of
the bead filter-RBC combination in System I. The percentage per pass TAN
and N 02-N removal efficiency in System II of 22.5 and 15.4 percent,
respectively, were significantly lower compared to the respective removal
efficiencies of 27.0 and 29.9 percent in System I. Based on the total amount
of TAN and N 02-N removed, and the rearing tank concentration of TAN and
N 02-N in System I, however, it is clear that the tube-settler-RBC combination
can adequately handle 3 kg feed/day.
Tube Settler and RBC Perform ance
Table 12 also shows the individual TAN and N 02-N removal of the tube
settler and the RBC in System I. Table 13 presents the individual per pass
filter removal efficiency, and DO and TSS removal. Unlike the bead filter,
there was a net production of TAN across the tube settler, suggesting tha t
sludge decomposition is also taking place. The TAN production of 10.01 g/day
(equivalent to 0.160 g/m2 media surface per day) represented an additional 3.89
percent of the influent TAN load. The tube settler’s total N 02-N production
rate of 20.28 g/day was higher but not significantly different from the bead
filter rate of 17.75 g/day. Both represented an added production of more than

102
Table 12. TAN and NOa-N removal in System II compared with System I at a feeding rate of 3.0 kg/day.
ParameterSystem
P > FI II
System TAN Removal (g/day)
X 51.83* 48.91*
0.4785se 3.47 2.18
n 21 53
System N 0 2-N Removal (g/day)
X 64.69* 49.53*
0.4029se 5.18 3.26
n 21 53
System TAN Removal Efficiency
(%)
X 27.01* 22.44b
0.0250se 1.69 1.06
n 21 53
System N 0 2-N Removal Efficiency
(%)
X 29.88* 15.37b
0.0001se 2.36 1.48
n 21 53
Solid Filter TAN Removal
(g/day)
X 12.65* -10.06b
0.0001se 4.03 2.53
n 21 53
Solid Filter N 0 2-N Removal
(g/day)
X -17.75* -20.28*
0.7045se 5.639 3.54
n 21 53
RBC TAN Removal
(g/day)
X 39.17* 59.97b
0.0001se 2.33 1.47
n 21 53
RBC N 02-N Removal
(g/day)
X 72.44* 69.82*
0.4935se 3.22 2.03
n 21 53
Notea: 1. Means followed by the same letter are not significantly different at the 6% level,2. Symbols X = mean; se s standard error; n a number of observations,

103
Table 13. Filter TAN and N 02-N removal efficiency, DO removal, and TSS removal in System II compared with System I a t a feeding rate of 3.0 kg/day.
ParameterSystem
P > FI II
Solid Filter TAN Removal
Efficiency (%)
X 6.92“ -3.89b
0.0001se 1.47 0.94
n 21 52
Solid Filter N 02-N Removal
Efficiency (%)
X -11.96“ -11.38“
0.8970se 3.79 2.41
n 21 52
RBC TAN Removal
Efficiency (%)
X 41.51* 47.15b
0.0314se 2.17 1.38
n 21 52
RBC N 02-N Removal
Efficiency (%)
X 58.61* 31.49b
0.0001se 3.75 2.38n 21 52
Solid Filter DO Removal
(g/m2-day)
X 1.89“ 1.67“
0.1048se 0.11 0.07
n 21 52
RBC DO Removal
(g/m2-day)
X -1.27“ -0.60b
0.0001se 0.03 0.02
n 21 52
Sludge TSS Removal
(g/kg feed)
X 174.85* 249.88b
0.0006se 12.86 11.33
n 9 7
Notea: 1. Means followed by the same letter are not significantly different at the 5% level,2. Symbols X = mean; Be = standard error; n = number of observations.

104
11 percent of the filter N 02-N load. This shows that like in the bead filter,
denitrification is taking place in the tube settler. Bovendeur, et. al (1987) had
similar observations in a Lamella settler, and found that denitrification
accounted for 40-80 percent removal of the nitrate produced depending on the
frequency of cleaning of the Lamella separator.
The tube settler provided exemplary solids removal a t a feed loading of
3 kg/day. The settler was flushed every two days, which proved appropriate
a t this feeding level. At the low feeding level of 2 kg/day, flushing after 3 days
was also sufficient, so it is recommended to flush the filter after the equivalent
of 6 kg feed which is equivalent to 13.23 kg feed/m3 of media. The average
flow through the tube settler was 128.57±0.50 Lpm, equivalent to an overflow
rate of 119.5 m3/m2-day (2 gpm/ft2). For the settler filled tank volume of 0.98
m3, the flow rate provided a hydraulic retention time of 7.65 minutes. This
was lower than the overflow rate of 177 m3/m2-day (3 gpm/ft2) a t longer the
retention time of 10 minutes for Biodek media as reported by Libey (1993).
Libey (1993) reported an average overall per pass removal efficiency of 56
percent, unlike in this study where settler effluent TSS concentrations were
generally higher than influent concentrations (negative TSS capture) and
cannot be used as measure of performance. This happened because the TSS
was concentrated across the settler but not completely trapped. Lighter and
floating solids get included in the effluent sample. The mean sludge TSS
harvest (249.9 g dry solids/kg feed) of the tube settler was very good and was

43 percent higher than that of the bead filter, a highly significant difference.
The tube settler’s sludge harvest rate is nearly 50 percent of the TSS waste
excretion of430-520 g/kg feed reported in the literature (Wimberly, 1990; Colt,
1991; Liao and Mayo, 1974). Unlike with the bead filter, this high harvest rate
was due to the complete removal of collected sludge (except for those attached
or trapped in the tube media) that ensued from the flushing procedure
followed. Nevertheless, rearing tank TSS in System II was higher, suggesting
more sludge activity in the bead filter. The range of sludge harvest of the tube
settler of 179-300 g dry solids/kg feed compares very well with the range of 44-
380 g/kg reported by McLaughlin (1981) and Mudrak (1981) in linear concrete
clarifiers and Lamellar settlers used in trout raceway effluent. At the feeding
rate of 3 kg/day, the TSS harvest rate is equivalent to 1.65 kg/m3 of media per
day.
TAN removal rate (60 g/day or 0.305 g/m2-day) and per pass removal
efficiency (47.15 percent) of the RBC in System II was significantly higher
compared to that in System I. N 02-N removal (69.8 g/day or 0.354 g/m2-day)
was lower but not significantly different with tha t in System I. N 02-N
removal efficiency was significantly lower at 31.5 percent. Similar to what was
observed in System I, however, RBC TAN and N 02-N removal performance
were compensatory. This pattern is evident in the scatter plots relating the
tube settler’s and the RBC’s TAN and N 02-N removal in Figures 17 and 18,
respectively. As earlier demonstrated with the bead filter and RBC in System

RBC
TAN
Rem
oval
, g/
day
106
R B C t a n = 54.694 - 0.413 T S Ta n
60 -50 -40 -30 -20 -10 0 10 20 30Settler TAN Removal, g/day
Figure 17. Relationship between tube settler and RBC TAN removal.

RBC
N02-
N R
emov
al
107
130
120-
110-
100*
90-
80-
70-
60-
RBQ,02-n — 63.966 - 0.286 TS jjo2-n50-
40- (r2 = 0.2014)
30-
-100 -80 -60Settler
-20 0 Settler N02-N Removal, g/day
Figure 18. Relationship between tube settler and RBC N 02-N removal.

108
I, the TAN and N 02-N removal rate of the RBC decreases with a decrease in
production rate or increase in removal rate by the tube settler. The following
equations describe the relationship for System II:
RBC tan = 54 .694 - 0 . 4 1 3 rsrTAW (r 2 = 0 .3962 ) (18)
R B C ^ - i i = 63 .966 - 0 . 2 8 6 1 ^ ^ ( r2 = 0 .2014 ) (19)
where:
RBCtan = RBC TAN removal, g/day;
TSN02.N = tube settler TAN removal, g/day;
RBCN02.n = RBC N0 2-N removal, g/day; and
TSN02.N = tube settler N 02-N removal, g/day.
It is evident from Figures 17 and 18 that for most part, the tube settler had
net TAN and N 02-N production, and the RBC was predominately responsible
for nitrification in System Q. This should explain the differences with System
I, and also the low correlation between tube settler and RBC removal rates.
I t is interesting to note from Table 13 tha t there was no significant
difference in the areal DO removal rate of the tube settler (1.67 g/m2-day) and
the bead filter (1.89 g/m2-day) even though the former was lower. The total
DO removal in the tube settler (62.5 m2 surface area) of 104.4 g/day was much
less (3.2 times) than the 336.4 g/day consumed by the bead filter (178 m2).
Consequently, the drop in DO level across the tube settler (0.61 mg/L) was less
than across the bead filter (1.87 mg/L). Much of the difference in DO

109
consumption can be explained by the TAN removal capacity and greater sludge
activity in the bead filter. Since oxygen transfer rate is proportional to the DO
gradient (Colt and Orwicz, 1991), it follows that the RBC in System I had
significantly less aeration capacity (0.6 compared to 1.27 g/m2-day). Unlike
across the bead filter-RBC combination, there was a net aeration of 13.8 g/day
across the tube settler-RBC combination which also explains the significantly
higher DO level in System II.
Im plications on System Design an d O peration
The combination of the tube settler and Norpac® tube RBC was able to
maintain satisfactory system water quality up to the feed loading of 3 kg/day
that was studied. At this feeding level, stable mean TAN and NOa-N
concentrations of 1.30 mg/L and 0.724 mg/L, respectively, were realized, and
a net aeration capacity of 13.8 g/day was attained. As with the bead filter-
RBC combination, good fit empirical equations (Equations 15,16, and 17) were
obtained relating rearing tank TAN, N 02-N, and DO level with feeding rate at
a given set of operating conditions.
The tube settler provided very good removal of solids at reasonably high
hydraulic overflow rates. The mean sludge TSS harvest of the tube settler of
249.9 g dry solids/kg feed was significantly higher than that of the bead filter,
and is nearly 50 percent of the estimated TSS waste excretion. Unlike with the
bead filter, this high harvest rate was due to the practically complete removal
of sludge that results from the flushing procedure followed. For the size of

110
settler used, flushing after an equivalent of 6 kg feed proved appropriate, and
is recommended. This is equivalent to a feed load capacity of 13.23 kg feed/m3
of media. The average flow through the tube settler was 128.57±0.50 Lpm,
with a maximum of about 140 Lpm allowable tha t will still allow proper
settling. At the former flow rate, the equivalent overflow rate of 119.5 m3/m2-
day (2 gpm/ft2) was found to be most suitable for tube settling with the Bio
Strata media at a hydraulic retention time of 7.65 minutes. The maximum
overflow rate recommended is 130 m3/m2-day (2.3 gpm/ft2), a t a minimum
retention time of 6.7 minutes.
Flushing the tube settler was a laborious process, requiring at least 40
minutes down time. However, about 15 minutes was extra time to satisfy legal
requirements of ensuring that no live tilapia can escape. Further, the present
settler tank had a flat bottom and utilized the same influent pipelines for
drainage. A sloping bottom with drains provided at the downslope side
opposite the inlets is recommended to allow removal of the sludge without
necessarily stopping recirculation, and at a reduced water exchange. It will
still be necessary to clean the Bio Strata media a t regular intervals to release
extra sludge that accumulates within the cross tubes. Hosing down the media
with low water pressure is recommended. High water pressure may
excessively scour the biofloc. This is important especially when it was shown
that the tube settler-RBC combination was sensitive to shock loads, and took
a much longer time to restabilize compared to the bead filter-RBC combination.

I l l
The tube settler had net TAN and N 02-N production, so the RBC was
predominately responsible for nitrification in System II. As was observed in
System I, RBC TAN and N 02-N removal were compensatory, taking care of
the waste not handled or produced by the tube settler. Equations 18 and 19
described the relationship between TAN and N 02-N removal rates of the tube
settler and the RBC. At the feeding level of 3 kg feed/day, a mean RBC
removal rate of 60 g TAN/day or 0.305 g TAN/m2-day at a per pass removal
efficiency of 47.15 percent, and a removal of 69.8 g N 02-N/day or 0.354 g/m2-
day at 31.5 percent, were attained. Average RBC hydraulic retention time was
21.3 minutes.
SYSTEM HI: SAND FILTER-RBC COMBINATION
General System Conditions
The daily changes in rearing tank temperature and pH, and DO, TAN,
and N 02-N in System III are shown in Figure 19. Raw data tabulations are
presented in Appendix D. The water quality and operational conditions are
summarized in Table 14. The high values for TAN, N 02-N, turbidity, and SP
pressure, and low values for SF and RBC flow were observed during the feed
effects study a t the maximum feeding rate that was tried of 2 kg/day. Mean
values for these parameters were, therefore, distorted by extreme values at
this feeding level. The number of fish was reduced to 152 (26.5 kg total) on
the 74th day after initial stocking and moved to the other culture systems.
Feeding rate was reduced to 0.5 kg/day, later on increased to 1.0 kg/day form
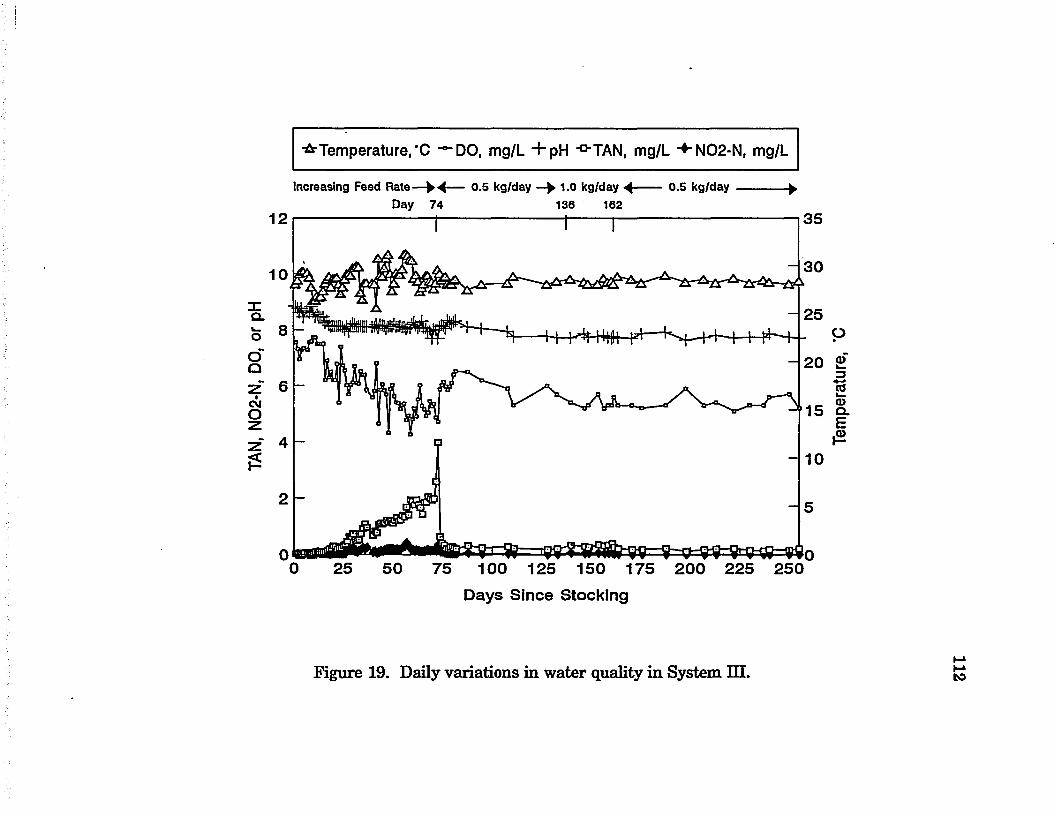
TAN,
N02
-N,
DO,
or pH
Temperature,'C -"-DO, mg/L + p H ^TAN, mg/L + N02-N, mg/L
Increasing Feed R a te— ^ — 0 .5 kg /day —► 1.0 kg/day 4 --------- 0 .5 kg /day yDay 74 136 162
12 35
3010
25
20
15
10
0 25 50 75 100 125 150 175 200 225 250Days Since Stocking
Figure 19. Daily variations in water quality in System HI.
Tem
pera
ture
, *'

113
Table 14. Water quality and operational conditions in System HI.
Parameter Range Mean S.D. n
Temperature, °C 25.6-31.3 28.7 1.0 106
DO, mg/L 4.27-7.73 5.92 0.82 106
pH 7.64-8.84 8.10 0.27 106
Alkalinity, mg CaCOg/L 95-262 178 33 31
TAN, mg/L 0.02-3.98 0.69 0.71 106
N 02-N, mg/L 0.002-0.422 0.092 0.088 106
N 03-N, mg/L 17.2-36.5 26.8 7.3 10
TSS, mg/L 0.63-1.45 1.08 0.23 20
Turbidity, NTU 0.1-96.0 11.0 24.2 30
QSP, Lpm 2.1-189.6 98.8 51.5 76
Q rbc> Lpm 1.2-109.8 56.6 30.0 76
SF Pressure, kPa 55-200 116 43 109
Note: The maximum feeding load tried was 2 kg/day. The system was backwashed twice a day throughout, with a daily water exchange rate of 9.5% of the total system volume.

114
days 136-162 to evaluate the effect on system performance. Thereafter, feeding
rate was kept a t a low 0.5 kg/day, consequently very good rearing tank water
quality was attained which are discussed later.
Effects o f Feeding Rate
Effects on TAN, N 02-N and DO
Figure 20 shows the effect of daily amount of feed on rearing tank TAN,
N 02-N and DO in System III. Similar to tha t of Systems I and II, good fit
exponential relationships between daily feed and TAN and N 02-N, and a linear
relationship between daily feed and DO in the rearing tank were obtained as
follows:
CTAJr = 0 . 0295e2,0505 F ( r 2=0.9547) (20)
= 0 . 0 07l e 1'16496 F ( r 2=0 .7410) (21)
Coo = 7 .751 - 1 .23 3 F ( r 2=0.7635) (22)
where:
C t a n = rearing tank TAN concentration, mg/L;
CN02.n = rearing tank NOa-N concentration, mg/L;
Cpo = rearing tank DO concentration, mg/L; and
F = daily feed rate, kg.
It became apparent, however, that with water exchange limited to 9.5 percent
of the system volume, the maximum feeding rate that System III could handle
was about 1.2 kg/day, equivalent to a feed loading of 13.8 kg/m3 of coarse (#12)

TAN
or N
02-N
, m
g/L
115
4.0
3.5- -7.5
3.0- -7.0
2.5- !6.5
2 .0 - 6.0
1.5- 5.5
1.0 -
0.5-
0.0 I ■■ i 4.02.0
Feeding Rate, kg/day
■ Actual TAN -B-Predicted TAN (SI Actual N02-N-X - Predicted N02-N + Actual DO -t-Predicted DO
Figure 20. Effects of feeding on TAN, N 02-N, and DO in System HI.DO
, m
g/L

116
silica sand. This was not due to ammonia or nitrite problems but because of
the sand filter clogging at higher feed rates due to inadequate backwashing.
Even though channelization was observed, clogging and pressure build-up was
due to formation of gelatinous mass. This problem was anticipated, and has
been reported in the literature (Stickney, 1979; Chen and Malone, 1991;
Losordo et al., 1992). The sand filter had to be purged a t feeding rates higher
than 1.2 kg/day. But even with purging, rearing tank TAN concentration
continued to increase (Figure 20) and tended to accumulate.
Com parison W ith System s I an d II
Despite similarities in the feed effects equations for all systems, an
analysis of covariance showed that there were highly significant differences in
individual system equations. Values of the coefficients for TAN, N 02-N, and
DO for all systems are summarized and compared in Table 15. Also, plots of
predicted values of TAN, N 02-N, and DO with feeding rate, using the derived
models for each system, are presented in Figures 21, 22, and 23, respectively.
The derived equations provide a convenient way of comparing the different
systems.
Relationships depicted by the feed effects models are generally
consistent with results of the comparisons made between System I and II.
TAN response to feeding (see Figure 21) was generally different for all
systems, although the baseline concentration C0 was not significantly different
between System I and System II. The larger feed coefficient k for System II

117
Table 15. Comparison of the coefficients in the equations of feed effects on TAN, N 02-N, and DO among Systems I, II, and III.
ParameterSystem
P > FI II m
TANC0 0.0465“ 0.0414“ 0.0295b 0.0001k 1.5226“ 1.7120b 2.0505c 0.0001
r2 0.9388 0.9318 0.9547 r2
n o 2-nCo 0.0124“ 0.0150" 0.0077b 0.0001
k 1.5287“ 1.5423" 1.6496“ 0.7160
r2 0.7702 0.7068 0.7410 r2
DOn 7.448“ 7.919b 7.751"b 0.0001
m 1.059“ 1.169" 1.233“ 0.3132
r2 0.7411 0.7769 0.7635 r2
Notes:1. Coefficients marked with the same letter are not significantly different at the 5%
level.2. r2 values are for individual system equations.S. The equations are of the following form:
For TAN or NOa-N: C = C0 ek F where: C = mg/LFor DO: Cdq = n - m F F = kg feed/day

TAN,
mg/
L
118
1.6-
1.4-
1.2 -
System1.0- C0 0.0465 0.0414 0.0295 k 1.5226 1.7120 2.05050.8-
0 .6-
0.4-
0.2-
Feeding Rate, kg/day
e - System I —«— System II System III
Figure 21. Comparison of predicted levels of TAN in each systemas a function of feeding rate.

N02
-N,
mg/
L
119
0.4
0.3-
0.3-
System0 .2-0.0124 0.0150 0.0077 1.5287 1.5423 1.6496
0.2 -
0.1-
0 . 1*
0.03
Feeding Rate, kg/day
e - System I — System II System III
Figure 22. Comparison of predicted levels of N 02-N in each systemas a function of feeding rate.

DO,
mg/
L120
8.0
7.5
7.0-
6.5-CDo = n - m F
6.0-System
n 7.448 7.919 7.751m 1.059 1.169 1.2335.5*
5.0
Feeding Rate, kg/day
■a- System I —♦— System II System III
Figure 23. Comparison of predicted levels of DO in each systemas a function of feeding rate.

121
compared to System I implies a higher rearing tank TAN concentration a t
higher feeding rates. This was found true in the comparisons at 3 kg feed/day
made between Systems I and II (see Table 11). The low C0 value for System
III is consistent with observations of lowest TAN levels a t low feeding rates.
In terms of TAN, Figure 21 shows that System III is best a t feeding rates of
0.9 kg/day or less. With the highest feed coefficient k, however, System III
had highest TAN levels in the rearing tank a t feeding rates of more than 0.9
kg/day.
There were no significant differences in the feed coefficient k for N 02-N
among systems, however, C0 was significantly lower in System III. As depicted
in Figure 22, lowest N 02-N levels were observed in System III. As with TAN,
lowest N 02-N were observed in System II a t low feeding rates. However, at
feeding rates higher than 1.2 kg/day, TAN accumulated, hence, not converted
to N 02-N. Although N 02-N levels were higher in System II, values were not
significantly different with System I. There were no significant differences in
DO reduction rate m and the maximum DO level n among the three systems,
however, n in System I was comparably lower than System II. In fact, highest
DO levels were observed in System II (see Figure 23) which can be attributed
to its open configuration.
In general, the rearing tank water quality is a function of how much
waste is produced and how much waste is removed by the water treatment
system. The general response of the three systems to variations in feeding

122
rate was similar as depicted by the obtained models. Differences in coefficients
obtained for each system, however, clearly demonstrated differences in system
performance, indicating limited usefulness of the empirical models.
Effects on Sand Filter Pressure and Flow
The sand filter pressure increased proportionately with daily feed. The
linear relationship is shown in Figure 24 which can be described by the
equation:
P SF = 5 0 . 9 7 + 6 6 . 6 4 F ( r 2= 0 . 9 1 2 0 ) (23)
where:
Psf = sand filter pressure, kPa gauge; and
F = feeding rate, kg
The increase in pressure with feeding rate resulted to a decline in flow through
the sand filter as shown in Figure 25. The close-fit linear relationship below
was obtained:
QSF = 2 6 6 . 1 1 5 - 1 . 3 5 3 P SF ( r 2=0 . 9 8 7 5 ) (24)
where:
Qsp = flow through the sand filter, Lpm
The sand filter used was designed for a maximum pressure 345 kPa (50 psig)
while the actual maximum observed pressure was only 200 kPa (29 psig).
However, a t this pressure, there was hardly any flow (QsP of only 2.1 Lpm)
through the filter already, and because of the by-pass provision water flow is

SF
Pres
sure
, kP
a ga
uge
123
200
180-
160-
FjsF a 50.97 + 66.64 F140-
(r2 *» 0.9120)120-
100 -
80-
60-
Feeding Rate, kg/day
Figure 24. Relationship between feeding rate and sand filter pressure.

Flow
Thro
ugh
Sand
Fi
lter,
Lpm
124
200
180-
160-
140*
120-
100-
80- OsF = 266.115-1.353 P SF
60-(rz = 0.9875)
40-
20 -
Pressure, kPa gauge
Figure 25. Relationship between sand filter pressure and flow.

125
simply returned back to the tank without the benefit of being filtered, resulting
to TAN accumulation.
System Performance
TAN and NOa-N removal rates across the SF-RBC combination were not
different at feeding rates of 0.5 and 1.0 kg/day (Table 16), both averaging about
20 g/day. However, the percentage TAN and N 02-N removal a t 0.5 kg feed/day
of52.97 and 84.25 percent, respectively, were significantly higher compared to
the respective removal of 39.29 and 69.04 percent at 1.0 kg feed/day. With
higher waste loading a t higher feeding rates but no matching increase in
removal rates, TAN and N 02-N accumulation can be expected in the rearing
tank as predicted by Equations 20 and 21. Actual mean rearing tank TAN and
N 02-N values were significantly higher at 1.0 kg feed/day as can be seen in
Table 17 which also shows differences in other system parameters.
Sand Filter and RBC Performance
TAN, N02-N, and DO Removal
Unlike results in System I and II, the sand filter accounted for most of
the TAN and N 02-N removal rather than the RBC. The RBC accounted for
only 3 percent and 26 percent a t the most of the TAN and N 02-N removal,
respectively. However, as seen in Table 16, removal accounted for by the sand
filter significantly decreased with feeding rate with a consequent significant
increase in removal accounted for by the RBC. These changes are also
reflected in Table 18 which shows the individual performance of the sand filter

126
Table 16. Sand filter, RBC and overall TAN and N 02-N removal in System HI a t feeding rates of 0.5 and 1.0 kg/day.
Item Filter UnitsFeeding Rate, kg/day Standard
Error(n=6)0.5 1.0
TANRemoval
SFg/day 18.79° 16.70“ 1.91
% Sys. 93.59“ 84.16b 2.28
RBCg/day 1.34“ 3.09b 0.47
% Sys. 6.41“ 15.84b 2.28
Systemg/day 20.13“ 19.79“ 1.99
% Load 52.97“ 39.29b 3.11
n o 2-nRemoval
SFg/day 16.47“ 14.85“ 1.73
% Sys. 83.20“ 74.05“ 2.46
RBCg/day 3.34“ 5.05b 0.49
% Sys. 16.80“ 25.93b 2.47
Systemg/day 19.81“ 19.90“ 1.91
% Load 84.25“ 69.04b 1.82
Notes:1. Values marked with the same letter are not significantly different at the 5% level.2. % Sys. values are percent of the total system removal.3. % Load are system removal values as a percentage of system TAN or NOa-N loading.

127
Table 17. Parameter changes and TSS removal by the sand filter a t feeding levels of 0.5 and 1.0 kg/day.
ParameterFeeding Rate, kg/day
0.5 1.0
Rearing Tank TAN
mg/L 0.235* 0.326b
Std. Error 0.017 0.034
n 28 7
Rearing Tankn o 2-n
mg/L 0.028* 0.056b
Std. Error 0.005 0.009
n 28 7
Qsp
Lpm 123.57* 107.07b
Std. Error 3.41 5.90
n 21 7
Q rbc
Lpm 68.56* 52.93b
Std. Error 3.46 5.99
n 21 7
Rearing Tank Turbidity
NTU 1.35* 1.35*
Std. Error 0.7 1.8
n 13 7
Rearing Tank TSS
mg/L 1.08“ 1.05*
Std. Error 0.061 0.105
n 15 5
TSSCapture
g/kg feed 161.05* 66.31b
Std. Error 20.34 22.28
n 6 5
SludgeTSS
Removal
g/kg feed 94.40* 43.39b
Std. Error 2.92 3.45
n 7 5
Note: Values marked with the same letter are not significantly different at the 5% level.

128
Table 18. Sand filter and RBC performance in System III a t feeding levels of 0.5 and 1.0 kg/day.
Filter Parameter UnitsFeeding Rate,
kg/dayStandard
Error(n=6)
0.5 1.0
SandFilter
TANRemoval
g/m2-day 0.106“ 0.094“ 0.011
Eff., % 49.60“ 33.12b 3.12
n o 2-nRemoval
g/m2-day 0.093“ 0.083“ 0.010
Eff., % 74.29“ 57.32b 2.38
DORemoval
g/m2-day 0.892“ 1.212b 0.067
RBC
TANRemoval
g/m2-day 0.007“ 0.016b 0.002
Eff., % 11.78“ 19.13“ 3.64
n o 2-nRemoval
g/m2-day 0.017“ 0.026b 0.003
Eff., % 72.31“ 60.29" 4.24
DORemoval
g/m2-day -0.658“ -0.623“ 0.055
Notes:1. Values marked with the same letter are not significantly different at the 5% level.2. Negative DO removal of the RBC means a net gain.

129
and the RBC. A nonsignificant reduction in areal removal by the sand filter
with an increase in feeding rate from 0.5 to 1.0 kg/day was accompanied by a
significant increase in areal removal rates by the RBC, consistent with
relationships observed in Systems I and II. At hydraulic flux rates of 225-257
Lpm/m2, maximum removal by the sand filter was 0.142 g TAN/m2-day (333 g
TAN/m3-day) and 0.125 g N 02-N/m2-day (293 g N 02-N/m3-day). However, for
the RBC, maximum areal removal was only 0.024 g TAN/m2-day and 0.032 g
N 02-N/m2-day, suggesting operation a t a very limited substrate regime.
There was no difference in aeration capacity of the 2-inch tube RBC for
the two feeding levels. The RBC compensated for more than half of the oxygen
consumed by the sand filter. The mean RBC oxygenation rate was 0.65 g
DO/m2-day or 128 g DO/day at mean water retention time of 23 minutes. On
the other hand, DO consumption of the sand filter were significantly different
at 0.892 and 1.212 g/m2-day (159 and 216 g DO/day) at feeding levels of 0.5
and 1.0 kg/day, respectively. Without significant change in TAN and N 02-N
removal by the sand filter, this increase in oxygen consumption is likely a
result of solids accumulation and increased heterotrophic activity.
Solids Removal
The solid removal performance of the sand filter is shown in Table 17.
I t is interesting to note that the turbidity and TSS level in the rearing tank
were not statistically different at 0.5 and 1.0 kg feed/day. Chen et al. (1993)
made similar observations in a system employing a bubble-washed bead filter.

130
There was more variability in rearing tank TSS a t a feeding rate of 1.0 kg/day,
however. At both feeding levels, turbidity was excellent, with 1.8 NTU as the
maximum recorded.
TSS capture and TSS removal rates from sludge were significantly
different for the two feeding levels. The maximum recorded TSS capture rate
and removal rate, respectively, were 239 and 109 g/kg feed-day at 0.5 kg
feed/day. Sludge harvest a t 0.5 kg feed/day are generally within the range of
sludge harvest of 10-25 percent estimated by Chen et al. (1991). Apparent TSS
capture and removal were more than twice greater at the lower feeding rate
of 0.5 kg/day, when it may be expected that the amount of solids generated at
1.0 kg feed/day is double tha t at 0.5 kg feed/day. Lower TSS capture a t 1.0 kg
feed/day was a result of channelization. In all instances, however, TSS capture
was more than TSS removal in sludge, implying the accumulation of solids in
the sand filter. Solid digestion must also be occurring as evidenced by the
production of TAN. Solids accumulation causes gelling and clogging especially
a t high feeding rates, and consequently high pressure and low flow. As can be
seen in Table 17, flow through the sand filter and the RBC (QgP and QRBc) was
significantly lower at 1.0 kg feed/day compared to flows a t 0.5 kg feed/day.
Despite channelization, gelling was in fact observed, forming a mat which tend
to clog up the filter. At the end of the 26-day measurement period a t 1.0 kg
feed/day, pressure was up to 138 kPa (20 psig) from 103 kPa (15 psig) a t the
start, and flow was down to 95 Lpm from 125 Lpm. It was, therefore,

131
necessary to purge the sand filter a t that time. These observations are
consistent with the obtained relationship between feeding rate, pressure and
flow obtained in Equations 23 and 24.
Im plications on D esign an d O peration
In the sand filter-RBC combination, the performance of the RBC was
highly limited by the sand filter. At the maximum feeding rate of 1.2 kg/day
that the combination can handle a t two backwashes per day and 9.5 percent
water exchange, the results suggest that about 80 percent and 70 percent of
the TAN and N 02-N can be handled by the sand filter alone, leaving the RBC
substrate-limited and ineffectual, except for the aeration it provides. As also
indicated by the low TAN and N 02-N concentrations in the rearing tank, the
sand filter by itself would be enough at this low maximum feeding level, and
there is no need for an RBC as far as nitrification is concerned. To keep DO
levels in the same range, however, the equivalent of the RBC’s aeration
capacity of 128 g DO/day is required.
For feeding rates higher than 1.2 kg/day, it was necessary to purge the
sand filter every 3 to a t most 11 days, depending on feeding rate, with more
frequent purging necessary a t higher feeding rates. This meant the daunting
task of opening the filter, physically stirring the sand media, and wasting
about 4 backwash volumes or 19 percent of the system volume. The equivalent
daily water exchange rate, therefore, amounts to 13-17 percent of the system
volume if done regularly. Increasing the daily backwashing frequency would

132
not work equally well because of channelization and gelling. Likewise,
increasing the backwash flux rate would not be effective as it promotes
channelization and sand loss with backwashing, and once channelization has
occurred, high flow rates would not be effective in cleaning the sand media.
If purging is done regularly every 2 days to 4 days a t the most which is
obviously not a practical option, up to 2 kg feed/day may be handled (or more
for more frequent purging). Obviously, the primary operational limitation is
the ineffective backwashing of the sand filter.
I t is recommended to use the sand filter by itself and limit the feed load
to 1.2 kg/day if only hydraulic backwashing will be employed. The maximum
feed loading rate is equivalent to 15.8 kg feed/m3 of coarse silica sand (#12).
Actual hydraulic flux rates attained ranged from 225-257 Lpm/m2 of filter
cross-section (5.5-6.3 gpm/ft2). The areal TAN and N 02-N removal rate was
about 0.100 g/m2-day (235 g/m3-day) a t 33 percent and 57 percent per pass
removal efficiency for TAN and N 02-N, respectively. Purging is recommended
at least once a month, or better, twice a month as the results of the study
suggest.
TUBE RBC PERFORMANCE AND MODELLING
Effect of Tube Size on RBC Performance
With the existing one-inch tube RBC (RBC-1), a two-inch tube RBC
(RBC-2) was connected in parallel in System II. The one-inch and the two-inch
RBC were run simultaneously from day 198-262 to compare their performance.

133
Table 19. Rearing tank water quality and operational conditions in System II during the RBC comparison study.
Parameter Range Mean s.d. n
Temperature, °C 26.4-31.6 28.2 0.94 62DO, mg/L 3.90-6.70 5.66 •0.63 62
pH 7.40-7.92 7.68 0.14 62
Alkalinity, mg CaCOa/L 152-238 189 28 9
TAN, mg/L 0.64-1.04 0.79 0.10 47N 02-N, mg/L 0.10-0.98 0.22 0.13 47
Qra, Lpm 88.6-143.7 113.0 21.6 38

134
It took a total of 16 days (by day 215) before the system restabilized after the
two-inch RBC was installed. The rearing tank water quality and operational
conditions during stable periods in the comparison study are summarized in
Table 19. Mean temperature during this period was 28.2°C, and ranged from
26.4-31.6°C. pH (7.68±0.14) and alkalinity (189±28) were maintained at
desirable levels. The test configuration maintained good DO level (5.66±0.63),
and low mean TAN (0.79 mg/L) and N 02-N (0.22) levels which may be expected
because of the additional RBC.
Table 20 shows that the mean flow, the TAN, and the N 02-N loading to
the RBCs were adequately controlled and nearly identical during the
comparison study. Despite changes in feeding rate, rearing tank TAN and
N 02-N levels did not vary considerably due to the large filtration capacity of
the two RBCs combined. In terms of TAN and N 02-N removal, there were no
differences between the two RBC sizes. However, N 02-N removal efficiency of
the one-inch RBC was 3 percent higher than that of the two-inch RBC, a small
but statistically significant difference. This may be due to the slightly lower
flow through the one-inch RBC but it is also possible that the two-inch RBC
had not comparably stabilized after being operated for merely 60 days unlike
the one-inch RBC which had been operating since the very start. It can be
asserted, therefore, tha t there was practically no difference in the performance
of the two RBC sizes in terms of TAN and N 02-N removal performance.
The increase in DO effluent concentration through RBC-2 of 1.93 mg/L
was significantly higher than the 1.56 mg/L increase through RBC-1. With

135
Table 20. Mean KBC flow, TAN and N 02-N loading, and performance comparison of the two RBC sizes (n=38).
Parameter RBC-1 RBC-2 s.e. P > F
Qrbc or RBC Plow, Lpm 48.29 49.16 0.830 0.4628TAN Loading, g/m2-day 0.293 0.299 0.005 0.4456
N 02-N Loading, g/m2-day 0.240 0.243 0.008 0.7802
TAN Removal, g/m2-day 0.136 0.137 0.004 0.8311
TAN Removal Efficiency, % 46.12 45.50 0.92 0.6389N 02-N Removal, g/m2-day 0.183 0.178 0.006 0.5414
N 02-N Removal Efficiency, % 76.56“ 73.53b 0.50 0.0035DO Increase, mg/L 1.56“ 1.93b 0.10 0.0119
Aeration Rate, g DO/m2-day 0.534“ 0.672b 0.027 0.0005
Note: Means marked with different letters are significantly different; s.e. = standard error.

136
nearly identical flow rates and similar total media surface area, it follows that
RBC-2 had higher aeration rate. The diameter of RBC-2 is 1.22 m compared
to 0.91 m of RBC-1. Operated at the same rotational speed of 3 rpm, the
larger diameter RBC-2 had faster peripheral speed which caused more
turbulence, hence, better aeration capacity (also the need for splash guards).
It is interesting to note that the ratio of the change in DO in RBC-2 over that
of RBC-1 (i.e., 1.93/1.56 = 1.24) is close to the ratio of the diameters
(1.22m/0.91m = 1.34) of the two RBCs. In terms of total amount of DO added
per day, RBC-2 had a 26 percent higher capacity of 132.37 g/day compared to
105.10 g/day for RBC-1.
M odelling of RBC P erform ance
The comparison study demonstrated that there was practically no
difference between the areal TAN and N 02-N removal rates of the one-inch and
the two-inch RBC. Also, differences in performance between the RBCs of
different systems can be attributed to different loading rates tha t resulted from
changes in TAN and N 02-N removal of the respective solid removal filter. In
general, the total amount of TAN removed by each system matched the
amount that may be expected from the feed provided. Removal by the RBC
was compensatory, taking care of whatever TAN and N 02-N generated from
feed was left, as well as the TAN and N 02-N produced in the solids filter itself
through solids decay and denitrification. Data for all RBCs studied were
therefore pooled, and the respective plots of the TAN and N 02-N removal rate
of the RBC with loading rate were found to conform to the Monod profile

137
(Figures 26 and 27). With substrate concentration as independent variable,
basically similar patterns were fitted by a half-order/2ero-order model by
Bovendeur et al. (1987) and Nijhof and Bovendeur (1990). Here, a model
(Equation 26) was derived which is a modification of the Monod expression
(Equation 5 and 6). The basis for the model is presented in the following
discussions.
Bacteria that colonize and predominate biofilters are self-elected, in
response to environmental factors, although their respective numbers are
known to fluctuate until an equilibrium is established (Kawaii et al. ,1964;
cited in Rogers and Klemetson, 1985). Other than by shearing accomplished
due to continuous rotation, there is no other practical means to control the
amount of bacterial biomass in the RBC, however, the biomass tha t develops
will be tha t best suited to treating the wastewater (Antonie, 1976). For a fixed
film reactor like the RBC, exceptionally long residence times of bacteria are
easily maintained, so it is reasonable to assume an established bacterial
concentration with fairly constant specific activity. Thus, the term k X in
Equation 6 can be replaced by a parameter u to represent the maximum
substrate utilization rate. Equation 6 can be rewritten as follows:
f t ■ u ^ T c <25>
where:
u = k X = maximum substrate utilization rate, g substrate/L-day.

138
James (1984) also recognized tha t the effects in reactor effluent, best
described by a mass balance approach, should be considered in terms of flow
rate, influent concentration, and removal kinetics. For a reactor with constant
volume (V), total biofilm surface area (A), and flow (Q), Equation 25 can be
further rewritten to define the areal substrate removal rate (R):
R = areal substrate removal rate, g substrate/m2-day;
S = maximum areal substrate removal rate, g substrate/m2-day;
L = areal substrate loading rate, g substrate/m2-day; and
Kl = areal substrate loading rate for half the maximum areal removal
rate, g substrate/m2-day.
The terms R, S, L, and KL are further defined by the following
(26)
where:
equations:
R = (27)
(28)
(29)
( 3 0 )

139
where:
V = filled filter volume, L;
A = total biofilm surface area, m2;
Q — flow, L/day;
C( = influent substrate concentration, g/L;
Ce = effluent substrate concentration, g/L;
and other terms defined previously.
Equations 27 and 28 can be applied directly to compute for TAN removal
rate and loading rate, respectively. For N 02-N, the loading rate is corrected
for the TAN removal rate (Rian) using Equation 31:
•k«o2-w = R-tan + ^ Pi (31)
The derived model, Equation 26, defines the relationship between
substrate loading rate and substrate removal rate. Equation 26 matches the
relationships that may be obtained by mass balance analysis through the RBC.
The nature of the relationship is consistent with the observation made by
Kaiser and Wheaton (1983) and Wheaton et al. (1991a,b) tha t nitrifier growth
rate and nitrification rate are more a function of the substrate loading and not
simply the substrate concentration. Assuming tha t other nutrient
requirements are met, for the RBC which is known and had been shown to be
capable of aeration, the growth limiting substrate for Nitrosomonas is
ammonia, and for Nitrobacter is nitrite.

140
Results from this study provide a basis for the above relationships.
Plots of TAN and N 02-N removal rate of the RBC versus loading rate are
shown in Figures 26 and 27, respectively. The figures show that areal removal
rate generally increases with loading rate. However, the rate of increase
clearly diminishes as loading increases. I t follows that removal efficiency
(ratio of removal to loading) of the RBC decreases with higher loading rates.
I t is clear that the relationship between areal substrate loading rate and
removal rate of the tube RBC can be effectively modelled by the modified
Monod expression as shown in Equation 26. The equation was fitted to the
pooled RBC data using the SAS nonlinear modelling system SYSNLIN (SAS
Institute, Inc., 1984). Good fit relationships were obtained with the following
parameters:
S u b stra te s k l r 2
TAN 0.870 1.408 0.7655
n o 2-n 0.455 0.269 0.6768
The fitted models are also shown in Figures 26 and 27. From the
relationships in Equations 29 and 30, values of the maximum substrate
utilization rate u and the half velocity or saturation constant Kc can be
calculated. For the RBCs used, V = 1,410 L, A = 197 m2, and mean Q ranged
from 57-75 Lpm. Respective values for u and Kq can be calculated as 0.122 g
TAN/L-day and 2.57-3.38 mg TAN/L for Nitrosomonas, and 0.064 g N 02-N/L-
day and 0.49-0.65 mg N 02-N/L for Nitrobacter. The values obtained for half

TAN
Rem
oval
(R)
, g/
sq.m
.-day
141
0.50--------
0.45
0.40
0.35
0.30
0.25
0.20
0.15
0.10
0.05
0.000.0 0.2 0.4 0.6 0.8 1.0 1.2 1.4 1.6 1.8
TAN Loading (L), g/sq.m.-day
Figure 26. Relationship between RBC TAN loading and removal.
0.870* L

N02-
N R
emov
al (
R),
g/sq
.m.-d
ay
142
0.70
Rn02*n= 0.455*LNO2.n0.60- 0.269 + L N02.N
(t2 m 0.6768)0.50-
0.40- ■ %
0.30-
0 .20-
0.10-
0.000.0 0.5 3.5
N02-N Loading (L), g/sq.m.-day
Figure 27. Relationship between RBC N 02-N loading and removal.

143
velocity constant are in general agreement with the range reported by Sharma
and Ahlert (1977) of 0.06-5.6 mg TAN/L and 0.06-8.4 mg N 02-N/L.
Wheaton et al. (1991a,b) and Hochheimer and Wheaton (1991) cited that
the growth rate of Nitrobacter is greater than Nitrosomonas, and since
nitrification proceeds from ammonia oxidation to nitrite oxidation, the rate
limiting step is usually ammonia oxidation, and this controls the overall
kinetics of nitrification. It is also for this reason that sizing of biofilters for
aquaculture had generally been based on TAN removal rates. The problem
with this approach is that it assumes wrongly that all the NOa-N produced is
taken care of. This is not necessarily the case, especially at high waste loading
regimes, and especially in biofilters which are operated alone.
In combination with an adequate solid removal filter, the Norpac® tube
RBC has proven to be a good nitrification filter. I t was demonstrated,
however, that its TAN and N 02-N removal capacity is greatly influenced by the
nitrogen waste load. A range of removal rates were therefore obtained, and
clearly, i t is very difficult to pinpoint by just using performance values which
may be used for design. The modified Monod model obtained adequately
described the RBC’s performance, and certainly, similar equations may be
obtained for other fixed-film biofilters. The use of the equations in a simple
way to determine reliable removal rate values that may be used in design is
illustrated as follows. Predicted values of total ammonia or nitrite nitrogen
removal are plotted with loading in Figure 28 using the obtained models. The

Rem
oval
Rate
(R
), g/
sq.m
.-day
144
0.7
0.6-
0.5-
0.4- 0.357 g/sq.m.-day
' Recommended Design Value
% Removal ° 100x ° 3-5- - *■ 36.5 % 0.978
0.3-
0.2 -
0.1-
0.978 g/sq.m.-day
1.0 1.5 2.0 2.5Loading Rate (L), g N/sq.m.-day
3.5
-e— TAN Removal N02-N Removal
R = SLKl +L
where:R = areal substrate removal rate, g/mJ-day S = maximum areal substrate removal rate, g/m3-day L - substrate loading rate, g/m8-day Kl = areal substrate loading rate for half the maximum
areal removal rate, g/ma-day
SubstrateTANNOa-N
S0.8700.455
Kt1.4080.269
r*0.76550.6768
Figure 28. Plot of predicted RBC TAN and N 02-N removal with loading rate.
145
intersection of the two lines determine the critical loading and removal rate,
beyond which, N 02-N removal lags behind TAN removal, which would result
to N 02*N accumulation. It is this maximum value of removal rate, found to be
0.357 g/m2-day for the ftorpac® tube RBC at 36.5 percent efficiency, tha t is
recommended for design to obtain a reliable filter size. The critical value may
also be obtained by equating the equations for TAN and N 02-N and computing
for the critical nitrogen load. Either equation may then be used to obtain the
corresponding removal rate.

SUMMARY AND CONCLUSIONS
The system and individual filter performance of combinations of the
RBC with a floating bead filter (System I), a tube settler (System II), and a
sand filter (System III) in pilot scale recirculating systems stocked with tilapia
(Oreochromis niloticus) were evaluated and compared. For all systems, good
fit empirical equations were obtained relating TAN and N 02-N (both
exponential), and DO (linear) with daily amount of feed. Likewise, linear
equations relating bead filter or sand filter pressure with feed, and flow with
pressure were obtained. In the range of operational conditions attained, the
empirical models have practical applications in predicting water quality and
system response based simply on feeding rate. However, the empirical models
were significantly different among the three systems, demonstrating their
limited applicability to each particular system.
Results showed the ability of Systems I and II to maintain favorable
water quality, attaining practically complete TAN and N 02-N removal up to
the maximum feed load studied of 3 kg of 35%-protein feed per day. However,
rearing tank water quality was generally better in System I than System n ,
although low levels of TAN and N 02-N in both systems suggest tha t they can
handle a higher feeding load than the 3 kg/day attained in this study.
Performance of the bead filter-RBC combination was demonstrated to be
affected by the bead filter backwashing process. In operating the bead filter,
it was attempted to achieve nitrification in conjunction with solids removal.
146

147
However, there was considerable sludge stabilization activity in the bead filter,
and this was indicated by, and resulted to, its low TAN removal and
interm ittent TAN production, and high DO decline and consumption. This was
shown to have influence on the performance of the RBC. The system removal
capacity was 50 g TAN or N 02-N per day, with a per pass removal efficiency
of 30 percent of system loading, a t a mean recirculation flow rate of 129 Lpm.
In all instances, the bead filter generated a N 02-N load to the system. The
bead filter functioned primarily as a solids capture device, while the RBC
performed bulk of the nitrification. Among the backwashing treatments
studied, the best option was 30-second propeller agitation with backwashing
done everyday. At a feed loading of 3 kg/day (18 kg/m3-day), the sludge TSS
harvest rate was 175 g dry solids/kg feed. The mean areal TAN removal for
the bead filter was 0.071 g/m2-day (75 g/m3-day) with a per pass removal
efficiency of 6.9 percent, a t a mean hydraulic flux rate of 280 Lpm/m2. The
N 02-N production was 0.100 g/m2-day (104 g/m3-day). At hydraulic retention
times of 21-28 minutes, the range of areal TAN removal rate of the RBC in t
he combination was 0.199-0.275 g TAN/m2-day a t 38-62 percent per pass
removal efficiency. Areal N 02-N removal rate was fairly consistent a t 0,370
g N 02-N/m2-day at efficiencies of 23-68 percent.
The tube settler had a mean sludge TSS harvest rate of 249.9 g dry
solids/kg feed, significantly higher than tha t of the bead filter. This high
harvest rate was due to the practically complete removal of sludge that results

148
from the flushing procedure followed. The tube settler had mean TAN and
N 02-N production of 0.161 and 0.324 g/m2-day, so the KBC was predominately
responsible for nitrification in System II. A mean BBC removal rate of 60 g
TAN/day or 0.305 g TAN/m2-day at a per pass removal efficiency of 47.15
percent, and a removal of 69.8 g N 02-N/day or 0.354 g/m2-day a t 31.5 percent,
were attained in the combination. Like System I, system TAN and NOa-N
removal was about 50 g/day, but at lower per pass removal efficiencies of 22.4
and 15.4 percent for TAN and N 02-N, respectively.
The maximum feed load that System III supported was 1.2 kg/day
(equivalent to 13.8 kg feed/m3 of coarse (#12) silica sand per day) because the
sand filter clogged at higher feed rates due to ineffective backwashing. TAN
and N 02-N removal of the sand filter did not differ significantly between
feeding rates of 0.5 and 1.0 kg/day (6.6-13.2 kg feed/m3-day). With attained
hydraulic flux rates of 225-257 Lpm/m2, the areal TAN removal rate of the
sand filter was about 0.100 g/m2-day (234.5 g TAN/m3-day) a t per pass removal
efficiency of33-50 percent. Up to 1 kg feed/day, about 80 and 70 percent of the
TAN and N 02-N, respectively, can be handled by the sand filter alone leaving
the BBC substrate-limited and ineffectual. The system was able to support
higher feeding rates but it was necessary to purge the sand filter every 2 to a t
most 4 days, which was not a practical approach.
The BBC was shown to have a good aeration capacity, which was
significantly higher for the two-inch Norpac® tube BBC. At a hydraulic

149
retention time of 19-25 minutes, the RBC demonstrated an aeration capacity
of 1.0-1.3 g DO/m2-day. There was practically no difference in the TAN and
N 02-N removal performance of the one-inch and the two-inch tube RBC.
Likewise, differences in performance between the RBCs of different systems
can be attributed to different loading rates that resulted from changes in TAN
and N 02-N removal or production of the respective solid removal filter. In
general, the RBC handled all the TAN and N 02-N not removed or produced by
the solid removal filters.
A modified Monod expression (Equation 25) was derived which closely
describes the relationship between the areal TAN or N 02-N loading with
removal rate of the tube RBC. Relationships in the equation provided the
maximum substrate utilization rate u and the Monod half-velocity constant Kc
for Nitrosomonas and Nitrobacter. Values of 0.122 g TAN/L-day and 0.064 g
N 02-N/L-day, and 2.57-3.38 mg TAN/L and 0.49-0.65 mg N 02-N/L were
obtained for the respective parameters. A new approach was illustrated using
the obtained Monod type equations in determining reliable design values for
removal rate. Values of 0.357 g TAN or N 02-N/m2-day and 36.5 percent
efficiency were obtained for the Norpac® tube RBC.

RECOMMENDATIONS
The following recommendations are made based on results from this
study:
1. By itself, the sand filter is the best option for feeding loads of 1.2 kg/day
or less when hydraulically backwashed twice a day. Without the need
for any RBC, it will also be the cheapest option a t low feeding rates.
The maximum feed loading rate is equivalent to 15.8 kg feed/m3 of
coarse silica sand (#12). Purging is recommended a t least once a
month, or better, twice a month to mitigate gelling and channelization.
2. In designing filter combinations employing the bead filter or tube settler
with the RBC for higher feeding rates, it is recommended to size the
former two for solids removal, and the RBC to handle all the TAN and
N 02-N load. For design purposes, a TAN and N 02-N removal rate of
0.357 g/m2-day a t 36.5 percent efficiency is recommended for the
Norpac® tube RBC.
3. The more compact one-inch tube RBC is recommended rather than the
two-inch tube RBC which has better aeration capacity but needs a
splash guard, requires more power to operate, and is less rigid. The
effects of rotational speed on nitrification and aeration capacity should
be examined.
4. For tube settling with the Bio Strata media, the maximum hydraulic
overflow rate recommended is 130 m3/m2-day (2.3 gpm/ft2) a t a minimum
150

retention time of 6.7 minutes. Flushing is recommended a t a maximum
total feed load equivalent to 13.23 kg/m3 of media. For the tube settler
tank, a sloping bottom with drains provided at the downslope side
opposite the inlets is recommended to allow removal of the sludge
without necessarily stopping recirculation, and a t a reduced water
exchange. It will still be necessary to clean the Bio S trata media a t
regular intervals to release extra sludge tha t accumulates within the
cross tubes. Hosing down the media with low water pressure is
recommended. High water pressure may excessively scour the biofloc.
Further studies are recommended to optimize the solids removal
performance of the bead filter and the tube settler through more
frequent sludge harvest, and to determine the effects on the nitrification
performance of the RBC in the combination. There is a need to
establish the optimum feeding loads the filter combinations can support,
and perform an economic evaluation a t these optimum levels.
Additional studies are recommended to determine the validity of the
modified Monod model in describing the performance of various fixed-
film biological filters, with the ultimate objective of establishing reliable
design criteria.

BIBLIOGRAPHY
Allain, P. A. 1988. Ion shifts and pH management in high density shedding systems for blue crabs ([Callinectes sapidus) and red swamp crawfish (Procambarus clarkii). Master’s Thesis, Louisiana State University, Baton Rouge.
Antonie, R. L. 1976. Fixed biological surfaces - wastewater treatment. CRC Press, Inc., Florida.
APHA. 1989. Standard methods for the examination of water and wastewater. 17th edition.
Balarin, J. D. and R. D. Haller. 1982. The intensive culture of tilapia in tanks, raceways and cages, in Muir, J. F. and R. J. Roberts (eds.). 1982. Recent advances in aquaculture. Croom Helm, Ltd., London, pp. 265-355.
Bisogni, J. J. 1991. Control of pH in closed cycle aquaculture systems, in Northeast Regional Agricultural Engineering Service. Engineering Aspects of Intensive Aquaculture. Proceedings from the Aquaculture Symposium, Cornell University, April 4-6, 1991, pp. 333-348.
Bovendeur, J., E. H. Eding, and A. M. Henken. 1987. Design andperformance of a water recirculation system for high-density culture of the African catfish, Clarias gariepinus (Burchell 1822). Aquaculture 63:329-353.
Chen, S and R. F. Malone. 1991. Suspended solids control in recirculating aquacultural systems, in Northeast Regional Agricultural Engineering Service. Engineering Aspects of Intensive Aquaculture. Proceedings from the Aquaculture Symposium, Cornell University, April 4-6,1991, pp. 170-186.
Chen, S., M. B. Timmons, D. J. Aneshansly, and J. J. Bisogni, Jr. 1993. Suspended solids characteristics from recirculating aquacultural systems and design implications. Aquaculture 112:143-155.
Chen, S., D. E. Coffin, and R. F. Malone. 1993. Production, characteristics, and modeling of aquacultural sludge from a recirculating aquacultural system using a granular media biofilter, in Wang, J. K.(ed.). 1993. Techniques for modem aquaculture. American Society of Agricultural Engineers, Michigan, pp. 16-25.
152

153
Chervinski, J. 1982. Environmental physiology of tilapias. in Pullin, R. S. V. and R. H. Lowe-McConnel (eds.). 1982. The biology and culture of tilapias. ICLARM, Makati, Philippines, pp. 119-140.
Chesness, J. L., W. H. Poole, and T. K Hill. 1975. Settling basin design for raceway fish production systems. Transactions of the ASAE 18(1):159-162.
Chitta, B. S. 1993. Effects of backwash frequency on nitrification in plastic bead media biofilters used in recirculating finfish culture systems. M.S. Thesis, Department of Civil Engineering, Louisiana State University, Baton Rouge, Louisiana.
Colt, J. E. 1991. Aquacultural production systems. J. Anim. Sci. 69: 4183- 4192.
Colt, J. E. and D. A. Armstrong. 1981. Nitrogen toxicity to crustaceans, fish, and molluscs, in Allen, L. J. and E. C. Kinney (eds.). 1981. Proceedings of the bio-engineering symposium for fish culture. Fish Culture Section of the American Fisheries Society, Bethesda, Maryland, pp. 34-47.
Colt, J. E. and C. Orwicz. 1991. Aeration in intensive culture, inBrune, D. E. and J. R. Tomasso. (eds.). 1991. Aquaculture and water quality. World Aquaculture Society, Baton Rouge, pp. 198-270.
Culp, G. and W. Conley. 1970. High-rate sedimentation with thetube-clarifier concept, in Gloyna, E. F. and W. W. Eckenfelder, Jr. (eds.). 1970. Water quality improvement by physical and chemical processes. University of Texas Press, Austin, pp. 149-166.
Drennan, D. G. and R. F. Malone. 1992. Design of recirculating systems for intensive tilapia culture. Paper presented at the Louisiana Aquaculture Conference and Trade Show, Baton Rouge, January 30-31, 1992.
Dupree, H. K and J. V. Huner. 1984. Propagation of black bass, sunfishes, tilapias, eels, and hobby fishes, in Dupree, H. K and J. V. Huner (eds.). 1984. Third report to the fish farmers. U. S. Fish and Wildlife Service, Washington, D. C., pp. 119-135.
Heinsbroek, L. T. N. and A. Kamstra. 1990. Design and performance of water recirculation systems for eel culture. Aquacultural Engineering 9: 187-207.

154
Hochheimer, J. N. and F. W. Wheaton. 1991. Understanding biofilters, practical microbiology for ammonia removal in aquaculture, in Northeast Regional Agricultural Engineering Service. Engineering Aspects of Intensive Aquaculture. Proceedings from the Aquaculture Symposium, Cornell University, April 4-6,1991, pp. 57-79.
Hopkins, T. A. and W. E. Manci. 1989. Feed conversion, waste andsustainable aquaculture, the fate of the feed. Aquaculture Magazine, 15(2):30-36.
Huguenin, J. E. and J. Colt. 1989. Design and operating guide for aquaculture seawater systems. Elsevier, New York.
James, A. (ed.). 1984. An introduction to water quality modelling. John Wiley and Sons, Chichester.
Kaiser, G. E. and F. W. Wheaton. 1983. Nitrification filters for aquatic culture systems: state of the art. J. World Maricul. Soc. 14: 302-324.
Knowles, G., A. L. Downing, and M. J. Barrett. 1965. Determination ofkinetic constants for nitrifying bacteria in mixed culture, with the aid of an electronic computer. J. Gen. Microbiol. 38:263-278.
Lewis, W. M. and G. L. Buynak. 1976. Evaluation of a revolving plate type biofilter for use in recirculated fish production and holding units. Trans. Am. Fish. Soc. 105(6):704-708.
Liao, P. B. and R. D. Mayo. 1974. Intensified fish culture combining water conditioning with pollution abatement. Aquaculture 3: 61-85.
Libey, G. S. 1993. Evaluation of a drum filter for removal of solids from a recirculating aquaculture system, in Wang, J. K.(ed.). 1993. Techniques for modem aquaculture. American Society of Agricultural Engineers, Michigan, pp. 519-532.
Libey, G. S. 1991. Maximizing nitrification with rotating biologicalcontactors. Paper presented a t the Workshop in Design of High Density Aquaculture Systems, Louisiana State University,September 25-27,1991.

155
Lightner, D., R. Redman, L. Mohney, G. Dickenson and K Fitzimmons.1988. Major diseases encountered in controlled environment culture of tilapias in fresh- and brackish-water over a three-year period in Arizona, in Pullin, R. S. V., T. Bhukaswan, K. Tonguthai and J. L. Maclean (eds.). 1988. The second international symposium on tilapia aquaculture. ICLARM, Manila, Philippines, pp. 111-119.
Lim, C. 1989. Practical feeding - Tilapias. in Lovell, T. Nutrition and feeding of fish. Van Nostrand Reinhold, New York, pp. 163-183.
Lomax, K M. and F. W. Wheaton. 1978. Pretreatment of fish culturewastewater for nitrification. Transactions of the ASAE 21(l):197-200.
Losordo, T. M. 1991. An introduction to recirculating production systems design, in Northeast Regional Agricultural Engineering Service. Engineering Aspects of Intensive Aquaculture. Proceedings from the Aquaculture Symposium, Cornell University, April 4-6,1991, pp.32-47.
Losordo, T. M., J. E. Rakocy, and M. P. Masser. 1992. Recirculatingaquaculture tank production systems. Southern Regional Aquaculture Center Publication No. 453, North Carolina Cooperative Extension Service, North Carolina State University.
Luquet, P. 1991. Tilapia, Oreochromis spp. in Wilson, R. P. (ed.). 1991.Handbook of nutrient requirements of finfish. CRC Press, Boca Raton, Florida, pp. 169-179.
Malone, R. F. and D. G. Burden. 1988. Design of recirculating blue crab shedding systems. Louisiana Sea Grant College Program, Louisiana State University, Baton Rouge.
Malone, R. F. and D. E. Coffin. 1991. Biofiltration and solids capture with low density bead filters. Paper presented a t the Workshop in Design of High Density Aquaculture Systems, Louisiana State University, September 25-27, 1991.
Malone, R. F., B.S. Chitta and D. G. Drennan. 1993. Optimizing nitrification in bead filters for warmwater recirculating aquaculture systems, in Wang, J. K.(ed.). 1993. Techniques for modem aquaculture. American Society of Agricultural Engineers, Michigan, pp. 315-325.
Manthe, D. P., R. F. Malone, and S. Kumar. 1988. Submerged rock filter evaluation using oxygen consumption criterion for closed recirculating systems. Aquacultural Engineering 7: 97-111.

156
McLaughlin, T. W. 1981. Hatchery effluent treatment, U.S. Fish and Wildlife Service, in Allen, L. J. and E. C. Kinney (eds.). 1981. Proceedings of the bio-engineering symposium for fish culture. Fish Culture Section of the American Fisheries Society, Bethesda, Maryland, pp. 167-173.
Meske, C. 1985. Fish aquaculture: technology and experiments. Pergamon Press, Oxford, (edited and translated by F. Vogt).
Miller, G. E. and G. S. Libey. 1985. Evaluation of three biological filters suitable for aquacultural applications. J. World Maricul. Soc.16: 158-168.
Mudrak, V. A. 1981. Guidelines for economical commercial fish hatchery wastewater treatment systems, in Allen, L. J. and E. C. Kinney (eds.). 1981. Proceedings of the bio-engineering symposium for fish culture. Fish Culture Section of the American Fisheries Society, Bethesda, Maryland, pp. 174-182.
Muir, J. F. 1982. Recirculated water systems in aquaculture, in Muir, J. F. and R. J. Roberts (eds.). 1982. Recent advances in aquaculture. Croom Helm, Ltd., London, pp. 356-446.
Nijhof, M. and J. Bovendeur. 1990. Fixed film nitrification characteristics in sea-water recirculation fish culture systems. Aquaculture 87:133-143.
Page, J. W. and J. W. Andrews. 1974. Chemical composition of effluent from high density culture of channel catfish. Water, Air, and Soil Pollution, 3:365.
Parker, N. C. 1981. An air-operated fish culture system with water-reuse and subsurface silos, in Allen, L. J. and E. C. Kinney (eds.). 1981. Proceedings of the bio-engineering symposium for fish culture. Fish Culture Section of the American Fisheries Society, Bethesda, Maryland, pp. 131-137.
Parker, N. C. and K. B. Davis. 1981. Requirements of warmwater fish, in Allen, L. J. and E. C. Kinney (eds.). 1981. Proceedings of the bio-engineering symposium for fish culture. Fish Culture Section of the American Fisheries Society, Bethesda, Maryland, pp. 21-28.
Petersen, R. G. 1985. Design and analysis of experiments. Marcel Dekker, Inc., New York.

157
Petit, J . 1990. Water supply, treatment, and recycling in aquaculture, in Bamab6, G. (ed.). 1990. Aquaculture Volume 1. Ellis Horwood,New York, pp. 65-196.
Rogers, G. L. and S. L. Klemetson. 1985. Ammonia removal in selected aquaculture water reuse biofilters. Aquacultural Engineering 4: 135-154.
Ruane, R. J., T. Y. Chu and V. E. Vandergriff. 1977. Characterization and treatment of waste discharged from high-density catfish cultures. Water Research, 11:789-800.
Russo, R. C. and R. V. Thurston. 1991. Toxicity of ammonia, nitrite, and nitrate to fishes, in Brune, D. E. and J. R. Tomasso. (eds.). 1991. Aquaculture and water quality. World Aquaculture Society,Baton Rouge, pp. 58-89.
SAS Institute, Inc. 1988. SAS/STAT™ user’s guide, release 6.03 edition. SAS Institute, Inc., Cary, North Carolina.
SAS Institute, Inc. 1984. SAS/ETS user’s guide, version 5 edition. SAS Institute, Inc., Cary, North Carolina.
Sawyer, C. N. and P. L. McCarty. 1978. Chemistry for environmental engineering. McGraw-Hill Publishing Company, New York.
Sharma, B. and R. C. Ahlert. 1977. Nitrification and nitrogen removal. Water Research 11:897-925.
Stickney, R. R. 1979. Principles of warm water aquaculture. Wiley Interscience, New York.
Suresh, A. V. and C. K. Lin. 1992. Effect of stocking density on waterquality and production of red tilapia in a recirculated water system. Aquacultural Engineering 11: 1-22.
Thomasson, M. P. 1991. Nitrification in fluidized bed sand filters for use in recirculating aquaculture systems. M.S. Thesis, Department of Civil Engineering, Louisiana State University, Baton Rouge, Louisiana.
Tchobanoglous, G. and F. L. Burton. 1991. Wastewater engineering: treatment, disposal and reuse. 3rd ed. Metcalf and Eddy, Inc.New York, McGraw-Hill Publishing Company.

158
Van Gorder, S. 1991. Optimizing production by continuous loading ofrecirculating systems. Paper presented a t the Workshop in Design of High Density Aquaculture Systems, Louisiana State University, September 25-27, 1991.
Weng, C. and A. H. Molof. 1974. Nitrification in the biological fixed-film rotating disk system. Journal Water Pollution Control Federation. 46: 1675-1685.
Westerman, P. W., T. M. Losordo and M. L. Wildhaber. 1993. Evaluation of various biofilters in an intensive recirculating fish production facility. in Wang, J. K.(ed.). 1993. Techniques for modem aquaculture. American Society of Agricultural Engineers, Michigan, pp. 326-334.
Wheaton, F. W. 1977. Aquacultural Engineering. John Wiley & Sons,New York.
Wheaton, F. W., J. N. Hochheimer, G. E. Kaiser. 1991a. Fixed film nitrification filters for aquaculture, in Brune, D. E. and J. R. Tomasso. (eds.). 1991. Aquaculture and water quality. World Aquaculture Society, Baton Rouge, pp. 272-303.
Wheaton, F. W., J. N. Hochheimer, G. E. Kaiser, and M. J. Krones. 1991b. Principles of biological filtration, in Northeast Regional Agricultural Engineering Service. Engineering Aspects of Intensive Aquaculture. Proceedings from the Aquaculture Symposium, Cornell University, April 4-6, 1991, pp. 1-31.
Wimberly, D. M. 1990. Development and evaluation of a low-density media biofiltration unit for use in recirculating finfish culture systems. M.S. Thesis, Department of Civil Engineering, Louisiana State University, Baton Rouge, Louisiana.
Wortman, B, and F. Wheaton. 1991. Temperature effects on biodrum nitrification. Aquacultural Engineering 10:183-205.

APPENDIX A: Tabulations o f Raw Data for System I

160
System I Acclimation
Day TAN N02-N Temp DO pH Amb. Tmg/L mg/L C mg/L C
1 12.44 11 .550 27.9 7 .36 29.32 11.07 11 .900 28.0 7 .40 29.73 10.92 11 .870 28 .0 7.41 29 .44 6 .90 14 .830 28.0 7 .43 29.35 0 .08 2 1 .670 29 .4 7 .4 4 29.16 0 .0 4 2 1 .330 30.1 7 .53 28.77 0 .02 9 .700 30 .2 7 .17 28.88 0 .00 0 .1 5 0 29.8 7 .30 8 .50 29.39 0 .00 0 .003 30.9 7 .20 8.51 29.010 0 .06 0.001 31 .2 7.21 8 .55 28.011 0 .02 0.001 29.9 7 .70 8 .72 28.711 2.98 0 .0 0 4 (Spiked with NH4CI)12 2 .14 0 .138 30.3 7 .74 8.65 29.113 0.01 0 .137 30 .6 7 .69 8.55 29.314 0 .02 0 .005 31 .2 7.71 8 .69 29 .415 0 .06 0 .002 31.3 7.41 8.58 29.916 0 .02 0 .002 30.5 7.59 8.71 29.117 0 .00 0 .0 0 2 30 .4 7.61 8 .67 28.918 0 .02 0 .0 0 4 30.8 7.55 8.48 29.219 0 .02 0 .0 0 4 30.5 7.61 8 .5 4 29 .020 0 .02 0 .0 0 4 30.3 7 .58 8 .57 28.821 0.01 0 .003 31 .0 7 .82 8 .67 29.822 0 .00 0 .006 30 .4 7.75 8 .48 30.023 0.01 0 .0 0 4 30.3 7 .80 8.61 30.124 0 .02 0 .002 30.3 7 .60 8 .60 30.225 0 .02 0 .002 30.2 7 .70 8 .59 30.1
Mean 29.947 7 .103 8 .596 29.116Std. Dev. 1.153 1.681 0 .087 0 .410
n 25 25 18 25
Note: 39.1 g NH4CI w as added daily to simulate 2mg TAN/L, until thesystem w as stocked with fish on Septem ber 17, 1993.

System I Daily Data
Date Day No. Feed, kg Temp., C DO, mg/L PH TAN, mg/ N02-N,i9/19/93 1 0.05 28.7 7.23 8.76 0.02 0.004
20 2 0.05 29.2 7.19 8.61 0.04 0.00521 3 0.05 29.9 6.63 8.53 0.06 0.00722 4 0.05 30.1 6.96 8.69 0.02 0.00523 5 0.05 30.3 7.01 8.18 0.03 0.00824 6 0.0525 7 0.1 30.1 7.11 8.52 0 .06 0.00626 8 0.1 29.9 7.17 8.47 0.1 0.00827 9 0.2 2 9 . 7.21 8.68 0.08 0.01628 10 0.3 27.6 7.71 8.65 0.07 0.01229 11 0.4 27.4 7.81 8.34 0.1 0.0430 12 0.4 28.4 7.4 8.49 0.12 0 .136
10/01 13 0.4 28.4 7 8.44 0.12 0.0682 14 0.4 28.5 7.1 8.48 0.12 0.0543 15 0.6 28.9 7.2 8.47 0.12 0.0514 16 0.6 29.9 6.4 8.26 0.14 0.0525 17 0.6 30.1 6.7 8.3 0.19 0.0566 18 1.2 30.1 6.1 8.12 0.21 0.0417 19 1.2 29.5 6.4 8.1 0.26 0.0968 20 1.2 30.2 6.5 8.12 0.25 0.0719 21 1.2 30.1 6.2 8.1 0.25 0.07310 22 1.2 29.8 6.5 8.12 0.25 0.08111 23 1.2 29.4 5.4 8.11 0.26 0.09212 24 1.2 28.4 7.2 8.17 0.25 0.08713 25 1.2 28.7 6.7 8.2 0.25 0.06614 26 1.2 29.7 6.4 8.04 0 .33 0.08715 27 1.4 30 6.2 8.15 0.37 0.15916 28 1.4 30.1 5.6 7.85 0.42 0.15517 29 1.4 30.1 6.1 8.07 0 .44 0.13818 30 1.4 30.3 6.1 8.12 0.45 0.22519 31 1.4 30.6 5.8 7.96 0 .46 0.15820 32 1.4 30.5 5.8 8.14 0.47 0.15621 33 1.4 30.6 6.1 8.17 0.45 0.15922 34 1.4 28.1 6.5 8.17 0.46 0.16623 35 1.4 27.2 6.4 8.14 0.46 0.1824 36 1.4 28.4 6.4 8.14 0.52 0.197
NTU0.2
P1.p*i8
P2, psl Q (bf, Lp Q rbc, Lp Backwash Notes6
102
97
99
102
196
0.4
0.5
0.6
8.1
0.8
17.3
10
11
11
11
12
11
7
7
198.1
196.8
194.6
190.4
185.8
170.3
169.8
161.4
155.7
156.6
109.2
109
106.8
102.6
189.8 103.4
98.4
91.8
90.7
86.7
84.3
83.4
0.8
Yyyyyyyyyyyyyyyyyyyyyyyyyyyyyyyyyyyy
03Table cont'd. |—‘

System I Dally Data
Date Day No. Feed, kg Temp., C DO, mg/L pH TAN. mg/ N02-N, i25 37 1.4 29 5.8 8.14 0.48 0.17226 38 1.427 39 1.428 40 1.8 30.3 5.5 8.16 0.57 0.19829 41 1.8 29.2 5.8 8.19 0.64 0.35430 42 1.8 27 6.5 8.24 0.62 0.27831 43 1.8 30.9 4.8 8.13 0.76 0.239
11/01 44 1.8 30.3 5.7 8.21 0.68 0.2022 45 1.8 30.2 5.7 8.19 0.68 0.1873 46 1.8 31.2 5.4 8.14 0.71 0.1794 47 1.8 32 5.2 8.08 0.72 0.1515 48 1.8 32.7 4.7 8.13 0.73 0.1896 49 1.8 30.7 5.7 8.26 0 .8 0.2017 50 1.8 28.9 5.9 8.21 0.82 0.2118 51 1.8 29.7 5.3 8.19 0.87 0.2279 52 1.8 30.6 5.5 8.21 0.77 0.17810 53 1.8 30.7 5.2 8.1 0.79 0.17111 54 1.8 30.7 5.2 8.11 0.83 0.17412 55 2 31.1 5.4 8.08 0.84 0.13113 56 2 32.7 4.8 8.13 0.87 0.15614 57 2 32.4 5 8.09 0.93 0.1715 58 2 33 4.9 8.11 0.91 0.20416 59 2 31.9 4.8 8.09 0.9 0.15517 60 2 32 6.3 8.11 0.94 0.16718 61 2 30.7 6.5 8.17 0.83 0.14819 62 2 31 5.1 8.09 0.85 0.14420 63 2 30.8 5.1 8.11 0.86 0.14621 64 2 29.6 6.2 8.08 0.91 0.1522 65 2 29.7 5.3 8.3 0.91 0.21123 68 2 30.1 5.3 8.15 0.97 0.23824 67 2 30.7 5 8.07 1.04 0.27725 68 2 30.7 5.2 7.94 0.95 0.18826 69 2 30.6 5.2 7.94 0.93 0.2227 70 2 29.8 5.3 7.81 0.92 0.22228 71 2 29.4 5.2 7 .98 0.96 0.23729 72 2 29.7 5.1 7.97 1.02 0.21130 73 2 30.2 4.9 7.69 1.01 0.241
12/01 74 2 30.4 4.9 8.31 1.01 0.2432 75 2 31 4.5 7.88 1.04 0.273
189
0.8
186
183
NTU P1,psl P2, psl Q fbf, Lp Q rbc, Lp Backwash Notes 12 8 158.3 84.2 y
YV f y y
12 8 159.3 82.8 yy y y
12 8 158.3 85.4 yy y
12 8 158.6 83.2 yy y
13 8 151.2 80.9 yy y
13 8 148.4 78.3 yy y y y y y
13 8 147.8 79.3 yy 0
13 8 146.1 77.41.4
0.7
24819-2 13 8 150.7 80
1.2
103 13 8 148.3 78.4
28.3
112 8 149.4 78.2
Table cont'd.
162

System I Dally Data
Date Day No. Feed, kg Temp., C DO, mg/L3 76 2 31.4 4 .64 77 2 32.2 4.7S 7 8 2 30.6 4.9a 79 2 30.3 4.77 80 2 30.1 4 .88 81 2 30.6 4.69 82 2 30.9 4.710 83 2 31.3 4.811 84 2 30.7. 4.612 85 2 29.9 4.813 86 2 30.9 4.714 87 215 88 2 29.8 5.216 89 2 29.9 4.917 90 2 30.1 5.318 91 219 92 220 93 2 30.9 4.621 94 222 95 2 28.8 5.1
1/10/94 114 2 27.3 5.911 115 3 28.6 4.812 116 3 29.2 4 .613 117 3 29.6 4.514 118 3 30.2 4.415 119 3 30.2 4.916 120 3 29.9 4 .317 121 3 31.1 4.118 122 3 29.9 4.219 123 3 29.3 4.520 124 3 29.4 4.121 125 3 30.3 4.522 126 3 29.9 4.123 127 3 30.2 4.124 128 3 30.6 3.925 129 3 30.8 3.820 130 3 31.5 4.227 131 3 31.9 4.128 132 3 31.2 4
PH TAN, mg/ N02-N, m Aik., mg/L N03-N, m NTU7.66 1.12 0.2727.6 1.09 0.404
7.81 1.11 0.4067.77 1.04 0.4447.84 1.12 0.3067.72 1.07 0.34 1.17.86 1 0.3028.33 1.08 0.39 1567.43 1 0.4327.39 1.04 0.5467.54 1.04 0.554
7.41 1.04 0.336 170 1.17.54 1.08 0.5767.39 0.92 0.432
7.51 0.9 0.614 177
7.31 0.86 0.662 66.2 .0.97.59 0.88 0.562 1.17.74 2.12 4.64 1857.7 2.03 4.72
7.71 1.98 4.027.69 1.8 3.28 2.17 .84 1.09 3.67.94 1.16 5.66 4.47.91 1.15 5.268.03 0.97 4.58 1.67.84 0.92 1.42 62.48.01 1 2.588.02 1.05 28.05 1 2.44 1.48.09 1.07 2.528.12 1.09 1.66 2068.1 1.01 1.54 76 1.3
8.13 1.14 1.587.65 1.14 1.448.15 1.01 1.26 1.3
P l.p si P2, psl Qfbf, Lp Qrbc, Lp Backwash Notes
13 8 147.3 75.4
yy
14 9 147 74.7
yy
14 9 147.4 78.2 y14 8 146.7 77.3
15 9 144.6 75.6
yy
15 8 144.1 71.2
13 8 146.3 76.414 8 144.7 74.6
15 8 144.07 66.7
15 9 132.33 64.6116 9 130.14 53.4716 9 128.04 55.7116 9 127.4 57.2316 8 131.33 64.9515 9 129.33 55.6615 8 126.72 56.0515 9 133.67 63.3417 10 128.33 5218 12 124.67 64.9118 11 126.87 68.2 y
Table cont'd.
163

System 1 Dally Data
Date Day No. Feed, kg Temp., C DO, mg/L PH29 133 3 30.3 4 .4 8.1230 134 3 29.9 3.9 8.131 135 3 30.1 3.7 8.09
2/01/94 136 3 29.9 3.7 8.182 137 3 29.6 3.9 8.173 138 3 29.7 3.8 8.124 139 3 30.2 3.7 8.15 140 3 31.9 3.9 8.136 141 3 32.3 3.9 87 142 3 32.2 3.6 8.018 143 3 32.5 3.5 8.099 144 3 32.8 3.9 8.0110 145 3 31.5 3.7 8.0311 146 3 29.5 3.8 8.0112 147 3 29.4 3.7 7.9413 148 3 30.4 3.8 7.9314 149 3 29.6 3.6 7.9715 150 3 29.8 3.6 7.9516 151 3 30.5 3.9 7.9417 152 3 30.4 3.8 7.918 153 3 30.8 3.7 7.8119 154 3 31.4 3.4 7.820 155 3 30.7 3.6 7.7221 156 3 32 3.3 7.6622 157 3 31.8 3.5 7.623 158 3 31.8 4.1 7.6724 159 3 29.9 3.7 7.4725 160 3 29.8 3.7 7.3926 161 3 30.2 3.8 7.4927 162 328 163 3 29.7 3.6 7.34
3/01/94 164 3 31.1 3.6 7.292 165 3 30.8 3.2 7.213 166 3 29.5 3.5 7 .384 167 3 30 3.6 7.415 168 3 30.5 3.6 7.396 169 37 170 3 31.4 3.2 7.218 171 3 31.6 3.1 7.06
AN, mg/ N02-N, m Aik., mg/L N03-N, m NTU1.21 0.96 1961.09 0.58 1.20.97 0.685 1.21.03 0.65 1.11.04 0.78 1.11.09 0.7450.89 0.825 11.09 0.585 204 10.64 0.665 1.10.84 0.48 1.10.7 0.685 1.2
0.79 0.54 1.10.69 0.465 10.83 0.45 57 10.77 0.48 196 11.15 0.745 10.71 0.53 29 11.15 0.420.75 0.48 10.85 0.445 . 1-10.72 0.375 1.40.8 0.4 202 1.3
0.86 0.42 1.30.81 0.475 1.30.89 0.48 1.40.47 0.2880.76 0.45 1.10.69 0.585 1.20.73 0.53 164 1.3
0.76 0.595 1.51.07 0.69 156 1.61.07 0.7 1.40.9 0.595 43 1.41.1 0.65 1.4
1.08 0.62 1.3
1.13 0.71 1.11.12 0.885 106 1.3
PI. P»l P2, psl Qfbf.Lp Q rbc, Lp Backwash Notes18 12 127.33 6118 12 128.67 59 y 118 12 125.67 57.3518 13 124.4 57.73 y20 13 120.3 58.1918 • 14 122.7 52.94 y22 14 116.43 66.2520 13 122.36 58.03 Y18 12 128.4 60.73 m18 12 123.4 56.73 y nIB- 12 127.03 56.8618 13 124.4 58.93 y20 14 119.87 50.34 o20 13 120.97 57.15 y P18 13 126.04 56.420 14 120.06 56.4 y22 14 114.69 56.78
y20 7 121.88 64.72 V q14 8 132.12 68.67 y14 8 130.59 66.24 y14 8 128.67 68.33 y r13 7 131.67 69.67 y12 7 126.67 71.33 y12 7 128.33 70.67 y
y s12 7 132.59 69.38 y12 7 130.14 70.33 y13 7 128.33 74.18 y
y12 7 y12 8 132.1 69.27 y t12 7 127.56 65.86 y12 8 121.88 60.18 V12 7 133.23 69.64 y13 8 131.49 68.93 y
y14 8 127.56 65.86 y14 8 128.31 66.24 y
Table cont'd.
164

System I Dally Data
Date Day No. Feed, kg Temp., C DO, mg/L PH9 172 3 31.9 3 7 .2810 173 3 30 3.6 7 .4411 174 3 29.8 3.8 7.512 175 3 30.4 4.6 7.4913 176 3 30.7 4.6 7.0714 177 3 31.1 3.5 7.3216 178 3 31.4 3.8 7.3616 179 3 31.9 3.9 7.4417 180 3 30.6 4.9 7.2418 181 3 31.1 4.1 7.2819 182 320 183 321 184 3 31.9 4.2 7.2322 185 3 31.8 4.2 7.2823 186 3 32 4.2 7 .3624 187 3 32.8 4.4 7.2725 188 3 32.3 4.4 7.1126 189 327 190 328 191 3 31.5 4.8 7.4129 192 3 29.9 5.6 7.3130 193 3 30.2 6.2 7.3731 194 3 30.5 5.2 7.27
4/01 195 32 196 33 197 34 198 3 31.1 4.2 7.035 199 3 31.8 4 7.376 200 3 31.9 3.8 7.57 201 3 30.4 4.1 7.318 202 3 30.2 4.4 7.499 203 3 31 4.3 7.5410 204 3 31.8 4.3 7.4411 205 3 30 1.9 7.612 206 3 32.4 3.6 7.5713 207 3 31.8 3.9 7.5714 208 3 31.8 3.9 7.5615 209 3 . 32.7 5.5 7.9316 210 3 32.5 5.6 7 .88
TAN, mg/ N02-N, m Aik., mg/L N03-N, m NTU1.16 0.67 1.21.33 0.605 162 1.41.03 0.7 1.41.05 0.67 1.31.06 0 .56 142 1.41.1 0.6 1.6
1.14 0.705 1.61.05 1.331.15 1.56 1.61.12 0.97 1.3
1.21 0.985 146 1.41.13 1.05 1.21.05 1.635 661.14 2.01 1.61.17 2 134 1.4
1.09 2.18 1.30.85 1.975 1.30.94 2.07 1.40.94 2.16 1.1
1.23 2.16 122 1.60.99 2.48 1.30.98 2.38 1.41.03 2.46 1.21.06 4.34 1.30.98 4.74 1.21.01 4.64 1.32.14 6.45 186 400.98 9.61.04 7.075 162 1.31.16 4.8251.2 2.55
1.05 1.9 1.6
Table cont'd.
P l.p sl P2, psi Qfbf.Lp Q rbc, Lp Backwash Notes14 8 128.16 66.09 y14 8 127.36 65.78 y14 8 126.68 65.41 y U14 8 127.43 65.77 y13 8 133.99 66.24 y13 8 130.69 66.8 y13 8 129.16 65.87 y
y14 8 190.76 126.04 y14 8 193.03 127.55 y
yy
14 8 193.1 127.62 y14 8 193.37 127.81 y V14 8 126.79 65.33 Y14 8 127.81 65.89 y13 8 127.5 65.79 y
yy
14 8 127.23 65.74 Y14 8 127.14 65.76 y14 8 127.22 65.73 y14 8 127.19 65.59 y
yyy
14 7 127.5 65.68 y13 8 128.89 66.15 y14 8 128.31 66.2 y14 8 128.19 66 y14 8 128.1 66.05 y14 8 127.35 65.73 y14 8 127.47 65.79 y
yy
wX
16 10 126.32 65.12 y18 9 125.48 65.08 y16 10 125.04 64.9 y18 10 125.02 65.48 y
165

System I Daily Data
Date Day No. Feed, kg Temp., C DO, mg/L pH17 211 318 212 3 30.9 5.9 7.8719 213 3 31.2 5.7 7.7820 214 3 31.3 5.5 7.7221 215 3 31.7 5.7 7.6622 216 3 31.7 5.2 7.6223 217 324 218 325 219 3 32.5 5.3 7.6226 220 3 32.8 5.7 7.6827 221 3 33.6 4.3 7.6728 222 3 33.3 5.3 7.7329 223 3 31.5 5.8 7.7630 224 3 32 6.3 7.79
5/01 225 3 31.4 5.6 7.662 226 3 30.7 5.5 7.663 227 3 31.2 5.8 7.734 228 3 31 5.3 7.75 229 3 30.8 5.5 7.726 230 3 30.7 5.3 7.727 231 3 31 5.4 7.848 232 3 31.9 5 7.749 233 3 32.5 4.8 7.710 234 0.75 30.1 3.3 7.6711 235 3 30.9 6.4 7.8312 236 3 31.1 5.8 7.6713 237 3 31.3 5.7 7.714 238 3 31.3 5.3 7.7715 239 3 30.9 5.7 7.7116 240 3 32.3 4.9 7.5417 241 3 32.4 5 7.6518 242 3 31.6 5.5 7.8219 243 3 31 5.1 7.7120 244 3 30.2 5.7 7.6421 245 3 30.2 6 7.6222 246 3 30.7 5.5 7.8423 247 3 30.8 5.4 7.81
TAN, mg/ N02-N, m Aik., mg/L N03-N, m NTU
0.95 3.76 1880 .95 3.35 110 1.70.91 2.88 1.40 .82 2.49 1.31.06 3.66 1.9
1.03 3.325 1.41.04 3.225 11.07 4.38 1.11.26 8.25 222 1.31.12 6.15 1.30.86 3.7 10.93 2.275 1.80 .98 2.58 232 73 1.21.28 2.725 1.31.46 2.3 1.81.7 1.74 1.9
1.37 1.34 202 1.21.3 1.22 1.3
1.25 1.38 1.61.17 1.51 1.15.9 2.525 174 141
0.75 2.35 0.70.76 0.94 10.71 1.27 216 10.7 0.98 1.1
0.71 0.77 1.10.87 0.78 146 1.10 .94 1.03 1.21.03 0.91 1.10.99 0.7 1.20 .94 0.65 1.10 .97 0.58 1.11.27 1.135 24 1.31.19 1.045
PI, psl P2, psl Q fbf, Lp Q rbc, Lp Backwashy
15 9 127.11 65.51 y18 10 124.93 64.35 y16 9 125.93 64.77 y16 10 126.61 65.33 y18 10 124.55 64.39 y
yy
17 10 126.67 65.38 y17 11 125.61 64.96 y20 11 102.94 65.97 y20 12 101.27 55.27 y24 14 74.78 44.21 y22 14 y22 14 y24 18 78.61 45.02 y26 14 64.15 36.99 y29 16 56.72 39.76 y30 20 45.69 28.89 y32 18 45.56 29.39 y30 16 62.62 32.74 y27 15 56.54 28.09 y24 16
1396.43 49.15 y
y19 11 116.56 67.23 y19 12 114.79 54.23 y21 14 111.6 61.67 y22 13 128.87 77.14 y22 14 128.79 77.79 y24 15 109.71 66.63 y27 15 87.51 54.21 y28 16 78.99 44.2 y27 16 90.12 53.97 y27 16 85.54 48.44 V28 17 80.11 50.59 y32 19 48.2 24.83 y32 19 y
Table cont'd.
166

System IDaily Data
NOTES: a 132 fish; 5.5. kg; 30-sec propwash, backwash dailyb 411 fish; 13.2 kgc 393 fish; 12.7 kgd Started sodacarbe Blower down for 7 hoursf 479 fishg Start 30-sac propwash, bacwash every 2 daysh 640 fishi Lass 1 fishj 2 kg feed until 1/09/94k Less 1 fish1 Less 1 fishm Lets 1 fish; flushed BBC tankn Less 1 fisho Less 1 fishp Less 1 fishq Replaced 30% of system volume; begin 30-sec propwash, backwash dailyr Less 1 fishs Misfeed; 0.75 kg onlyt Less 1 fishu Begin oxygenv Replaced 30% of system volume; begin 45-sec propwash, backwash dailyw Water pump down for 7 hours; flushed RBC tank -I- 3 sludge volumesx Begin MINO-SAVER Aeratory Replaced 30% of system volume; begin 20-sec propwash, backwash dailyz Less 1 fish
aa Less 1 fishab Water pump down for 7 hours; flushed RBC tank + 3 sludge volumes; 0.75 kg feed only
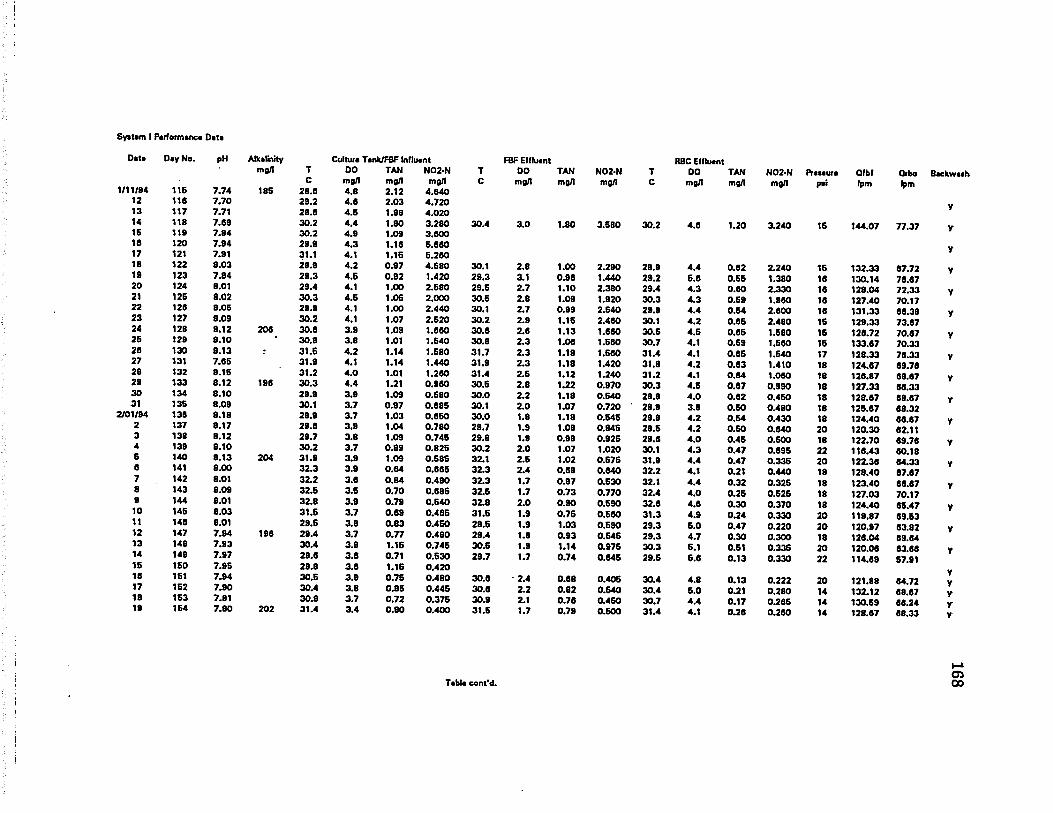
Syatem 1 Performance Data
Dete Day No. pH Alkalinity Culture Tank/raF Influent FBPEffhmg/1 T DO TAN N02-N T DO
C mg/1 mg/1 mg/1 C mg/11/11/94 116 7.74 185 28.8 4.8 2.12 4.840
12 118 7.70 29.2 4.6 2.03 4.72013 117 7.71 29.8 4.5 1.98 4.02014 118 7.69 30.2 4.4 1.80 3.280 30.4 3.0IS 119 7.84 30.2 4.9 1.09 3.80018 120 7.94 29.9 4.3 1.16 6.88017 121 7.91 31.1 4.1 1.16 5.28018 122 8.03 29.9 4.2 0.97 4.680 30.1 2.819 123 7.84 29.3 4.5 0.92 1.420 29.3 3.120 124 8.01 29.4 4.1 1.00 2.680 29.6 2.721 125 8.02 30.3 4.6 1.06 2.000 30.6 2.822 128 8.06 28.9 4.1 1.00 2.440 30.1 2.723 127 8.09 30.2 4.1 1.07 2.620 30.2 2.924 129 8.12 208 30.8 3.9 1.09 1.680 30.6 2.626 129 8.10 * 30.8 3.8 1.01 1.640 30.8 2.328 130 8.13 : 31.6 4.2 1.14 1.680 31.7 2.327 131 7.65 31.9 4.1 1.14 1.440 31.9 2.328 132 8.16 31.2 4.0 1.01 1.260 31.4 2.629 133 8.12 198 30.3 4.4 1.21 0.960 30.6 2.830 134 8.10 29.9 3.9 1.09 0.680 30.0 2.231 136 8.09 30.1 3.7 0.97 0.885 30.1 2.0
2/01/94 138 8.18 29.9 3.7 1.03 0.850 30.0 1.82 137 8.17 29.8 3.9 1.04 0.780 29.7 1.93 138 8.12 29.7 3.8 1.09 0.745 29.8 1.94 139 8.10 30.2 3.7 0.89 0.825 30.2 2.06 140 8.13 204 31.9 3.9 1.09 0.685 32.1 2.66 141 8.00 32.3 3.9 0.64 0.685 32.3 2.47 142 8.01 32.2 3.6 0.84 0.480 32.3 1.78 143 8.09 32.6 3.6 0.70 0.885 32.6 1.79 144 8.01 32.8 3.9 0.79 0.640 32.8 2.010 145 8.03 31.5 3.7 0.69 0.465 31.6 1.911 148 8.01 29.6 3.8 0.83 0.450 29.6 1.912 147 7.94 196 29.4 3.7 0.77 0.480 29.4 1.813 149 7.93 30.4 3.8 1.16 0.745 30.6 1.914 149 7.97 29.6 3.6 0.71 0.630 29.7 1.7IS 160 7.95 29.8 3.6 1.16 0.42018 161 7.94 30.5 3.9 0.76 0.480 30.6 2.417 162 7.90 30.4 3.8 0.95 0.445 30.6 2.218 163 7.81 30.8 3.7 0.72 0.375 30.9 2.119 164 7.80 202 31.4 3.4 0.80 0.400 31.6 1.7
Table cont'd.
TAN N02-N TRBC Effluent
DO TAN N02-N Preaaure Qfbf Orbe Backweahmg/l mg/l C mg/l mg/l mg/l pai tpm Ipm
1.80 3.680 30.2 4.8 1.20 3.240 16 144.07 77.37
V
Y
Y
1.00 2.290 29.9 4.4 0.62 2.240 16 132.33 87.72 V0.98 1.440 29.2 6.6 0.66 1.380 16 130.14 76.671.10 2.380 29.4 4.3 0.60 2.330 16 128.04 72.33 y1.09 1.920 30.3 4.3 0.69 1.960 16 127.40 70.170.99 2.640 29.9 4.4 0.64 2.600 16 131.33 66.39 y1.16 2.460 30.1 4.2 0.66 2.480 16 129.33 73.671.13 1.680 30.6 4.6 0.66 1.580 16 126.72 70.67 y1.08 1.680 30.7 4.1 0.69 1.660 16 133.67 70.331.19 1.660 31.4 4.1 0.66 1.640 17 128.33 76.33 y1.18 1.420 31.8 4.2 0.63 1.410 18 124.67 69.761.12 1.240 31.2 4.1 0.64 1.060 18 126.87 68.67 y1.22 0.970 30.3 4.6 0.67 0.990 18 127.33 66.331.18 0.640 29.8 4.0 0.62 0.460 18 129.67 69.67 y1.07 0.720 29.9 3.8 0.60 0.480 18 126.67 68.321.18 0.646 29.8 4.2 0.64 0.430 18 124.40 66.67 y1.08 0.846 29.6 4.2 0.60 0.640 20 120.30 62.110.99 0.925 29.6 4.0 0.46 0.600 18 122.70 69.76 y1.07 1.020 30.1 4.3 0.47 0.696 22 116.43 60.181.02 0.676 31.9 4.4 0.47 0.336 20 122.36 64.33 y0.89 0.640 32.2 4.1 0.21 0.440 18 128.40 67.670.97 0.530 32.1 4.4 0.32 0.325 18 123.40 66.67 y0.73 0.770 32.4 4.0 0.26 0.626 18 127.03 70.170.90 0.690 32.6 4.6 0.30 0.370 18 124.40 66.47 y0.75 0.580 31.3 4.9 O M 0.330 20 119.87 69.631.03 0.690 29.3 6.0 0.47 0.220 20 120.97 63.82 y0.93 0.646 29.3 4.7 0.30 0.300 18 126.04 69.641.14 0.975 30.3 6.1 0.61 0.336 20 120.06 63.66 y0.74 0.645 29.6 6.6 0.13 0.330 22 114.69 67.91
0.68 0.406 30.4 4.8 0.13 0.222 20 121.98 64.72Vy
0.82 0.640 30.4 6.0 0.21 0.280 14 132.12 69.67 V0.76 0.460 30.7 4.4 0.17 0.265 14 130.69 68.24 y0.79 0.600 31.4 4.1 0.26 0.2 SO 14 129.67 68.33 V
0300

SyiUm I Psrformanc* O iti
Oat* OayNo. PH Alkalinity Cultura Tank/FBF Influant FBFEfllmg/l T DO TAN N02-N T DO
C mg/l mg/l mg/l C mg/l20 165 7.72 30.7 3.6 0.86 0.420 30.8 1.821 168 7.66 32.0 3.3 0.81 0.475 32.0 1.722 167 7.60 31.8 3.6 0.88 0.480 31.8 1.823 168 7.67 31.8 4.1 0.47 0.28824 168 7.47 28.8 3.7 0.76 0.460 30.0 1.826 180 7.38 28.8 3.7 0.68 0.686 28.8 2.120 161 7.48 164 30.2 3.8 0.73 0.630 30.3 2.127 16228 183 7.34 28.7 3.6 0.76 0.686
3/01/84 164 7.28 156 31.1 3.6 1.07 0.680 31.2 1.82 166 7.21 30.8 3.2 1.07 0.700 30.8 1.63 168 7.38 28.6 3.6 0.80 0.686 28.6 1.74 187 7.41 30.0 3.6 1.10 0.660 30.1 2.16 188 7.38 30.6 3.6 1.08 0.620 30.6 1.88 1687 170 7.21 31.4 3.2 1.13 0.710 31.6 1.68 171 7.06 106 31.6 3.1 1.12 0.886 31.7 1.38 172 7.28 31.8 3.0 1.16 0.670 3 2 0 1.310 173 7.44 162 30.0 3.6 1.33 0.606 30.0 1.811 174 7.60 28.8 3.8 1.03 0.700 28.8 2.112 176 7.48 30.4 4.6 1.06 0.670 30.4 2.713 176 7.07 142 30.7 4.8 1.06 0.660 30.8 2.714 177 7.32 31.1 3.6 1.10 0.600 31.2 1.816 178 7.36 31.4 3.8 1.14 0.706 31.4 1.818 178 7.44 31.8 3.8 1.06 1.33017 180 7.24 30.6 4.8 1.16 1.660 30.6 2.718 181 7.28 31.1 4.1 1.12 0.870 31.1 2.118 18220 18321 184 7.23 146 31.8 4.2 1.21 0.885 3 2 0 2.022 185 7.28 31.8 4.2 1.13 1.060 31.8 2.123 188 7.36 32.0 4.2 1.06 1.636 32.0 2.324 187 7.27 3 2 8 4.4 1.14 2.010 32.8 2.426 188 7.11 134 32.3 4.4 1.17 20 0 0 32.3 2.828 188 .27 18028 181 7.41 31.6 4.8 1.08 2.180 31.6 2.628 182 7.31 28.8 6.6 0.86 1.876 28.8 3.730 183 7.37 30.2 6.2 0.84 2.070 30.2 3.631 184 7.27 30.6 6.2 0.84 2.160 30.6 3.4
Table cont’d.
RBC EffluentTAN N02-N T DO TANmg/l mg/1 C mg/1 mg/l0.88 0.610 30.7 4.2 0.270.78 0.676 31.8 4.1 0.280.87 0.616 31.8 4.2 0.33
0.62 0.640 28.8 4.3 0.350.61 0.820 28.7 4.3 0.300.70 0.716 30.2 4.2 0.38
0.82 0.880 31.0 4.6 0.481.00 0.866 30.7 4.0 0.640.76 0.786 28.4 4.6 0,601.04 0.776 29.8 4.4 0.701.06 0.716 30.4 4.6 0.68
1.08 0.866 31.3 4.3 0.631.11 0.825 31.6 4.1 0.621.12 0.800 31.8 4.4 0.661.30 0.716 29.9 4.6 0.820.82 0.926 29.7 4.7 0.560.31 0.840 30.3 4.9 0.670.86 0.766 30.7 6.6 0.641.06 0.736 31.0 4.4 0.611.06 0.816 31.3 4.6 0.63
1.17 1.860 30.6 6.0 0.681.10 1.130 31.0 6.0 0.64
1.19 1.135 31.8 6.0 0.861.04 1.240 31.7 4.8 0.891.02 1.860 31.9 4.8 6.601.10 2.130 32.7 4.7 0.661.16 2.250 32.2 4.9 0.60
1.10 2.260 31.4 6.2 0.880.89 2.026 29.7 6.6 0.610.92 2.390 30.0 6.7 0.660.94 2.260 30.4 6.9 0.61
N02-N Praaaura Qfbf Or be Backwmg/l pal Ipm Ipm
0.245 13 131.67 69.67 y0.325 12 126.67 71.33 V0.340 12 128.33 70.67 V
y0.320 12 132.69 69.38 y0.410 12 130.14 70.33 y0.400 13
12
128.33 74.18 yVy
0.490 12 132.10 69.27 V0.486 12 127.66 66.86 y0.400 12 121.88 60.18 V0.606 12 133.23 69.64 y0.610 13 131.49 68.93 V
y0.616 14 127.66 66.86 V0.640 14 128.31 66.24 V0.496 14 128.16 66.09 y0.406 14 127.36 66.78 y0.486 14 126.68 66.41 y0.475 14 127.43 66.77 V0.460 13 133.99 66.24 V0.616 13 130.89 66.80 y0.610 13 129.16 66.87 V
V1.400 14 126.04 64.72 y0.785 14 127.65 66.48 y
yV
0.810 14 127.62 66.48 y0.660 14 127.81 66.66 V1.390 14 126.79 66.33 y1.666 14 127.81 66.89 y1.780 13 127.60 66.79 y
yy
1.840 14 127.23 65.74 y1.625 14 127.14 65.76 y1.810 14 127.22 65.73 V1.880 14 127.19 65.69 V
169

Syatam I Performance Data
Oi l D.y No. PH Alkalinity Cultura Tank/FBF Influant FBFEfftmg/1 T DO TAN N02-N T DO
C mg/l mg/l mg/l C mg/l4/01/94 195
2 1963 1974 198 7.03 122 31.1 4.2 1.23 2.160 31.1 2.8E 199 7.37 31.8 4.0 0.99 2.480 31.8 2.2S 200 7.50 31.9 3.8 0.98 2.380 32.0 1.97 201 7.31 30.4 4.1 1.03 2.460 30.4 2.48 202 7.49 30.2 4.4 1.06 4.340 30.2 2.79 203 7.54 31.0 4.3 0.98 4.740 31.1 2.610 204 7.44 31.8 4.3 1.01 4.640 31.9 2.511 205 7.60 186 30.0 1.9 2.14 6.45012 206 7.57 32.4 3.6 0.98 9.60013 207 7.67 162 31.8 3.9 1.04 7.076 31.9 1.814 208 7.56 31.8 3.9 1.16 4.825 31.8 1.815 209 7.93 32.7 6.6 1.20 2.660 32.8 2.916 210 7.88 32.5 6.6 1.05 1.900 32.6 3.217 21118 212 7.87 188 30.9 6.9 0.95 3.760 31.1 3.719 213 7.78 31.2 6.7 0.95 3.350 31.2 3.620 214 7.72 31.3 6.6 0.91 2.880 31.3 3.621 216 7.66 31.7 6.7 0.82 2.490 31.8 3.822 216 7.62 31.7 5.2 1.08 3.660 31.9 2.123 21724 21825 219 7.62 32.5 5.3 1.03 3.326 32.6 2.826 220 7.68 32.8 6.7 1.04 3.226 32.9 3.127 221 7.67 33.6 4.3 1.07 4.380 33.7 0.828 222 7.73 222 33.3 6.3 1.26 8.260 33.3 1.029 223 7.76 31.6 6.8 1.12 6.150 31.6 1.830 224 7.79 32.0 6.3 0.86 3.700
5/01/94 225 7.66 31.4 5.6 0.93 2.2762 226 7.66 232 30.7 E.E 0.98 2.680 30.8 1.23 227 7.73 31.2 6.8 1.26 2.726 31.3 1.64 228 7.70 31.0 6.3 1.46 2.300 31.1 1.35 229 7.72 30.8 6.6 1.70 1.740 31.0 2.66 230 7.72 202 30.7 6.3 1.37 1.340 30.8 1.67 231 7.84 31.0 6.4 1.30 1.220 31.1 1.68 232 7.74 31.9 6.0 1.26 1.380 32.0 1.29 233 7.70 32.5 4.8 1.17 1.610 32.6 1.2
Tabla cont'd.
TAN N02-N TBBC Effluent
DO TAN N02-N ftaaaura Ofbf Of be Backwaahmg/l mg/l C mg/l mg/l mg/l pai Ipm Ipm
V
1.16 2.320 30.9 4.8 0.66 1.960 14 127.60 66.68
Vyy
1.00 2.660 31.6 4.7 0.65 2.220 13 128.89 66.16 y0.90 2.620 31.8 4.6 0.62 2.280 14 128.31 66.20 y0.97 2.320 30.3 4.7 0.68 2.240 14 128.19 66.00 y1.00 4.300 30.0 6.0 0.68 4.060 14 128.10 66.06 y0.97 4.620 31.0 4.8 0.68 4.200 14 127.36 66.73 y1.07 4.660 31.7 4.6 0.69 4.340 14 127.47 65.79 y
y
1.05 6.776 31.7 4.1 0.60 6.176 16 126.32 66.12T
y1.29 5.176 31.6 4.9 0.70 4.762 18 126.48 66.08 y1.30 2.626 32.6 6.3 0.68 2.226 16 125.04 64.90 y1.09 1.920 32.4 4.7 0.66 1.640 18 126.02 66.48 V
0.92 3.840 30.9 6.0 0.66 3.160 IE 127.11 65.61Vy
0.83 3.660 31.0 6.8 0.65 3.080 18 124.93 64.35 y0.80 3.040 31.2 6.6 0.64 2.620 16 126.93 64.77 y0.82 2.680 31.6 4.9 0.61 2.360 16 126.61 66.33 y0.98 3.880 31.7 5.0 0.61 3.220 18 124.65 64.39 y
y
1.01 3.888 32.4 4.6 0.66 3.226 17 126.67 66.38iy
0.77 3.760 32.7 4.8 0.62 3.125 17 126.61 64.96 y1.06 6.400 33.6 4.2 0.65 4.860 20 102.94 66.97 y1.31 9.650 33.1 4.3 0.60 8.326 20 101.27 56.27 y1.09 6.800 31.4 6.0 0.66 6.000 24 74.78 44.21 y
22 y22 y
0.85 2.940 30.6 4.9 0.64 2.280 24 76.61 45.02 y1.31 2.725 31.1 6.0 0.69 2.026 26 64.16 36.99 y1.63 2.680 30.7 6.2 0.67 1.400 29 66.72 39.76 y1.78 1.800 30.6 6.4 0.60 0.940 30 46.69 29.89 y1.35 1.620 30.6 6.1 0.68 0.840 32 46.66 29.39 y1.23 1.420 30.7 6.1 0.60 0.760 30 62.62 32.74 y1.13 1.690 31.7 4.9 0.64 1.020 27 66.64 28.09 y0.92 1.890 32.3 4.6 0.63 1.140 24 96.43 49.15 y
-ao

Syatam I Parformanca Data
Data Day No. pH Alkalinity Cultura Tank/FBF Influantmg/l T DO TAN N02-N T
C mg/l mg/l mg/l C10 234 7.67 174 30.1 3.3 6.90 2.52511 235 7.83 30.9 6.4 0.76 2.350 31.012 236 7.67 31.1 5.8 0.76 0.940 31.213 237 7.70 216 31.3 6.7 0.71 1.270 31.414 238 7.77 31.3 5.3 0.70 0.980 31.6IE 239 7.71 30.9 6.7 0.71 0.770 31.0IS 240 7.64 146 32.3 4.8 0.87 0.780 32.417 241 7.65 32.4 5.0 0.94 1.030 32.418 242 7.82 31.6 5.6 1.03 0.910 31.619 243 7.71 31.0 6.1 0.99 0.700 31.120 244 7.64 30.2 6.7 0.94 0.650 30.321 245 7.62 30.2 6.0 0.97 0.680 30.622 248 7.84 30.7 6.6 1.27 1.135 30.823 247 7.81 30.8 6.4 1.19 1.045
ii
FBF Effluant RBC EffluentDO TAN N02-N T DO TAN N02-N ftaaaura Qfbl Or be
mg/t mg/l mg/l C mg/l mg/l mg/l pai Ipm Ipm
4.2 0.46 2.680 30.8 6.6 0.36 1.790 19 116.66 67.233.2 0.44 1.190 31.0 6.3 0.34 0.790 19 114.79 64.232.6 0.46 1.670 31.2 6.1 0.35 0.970 21 111.60 61.672.4 0.43 1.220 31.2 6.0 0.34 0.740 22 128.97 77.142.7 0.42 1.140 30.8 6.2 0.36 0.670 22 128.79 77.791.3 0.60 1.190 32.2 4.7 0.39 0.660 24 109.71 66.630.8 0.74 1.470 32.2 4.7 0.39 0.640 27 87.61 64.211.2 0.72 1.410 31.3 6.0 0.40 0.610 28 78.99 44.201.3 0.66 1.080 30.8 6.0 0.41 0.410 27 90.12 53.971.8 0.67 1.100 30.0 6.3 0.40 0.410 27 85.64 48.442.3 0.68 1.020 30.2 6.4 0.39 0.380 28 80.11 60.690.5 1.19 1.610 30.3 6.4 0.43 0.390 32
3248.20 24.83
Backwaah
Vyyvyyyyyyyyyv
M<!

S ystem I: Total Suspended Solids, mg/L
FBF-RBC System (Sludge Volume = 1 9 6 .2 L)
Date Backw ash FBF in FBF out RBC out Sludge Q fbf, L|
12 /1 1 /9 3 0 2 .2 812 0 1 .80 2 9 8 2 .0 013 0 2 .5 7 2 .8 7 2 .5 3 1 4 6 .716 0 1 .20 1 .3 3 1 .20 3 6 4 0 .0 0 1 4 4 .617 0 3 .8 020 0 2 .0 022 . 0 1 .2 0 1 .8 0 1 .80 3 0 4 0 .0 0 1 4 6 .312 1 2 .7 0 2 .6 7 2 .3 3 3 9 5 0 .0 0 146.116 1 7 .6 7 5 .6 7 4 .0 0 4 0 8 3 .3 0 1 3 7 .82 4 1 5 .4 7 5 .0 7 5 .6 0 3 0 0 6 .7 0 1 2 6 .726 1 5 .1 7 5 .1 3 5 .0 7 3 6 7 3 .3 0 1 2 8 .3
2 /0 5 /9 4 1 3 .6 7 3 .1 3 2 .9 7 3 1 1 3 .7 0 1 2 2 .413 1 5 .9 3 5 .8 0 5 .3 3 3 3 6 2 .3 0 1 2 3 .420 2 3 .1 0 2 .8 7 2 .6 7 2 3 1 2 .5 0 1 3 1 .725 2 2 .8 0 2 .7 3 2 .7 3 2 9 0 0 .0 0 130.1
3 /0 1 /9 4 2 4 .6 0 3 .6 7 3 .1 3 2 4 3 3 .3 3 132.17 2 2 .6 7 2 .5 0 2 .5 7 2 9 9 1 .7 0 1 2 7 .6
15 2 2 .4 7 1 .20 1 .40 2 8 1 1 .1 0 1 2 9 .218 2 6 .3 3 5 .8 7 5 .1 3 3 1 7 5 .0 0 1 2 7 .620 2 2 0 9 1 .6 7
4 /0 5 /9 4 3 1 0 .0 3 9 .4 8 2 .7 3 3 2 0 0 .0 0 1 2 8 .910 3 9 .6 7 9 .5 0 9 .3 3 2 8 6 7 .7 0 1 2 7 .518 3 6 .33 6 .0 2 4 .8 7 2 1 3 3 .3 3 127.125 3 5 .8 7 5 .3 3 4 .1 8 2 3 6 7 .7 0 1 2 6 .7
5 /0 5 /9 4 4 7 .3 0 4 .9 7 4.11 1 0 3 3 .3 3 4 5 .77 4 10 .7 0 7 .9 3 6 .7 8 1 0 0 6 .7 0 6 2 .69 4 9 .8 0 8 .5 7 8 .3 7 6 2 7 .8 0 9 6 .4
18 4 15 .30 13 .67 13 .3 3 8 4 2 .6 0 7 9 .0
B ackw ash:0 = 2 kg feed/day , 3 0 -sec propw ash, backw ash daily1 = 3 kg feed/day , 3 0 -sec propw ash , backw ash every 2 days2 = 3 kg feed/day , 3 0 -sec propw ash , backw ash daily3 = 3 kg feed /day , 4 5 -sec propw ash , backw ash daily4 = 3 kg feed/day , 20 -sec propw ash , backw ash daily

System I: 24-hour Data (1200 hrs 12/11 to 1200 hrs 12/12 /93 ; days 84-85)
Time pH TC
1200 7.43 30.61300 7.42 30.61400 7.38 30.71500 7.39 30.71600 7.36 30.71700 7.35 30.71800 7.36 30.71900 7.34 30.62000 7.31 30.62100 7.32 30.52200 7.33 30.52300 7.34 30.42400 7.34 30.4100 7.36 30.3200 7.36 30.3300 7.38 30.2400 7.39 30.2500 7.37 30.1600 7.46 30.0700 7.39 30.0800 .7.38 29.9900 7.39 29.91000 7.43 29.91100 7.42 29.91200 7.38 29.9
Culture Tank/FBF InfluentDO TAN N02-N
mg/L mg/l mg/L4.62 1.00 0.4324.71 1.08 0.4824.91 1.10 0.5403.60 1.14 0.5964.20 1.04 0.6004.40 1.26 0.6144.80 1.06 0.6343.59 1.22 0.6684.30 1.04 0.6544.60 1.25 0.6854.80 1.45 0.7155.50 1.06 0.7855.40 1.10 0.7255.30 1.00 0.6955.20 1.05 0.6755.10 0.95 0.6155.20 0.88 0.5525.10 0.80 0.5305.00 0.98 0.5064.20 1.06 0.5204.70 1.06 0.4944.80 1.04 0.5465.10 1.12 0.5144.30 1.16 0.5044.50 1.10 0.502
FBF EffluentDO TAN N02-N
mg/L mg/L mg/L3.32 0.93 0.4923.69 1.04 0.5103.61 1.04 0.5681.60 0.94 0.6162.60 1.00 0.6502.80 1.18 0.6703.38 0.98 0.6841.68 0.98 0.7602.50 0.90 0.6902.80 1.20 0.7152.90 1.30 0.7953.70 1.02 0.8383.70 0.85 0.7553.90 0.85 0.7203.60 0.95 0.7553.20 0.90 0.6403.90 0.80 0.5983.90 0.78 0.6023.70 0.94 0.5761.90 0.98 0.5962.80 1.06 0.5743.20 1.02 0.5644.40 1.10 0.5323.00 1.12 0.5423.60 1.08 0.518
Ratio ofRBC Effluent TAN Actual to
DO TAN N02-N Qrbc Quv Excretion Meanmg/L mg/L mg/L Lpm Lpm g/kg fd-d Excretion5.01 0.45 0.404 74.71 72.11 33.220 1.0995.10 0.50 0.468 74.71 72.11 33.276 1.1015.10 0.76 0.540 74.71 74.71 21.516 0.7124.30 0.46 0.552 74.71 72.11 46.962 1.5544.80 0.48 0.550 75.23 71.30 32.386 1.0725.10 0.54 0.572 75.23 71.30 43.106 1.4275.29 0.44 0.622 75.23 71.30 37.690 1.2474.50 0.80 0.596 75.23 71.30 35.070 1.1614.90 0.50 0.594 74.87 71.67 36.334 1.2025.30 0.72 0.584 74.87 71.67 31.151 1.0316.30 0.66 0.650 74.87 71.67 50.326 1.6665.80 0.48 0.678 74.87 71.67 33.330 1.1036.10 0.56 0.654 74.67 72.11 42.011 1.3906.00 0.58 0.640 74.67 72.11 30.368 1.0055.80 0.68 0.672 74.67 72.11 25.084 0.8305.50 0.52 0.566 74.67 72.11 25.714 0.8515.90 0.54 0.482 74.33 72.33 22.362 0.7406.10 0.52 0.452 74.33 72.33 16.026 0.5305.40 0.68 0.420 74.33 72.33 18.138 0.6005.00 0.70 0.404 74.33 72.33 23.433 0.7765.00 0.68 0.394 74.33 72.33 20.337 0.6735.20 0.66 0.430 74.83 71.67 21.506 0.7125.30 0.74 0.456 78.19 69.20 22.389 0.7414.80 0.70 0.432 78.19 69.20 27.889 0.9234.90 0.66 0.430 78.19 69.20 25.767 0.853
<1CO

APPENDIX B: Tabulations o f Raw Data for System II

System II Acclimation
Day TAN N 02-N T em p DO PHmg/L m g/L C m g/L
1 12.62 12.180 26.4 7.422 11 .67 , 12.470 26.9 7.433 11.33 11.220 27.1 7.484 8.03 13.050 27.0 7.415 4.98 19.430 26.1 7.406 0.10 23.750 26.5 7.857 0.04 19.030 26.5 7.838 0.00 18.800 26.6 7.53 8.479 0.00 16.450 26.8 7.88 8.44
10 0.00 13.950 27.2 7.98 8.4911 0.00 8.250 28.7 7.86 8.5212 0.00 2.350 29.0 7.97 8.5913 0.00 0.006 29.1 7.91 8.6014 0.01 0.004 28.9 7.93 8.4915 0.01 0.003 29.1 7.91 8.4116 0.02 0.003 28.4 7.96 8.6216 3.01 0.003 (Spiked with NH4CI)17 2.45 0.015 28.8 7.98 8.5718 1.71 0.047 29.0 7.89 8.3719 0.23 0.113 29.3 7.92 8.4820 0.01 0.024 29.0 7.95 8.5121 0.03 0.003 28.8 7.93 8.4222 0.03 0.003 28.5 7.94 8.3423 0.02 0.003 28.4 7.90 8.4824 0.02 0.003 28.1 7.80 8.4625 0.02 0.003 28.2 7.80 8.47
M ean 26.862 7.794 8.485St. Dev. 5.580 0.207 0.076
n 25 25 18
Note: 43.6 g NH4CI w as a d d e d to sim ulate 2 m g TAN/L,until th e system w as s tocked with fish on 9/17/93.

System II Daily Data
Data Day No. Feed, kg Temp., C DO pH TAN N02-Nmg/L mg/L mg/L
9/19/93 1 0.05 27.1 7.6 8.54 0.02 0.00620 2 0.05 27.6 7.4 8.44 0.05 0.00721 3 0.05 28.2 7.2 8.39 0.06 0.00722 4 0.05 28.4 7.4 8.25 0.02 0.00723 5 0.05 28.3 7.5 8.23 0.02 0.00724 6 0.0525 7 0.10' 28.4 7.4 8.40 0.05 0.00626 8 0.10 27.8 7.6 8.43 0.05 0.00627 9 0.20 26.8 7.8 8.58 0.05 0.01028 10 0.30 25.4 7.8 8.46 0.06 0.01229 11 0.40 25.1 7.8 8.26 0.09 0.03530 12 0.40 25.8 7.6 8.36 0.09 0.108
10/01 13 0.40 25.6 7.6 8.36 0.11 0.1092 14 0.40 25.7 7.6 8.32 0.10 0.0983 15 0.60 26.8 7.6 8.36 0.11 0.0874 16 0.60 27.0 6.5 8.23 0.12 0.0705 17 0.60 27.4 7.1 8.26 0.14 0.0736 18 1.20 27.4 6.7 8.11 0.23 0.0787 19 1.20 26.7 6.7 8.11 0.27 0.0738 20 1.20 27.2 6.8 8.14 0.33 0.1259 21 1.20 27.3 6.4 8.10 0.32 0.11910 22 1.20 27.6 7.1 8.21 0.28 0.14311 23 1.20 27.0 5.7 8.17 0.31 0.19612 24 1.20 26.1 7.6 8.19 0.39 0.18413 25 1.20 26.2 7.2 8.12 0.46 0.17514 26 1.20 27.1 7.0 8.12 0.44 0.04315 27 1.40 27.6 6.6 8.19 0.54 0.23016 28 1.40 27.9 6.2 7.88 0.67 0.26717 29 1.40 28.2 6.5 8.17 0.53 0.06118 30 1.40 28.4 6.5 8.16 0.72 0.38219 31 1.40 28.7 6.4 8.10 0.72 0.35820 32 1.40 28.9 6.3 8.22 0.73 0.34921 33 1.40 28.6 6.6 8.30 0.73 0.10722 34 1.40 26.2 6.9 8.25 0.93 0.29823 35 1.40 24.8 6.9 8.23 1.33 0.31624 36 1.40 26.5 6.9 8.24 0.68 0.14225 37 1.40 26.4 6.3 8.17 0.84 0.27626 38 1.4027 39 1.4028 40 1.80 27.7 6.2 8.32 0.67 0.061
Table cont'd.
Alkalinity N03-N NTU Qts.Lpm Qibc. Lp Flush mg/L mg/L
0 .2 203 .3 95 .0V
95
0 .3 y
89 173.2 8 6 .8 y
0 .9
98
18.7
162.3 87 .41 .2 y
7 .6100
203 158.6 8 4 .6
1.6
159.4 83 .2
1.3
y
y
V218
Notas
bc
d
a
176

System II Daily Data
Data Day No. Feed, kg Tamp., C
29 41 1.80 26.830 42 1.80 24.931 43 1.80 28.6
11/01 44 1.80 27.82 45 1.80 27.63 46 1.80 29.24 47 1.80" 29.85 48 1.80 30.26 49 1.80 28.87 50 1.80 26.98 51 1.80 27.39 52 1.80 28.010 53 1.80 28.111 54 1.80 27.912 55 2.00 28.613 56 2.00 29.714 57 2.00 30.315 58 2.00 30.216 59 2.00 29.517 60 2.00 29.518 61 2.00 28.019 62 2.00 28.020 63 2.00 27.621 64 2.00 26.722 65 ZOO 26.723 66 ZOO 27.124 67 ZOO 27.725 68 ZOO 27.926 69 ZOO 27.827 70 ZOO 27.228 71 2.00 26.629 72 2.00 26.930 73 2.00 27.5
12/01 74 2.00 27.72 75 ZOO 27.93 76 2.00 28.64 77 2.00 29.15 78 2.00 27.86 79 2.00 27.47 80 ZOO 27.4
DO pH TAN N02-Nmg/L mg/L mg/L6.4 8.33 0.72 0.2537.0 8.32 0.82 0.3716.0 8.16 0.83 0.2226.0 8.19 0.91 0.4136.1 8.21 1.08 0.5515.9 8.20 0.70 0.1895.7 8.12 0.77 0.3395.2 8.14 0.97 0.4156.1 8.28 0.73 0.1976.2 8.27 0.86 0.3625.8 8.30 1.03 0.4095.6 8.33 0.73 0.1425.6 8.20 0.94 0.2965.3 8.22 1.09 0.3885.9 8.18 0.81 0.1665.4 8.16 0.94 0.2345.1 8.14 1.18 0.2625.2 8.21 1.41 0.3635.2 8.22 0.96 0.1615.5 8.17 1.09 0.1895.7 8.33 1.03 0.2155.5 8.32 0.92 0.1285.9 8.22 1.02 0.1616.5 8.21 1.01 0.1835.6 8.24 1.07 0.2485.8 8.21 0.99 0.1515.4 8.21 1.08 0.2575.5 8.02 1.14 0.2235.7 8.03 1.17 0.2185.7 7.83 1.03 0.1635.7 8.10 1.29 0.2395.5 8.19 1.41 0.2605.5 7.97 1.02 0.1505.3 8.23 1.18 0.3265.1 8.21 1.25 0.4724.9 7.93 1.14 0.2175.2 7.86 1.22 0.3525.2 8.05 1.33 0.3925.4 8.11 1.30 0.4845.4 8.12 1.09 0.211
Tabla cont'd.
Alkalinity N03-N NTU Qts.Lpm Qrbc. Lp Rush mg/L mg/L
173
119
206
183
23.3
19.7
1.3
1.4
1.1
1.3
145.5 86.7
143.2 83.4
140.4 82.1
137.7 88.7
132.2 81.2
131.2 84.9
Y
V
y
y
y
y
Notaa
0
177

System II Daily Data
Date Day No. Feed, kg Temp.. C DO pH TAN N02-N
8mg/L mg/L mg/L
81 2.00 27.5 5.2 8.10 1.18 0.3669 82 2.00 27.9 5.1 8.17 1.42 0.41010 83 2.00 28.4 5.0 8.17 1.26 0.22711 84 2.00 27.6 4.8 7.89 1.39 0.37712 85 2.00 26.9 . 5.4 7.91 1.36 0.43613 86 2.00 27.8 5.0 7.94 1.74 0.60014 87 2.00'15 88 2.00 26.7 5.8 7.89 1.10 0.22816 89 2.00 26.6 5.6 7.83 1.40 0.49617 90 2.00 26.9 5.1 7.89 0.96 0.48618 91 2.0019 92 2.0020 93 2.00 27.7 4.8 8.32 0.84 0.62421 94 2.0022 95 2.00 25.6 5.6 7.18 0.92 0.752
1/04/94 108 2.00 26.9 5.4 7.67 0.90 0.6087 111 2.00 28.6 4.6 8.03 0.74 0.54210 114 2.00 27.3 5.9 7.49 0.88 0.56211 115 3.00 29.9 5.2 7.49 2.68 4.40012 116 3.00 28.3 5.1 7.79 1.92 5.22013 117 3.00 27.9 5.2 7.78 1.03 3.86014 118 3.00 27.4 5.0 7.79 1.01 2.68015 119 3.00 27.9 5.1 7.81 0.97 1.61016 120 3.00 27.0 5.7 7.84 1.05 3.32017 121 3.00 28.5 4.7 7.69 1.06 3.08018 122 3.00 27.2 5.4 7.77 0.97 3.38019 123 3.00 26.7 5.4 7.87 0.95 1.69020 124 3.00 26.3 5.2 7.68 1.06 2.73021 125 3.00 27.8 5.2 7.69 1.35 3.86022 126 3.00 27.2 5.1 7.88 1.08 2.06023 127 3.00 27.2 5.1 7.79 1.56 4.68024 128 3.00 27.6 5.1 7.70 1.73 3.37025 129 3.00 29.1 4.4 7.64 1.49 2.95026 130 • 3.00 28.9 4.6 7.65 2.65 3.36027 131 3.00 29.4 4.6 7.63 2.20 3.84028 132 3.00 28.9 4.9 7.73 2.20 4.30029 133 3.00 27.6 4.9 7.81 2.50 3.80030 134 3.00 27.5 5.0 • 7.76 1.58 4.60031 135 3.00 27.7 4.7 ' 7.74 1.00 2.300
Table cont'd.
Alkalinitymg/L
196
184
216
184
185
210
N03-N NTU Qts.Lpm Qibc, Lp Hush Notes ntfl/L
1.6 h
56.3
90.0
145.2 82.3139.8 80.2
y
1.5 Y
121.5 78.6 V
V136.2 82.0
y1.8 135.2 81.41.6 134.6 80.1 y
135.2 81.2y
y
2.6 y
2.8 133.6 77.2 V
3.1 136.8 80.1 V134.0 78.7129.3 71.3 V134.7 76.7
2.6 138.1 78.8 y136.4 74.1136.3 74.7 V
2.1 133.7 72.1130.4 70.8 y138.2 77.7
2.3 136.9 74.3 y139.4 78.9
2.4 130.3 69.4 V2.1 133.7 72.7
oo

I
Syatem II Daily Data
Data Day No. Feed, kg Temp., C DO pH TAN N02-Nmg/L mg/L mg/L
2/01 136 3.00 27.2 5.0 7.74 2.40 3.8002 137 3.00 27.3 5.1 7.72 1.10 1.7203 138 3.00 27.0 5.0 7.74 1.56 3.0754 139 3.00 27.7 4.8 7.76 0.86 1.4755 140 3.00 29.2 4.3 7.72 1.29 3.4606 141 3.00 30.0 4.4 7.63 0.75 2.0007 142 3.00' 29.6 4.8 7.61 1.00 1.2878 143 3.00 30.0 4.0 7.69 0.76 1.1509 144 3.00 30.1 4.0 7.61 1.01 3.02010 145 3.00 29.0 4.4 7.60 0.76 1.40011 146 3.00 27.2 4.8 7.62 0.73 3.33312 147 3.00 27.1 4.8 7.58 0.78 1.96013 148 3.00 27.6 4.5 7.69 0.89 4.00014 149 3.00 27.1 4.8 7.68 0.66 1.96015 150 3.00 27.6 4.7 7.69 0.93 3.64016 151 3.00 28.2 4.6 7.60 0.67 2.22017 152 3.00 28.3 4.5 7.58 0.97 4.96018 153 3.00 28.6 4.4 • 7.47 0.85 2.80019 154 3.00 29.2 4.1 7.46 1.02 5.02020 155 3.00 29.1 4.5 7.66 0.91 2.46021 156 3.00 29.9 4.0 7.61 1.03 5.60022 157 3.00 29.7 4.1 7.54 1.07 1.44023 158 3.00 29.9 4.1 7.64 1.00 2.68024 159 3.00 28.1 4.7 7.61 0.90 0.67025 160 3.00 27.6 4.6 7.58 1.13 1.25026 161 3.00 27.9 4.7 7.47 0.91 0.53027 162 3.0028 163 3.00 27.6 4.6 7.52 0.97 0.520
3/01 164 3.00 28.5 4.1 7.35 1.36 1.4402 165 3.00 28.7 4.2 7.35 1.20 0.7903 166 3.00 27.5 4.5 7.42 1.45 1.1004 167 3.00 27.7 4.5 7.43 1.29 0.6105 168 3.00 28.1 4.8 7.41 1.44 0.9506 169 3.007 170 3.00 29.2 4.0 7.32 1.40 0.7608 171 3.00 29.4 4.1 7.31 1.39 0.4909 172 3.00 29.7 4.0 7.30 1.45 0.73010 173 3.00 28.1 4.6 7.34 1.70 0.50011 174 3.00 27.6 4.5 7.49 1.33 0.600
Tabla cont'd.
Alkalinity N03-N NTU Q ti.Lpmmg/L mg/L
2.9 128.32.2 136.1
131.42.3 130.7
193 2.6 134.62 135.1
2.3 136.32.1 134.32.8 138.72.3 137.9
62.9 3.1 132.4142 2.5 138.9
2.8 137.757.3 2.4 138.9
2.2 137.83.1 136.42.8 138.0
158 2.9 134.72.3 131.32.6 129.32.2 128.7
130.12 128.9
2.7 129.3174 2.4 128.7
1.9172 2.2 129.4
2 129.454.5 2.7 128.7
2.1 127.92.3 127.8
2.6 128.2158 2.6 128.6
3.2 128.3110 2.6 128.2
2.8 128.7
Qrbc, Lp Fluah Notas
68.9 y 76.470.9 y71.975.3 y76.776.3 y I77.780.1 y78.474.3 y81.580.3 y81.5
y80.678.3 y79.578.8 y69.770.9 y68.767.9 y65.966.7 y67.3
y
66.2 y66.5 m66.6 y64.864.8 y
66.7 y66.866.8 y 66.766.6 y
CO

System II Dally Data
Date Day No. Feed, kg Temp., C DO PH TAN N02-N Alkalinity N03-N NTU Qts.Lpm Qrbc, Lp Flushmg/L mg/L mg/L mg/L mg/L
12 175 3.00 28.0 4.6 7.49 1.21 0.400 2.5 128.1 66.413 176 3.00 28.3 4.5 7.21 1.41 0.570 146 2.4 129.0 66.6 y14 177 3.00 28.7 4.1 7.23 1.21 0.380 2.1 128.4 66.415 178 3.00 28.9 4.3 7.57 1.40 0.645 128.3 66.7 y16 179 3.00 29.0 4.3 7.63 1.26 0.66517 180 3.00 28.0 6.2 7.58 1.49 0.695 2.8 y18 181 3.00 28.0 5.1 7.49 1.40 0.655 2.419 182 3.00 y20 183 3.0021 184 3.00 28.3 5.2 7.46 1.12 0.380 148 3.1 y22 185 1.50 28.6 6.6 7.42 1.22 1.940 2.623 186 3.00 28.9 5.5 7.44 2.56 4.860 131 y24 187 3.00 29.4 5.2 7.42 1.28 1.690 2.125 188 3.00 28.8 5.2 7.32 1.76 0.660 128 2.4 y26 189 3.0027 190 3.00 y28 191 3.00 28.0 6.5 7.58 0.93 0.740 2.129 192 3.00 26.9 6.7 7.42 1.24 2.220 2.3 y30 193 3.00 27.0 6.2 7.44 1.51 3.000 231 194 3.00 27.4 6.7 7.42 1.29 2.010 2 V
NOTES:
Notaa
a 132 fish: 5.2 kgb 385 fish; 12.5 kgc 392 fish: 12.7 kgd Started sodacarba Blower down fo 7 hoursf 480 fishg 640 fishh Less 1 fishI Begin flushing every 2 daysj 2 kg faed until 1/09/94k Begin 3 kg feed/day: flushing every 2 daysI Less 2 fishm Less 2 fishn Less 1 fisho Less 1 fishp Less 1 fishq Settler tank leak; repaired overnight; 1.5 kg feed only; used submersible pump to recirculate 8.7 gpm from tank to RBC r Restored settler
00O

System II Performance: 3lcg feed/day, flushed every 2 days
Dste Day No. pH Alkalinity Culture Tenk/FBF Influentmg/L T DO TAN N02-N T
C mg/L mg/L mg/L C1/18/94 122 7.77 27.2 5 .4 0 .9 7 3 .380 27.2
19 123 7.87 26.7 5 .4 0.95 1.690 26.720 124 7.68 26.3 5 .2 1.06 2.730 26.321 125 7.69 27.8 5.2 1.35 3 .880 27.822 126 7.68 27.2 5.1 1.08 2.060 27.223 127 7.79 27 .2 5.1 1.56 4 .880 27.224 128 7.70 185 27.6 5.1 1.73 3.370 27.625 129 7 .64 29.1 4 .4 1.49 2.950 29.128 130 7.65 28.9 4 .6 2.65 3.360 28.927 131 7.63 29.4 4 .6 2.20 3.840 29.428 132 7.73 28.9 4 .9 2.20 4.300 29.029 133 7.81 210 27.6 4.9 2.50 3.800 27.430 134 7.76 27.5 5.0 1.58 4.600 27.531 135 7.74 27.7 4 .7 1.00 2.300 27.7
2/01/94 138 7.74 27.2 5.0 2.40 3.800 27.22 137 7.72 27.3 5.1 1.10 1.720 27.33 138 7 .74 27.0 5.0 1.56 3.075 27.04 139 7.76 27.7 4.8 0.86 1.475 27.75 140 7.72 193 29.2 4 .3 1.29 3.460 29.28 141 7.63 30 .0 4 .4 0.75 2.000 30.07 142 7.61 29.6 4 .8 1.00 1.287 29.68 143 7.69 30 .0 4 .0 0 .76 1.150 30.09 144 7.61 30.1 4 .0 1.01 3 .020 30.210 145 7.60 29.0 4 .4 0 .76 1.400 29.111 146 7 .62 27.2 4 .8 0.73 3 .333 27.212 147 7.58 142 27.1 4 .8 0.78 1.960 27.113 148 7.69 27.6 4.5 0.89 4 .000 27.614 149 7 .68 27.1 4 .8 0 .66 1.960 27.115 150 7.69 27.6 4 .7 0 .93 3 .640
Table cont'd.
FBF EffluentDO TAN
mg/L mg/L4.9 1.125.2 0 .884 .8 1.084 .7 1.364.6 1.094 .6 1.554.3 1.753.9 1.503.8 3.203.7 2.364 .2 2.184.5 2.394 .7 1.624 .4 1.024.5 2.254 .7 1.034.5 1.864 .6 0.924.1 1.544.1 0 .7 44 .4 1.073.7 0.793.4 1.073.9 0.784 .3 0.834 .4 0.783.9 0.974 .4 0.81
N02-N Tmg/L C
3.460 27.21.780 26.62.870 26.34 .020 27.72.260 27.24 .760 27.13 .270 27.53 .000 29.03 .420 28.83.880 29.34 .240 28.93 .790 27.34 .820 27.42.425 27.63.975 27.31.840 27.23.275 27.01.612 27.73.615 29.12.025 29.91.125 29.51.210 29.92.960 30.11.500 29.03 .383 27.22.010 27.13 .740 27.61.780 27.1
RBC EffluentDO TAN
mg/L mg/L5.6 0 .585.9 0 .506.7 0 .566.0 0 .805.6 0 .575.6 0.985.8 1.205.2 0.915 .2 2.485.1 1.576.1 1.605.1 1.725 .4 1.185 .7 0.655 .4 1.875.9 0.605 .3 1.155 .4 0 .485.1 0.985 .3 0.325 .6 0.585 .2 0.324 .6 0.575 .0 0.325 .3 0 .3 45.1 0.295.1 0.505.5 0.25
N02-N Q tsmg/L Lpm
3.340 136.81.650 134.02 .810 129.33 .840 134.72 .220 138.14 .680 136.43.350 136.32 .950 133.73.320 130.43 .830 138.24 .260 136.93 .820 139.44 .680 130.32.300 133.73.725 128.31.740 136.13 .138 131.41.500 130.73 .500 134.61.975 135.11.150 136.30 .990 134.32.870 138.71.400 137.93 .283 132.41.900 138.94 .020 137.71.450 138.9
Qrbc Beckwash Lpm80.1 y78 .771 .3 y78.778 .8 y74.17 4 .7 y72.170 .8 y77 .774 .3 y78.989 .4 y72.768.9 y76.470 .9 y71.975.3 y78.778.3 y77.780.1 y78.474.3 y81.580.3 y81.5
Y
181

System II Performance: 3kg faad/day, flushed every 2 days
Date Day No. pH Alkalinity Culture Tank/FBF Influentmg/L T DO TAN N02-N T
C mg/L mg/L mg/L CIB 151 7.60 28.2 4 .6 0 .67 2.220 28.217 152 7.58 28.3 4.5 0 .97 4 .960 28.3018 153 7.47 28.6 4 .4 0.85 2.800 28.6019 154 7.46 158 29.2 4.1 1.02 5.020 29.2020 155 7.66 29.1 4.5 0.91 2.460 29.1021 156 7.61 29.9 4 .0 1.03 5.600 29.9022 157 7.54 29.7 4.1 1.07 1.440 29.7023 158 7.54 29.9 4.1 1.00 2.680 29.9024 159 7.61 28.1 4 .7 0 .90 0 .670 28.1025 160 7.58 27.6 4 .6 1.13 1.250 27.6026 161 7.47 174 27.9 4 .7 0.91 0 .530 28.027 16228 163 7.52 27.6 4.6 0 .97 0 .520
3/01/94 164 7.35 172 28.5 4.1 1.36 1.440 28.52 165 7.35 28.7 4 .2 1.20 0.790 28.73 166 7.42 27.5 4.5 1.45 1.100 27.54 167 7.43 27.7 4.5 1.29 0 .610 27.75 168 7.41 28.1 4.8 1.44 0 .950 28.26 1697 170 7.32 29.2 4 .0 1.40 0.780 29.28 171 7.31 158 29.4 4.1 1.39 0.490 29.49 172 7.30 29.7 4 .0 1.45 0 .730 29.710 173 7.34 110 28.1 4 .6 1.70 0 .500 28.111 174 7.49 27.6 4.5 1.33 0 .600 27.712 175 7.49 28.0 4 .6 1.21 0 .400 28.013 176 7.21 146 28.3 4 .5 1.41 0 .570 28.314 177 7.23 28.7 4.1 1.21 0 .380 28.615 178 7.57 28.9 4.3 1.40 0 .545 28.9
FBF Effluent RBC EffluentDO TAN N02-N T DO TAN N02-N Q ts Qrbc Backwash
mg/L mg/L mg/L C mg/L mg/L mg/l. Lpm Lpm4.1 0 .60 2.236 28.2 5 .2 0 .19 2.120 137.8 80.6
3.90 1.02 5.22 28.2 5.0 0 .47 6.160 136.4 78.3 y3.80 0 .8 2 2.760 28.6 5.1 0 .33 2.760 138.0 79.53.40 0 .99 5.120 29.1 4 .8 0 .53 4 .920 134.7 78.8 y3.80 0 .86 2.420 29.10 5.1 0 .40 2.240 131.3 69.72.90 1.16 5 .360 29.80 4 .3 0 .50 5.600 129.3 70.9 y3.40 1.08 1.500 29.60 4 .8 0 .57 1.410 128.7 68.73 .20 1.09 2.560 29.80 4.5 0 .46 2.340 130.1 67.9 y3.90 0 .97 0 .720 28.00 5.2 0 .48 0 .640 128.9 65.93 .90 1.05 1.370 27.50 5.2 0.55 1.210 129.3 66.7 y4.1 0.93 0 .610 27.90 5.4 0.41 0 .500 128.7 67.3
y3.3 1.49 1.540 28.40 4 .8 0 .80 1.410 129.4 66.2 y3.6 1.24 0 .910 28.60 4 .8 0 .54 0 .730 129.4 66.53.9 1.52 1.170 27.40 5.1 0 .86 0 .560 128.7 66.6 y4 .2 1.36 0 .570 27.70 5 .3 0 .73 0 .550 127.9 64.84.3 1.42 1.020 28.10 5.3 0 .77 0 .860 127.8 64.8 V
3.4 1.46 0 .850 29.10 4 .8 0 .7 2 0 .760 128.2 66.7 y3.5 1.38 0 .620 29.30 5 .0 0.71 0 .500 128.6 66.83.5 1.61 0.780 29.60 4 .7 0.71 0 .660 128.3 66.8 y3.8 1.66 0 .540 28.00 5.2 0 .98 0 .410 128.2 66.73.8 1.46 0 .700 27.50 5.1 0.75 0 .510 128.7 66.6 y4 .0 1.33 0 .590 27.90 4 .3 0 .68 0 .480 128.1 66.43.6 1.56 0.660 28.30 5 .0 0 .76 0 .490 129.0 66.6 y3.8 1.28 0.440 28.60 5.1 0.65 0 .330 128.4 36.43.8 1.51 0.620 28.80 5 .0 0 .8 2 0 .465 128.3 66.7 y
I—*00to

Ona-lnch and Two-Inch RBC Comparison; Ha ad to Ha ad in Systam tl, flushed every 2 days
Oata Day No. Faadkg
pH
4/01/94 195 3.02 196 3.03 197 3.04 198 3.0 7.435 199 3.0 7.616 200 3.0 7.667 201 3.0 7.518 202 3.0 7.589 203 3.0 7.6210 204 3.0 7.5311 205 3.0 7.5212 206 3.0 7.5113 207 3.0 7.4014 208 3.0 7.48IS 209 3.0 7.4916 210 3.0 7.5217 211 3.018 212 3.0 7.6719 213 3.0 7.6420 214 3.0 7.5321 215 3.0 7.5822 216 3.0 7.6223 217 3.024 218 3.025 219 3.0 7.6026 220 3.0 7.6327 221 3.0 7.6728 222 3.0 7.6329 223 3.0 7.6930 224 1.5 7.61
5/01/94 225 3.0 7.632 226 3.0 7.493 227 3.0 7.584 228 3.0 7.49
AltaSnity Cuhura Tank/TS Influentmg/I T DO TAN N02-N T
C mg/l mg/l mg/l C* 1* RBC tank baked; repared ovarnight* Pipad 2* RBC (saedad with othar RBC ocrapinga and water,
10S
204
TS Effluant DO TAN
mg/l mg/lN02-N
mg/lDOmg/1
1* RBC Effbant TAN N02-Nmg/l mg/l
DOmg/1
2" RBC Effluant TAN N02-Nmg/l mg/t
Q ta lpm
O rbolipm
178
164
28.1 5.3 4.46 1.38028.9 4.9 0.92 0.65028.7 4.8 1.03 0.62527.0 5.0 1.18 4.42027.2 5.1 1.30 6.52027.5 5.3 1.02 0.46028.6 4.6 1.38 5.70029.1 4.4 1.23 4.61029.S 4.4 1.47 1.22528.5 4.5 1.35 1.62528.0 5.7 0.72 1.18029.3 3.9 1.35 2.64029.1 4.1 1.54 3.060
27.6 5.6 0.87 0.33027.4 5.8 0.82 0.21027.8 5.4 0.87 0.25028.2 5.8 0.87 0.20428.3 5.6 0.92 0.254
and chamicaky accSmatad baginning 3/08/94)
Run r RBC Run 1* RBC Run 1" R8C Run r R8C Run 2* RBC Run 1a RBC Run 2* RBC Run T RBC Run r RBC Run r RBC Run 1* RBC Run r RBC Run r RBC Run 2* RBC Run both RBCa haraon
Q rbc2 Backwash
27.8 3.9 0.92 0.350 5.9 0.46 0.204 6.5 0.43 0.261 89.03 36.27 47.5628.2 4.2 0.95 0.317 6.2 0.45 0.148 6.5 0.49 0.226 89.20 41.66 42.4928.3 3.8 0.91 0.378 5.9 0.46 0.193 6.2 0.47 0.270 89.74 41.81 42.88
28.9 5.4 0.99 0.251 28.9 3.9 1.03 0.408 5.8 0.54 0.190 6.3 0.52 0.266 89.29 41.75 42.8229.2 5.0 1.04 0.364 29.2 3.3 1.14 0.530 5.4 0.51 0.281 6.0 0.46 0.348 88.00 41.82 42.0830.1 4.9 0.97 0.297 30.1 3.4 1.06 0.496 5.5 0.49 0.234 6.0 0.42 0.299 90.97 42.71 43.3729.7 5.2 0.92 0.340 29.7 3.3 1.16 0.496 5.5 0.53 0.261 6.0 0.50 0.319 89.99 42.40 42.7827.6 5.9 0.79 0.214 27.6 3.0 0.80 0.372 6.0 0.40 0.162 6.6 0.48 0.205 89.07 41.57 42.5528.3 6.4 0.80 0.288 1.5 kg faad only; powar supply trip pad27.7 6.0 0.82 0.13427.2 6.0 0.87 0.205 27.2 4.1 0.90 0.364 6.3 0.47 0.156 6.9 0.47 0.181 89.22 41.95 42.5327.8 6.0 0.94 0.201 27.8 4 .6 1.00 0.354 6.0 0.51 0.155 6.8 0.48 0.179 91.44 42.74 43.0927.4 6.0 0.92 0.230 27.4 4 .0 0.96 0.368 6.1 0.48 0.178 0.7 0.46 0.196 90.77 42.41 42.92
00Tabla cont'd.

I
Om-lnch and Two-Inch RBC Cornpvinn; H.ad to H od h Sy.Um B, fkjalwd .vary 2 day.
Data Day No. Food pH Akafinity Cuttura Tanfc/TS Influantk0 mg/l T 0 0 TAN N 02N T
C mg/1 mg/1 mg/l CS 229 3.0 7.50 27.4 6.1 0.85 0.135 27.4Q 230 3.0 7.41 152 27.2 6.0 0.83 0.181 27.27 231 3.0 7.92 27.4 5.8 0.72 0.172 27.48 232 3.0 7.84 28.3 5.4 0.90 0.237 28.39 233 3.0 7.76 29.2 5.3 0.83 0.174 29.210 234 3 .0 7.72 184 28.7 6.2 0.68 0.17911 235 3.0 7.90 27.7 6.5 0.64 0.109 27.712 238 3.0 7.70 27.2 8.0 0.81 0.151 27.213 237 3 .0 7.73 238 . 27.3 0.3 0.74 0.144 27.314 238 3.0 7.87 27.1 6.0 0.79 0.180 27.1IS 239 3.0 7.83 28.9 8.5 0.70 0.134 26.918 240 1.5 7.65 188 28.7 5.7 0.84 0.126 28.717 241 1.5 7.84 28.8 5.7 0.79 0.110 28.718 242 1.5 7.86 27.9 5.9 0.77 0.137 27.919 243 1.5 7.83 27.4 6.1 0.72 0.100 27.320 244 1.5 7.78 26.4 8.7 0.75 0.120 26.321 245 1.5 7.73 28.7 6.5 0.69 0.098 26.722 248 1.5 7.74 28.9 6.3 0.68 0.146 26.923 247 1.524 248 1.5 7.58 28.1 6.2 0.76 0.165 28.12S 249 1.5 7.79 27.8 6.3 0.72 0.168 27.828 250 1.5 7.92 26.2 6.1 0.68 0.13027 251 2.0 7.81 218 28.9 5.5 0.82 0.266 28.928 252 2.0 7.86 31.6 5.4 0.65 0.98029 253 2.0 7.85 168 28.7 5.8 0.67 0.21130 254 2.0 7.71 27.8 8.0 0.71 0.264 27.831 255 2.0 7.88 26.5 8.1 0.70 0.252 28.5
8/01/94 258 2.0 7.87 214 28.2 6.2 0.73 0.258 28.22 257 2.0 7.77 28.7 6.0 0.71 0.186* 28.73 258 2.0 7.79 29.1 5.6 0.74 0.223 29.14 259 2.0 7.78 28.3 6.2 0.75 0.219 28.35 280 2.0 7.79 28.4 6.2 0.69 0.2968 281 £ 0 7.80 28.3 6.0 0.72 0.231 28.37 262 2.0 7.78 28.3 5.0 0.76 0.3178 263 2.0 7.76 29.4 6.2 0.76 0.293
TS Effbant 1’ RBC Efftjant 2* RBC Effluant0 0 TAN N02-N DO TAN N 02N DO TAN N 02N Qte Qfbcl 0 fbc2
mg/I mg/1 mg/l mg/1 mg/1 mg/1 mg/l mg/l mg/l Ipm 1pm ipm4.2 0.80 0.230 6.3 0.43 0.102 6.8 0.41 0.121 90.83 42.50 43.013.9 0.84 0.309 6.2 0.43 0.140 6.7 0.42 0.150 90.30 42.30 42.894.0 0.67 0.300 6.1 0.32 0.141 6.8 0.34 0.148 100.13 47.68 47.263.5 1.02 0.352 5.7 0.51 0.208 6.3 0.49 0.208 99.62 * 47.23 46.844.1 0.84 0.297 5.9 0.48 0.149 6.4 0.45 0.152 101.87 48.39 48.32
Watar pump down (or ? hours; fbshad RBC tank + 2 abdga tank volumaa; 13R01
5.3 0.63 0.169 6.6 0.39 0.085 6.9 0.40 0.104 102.36 48.53 48.594.7 0.80 0.270 6.3 0.46 0.126 6.6 0.48 0.146 103.13 49.17 49.995.0 0.78 0.257 6.2 0.46 0.123 6.6 0.43 0.132 109.89 47.51 55.214.9 0.86 0.302 6.2 0.54 0.154 6.5 0.54 0.165 109.42 50.28 51.095.1 0.75 0.218 6.7 0.44 0.113 6.9 0.48 0.130 109.18 50.11 50.924.4 0.88 0.206 6.1 0.48 0.117 6.4 0.52 0.127 108.05 49.68 50.355.0 0.81 0.175 6.2 0.51 0.103 6.4 0.40 0.104 111.94 49.49 51.545.1 0.78 0.199 6.3 0.43 0.123 6.5 0.48 0.121 133.66 54.53 54.505.4 0.68 0.149 6.4 0.42 0.091 6.8 0.43 0.093 133.45 54.31 54.485.8 0.79 0.178 6.7 0.44 0.109 6.9 0.47 0.109 134.21 54.59 55.175.7 0.64 0.135 6.9 0.36 0.064 7.0 0.41 0.084 134.34 54.35 55.055.5 0.69 0.207 6.6 0.36 0.131 6.8 0.40 0.127 131.06 53.37 52.83
5.5 0.79 0.238 6.4 0.44 0.152 6.7 0.45 0.145 131.43 53.65 53.255.8 0.76 0.239 6.4 0.40 0.151 6.9 0.40 0.153 131.75 54.11 53.39
4.9 0.82 0.356 6.0 0.47 0.229 6.3 0.49 0.231 143.73 53.29 53.27
5.1 0.74 0.354 6.4 0.40 0.223 0.6 0.44 0.243 143.6S 53.52 53.505.6 0.72 0.358 6.4 0.45 0.204 6.6 0.43 0.227 143.36 53.35 53.734.9 0.82 0.338 6.3 0.43 0.211 6.5 0.42 0.216 142.74 53.46 53.505.4 0.80 0.270 6.3 0.42 0.166 6.5 0.42 0.173 142.80 53.39 53.754.7 0.79 0.311 6.1 0.42 0.193 6.3 0.42 0.209 142.34 53.46 53.625.5 0.78 0.299 6.5 0.44 0.188 6.7 0.40 0.209 140.26 53.65 53.54
5.5 0.78 0.312 6.5 0.42 0.197 6.7 0.49 0.224 139.27 52.15 53.39
00

185
System II: Total S uspended Solids, mg/L
Tube Settler-RBC System Sludge Volume = 9 6 3 .9 6 liters
Date kg feed/d TS in TS out RBC out Sludge Q ts Q rbc
1 2 /1 1 /9 3 2 3 .3 612 2 2 .1 2 7 1 2 .513 2 1 .7 616 2 3 .5 417 2 3 .4 720 2 2 .5 422 2 3 .6 7
1 /0 4 /9 4 2 6 .2 7 8 .3 3 7 .2 2 6 3 0 1 3 4 .6 80.17 2 5 .9 3 5 .8 5 .3 3 8 0 7 .7 1 3 5 .2 8 1 .2
16 3 8 .4 8 .6 7 8 .1 7 1 3 2 6 .3 3 1 3 3 .6 77 .222 3 8 .5 3 8 .9 3 9 .7 3 1 1 1 2 .7 138.1 78 .824 3 9 .4 7 1 0 .4 8 .6 7 1 7 2 0 1 3 6 .3 74 .7
2 /1 1 /9 4 3 7 .6 7 7 .8 3 7 1545 1 3 2 .4 74 .325 3 6 .9 5 7 .0 7 6 .3 3 1705 1 2 9 .3 66.7
3 /0 7 /9 4 3 4 .7 6 4 .6 9 3 .87 1 3 6 3 .3 3 1 2 8 .2 66.719 3 9 .6 7 1615
4 /1 0 /9 4 3 7 .8 7 1 7 4 6 .75 /0 8 /9 4 3 8 .6 3 1 8 6 3 .7

APPENDIX C: Tabulations of Raw Data for System III
186

187
Day
> III Acclimation
TAN N02-N Temp DO pHmg/L mg/L C mg/L
1 12.54 11.73 25.1 7 .192 10.88 . 11.78 25 .2 7 .2 43 10.88 11.8 25 .3 7 .34 10.66 12.2 25.5 6 .885 8.33 12.03 25.5 6 .0 46 7.23 13.55 29 .8 4 .2 6 7 .947 4.97 15.22 29 .7 7 .79 8.198 0.45 17.15 29 .4 7.9 7 .979 0 .04 17.15 30 .6 7 .38 8 .42
10 0 16.5 30 .7 7 .39 8.4611 0 12.13 31 .6 7 .38 8.712 0.01 2 .4 32 .8 7.01 8.5513 0.03 0 .02 32 .8 7.21 8.5814 0 .04 0 .004 32 .3 7.31 8 .5 415 0.02 0.02 29 .6 7 .83 8 .6416 0.02 0 .003 2 9 .4 7 .7 8 .4816 2.93 0.003 (Spiked with NH4CI)17 2.38 0 .006 29 .9 7.6 8 .6818 1.44 0 .052 29.9 7.61 8 .4219 0.01 0.03 30 .3 7.61 8 .6720 0.02 0 .002 29.5 7 .6 8.6121 0.02 0 .003 29 .4 7 .6 8 .5822 0.02 0 .003 29.5 7.5 8.5523 0.03 0 .003 29 .7 7 .52 8 .73
Mean 27.637 7 .2 5 4 8 .484Std. Dev. 7 .184 0 .759 0.231
n 23 23 17
Note: 38 .6 g NH4CI w as added daily to simulate 2 mg TANsystem w as stocked with fish on 9 /17 /93 .

System III Oaily Data (Backwashed twice daily)
Date Day No. Feed, kg Temp., C DO, mg/L PH
9/19/93 1 0.05 28.1 7.6 8.8420 2 0.05 28.5 7.3 8.7721 3 0.05 29.2 7.0 8.6122 4 0.05 29.4 7.3 8.7523 5 0.05 29.4 7.3 8.4524 6 0.0525 7 0.10 29.3 7.3 8.6626 8 0.10 28.8 7.6 8.6127 9 0.20 27.8 7.6 8.8228 10 0.30 26.4 7.7 8.6129 11 0.40 26.4 7.7 8.4630 12 0.40 26.9 7.5 8.54
10/01 13 0.40 26.7 7.5 8.472 14 0.40 26.8 7.5 8.443 15 0.60 27.4 7.5 8.464 16 0.60 28.2 6.2 8.255 17 0.60 28.6 6.8 8.326 18 1.20 28.9 6.3 8.177 19 1.20 27.8 6.5 8.128 20 1.20 28.7 6.2 8.139 21 1.20 28.7 6.2 8.1310 22 1.20 28.8 6.8 8.1311 23 1.20 28.1 5.4 8.1412 24 1.20 27.1 7.4 8.1513 25 1.20 27.8 6.7 8.1114 26 1.20 28.6 6.5 8.0115 27 1.40 29.2 6.0 8.1316 28 1.40 29.2 5.7 7.9317 29 1.40 29.0 6.0 8.1118 30 1.40 29.8 6.1 8.2219 31 1.40 29.8 6.7 8.1920 32 1.40 30.0 6.1 8.1121 33 1.40 29.9 6.1 8.1122 34 1.40 27.2 6.5 8.1323 35 1.40 26.5 6.4 8.1124 36 1.40 28.2 6.4 8.1125 37 1.40 28.2 5.9 8.11
PressureTAN, mg/ N02-N, m Aik., mg/L N03-N, m NTU psi Q sf, Lpm Orbc, Lp
0.02 0.004 0.1 8 187.4 109.80.03 0.005 80 .04 0.002 80.02 0.004 98 8 189.6 109.10 .03 0.006 8
80.05 0.006 80.03 0.006 0.2 10 171.7 100.60.05 0.007 100.04 0.006 10 168.1 98.30.09 0.019 95 100.10 0.093 12 160.9 94.70.10 0.039 0.3 120.10 0.041 12 160.0 93.90.10 0.043 120.10 0.048 14 138.8 81.20.14 0.030 140.19 0.024 232 150.22 0.035 16 117.4 66.40.30 0.052 0.5 160.28 0.041 16 118.0 68.40.19 0.037 180.23 0.032 160.24 0.031 17.2 18 103.5 58.70.31 0.025 102 180.36 0.042 18 104.4 60.20.47 0.328 187 20 88.4 53.80.63 0.179 22 61.8 42.00.64 0.167 2.3 24 28.5 15.70.73 0.248 28 13.7 7.30.52 0.111 10 177.4 101.20.48 0.074 1.1 12 157.0 92.30.52 0.134 17.3 14 137.7 79.60.74 0.182 18 102.2 58.30.92 0.238 181.08 0.187 3.1 24 34.0 19.30.96 0.244 26 22.5 11.7
Table cont*d.
Notes
137 fish; 5.7 kg
381 fish; 12.5 kg 392 fish; 12.7 kg
Started sodacarb
Blower down
Purged; 4 wash volumes
188

System III Daily Data (Backwashed twice daily)
Date Day No. Peed, kg Temp., C DO, mg/L pH TAN, m
26 38 1.4027 39 1.4028 40 1.80 28.2 5.6 8.10 0.6829 41 1.80 28.1 5.8 8.12 0.8330 42 1.80 25.6 6.8 8.18 0.7731 43 1.80 30.8 4.7 8.06 1.07
11/01 44 1.80 29.0 5.9 8.17 1.122 45 1.80 28.9 6.1 8.16 1.083 46 1.80 29.8 5.8 8.14 1.134 47 1.80 30.8 5.7 8.04 1.225 48 1.80 31.2 4.3 8.11 1.156 49 1.80 29.2 5.9 8.14 1.187 50 1.80 27.4 6.0 8.12 1.118 51 1.80 28.2 5.6 8.21 1.229 52 1.80 29.3 5.4 8.12 1.3110 53 1.80 29.1 5.4 8.13 1.1911 54 1.80 29.1 5.2 8.15 1.2412 55 2.00 29.7 5.3 8.09 1.3913 56 2.00 31.2 5.4 8.11 1.3414 57 2.00 31.3 4.8 8.03 1.6815 58 2.00 31.1 4.9 8.09 1.4116 59 2.00 30.7 4 .3 8.08 1.9417 60 2.00 30.6 4.8 8.21 1.8918 61 2.00 28.7 5.2 8.27 1.7619 62 2.00 29.1 4.9 8.16 1.9420 63 2.00 28.4 5.5 8.07 1.7721 64 2.00 27.3 6.0 8.14 1.6622 65 2.00 27.7 5.3 8.31 1.4223 66 2.00 28.1 5.2 8.08 1.8524 67 2.00 29.0 4.9 8.05 1.8525 68 2.00 29.0 5.0 7.93 2.0526 69 2.00 28.4 5.4 7.94 1.9827 70 2.00 28.3 5.3 7.69 1.9328 71 2.00 27.6 5.3 8.01 1.9829 72 2.00 28.2 4.9 7.98 2.5930 73 2.00 29.6 4.7 7.69 3.98
PressureN02-N, m Aik., mg/L N03-N, m NTU psl Q sf, Lpm Qrbc, I
27 17.5 9.412 163.0 95.2
0.082 202 14 130.7 82.40.100 140.057 16 119.0 89.40.094 2.7 180.127 18 98.4 54.60.117 180.149 20 87.7 52.30.179 159 22 60.7 39,30.197 24 34.4 18.80.192 6.3 28 12.3 6.90.191 10 172.9 98.60.187 14 128.2 78.50.177 20 82.6 50.20.155 4 24 28.4 15.60.182 240.260 24 28.0 14.60.279 26 25.0 13.20.422 262 260.314 18.4 260.193 32 28 13.7 7.30.179 22 60.5 41.20.139 240.160 26 22.6 12.40.126 190 43 28 11.6 6.50.104 20 87.1 57.20.104 260.112 56 29 2.1 1.20.139 22 60.6 36.30.143 26 29.6 16.40.137 280.142 146 73 29 3.9 2.40.144 24 32.5 17.80.138 32.1 260.340 96 29 2.7 1.6
Table cont'd.
Notes
Purged; 4 wash volumes 478 fish
Purged; 4 wash volumes
Purged; 4 wash volumes
Purged; 4 wash volumes
Purged; 4 wash volumes
Purged; 4 wash volumes
Purged; 2 x 4 wash volumes
189

System III Daily Data (Backwashed twice daily)
Date Day No. Feed, kg Temp., C DO. mg/L pH TAN. mg/ N02-N, i
12/01 74 0.50 29.2 5.9 8.11 0.63 0.1012 75 0.50 28.5 6.0 8.17 0.40 0.0983 76 0.50 28.8 6.1 8.13 0.32 0.0644 77 0.50 28.9 6.0 8.06 0.21 0.0405 78 0.50 28.1 5.9 8.33 0.20 0.0396 79 0.50 28.1 6.0 8.26 0.25 0.0337 80 0.50 28.1 6.1 8.21 0.28 0.0368 81 0.50 28.5 6.4 8.27 0.23 0.0349 82 0.50 28.6 6.5 8.32 0.20 0.03215 88 0.50 27.5 6.5 8.11 0.32 0.07122 95 0.50 28.1 6.2 8.08 0.24 0.029
1/04 108 0.50 28.2 5.9 7.94 0.28 0.0317 111 0.50 28.9 5.3 7.76 0.22 0.02624 128 0.50 28.1 6.0 7.78 0.19 0.01229 133 0.50 28.4 5.7 7.73 0.21 0.023
2/01 136 1.005 140 1.00 28.6 5.4 7.71 0.33 0.08712 147 1.00 28.3 5.2 7.86 0.29 0.04314 149 1.00 28.1 5.3 7.74 0.26 0.05419 154 1.00 28.1 5.7 7.77 0.35 0.06222 157 1.00 28.7 5.2 7.81 0.31 0.04424 159 1.00 28.3 5.3 7.73 0.34 0.05926 161 1.00 28.4 5.3 7.70 0.40 0.06727 162 0.50 28.1 5.6 7.77 0.26 0.033
3/01 164 0.50 28.9 5.3 7.73 0.21 0.0188 171 0.50 28.6 5.3 7.70 0.19 0.01013 176 0.50 28.2 5.2 7.86 0.18 0.01225 188 0.50 29.0 5.3 7.92 0.22 0.008
4/04 198 0.50 28.3 5.9 7.64 0.12 0.00613 207 0.50 28.6 5.3 7.73 0.18 0.00319 213 0.50 28.2 5.4 7.80 0.19 0.01028 222 0.50 28.7 5.1 7.71 0.21 0.002
5/06 230 0.50 28.2 5.3 7.74 0.16 0.00413 237 0.50 28.5 5.3 7.73 0.13 0.00316 240 0.50 28.3 5.6 7.88 0.19 0.00327 250 0.50 28.1 5.7 7.74 0.16 0.006
6/01 255 0.50 28.4 5.2 7.70 0.20 0.002
PressureAik., mg/L N03-N, m NTU psi Q sf, I pm Or be.
16161616 121.0 68.7
2.3 161818 99.9 59.418
1.6 16 100.2 58.7201 16
28.7 16 102.8 57.616 102.8 57.415 109.7 64.3
188 14 122.6 67.3176 33.2 0.5 10 131.8 73.4
182 . 10 125.2 75.2198 22.3 16 112.3 58.2
0.9 16 110.1 56.3186 16 107.2 50.1
18 104.3 47.918 105.2 47.6
180 1.8 20 95.2 45.2178 12 129.6 72.6182 10 132.2 76.6186 36.5 10 138.6 78.3172 0.6 10 136.8 77.6182 29.8 0.4 10 138.2 77.8178 0.3 10 141.2 80.2174 0.3 10 133.8 78.3184 32.6 0.3 10 134.8 79.3182 0.3 10 140.3 79.2182 0.3 10 133.4 77.5178 10 137.4 78.8184 0.3 10 138.2 80.1180 0.3 10 130.2 79.7182 0.3 10 136.4 79.3
Notes
Fish/feed reduced; 152 fish
Begin 1000 g feed/day
Purged; 4 wash volumes Begin 500 g feed/day
190

System III Performenee
O ats Day No. pH Culture Tank/TS InfluentT DO TAN N02-N Tc mgfl mgfl mgfl C
.5 kg feed/day (12/01-1/31: 2/27-present)
12/22 95 8 .0 6 28.1 6 .2 0 .2 4 0 .029 28.21 /04 108 7 .9 4 28.2 5.9 0 .2 8 0.031 28.3
7 111 7 .7 6 28.9 ' 5 .3 0 .2 2 0 .0 2 6 28.924 128 7 .7 8 28.1 6 .0 0 .19 0 .012 28 .229 133 7 .7 3 28 .4 5 .7 0.21 0 .023 28.5
3 /25 188 7 .9 2 29.0 5 .3 0 .2 2 0 .0 0 8 29.04 /04 198 7 .6 4 28 .3 5.9 0 .1 2 0 .0 0 6 28.4
1 .0 kg feed/day (2/01-26)
2 /05 140 7.71 28 .6 5 .4 0 .3 3 0 .067 28.712 147 7 .8 6 28 .3 5 .2 0 .29 0 .0 4 3 28.314 149 7 .7 4 28.1 5 .3 0 .2 6 0 .0 5 4 28.219 154 7 .7 7 28.1 5 .7 0 .3 5 0 .0 6 2 28.322 157 7.81 . 28 .7 5 .2 0.31 0 .0 4 4 28.724 159 7 .7 3 28 .3 5 .3 0 .3 4 0 .059 28.426 161 7 .7 28 .4 5 .3 0 .4 0 0 .067 28.5
SF Effluent RBC EffluentDO TAN N02-N T DO TAN N02-N Pressure Qsf Qrfac
mgfl mgfl mgfl C mgfl mgfl mgfl pal Ipm Ipm
5.1 0 .1 4 0 .040 27.9 6.5 0 .1 2 0 .0 2 0 16 102.8 57.65 .0 0 .1 2 0 .0 5 0 28.1 6.1 0 .1 2 0 .0 2 3 15 109.7 64 .34 .4 0 .0 9 0 .0 4 5 28 .6 5 .8 0 .07 0 .019 14 122.6 67 .35 .4 0 .1 0 0.041 28 .0 6 .4 0.11 0 .0 2 0 10 131.8 73.45 .0 0 .09 0 .037 28.3 6 .2 0 .0 8 0.011 10 125.2 75.24 .4 0 .1 3 0 .017 28.7 6.1 0 .1 0 0 .0 0 6 10 138.2 7 7 .85 .0 0 .0 7 0 .014 28 .0 5.9 0 .0 7 0 .0 0 3 10 141.2 80.2
3.9 0 .2 0 0 .0 8 3 28.4 5 .8 0 .1 6 0 .056 15 114.1 57 .64 .2 0 .1 8 0 .052 28.1 5 .6 0 .1 6 0 .027 16 112.3 68.24 .0 0 .1 8 0.061 27.9 5 .3 0 .1 4 0 .030 16 110.1 56 .34 .0 0 .2 7 0 .077 28.0 5 .7 0 .2 3 0 .042 16 107.2 50.13.9 0 .1 8 0 .059 28.6 5 .6 0 .19 0.031 18 104.3 47.93.9 0 .2 2 0 .0 7 0 28.3 5.5 0 .1 5 0 .048 18 105.2 47 .63 .8 0 .2 7 0.081 28.3 5 .7 0 .2 3 0 .067 20 95.2 45 .2
to

192
System III: Total Suspended Solids, mg/L
Date kg feed/d Q sf Q rbcLpm Lpm
12 /11 /93 0 .512 0 .513 0 .516 0 .517 0 .520 0 .522 0 .5 1 0 2 .8 0 5 7 .6
1 /0 4 /9 4 0 .5 1 0 2 .8 0 5 7 .47 0 .5
16 0 .522 0 .524 0 .5 1 2 2 .6 0 67 .329 0 .5 131 .8 7 3 .4
3 /2 5 /9 4 0 .5 1 3 8 .2 77 .84 .0 4 /9 4 0 .5 1 4 1 .2 8 0 .22 /0 5 /9 4 1.0 12 5 .2 0 7 5 .2
14 1.0 110.1 5 6 .319 1.0 1 0 7 .2 50.124 1.0 10 5 .2 4 7 .626 1 .0 9 5 .2 4 5 .2
(Sludge Volume = 4 8 0 .6 liters
SF in SF o u t RBC ou t Sludge
1 .321 .2 4 113 .3 31.151 .451 .2 31.411 .13 0 .7 2 0 .6 8 104 .671.27 0 .5 3 0 .6 2 9 6 .6 70 .9 30 .8 41 .030 .9 7 0 .6 3 0 .5 8 8 3 .3 30 .8 7 0 .2 4 0 .3 2 9 2 .3 30 .6 3 0 .4 3 0 .4 4 9 6 .8 30 .7 7 0.31 0 .4 3 100 .331.05 0 .4 8 0.51 7 8 .6 71 .3 2 0 .8 3 0 .6 7 103 .71 .13 0 .7 7 0 .8 2 9 8 .6 70 .9 8 0 .6 3 0 .6 4 8 6 .6 70 .7 8 0 .4 7 0 .5 8 3 .6 7

VITA
Aurelio A. delos Reyes, Jr. was bom March 30, 1958 to Aurelio and
Arietta delos Reyes in Sta. Cruz, Laguna, Philippines, where he grew up and
graduated from the Pedro Guevara Memorial High School in 1979. He
attended the University of the Philippines Los Banos (UPLB) from 1974 to
1979 where he graduated with a degree of B. S. in Agricultural Engineering.
After graduation, he worked in UPLB as a research assistant in the
Agricultural Mechanization Development Program (AMDP). In November
1979, he took and passed the Philippine Professional Licensure Examinations
for Agricultural Engineers, landing in the top three among more than 700
examinees. He attended the Asian Institute of Technology, Bangkok,
Thailand from 1980 to 1982 with a US-ASEAN scholarship, and obtained a
degree of Master of Engineering with specialization in agricultural machinery
and management. In 1982 he again worked as an agricultural engineer for
AMDP. He was appointed as faculty member in the College of Engineering
and Agro-Industrial Technology, UPLB in 1983 where he is employed. He
married the former Raquel A. Reyes in January 22, 1984, and they are now
blessed with three wonderful children Raquelyn, Rayland, and Raynard. In
May 1990 he entered the Louisiana State University and pursued the degree
of Ph. D. in Engineering Science (emphasis in Aquacultural Engineering)
with minors in Fisheries (Aquaculture) and Industrial Engineering (Human
Factors Engineering) while on official study leave from UPLB.
193

DOCTORAL EXAMINATION AND DISSERTATION REPORT
Candidate: Aurelio A. delos Reyes, Jr.
Major Field: Engineering Science
Title of Dissertation:Solid Removal Schemes and the Rotating Biological Contactor In Recirculating Fish Culture Systems
Approved:
Major Professor and Chairman
(S Dean' 6f\ the Graduate School
EXAMINING COMMITTEE:
Date of Examination:
March 29, 1995