solar powered water treatment
TRANSCRIPT

Karlstads universitet 651 88 Karlstad Tfn 054-700 10 00 Fax 054-700 14 60
[email protected] www.kau.se
Fakulteten för hälsa, natur- och teknikvetenskap
Miljö- och energisystem
Per-Erik Johansson
Solar powered water treatment
Examining solar evaporation as a sustainable water
treatment method in rural areas in Ghana
Solvärmedriven vattenrening
Utvärdering av solvärmedriven förångning som en hållbar
vattenreningsmetod i landsbygdsområden i Ghana
Bachelor Thesis 30 ECTS credits Bachelor of Science in Environmental and Energy Engineering
September 2013
Handledare: Maria Sandberg
Examinator: Lena Stawreberg

Abstract Since the currently used method of supplying clean drinking water to the Ghanaian population
consists of selling water sachets of 0.5 liter, there is a major ecological problem due to plastic
contamination of the environment. The relatively high water price of buying these sachets also
causes economic problems for a large portion of the population.
To reduce the consumption of plastic as well as the resulting environmental contamination and the
financial burden on low-income citizens, which represents a greater portion of the population, a new
method for solar-powered water was evaluated as a sustainable water treatment method in rural
areas in Ghana.
To test this method a prototype was constructed, based on a combination of the principles of solar
desalination plants and common solar collectors, and was tested on site in Ghana.
This thesis consists of a field study and a computer simulation. The field study in turn consists of an
investigative and experimental study in which the investigative portion sought to find the possibilities
and costs of constructing more plants in on site. This is of great importance for getting a clear picture
of what economic impact the plant has on the sustainable development.
In the experimental study the prototypes treatment capacity was examined, regarding Coliform
bacteria, arsenic, iron, and chloride as well as its effect on the pH level of the water. The study also
examined how much water the prototype can produce in a day and, in conjunction with the
investigative study, to what extent this could reduce the use of plastic bags.
The simulation part of the thesis examined possible improvement of the prototype and evaluated the
influence of various factors on its overall effectiveness.
The study showed that the prototype, which measures 92x68x18cm, where able to produce about 3
liters of drinking water per day (equivalent to 6 sachets of water) and managed to remove all
measured contaminants from the treated water, without any change in the pH value.

Sammanfattning Då den i nuläget vanligaste metoden att distribuera rent dricksvatten i Ghana består av försäljningen
av vattenpåsar á 0,5 liter, finns det stora ekologiska problem till följd av plastkontaminering av
miljön. Det relativt höga vattenpriset som tillkommer av att köpa vatten på påse orsakar även
ekonomiska problem för en stor del av befolkningen.
För att minska konsumtionen av plast såväl som den resulterande föroreningen av miljön och den
ekonomiska belastningen på befolkningen, undersöktes en ny solvärmedriven metod för
vattenrening som en möjlig hållbar vattenreningsmetod i landsbygdsområden i Ghana.
För att utvärdera denna metod konstruerades en prototyp, baserad på en kombination av
principerna bakom soldrivna avsaltningsanläggningar och vanliga solfångare, som testades på plats i
Ghana.
Examensarbetet består av en fältstudie och simuleringsdel. Fältstudien består i sin tur av en
undersökande och en experimentell studie, där den undersökande delen såg över möjligheterna och
kostnaderna av att konstruera fler anläggningar på plats. Detta är av stor vikt för att få en klar bild
över vilka ekonomiska effekter anläggningen har på den hållbara utvecklingen.
I den experimentella studien testades prototypens reningsförmåga med avseende på koliforma
bakterier, arsenik, klorid och järn samt dess effekt på vattnets pH värde. Det undersöktes även hur
mycket vatten prototypen kan producera under en dag, och i samband med den undersökande
studien, hur mycket detta skulle kunna minska användandet av plastpåsar.
Simuleringsdelen av arbetet genomfördes för att undersöka möjliga förbättringsåtgärder av
prototypen samt utvärderat olika faktorers inverkan på prototypens effektivitet.
Studien visade att prototypen, som mäter 92x68x18cm, kunde producera ca 3 liter dricksvatten per
dag (motsvarande förbrukningen av 6 påsar vatten) och klarade att rena vattnet från alla undersökta
föroreningar, utan någon förändring av vattnets pH värde.

Preface This bachelor thesis has been presented verbally to an audience familiar with the subject. The work
was subsequently discussed at a special seminar. The author of this work participated actively in the
seminar as an opponent to another thesis work.
Detta examensarbete har redovisats muntligt för en i ämnet insatt publik. Arbetet har därefter
diskuterats vid ett särskilt seminarium. Författaren av detta arbete har vid seminariet deltagit aktivt
som opponent till ett annat examensarbete.

Dictionary Active absorber – A substance that actively binds particles or substances to its molecular structure
through a chemical or molecular action.
Alkaline minerals – A generic term used for alkali metals and alkaline earth minerals.
Bacterial indicator – A term used for bacteria that is easy to detect and appears together with other,
specific, types of bacteria that are more difficult to detect. The bacterial indicator can by its relation
to other bacteria be examined in a sample to determine the presence and concentration of several
other, elusive, bacteria as well.
Constituent – An element in a (chemical) construction or part of a compound.
Dioxin – A general name for a family of chlorinated hydrocarbons, with heterocyclic structure.
Dioxins have incredibly wide ranging symptoms on humans and the environment, but most
noticeable are the carcinogenic and teratogenic properties many of the different dioxins possess.
Explicit (modeling) – A form of numerical computation where the state of a system at a later instance
of time is calculated from the current instance of time.
Free radicals – An atom, molecule, or ion that has unpaired valence electrons, or an open electron
shell, which makes it highly reactive. This is because the free radical seeks to pair up its valence
electron(s), by bonding with another element.
Gray body radiation – Radiation properties of a surface meaning it radiates equally in all direction
and
Irradiance – The amount of electromagnetic radiation incident on a surface, per area unit. It is usually
specified in W/m2.
Matrix – A mathematical grid containing rows and columns of data, representing various bits of
information through single values that can be mathematically processed according to certain rules.
Orthogonal – A vector, direction or object meeting a given line or surface at right angles.
Oxidative stress – A condition of increased oxidant production in animal cells characterized by the
release of free radicals, resulting in cellular degeneration.
PCB – A family of highly toxic chemical compounds consisting of two benzene rings in which chlorine
takes the place of two or more hydrogen atoms: known to cause skin diseases and suspected of
causing birth defects and cancer.
Pop rivet – A metal pin used for holding two or more plates or pieces together. It is made with a head
in one end to be passed through holes in the plates. The “tail” of the pop rivet is then pulled out
causing the head to cling around the plates and press them together, until it pops off leaving only the
head remaining.
Ppb – Parts per billion, a measurement of concentration, referring to the weight of the substances.

PVC – Polyvinyl chloride is an organic compound with the chemical formula C2H3Cl that has
carcinogenic properties.
Shuttering plywood – A wood composite material with high heat resistance, normally used when
molding concrete.
Solar still – An abbreviation of solar (driven) distillatory.
Spectrum allocation – The distribution of radiation intensity over the radiation spectrum.
Styrene – Also known as vinyl benzene and phenylethene, is an organic compound with the chemical
formula C6H5CH=CH2. It is a derivative of benzene and can cause damage to the eyes and mucous
membranes. Long term exposure to styrene can affect the central nervous system resulting in
chronic headaches, fatigue and depression.
Teratogenic – A property of causing abnormalities of the physiological development.
VOC (Volatile Organic Compound) – Organic chemicals with a low boiling point that causes
evaporation at room temperature. When used in environmental context the term is typically used
exclusively for VOCs that are hazardous to health in its gas state. These usually have compounding
long-term health effects.
Explanations and definitions gathered from Wikipedia.org and dictionary.com

Nomenclature
Description of computer model entities
Entity Description Unit Stefan-Boltzmann constant W/m2, K4 Emissivity -
Absorption factor of solar radiation in the glass sheet -
Surface area of the absorber plate m2 Inner surface area of the bottom m2 Surface area of glass sheet m2
Inner surface area of the piping system m2
Projected surface area of the pipes m2
Surface area of the lamellas lower plate m2
Pipes outer surface m2
Inner surface area of the upper part of the wall m2 Inner surface area of the lower part of the wall m2 Denotation of heat exchange through conduction, from control
volume a to b W
Specific heat capacity of the absorber plate J/Kg, K Specific heat capacity of the air J/Kg, K Specific heat capacity of the glass sheet J/Kg, K
Specific heat capacity of the insulation J/Kg, K Specific heat capacity of the lamellas lower plate J/Kg, K
Specific heat capacity of the plywood J/Kg, K
Specific heat capacity of the inner layer of the wall (Aluminum foil) J/Kg, K Specific heat capacity of water J/Kg, K
Net change in temperature in the absorber plate over time K/s
Net change in temperature of the air volume over time K/s
Net change in temperature of the upper air volume over time K/s
Net change in temperature of the lower air volume over time K/s
Net change in temperature of the bottoms inner surface layer over time
K/s
Net change in temperature of the first sub-control volume of the bottom
K/s
Net change in temperature of the second sub-control volume of the bottom
K/s
Net change in temperature of the third sub-control volume of the bottom
K/s
Net change in temperature of the fourth sub-control volume of the bottom
K/s
Net change in temperature of the fifth sub-control volume of the bottom
K/s
Net change in temperature of the glass sheets inner surface layer over time
K/s
Net change in temperature of the first sub-control volume of the glass sheet
K/s

Net change in temperature of the second sub-control volume of the glass sheet
K/s
Net change in temperature of the pipes over time K/s
Net change in temperature of the lamellas lower plate over time K/s
Net change in temperature of the inner surface layer of the upper part of the wall over time
K/s
Net change in temperature of the first sub-control volume of the upper part of the wall
K/s
Net change in temperature of the second sub-control volume of the upper part of the wall
K/s
Net change in temperature of the third sub-control volume of the upper part of the wall
K/s
Net change in temperature of the fourth sub-control volume of the upper part of the wall
K/s
Net change in temperature of the fifth sub-control volume of the upper part of the wall
K/s
Net change in temperature of the inner surface layer of the lower part of the wall over time
K/s
Net change in temperature of the first sub-control volume of the lower part of the wall
K/s
Net change in temperature of the second sub-control volume of the lower part of the wall
K/s
Net change in temperature of the third sub-control volume of the lower part of the wall
K/s
Net change in temperature of the fourth sub-control volume of the lower part of the wall
K/s
Net change in temperature of the fifth sub-control volume of the lower part of the wall
K/s
Net change in temperature of the water volume over time K/s
View factor of the glass sheet from the absorber plate -
View factor of the upper part of the wall from the absorber plate - View factor of the glass sheet from the bottom -
View factor of the bottom from the pipes
View factor of the glass sheet from the piping-system -
View factor of the upper part of the wall from the piping system -
View factor of the lower part of the wall from the piping system -
View factor of the lower part of the wall from the lamellas lower plate
-
View factor of the bottom from the lamellas lower plate -
View factor of the glass sheet from the upper wall -
View factor of the bottom from the piping system - Denotation of heat exchange through convection, from control
volume a to b W
Convection factor of the absorber plates outer surface W/m2, K Convection factor of the absorber plates inner surface W/m2, K Convection factor of the housings outer surface W/m2, K Enthalpy of vaporization for water J/Kg
Convection factor of the glass sheets inner surface W/m2, K

Convection factor of the glass sheets outer surface W/m2, K
Convection factor of the outer surface of the piping system W/m2, K
Convection factor of the outer surface of the lamellas lower plate W/m2, K
Convection factor of the inner surface of the piping system W/m2, K
Convection factor of the inner surface of the lamellas lower plate W/m2, K
Convection factor of the walls inner surface W/m2, K Thermal conductivity of glass sheet W/m, K
Thermal conductivity of the insulation W/m, K Thermal conductivity of the plywood W/m, K
Thickness of glass sheet m
Thickness of the insulation m Thickness of the plywood m
(Glass)
Length between the inner surface layer and the first node (in the glass sheet)
m
(Glass)
Length between the first and second node (in the glass sheet)
m
(Glass)
Length between the second and third node (in the glass sheet)
m
Length between the inner surface layer and the first node (in the walls and bottom)
m
Length between the first and second node (in the walls and bottom)
m
Length between the second and third node (in the walls and bottom)
m
Length between the third and fourth node (in the walls and bottom)
m
Length between the fourth and fifth node (in the walls and bottom)
m
Length between the fifth node and the outer surface (in the walls and bottom)
Mass of the air volume Kg Mass of the upper air volume Kg Mass of the lower air volume Kg Mass of the absorber plate Kg
Mass of the inner layer of the bottom Kg Mass of the glass sheet Kg
Mass of the insulation in the upper part of the wall Kg Mass of the insulation in the lower part of the wall Kg Mass of the insulation in the bottom Kg Mass of the lamellas lower plate Kg
Mass of a plywood sheet in the upper part of the wall Kg
Mass of a plywood sheet in the lower part of the wall Kg
Mass of a plywood sheet in the bottom Kg
Mass of the inner layer of the upper part of the wall (Aluminum foil)
Kg
Mass of the inner layer of the lower part of the wall (Aluminum foil)
Kg
Mass of the water volume Kg Throughput of water in the system Kg/s
Solar irradiance W/m2
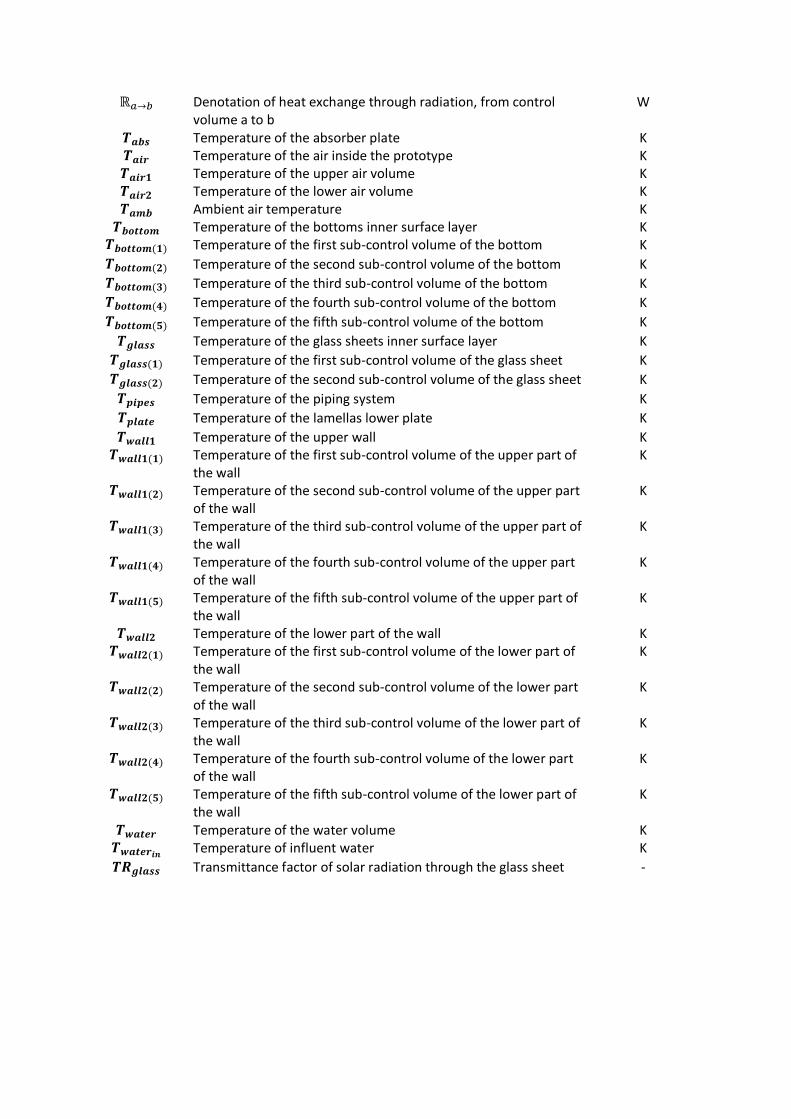
Denotation of heat exchange through radiation, from control volume a to b
W
Temperature of the absorber plate K Temperature of the air inside the prototype K Temperature of the upper air volume K Temperature of the lower air volume K Ambient air temperature K
Temperature of the bottoms inner surface layer K Temperature of the first sub-control volume of the bottom K
Temperature of the second sub-control volume of the bottom K
Temperature of the third sub-control volume of the bottom K
Temperature of the fourth sub-control volume of the bottom K
Temperature of the fifth sub-control volume of the bottom K
Temperature of the glass sheets inner surface layer K
Temperature of the first sub-control volume of the glass sheet K
Temperature of the second sub-control volume of the glass sheet K
Temperature of the piping system K
Temperature of the lamellas lower plate K
Temperature of the upper wall K Temperature of the first sub-control volume of the upper part of
the wall K
Temperature of the second sub-control volume of the upper part of the wall
K
Temperature of the third sub-control volume of the upper part of the wall
K
Temperature of the fourth sub-control volume of the upper part of the wall
K
Temperature of the fifth sub-control volume of the upper part of the wall
K
Temperature of the lower part of the wall K Temperature of the first sub-control volume of the lower part of
the wall K
Temperature of the second sub-control volume of the lower part of the wall
K
Temperature of the third sub-control volume of the lower part of the wall
K
Temperature of the fourth sub-control volume of the lower part of the wall
K
Temperature of the fifth sub-control volume of the lower part of the wall
K
Temperature of the water volume K Temperature of influent water K
Transmittance factor of solar radiation through the glass sheet -

Contents Introduction ................................................................................................................................. 1
Background ........................................................................................................................................ 1
The situation in Ghana ....................................................................................................................... 2
Currently used methods ..................................................................................................................... 3
Solar evaporation ............................................................................................................................... 5
What is distillation? ............................................................................................................................ 6
Health concerns regarding long term consumption of distilled water ............................................... 6
What is sustainable development? .................................................................................................... 7
Environmental aspect ..................................................................................................................... 8
Social aspect ................................................................................................................................... 9
Economic aspect ............................................................................................................................. 9
Contaminants of interest.................................................................................................................. 10
Total Coliform bacteria ................................................................................................................. 10
Arsenic .......................................................................................................................................... 10
Metals .......................................................................................................................................... 11
Salts .............................................................................................................................................. 12
pH ................................................................................................................................................. 12
Aim and purpose .............................................................................................................................. 13
Design of the prototype ................................................................................................................... 13
Method ...................................................................................................................................... 13
Prototyping ...................................................................................................................................... 14
The Housing .................................................................................................................................. 15
System 1 (Copper-piping) ............................................................................................................. 16
System 2 (Lamella) ....................................................................................................................... 17
Pre-field study .................................................................................................................................. 19
Test runs ....................................................................................................................................... 19
Properties of the materials ........................................................................................................... 19
Field Study ........................................................................................................................................ 19
Throughput ...................................................................................................................................... 21
Methods of measurement and analysis ........................................................................................... 21
Total Coliform bacteria ................................................................................................................. 21
Arsenic .......................................................................................................................................... 22
Iron ............................................................................................................................................... 23
Chloride ........................................................................................................................................ 23
pH ................................................................................................................................................. 23
Economic study ................................................................................................................................ 23
Simulink model ................................................................................................................................. 24
Model 1 (Copper-piping) ............................................................................................................... 27
Model 2 (Lamella)......................................................................................................................... 31
Sensitivity analysis ........................................................................................................................ 37
Improvement measures ................................................................................................................... 37
Results ....................................................................................................................................... 38
Pre-field study .................................................................................................................................. 38
Throughput ...................................................................................................................................... 38

Lamella ......................................................................................................................................... 38
Copper-piping system ................................................................................................................... 39
Rate of purification ........................................................................................................................... 43
Total Coliform bacteria ................................................................................................................. 43
Arsenic .......................................................................................................................................... 45
Iron ............................................................................................................................................... 46
Chloride ........................................................................................................................................ 47
pH ................................................................................................................................................. 48
Simulation/Computer models .......................................................................................................... 48
Analysis of models ........................................................................................................................ 48
Analysis of varying operating condition ....................................................................................... 52
Sensitivity analysis ........................................................................................................................ 53
Improvement measures ................................................................................................................ 55
Economic study ................................................................................................................................ 58
Summary .......................................................................................................................................... 59
Discussion .................................................................................................................................. 60
Results .............................................................................................................................................. 60
Rate of purification ........................................................................................................................... 61
Total Coliform bacteria ................................................................................................................. 61
Iron and chloride .......................................................................................................................... 62
Field study ........................................................................................................................................ 62
Lamella ......................................................................................................................................... 62
Copper-piping system ................................................................................................................... 63
Simulations ....................................................................................................................................... 63
Sensitivity analysis ............................................................................................................................ 64
Additional improvement measures .................................................................................................. 64
Economic study ................................................................................................................................ 66
Further studies ................................................................................................................................. 67
Maximum storage time ................................................................................................................ 67
Improved computer simulation model and sensitivity analysis .................................................... 67
Suit case integration and mobile design ....................................................................................... 68
Practical examination of on-site facilities ..................................................................................... 68
Improvement measures ................................................................................................................ 69
Improvement of design and efficiency (in a controlled environment)........................................... 69
Risk and rate of precipitation ....................................................................................................... 70
Life Cycle Analysis and environmental impact .............................................................................. 70
Cost analysis ................................................................................................................................. 71
Conclusion ................................................................................................................................. 72
References ................................................................................................................................. 73
Appendix 1 – Wag-We 10500 Wagtech Digital Arsenator operations manual .................................. i
1
Introduction
Background The World Health Organization (WHO) estimates that about 780 million people worldwide lack
access to clean water (WHO and Unicef, 2010). Having access to a clean water supply is essential not
only to prevent fatal dehydration but also for sanitation purposes, as more than 3.4 million people
die each year from water-, sanitation-, and hygiene-related causes (WHO, 2004).
The WHO also states that there is a clear connection between improved water treatment and
economic growth, followed by an overall development of the area. According to their report Making
water a part of economic development (M. Sanctuary, 2005), poor countries with improved access to
clean water and sanitation services had an annual average economic growth of 3.7%. This is far
higher than the average annual growth of 0.1% for similarly poor countries without the improved
water quality.
This is due partly to the fact that improved water treatment means less incidents of water-related
illnesses, which in turn strengthens the country's work force and boosts productivity, while
decreasing the health care burden. It also has a positive effect on education since fewer children miss
school because of regular illness. This improves the country´s overall education which increases the
skilled labor force and further enhances the economic growth and development of the country. The
WHO report also states that "Actions that target poor people have the largest marginal effect."
meaning there is an enormous importance in improving water treatment in any developing country.
Especially in rural areas (which tend to be the poorest).
A lot of progress has been made in recent years in improving the water standard in highly populated
areas where there is access to a more developed infrastructure, with electrical grids and a larger
demand for clean water. Less developed are water sanitation techniques for areas with lower
population densities, where any method of water purification needs to be independent of electricity
since there is most likely no access to electrical grids.
In order to provide cleaner domestic water to rural populations in third-world countries new cheap
and cost-effective methods for water sanitation is of vital importance. When implementing any kind
of water sanitation in an area, consideration has to be taken regarding potential lack of special skills
and knowledge about water sanitation, since these areas largely coincide with areas of illiteracy and
very limited education. Consideration also has to be made regarding the previous stated lack of
electricity.
This means that any purification process chosen needs to be easy to maintain, work independently
from electrical sources, and be housed in a facility with both low investment and maintenance costs,
to make it affordable for more people.
The economic aspect is very important, not only for the resident population but also to get people
elsewhere to see it as a viable method of water sanitation and motivate different types of
benefactors such as relief organizations to help finance the construction of water purification
facilities in rural areas.
2
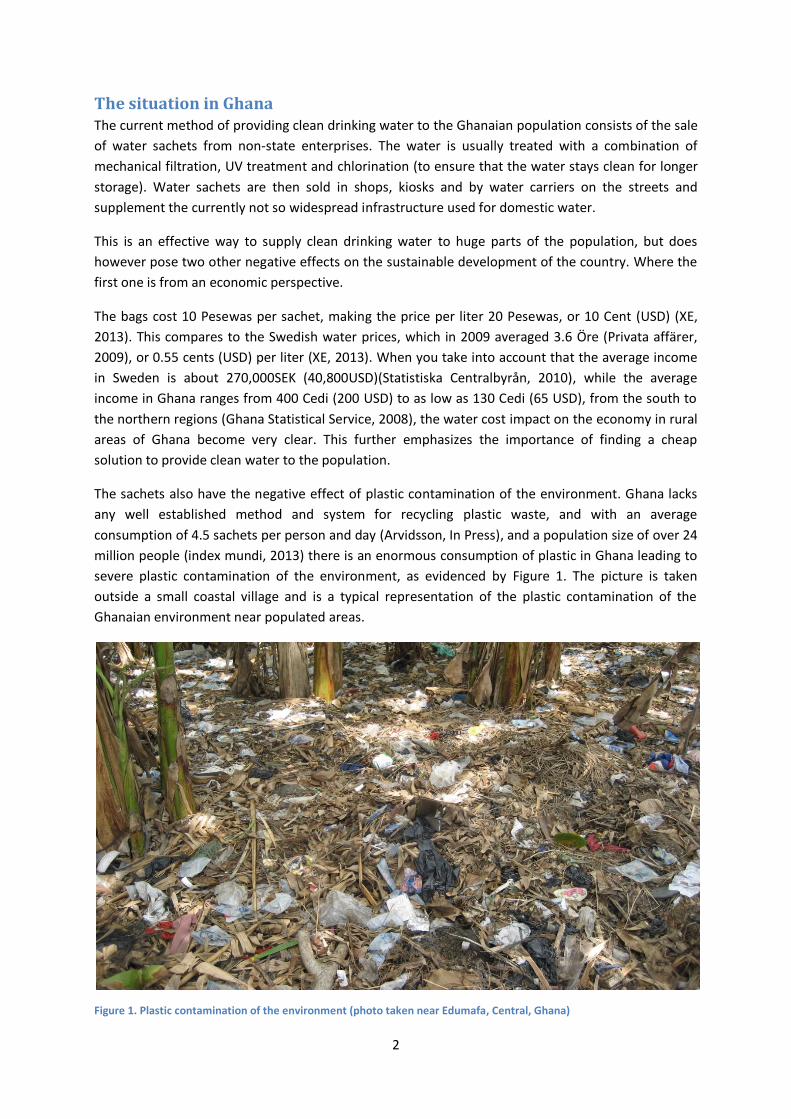
The situation in Ghana The current method of providing clean drinking water to the Ghanaian population consists of the sale
of water sachets from non-state enterprises. The water is usually treated with a combination of
mechanical filtration, UV treatment and chlorination (to ensure that the water stays clean for longer
storage). Water sachets are then sold in shops, kiosks and by water carriers on the streets and
supplement the currently not so widespread infrastructure used for domestic water.
This is an effective way to supply clean drinking water to huge parts of the population, but does
however pose two other negative effects on the sustainable development of the country. Where the
first one is from an economic perspective.
The bags cost 10 Pesewas per sachet, making the price per liter 20 Pesewas, or 10 Cent (USD) (XE,
2013). This compares to the Swedish water prices, which in 2009 averaged 3.6 Öre (Privata affärer,
2009), or 0.55 cents (USD) per liter (XE, 2013). When you take into account that the average income
in Sweden is about 270,000SEK (40,800USD)(Statistiska Centralbyrån, 2010), while the average
income in Ghana ranges from 400 Cedi (200 USD) to as low as 130 Cedi (65 USD), from the south to
the northern regions (Ghana Statistical Service, 2008), the water cost impact on the economy in rural
areas of Ghana become very clear. This further emphasizes the importance of finding a cheap
solution to provide clean water to the population.
The sachets also have the negative effect of plastic contamination of the environment. Ghana lacks
any well established method and system for recycling plastic waste, and with an average
consumption of 4.5 sachets per person and day (Arvidsson, In Press), and a population size of over 24
million people (index mundi, 2013) there is an enormous consumption of plastic in Ghana leading to
severe plastic contamination of the environment, as evidenced by Figure 1. The picture is taken
outside a small coastal village and is a typical representation of the plastic contamination of the
Ghanaian environment near populated areas.
Figure 1. Plastic contamination of the environment (photo taken near Edumafa, Central, Ghana)

3
Some attempts have been made in different parts of Ghana to set up recycling systems for the plastic
waste. But the most common method of disposing the plastic waste, when it has accumulated to a
high enough concentration, is still to incinerate it in open fires (Aboah, 2013). This is not a
sustainable disposal method for plastic waste and can cause the release of pollutants such as
styrene, PVC, PCBs, dioxins and furans into the air, which have a large negative impact on the health
of the population (WECF, 2012). The most common and immediate health effect however is the
release of Volatile Organic Compounds (VOC) and sot due to incomplete combustion, which causes
respiratory problems for people inhaling the fumes. It is therefore of great importance to reduce
plastic consumption and these emissions.
There is also a lot of discussion regarding the plastic waste, and potential counter measures,
occurring in Ghanaian media. One of the counter measures that´s frequently mentioned is the
introduction of an additional import fee when importing plastic materials. This however will most
likely only serve to increase the cost of water sachets for the end-consumers, further increasing the
negative economic effect this system has on the population, especially in rural areas and remote
villages with very low income. So in order to create a stronger workforce in the country and promote
sustainable community development, a cheaper and greener alternative must be found to replace
the plastic sachets.
Currently used methods Some of the methods currently used for water purification are:
SODIS (Solar water Disinfection)
UV-Purification
Boiling
Mechanical Filtration
Biological Treatment
Chlorination, and
Solar Stills
These are all working methods but they each have their own drawbacks that make them unsuitable
in certain situations.
Mechanical filtration is a relatively expensive method when using filters fine enough to remove
micro-particles and can usually not remove anything smaller, like bacteria. It is usually only used to
supplement other treatment methods, and not independently.
SODIS (Wegelin, 2008), UV-Purification (Beerendonk, et al., 2006) and boiling all neutralizes bacteria
and viruses, provided that they are all performed under certain conditions. The SODIS method needs
a certain amount of continues sunlight for a certain period of time, UV-Purification require access to
electricity (which, as mentioned earlier, can be a problem in some areas of the world) and boiling
must be done during a sufficient amount of time and with enough supplied energy to effectively cook
all bacteria and viruses.
These three methods also have the problem of leaving particles and chemical substances, since none
of them actually removes anything from the water, they only breakdown certain substances and
organic compounds, leaving heavy metals and other hazardous substances in the water.

4
These methods can of course be supplemented by the mechanical filtration which improves their
purification potential but can still leaves a few contaminants in the treated water (Salts, heavy
metals).
Biological treatment (often supplemented with mechanical filtration) occurs as well, with a high rate
of purification. The potential problem of using this method is that it often requires people with
process-specific knowledge to manage the facility, low concentrations of certain substances in the
throughput (to avoid killing the microorganisms) and large volumes to function effectively. It also
tend to carry a large investment cost during construction which makes biological treatment
unsuitable for rural areas with low population density and lack of literate, educated personnel, as
well as monetary resources.
Chlorination is the process of adding concentrated forms of chlorine gas or chlorine compounds,
usually hypochlorite, to poison micro-organisms and pathogens, so that they are neutralized.
Chlorination is a common water treatment method in Ghana and is used in municipal water
treatment plants as well as in the non-governmental treatment plants that produce water sachets
(Mensah, 2013). Chlorination, if not carefully managed, has the negative effect of adding flavor on
the water, which is not appreciated by the consumers. The chlorine, which is added last in the
treatment process at the municipal wastewater treatment plants to keep the water clean all the way
to the consumer, also has the negative effect of corroding the water pipes. This can cause major
problems when rapid urbanization and lack of urban planning in the cities that have municipal water
systems has led to service points on the management system being built over and normal
maintenance is no longer practically possible on most of the water supply network (Mensah, 2013).
Solar stills (Jones, 2013), use a process commonly referred to as solar humidification-
dehumidification (Wikipedia, 2013). The basic design consists of a hole dug in the ground and
covered by a plastic sheet. In the center of this hole a container is placed to collect water. By
covering the hole with the plastic sheet, anchoring its corners and weighing down the center using
rocks (for example) a condensation surface is created.
When light from the sun shines on the
basin, the ground heats up which causes the
ground moisture to evaporate. The resulting
steam then rises to the cooler plastic sheet
where it condenses and flows down the
sheet until it reaches the lowered center
and drops into the container. The water is
finally collected, either by picking up and
emptying the bucket periodically, or by
drawing water from the bucket through a
tube, often connected to a hand operated
pump.
Figure 2. Sketch of a basic, basin-type solar still (Source: commons.wikimedia.org)

5
The method is very simple and need no external energy source but the sun to function, which makes
it suitable for rural areas lacking electrical power. The method also has a high rate of purification,
since it distills the water (See: What is distillation? p. 6).There is however a downside to this method
which is a very low throughput, making it very unpractical to use as an only water source. It also
needs a relatively large area which makes it unsuitable for use inside villages.
Solar evaporation
Considering all previously stated aspects, as well as investigating various methods of water treatment
an alternative method of water purification suitable in low population rural areas was chosen.
This system can be described as a modified solar still and will be based on solar energy (an abundant
resource in Ghana) being used to boil water in a closed system (constructed like a solar collector),
where the steam is gathered and condensed outside the “collector” in a shaded condensation
chamber. The resulting condensate is then collected as clean drinking water.
The idea (as with solar stills) is that evaporating the water will leave all substrates, minor particles,
viruses etc behind, while the pure water steam can be collected and condensed to produce clean
(distilled) water.
This method bares much resemblance to the common solar still but with the crucial difference that
condensation and evaporation does not occur in the same space. By separating these spaces, the
facility can maintain a higher temperature difference between where the two processes take place,
resulting in a greater throughput and/or reduced size of the plant.
This makes installation space saving. Its solar collector design also makes it suitable to fit on rooftops
and therefore not take up useful space inside the villages. It can potentially be connected to the
water pipes in the house to provide water directly into the home, and store purified water in a small
water tower on the roof for later use. The facility also has the advantage of contaminants being left
behind in the process accumulates in the evaporation chamber so that this can be drained
periodically and deposited in a suitable location, instead of accumulating in the village land or near
agricultural land. Compared to water purification methods such as boiling, this method is slower, but
still has a higher evaporation rate than solar stills since the latter is based on vapor condensing in the
same space as water evaporating, which limits the speed of both processes.
Similar techniques, such as previously mentioned solar stills are already in use and have proven to be
technically viable methods for different types of water purification (desalination, deflouridation etc).
The method utilizes well-known thermo dynamical principles and combines already commercially
available techniques. Distillation is a well-known method of desalting water and treating it for use in
chemical processes. Solar collectors are used more and more frequently and the issue of boiling in
the pipes due to slow circulation occurs even in colder countries like Sweden.
Compared to other methods of purification, such as boiling, solar evaporation has a slower
throughput since the entire purified water volume needs to be evaporated before it can be collected
as clean water. This however has to be weighed against the fact that the process achieves a much
higher degree of purification.

6
After a while the remaining source water in the evaporation chamber needs to be exchanged to
remove high concentrations of accumulated waste, which can have adverse effects on the
throughput of the water. New source water is then added in to the evaporation chamber and the
process starts all over again.
The plant can be built by a range of different materials with the only requirement that they can
withstand the plants operating temperature without suffering damage or release hazardous
substances in the collected condensate. It also uses a relatively simple method which makes it easier
to understand for users and requires no "special skills" to manage. Another advantage of this method
is the lack of moving parts which increases durability when operating in the field and helps to make
repairs easier.
What is distillation? Distillation (or distilling) is the heating, evaporation and condensation of liquids in order to separate
its components with different boiling points. The constituents being collected is known as distillates.
Figure 3 describes the previously mentioned principles of distillation.
Figure 3. The principles of a common distillation process (Source: commons.wikimedia.org)
The process works by heating the liquid to the point where the temperature is above the boiling
point of one of the constituents, but below the boiling point of the rest. This causes the constituent
with the lowest boiling point to evaporate and separate from the rest of the liquid. The steam is then
directed out of the heating chamber to a secondary chamber where it is cooled down (usually by a
cooling liquid, like water) and allowed to condense into liquid form again.
A common example of distillation is the production of alcohol, where ethanol is separated from the
mash, and the process used in refineries to extract gasoline from crude oil.
Health concerns regarding long term consumption of distilled water Some discussion have been made back and forth regarding potential long term effects of drinking
distilled water (Rona, u.d.), (WQA Science Advisory Committee, 1993), where one of the most

7
common concerns is desalination of the body. Desalination reduces the body’s ability to hold water,
which is of great importance in warm countries like Ghana. This also causes Sodium and Potassium
deficiencies, which eventually leads to impaired function of the body´s osmoregulation, which
handles distribution of fluids in the body.
Another concern raised is the reduced supply of minerals to the body, which are usually present in
ground water. This can over time reduces the body´s alkalinity and increases acidity of the body, due
to the lack of alkaline minerals like calcium (Ca) and magnesium (Mg).
The third concern is acidification of the distilled water itself over time, which relates to the fore
mentioned lack of alkaline minerals. This is caused by the fact that distilled water is an active
absorber that absorbs, among other things, carbon dioxide from the air. The absorbed carbon
dioxide form carbonic acid which makes the water acidic because of the lack of alkaline minerals such
as Ca and Mg (Rona, u.d.).
However, there are also scientists who agree that consumption of distilled water over short periods
help detoxify the body (Rona, u.d.), because the distilled water also absorbs toxins from the body.
The last major concern regarding distilled water is the presence of free radicals in the water and their
potentially harmful effect on the body. It is believed that free radicals may harm cells in the body by
reacting with them and causing cellular mutations, as well as “accelerate” the aging process by so-
called oxidative stress. In ordinary (i.e. mineralized) water the free radicals react with substances in
the water, which neutralized them and prevent any detrimental health effect they could have on the
body.
This concern however is based mostly on theoretical discussion since no conclusive evidence
regarding the relation between free radicals and accelerated aging have been presented so far. This
is to some degree true for all of these concerns since not enough long term studies have been
performed on this subject to give any truly conclusive evidence one way or the other. Therefore
nothing definite can be said regarding this before long term studies have determined whether there
is a correlation or not.
It is also important to point out that all of these potential health risks can be prevented by a
balanced diet and compensatory consumption of alkaline minerals and salt through food, or by
adding it to the water. These potential health risks also have to be weighed against the more likely
health risks associated with drinking water containing pathogens (like Coliform bacteria), arsenic,
other heavy metals or high concentrations of salts etc.
What is sustainable development? Sustainable development is a commonly discussed topic, but one based on a somewhat loose
concept with varying meaning. This thesis work will focus on sustainable development as described
in this paragraph.
In 1987 sustainable development was defined as: "Development that meets the needs of the present
without compromising the ability of future generations to meet their own needs." This definition
was presented by the World Commission on Environment and Development in the document Our
common future (WCED, 1987), also commonly known as the Brundtland report.

8
The mandate of the commission behind the report was to identify and examine the critical issues of
environment and development, and present different proposals to deal with them. (WECD, 1987)
Since then, the work on sustainable development has spread, and so have the efforts to clarify the
concept of sustainable development and also identify the components it consists of.
To help understand the concept and its definition, sustainable development is usually divided into
three main aspects:
Environmental
Social
Economic
The focus of the study may have been on the environmental aspect of sustainable development, but
also worked to involve the economic and social aspects as well. This was done because the definition
of sustainability makes it impossible for development to be sustainable unless all aspects are taken
into account.
Environmental aspect
The environmental aspect of sustainability is probably the one most focused on in recent times. The
society´s dependency on the natural resources available has always been a well-known fact, right
from the early agricultural communities. But what has recently become more apparent is how
society’s management of its current resources affects its future supply of resources, as well as their
accessibility.
It has therefore become increasingly common in economies societies around the world to consider
how natural resources are managed. It has also become a more fundamental understanding that the
well-fare of mankind is directly dependent on our natural resources, and that a consumption rate
above the safe ecological limits will increase the risk of limiting future opportunities for development
(Munasinghe, 2013).
What the environmental aspect actually focuses on are the following elements:
Biodiversity
Resilience
Natural resources
Pollution
By allowing and fostering a greater biodiversity in nature, the resilience of the environment is
increased as well. What this means is that by having a complex system of many components (like
different species) the disruption of one of these components have a lesser effect on the entire
system.
Resilience is the capacity of an ecosystem to respond to a disturbance by resisting alteration and
recover quickly. The resilience of the earth’s entire ecosystem comes from a combination of
biodiversity, energy layers, resources and natural phenomena.
The element natural resources involve reducing our overall consumption of resources as well as
increase our reuse and recycling in order to reduce our impact on the environment.

9
The last element, pollution, pertains to reducing our emissions to reduce global warming and other
negative environmental impacts caused by them. This includes eutrophication, acidification and
adverse health effects on humans and animals.
Social aspect
Social development usually refers to improvements in both individual well-being and the overall social
welfare, that result from increases in social capital – typically, the accumulation of capacity for
individuals and groups of people to work together to achieve shared objectives. (Munasinghe, 2013).
Social capital (Munasinghe, 2013) refers to an abstract resource that describes the amount of social
well-fare in a community or other-defined group of people. This usually depends on the amount of
education, skills and social relationships acquired by the group in question.
This social aspect of sustainability mainly refers to improving the overall quality of life for people by
improved health, financial situation, education and independence. But also emphasizes the
importance of cultural diversity.
The concept of social sustainability parallels the idea of environmental sustainability. By reducing
vulnerability, through increased equity and education, and maintaining the health of social and
cultural system will improve the resilience of the social system.
By strengthening the social systems in rural areas they become more resilient to the influence of
more centralized cultures, which is important to keep the diversity in these social groups alive.
Again, Munasinghe showed the parallels between social and environmental sustainability by
comparing biodiversity and cultural diversity, and how they both increase the resilience in their
respective system (I.e. ecological and social systems).
Economic aspect
The last aspect of sustainability is the economic aspect. Modern economies and markets have in
recent times, like with the environment, begun to think in a more long term perspective regarding
economy, and have realized the importance of economic sustainability. The concept behind
economic sustainability is to maximize income without reducing the stock of assets that generate this
income. By doing so, markets and companies also ensure a steady income in the future.
It was previously mentioned that no development can be considered sustainable without taking into
account all aspects of sustainability. This is true for economic and market development as well, but
does present a challenge of how social and environmental assets and services can be valued in terms
of money. This is however a concern that mostly affects major economies and not so much small
scale development in rural areas.
To scale down the economic aspect to a smaller level, and make it more relevant to rural areas in
Ghana, it is better to focus on economic sustainability in the simple form of costs and savings.
A common problem in this type of remote rural areas is the combination of small income and large
expenses. The low income is typically a result of centralized production and employment. The large
expenses are the result of increased cost for basic goods and social services, due to additional
transport cost, either for the consumer or the supplies. It is also caused by a lack of competiveness in
the fairly limited market, which would otherwise help to keep prices down.

10
Therefore, in order to perform any kind of sustainably development in areas like this, it must be
financially sustainable as well.
To reduce the financial burden of these people it is important to both develop the labor market in
these areas to provide more income, but also to reduce the necessary expenditure. By helping
people to become more self-sufficient in terms of their basic needs (i.e. food, water, clothes), they
can relieve their own financial burdens. This leads to greater financial freedom and empowerment,
but more importantly to a more sustainable way of life in these areas.
Contaminants of interest In order to evaluate any kind of water treatment, relevant parameters must be examined in order to
determine the “effectiveness” of the treatment. The contaminants/parameters of greatest interest
regarding this project were determined to be the following:
Total Coliform bacteria
Arsenic
Metals
Salts
pH
Total Coliform bacteria
Water pollution caused by fecal contamination is a common, and serious, problem in areas with
limited, or non-existing, water treatment. Since most of the fecal contaminants occur in small
concentrations, and with a huge variety of pathogens, there is no practical way of testing the water
for every single pathogen. Instead the presence of these different pathogens can be determined by
testing the concentration of Total Coliform bacteria in the water. (New York Department of Health,
2011). Coliform bacteria are a group of organisms found both in plants and soil, as well as the
gastrointestinal tract of warm-blooded animals. Coliform bacteria seldom causes illness themselves,
but are used as bacterial indicators to determine the sanitary quality of foods and water.
This is because Coliform bacteria originate from the same sources as the harmful pathogens and are
usually present in larger numbers which makes them easier to detect. They also respond to
environment, wastewater treatment and water treatment in a similar way to most of the other
pathogens. “As a result, testing for Coliform bacteria can be a reasonable indication of whether other
pathogenic bacteria are present.” (New York Department of Health, 2011).
Since there are such a huge variety of pathogens indicated by the presence of Coliform bacteria the
diseases and associated symptoms caused by them vary as well. The most common symptoms
however are intermittent recurrences of flu-like symptoms, such as nausea, vomiting diarrhea and
fever (Michigan Department of Environmental Quality, 2013). In susceptible individuals, like infants
and the elderly, these symptoms can evolve to chronic conditions and even be fatal. (Federal-
Provincial-Territorial Committee on Drinking Water, 2008).
Arsenic
Due to a well established gold mining industry in Ghana, there is an excessive amount of arsenic in
nearby water supplies. Arsenic is usually found in ore containing gold, silver, copper and Zink. This

11
often leads to a release of arsenic into nearby bodies of water when gold is mined (Asante & Ntow,
2009).
Arsenic is hazardous, even in low concentrations, and has the negative effect of the enriching in the
body which means that even if the concentration is too low for symptoms to appear at once the
concentration can build up to dangerous amounts over time.
Early symptoms of arsenic poisoning usually include headaches, confusion, abdominal pain, vomiting
and severe diarrhea. As long term effects of the arsenic poisoning start to manifest themselves, the
exposed individuals may start to show signs of neurological damage, hypertension, respiratory
disease, skin lesions, gastrointestinal, peripheral and/or cardiovascular disease as well as diabetes
mellitus. Other potential health effects are Arsenic induced malignancies, normally afflicting the skin,
lung, bladder, kidney, liver and uterus. (Yoshida, et al., 2004) (WHO, 2010).
WHO estimates that arsenic contamination of ground water is a problem that affects about 100
million people across the world (WHO and Unicef, 2010), and a previous field study, performed in the
Ashanti region of Ghana where different sources of drinking water were examined (Lindström &
Sundell, 2004), showed arsenic concentrations going up to as high as 80 ppb in some places. Well
above the WHO guideline value of 10ppb, or 10μg/liter (WHO, 2013).
This means that an evaluation of the prototypes ability to remove arsenic from the water is of vital
importance.
Metals
A common problem in mining areas is the presence of metals, and especially heavy metals, in the
drinking water.
Previous studies conducted in Ghana regarding metal contamination of surface and ground water
sources for domestic use have showed concentrations in several sources above the predefined WHO
guideline values for metal in drinking water.
One study, performed in the northern part of the so-called Ashanti Gold-belt in Ghana (Tay &
Momade, u.d.), showed concentrations of several trace metals exceeding the WHO guideline values
(WHO, 1996) (Lenntech, 2013) as shown in Figure 4.
Figure 4. Histogram of trace metals, in the Ashanti Gold Belt, whose mean concentrations exceed WHO guideline values. (Source: (Tay & Momade, u.d.))

12
Exposure to high levels of metals in drinking water can cause symptoms such as allergic dermatitis
and gastrointestinal distress as well as kidney damage. Long term exposure further increases the
damage to the kidneys and can also lead to liver damage and high blood pressure (US EPA, 2013).
High levels of metal contaminants, especially lead, have also been known to inhibit the physical and
mental development of infants and children. In some cases children have also shown signs of
attention deficits and learning disabilities. This, apart from the acute health effect on the inhabitants,
also have a larger negative effect on the society by creating a long term strain through health care
and assistance need of the affected people. It also hinders the education of the exposed people by
inhibiting their learning abilities and by that, the overall development of the afflicted areas.
In addition to the previously mentioned symptoms, high concentrations of metals in drinking water
have also been known to cause hypertension and gastrointestinal distress (US EPA, 2013) (Corrosion-
Doctors, 2013). Other symptoms of metal poisoning include allergic dermatitis and damage to the
circulatory and nervous system, which is the cause of the attention deficits, and stunting of the
physical and mental development of children.
Figure 4 shows, in particular, a very high concentration of iron in the water. Although iron is not
directly associated with adverse health effects, it can absorb trace impurities and microorganisms
that do have negative health effects.
High levels of iron can also cause the water to get a bad taste and rusty hue, which may deter people
from drinking the water, (US EPA, 2013). This favors the use of water sachets, which results in more
plastic waste as well as raises the living costs of the villagers (due to the cost of the sachets). This
makes iron an important contaminant to remove, or preferably reduce to concentrations below the
WHO guidelines (as it is a vitally essential mineral).
Salts
Since there is a large amount of people living near the coast, in order to survive on fishing as a source
of food and income, high concentrations of sea salt in the drinking water is a major concern for a
considerable part of the population. This does not only have negative health effects after long-term
consumption of increased the blood pressure, which is associated with an increased risk of heart
disease, stroke and congestive heart failure (New Hampshire Department of Environmental Services,
2013). But the salty taste of the water also favors the use of water sachets which, as previously
mentioned, is an undesirable outcome.
pH
As previously mentioned, there are some concerns regarding acidification of distiller water,
especially during long periods of storage.
The main health risk of drinking acidic water is that this in turn can cause an acidification of the body.
Thanks to the body’s natural resilience to changes in its pH, it requires a very strong acidification of
the water to cause any greater effect on the body. Long term consumption off course increases the
effect of the acidic water, even if the pH is fairly high.
But the symptoms that actually arise due to acidification are usually irritation of the eyes, skin and
mucous membranes, as these uses (or consists of) a large proportion of water (WHO, 2005).
13
The potential leaching of minerals from the body, as a result of long-term consumption, may also
cause various mineral deficiencies, and thus all the symptoms associated with this.
As with the mineral deficiencies, acidic water can also cause indirect health damage due to the
leaching of substances from the container the water is stored in. And since the container can consist
of any number of materials it can pose a wide variety of adverse health effects.
Aim and purpose The purpose of this study is to determine whether or not solar evaporation could be used as viable
and sustainable method of water purification in low density rural areas in Ghana. The aim of the
study is to do this by constructing and testing a prototype of a cheap and low weight design built to
be transportable in an ordinary suitcase so it can be transported as normal luggage on a commercial
flight. By extension this investigation also seeks to determine the following:
The amount of solar radiation and the ambient temperature needed to maintain a steady
process.
What rates of throughput can be achieved for different contaminants under normal
operating conditions.
The rate of purification that can be achieved in the solar evaporator.
How the plant can be modified to improve overall effectiveness and throughput.
The materials available on site to construct more, similar facilities.
What the cost of similar facilities built on site would be. And what the payback period will be
for them.
To what extent the prototype can replace the currently used water sachets.
Design of the prototype To ensure functionality of the prototype during the field study it was first constructed and tested at
KAU. This provided an opportunity to rectify any errors as well as implement any potential
improvement on the design before the actual field study.
In order to first test the prototype at KAU and then use it during the field study it had to be designed
to be easily transported. For that reason it needed to be constructed, with regards to weight and size
limitations, so it could be transported in a suitcase that could be brought on the flight down to
Ghana.
The fore mentioned economic and implementation aspects of the project also requires the prototype
to be built with a simple design and by as inexpensive materials as possible.
Method This section of the report addresses the practical work performed in the study. This goes from
designing the prototype during the prototyping phase, to using the computer models to determine
various improvement measures.
Figure 5 below shows a summarization of the content of the method section.

14
Figure 5. Summarization of the content in the method section.
Prototyping The prototype consists of three main components; a housing to hold the solar collector, and two
inter-changeable solar collector systems. Two different solar-absorber-designs where tested to see
which one most effectively absorb sunlight, and therefore provide a faster evaporation rate.
The first design is based on an ordinary solar collector consisting of a copper-piping system through
which the water will pass. The inside of the prototypes housing is covered with aluminum foil to
reflect the incoming sunlight and focus it on the copper pipes.
The second design is uses a lamella to increase the surface irradiated by sunlight and the heat
transfer surface of the water, and is thus believed to be more efficient than the pipe structure. It
does however pose potential problems regarding leakage since such a design is more fragile when
handling during transport and the jointing of the lamellas metal sheets might prove difficult to
completely seal.
Apart from these three components the prototype also needs two water containers so that water
can be supplied to it and the treated water can be collected.
The intake container consisted of a black plastic canister to increase the amount of energy that could
be absorbed from the sunlight and be added to the water in the container, thereby preheating it
before going into the evaporation chamber.
The collecting container on the other hand consisted of white plastic to increase the heat loss from
the container, thereby lowering its temperature and enhancing the condensation of the vapor.
•Concept and design
•Construction Prototyping
• Test runs
• Determining material properties
Pre-field study
•Throughput
•Rate of purification
•Investigative study - Cost and availability of materials Field study
•Construction of computer model
•Sensitivity analysis
•Determination of improvement measures
•Determining influence of material properties on throughput
Simulation

15
The Housing
The prototypes housing consists of two boxes, an inner-box and an outer-box. The inner-box houses
the actual solar collector, or evaporation chamber, while the outer-box houses the inner-box as well
as a layer of insulation, to reduce heat loss from the system.
For transportation purposes the box is constructed by the parts demonstrated in Figure 6 and Table
1. The dimensions are chosen to maximize the bottom surface area of the inner-box, which is the
same as the solar collector area, but still fit in the suitcase acquired for the project. The suitcase has
the internal dimensions 92x68x18, and the parts used in the box where built out of 12 mm thick
shuttering plywood. The shuttering plywood was used because of its high heat resistance, compared
to other composite wood boards.
Figure 6. Outline sketch of housing parts. Quantities and dimension of parts described in Table 1.
Table 1. Quantities and dimensions of prototype housing parts.
Part (nr) Quantity Dimensions (mm)
Length Width
1 2 524 72
2 2 680 72
3 1 680 500
4 2 472 179
5 4 680 179
6 2 680 448
Part 1 and 2, shown in Figure 6, are assembled into a frame which is attached around part 3. This
forms the inner box, as shown in Figure 7. Part 4 and 5 are assembled into a frame and attached
around part 6. This forms one half of the outer box. The same process is then repeated to assemble
the other half. These two halves are attached to each other using hinges at the bottom and "support
plates" on the inside, which forms the completed outer box, shown in Figure 8. At the center of each
"part 5" a screw is mounted on the inside. Two metal U-profiles are then mounted on these screws,
shown in Figure 8 as well. These act as load-bearing support for the internal box. Insulation is then
placed under the U-profiles and along the sides (Figure 9) before the inner box is installed (Figure
10). The inside of the inner box is finally covered by aluminum foil which acts as a reflector and
radiation shield.
1
3 4
2
5
6

16
Figure 7. Assembled inner-box Figure 8. Assembled outer-box
Figure 9. Assembled outer-box lined with insulation Figure 10. Complete, assembled housing
System 1 (Copper-piping)
The system uses 6 long copper tubes, 12 short copper tubes, 8
copper T-connectors, 4 (90 degree) copper bends and 2 brass T-
connectors with clamping rings. The copper T-connectors and
bends are pressed together with the tubes to form a water tight
seal. The brass T-connectors on the other hand are constructed to
be fastened around the copper tubes by tightening them with a
wrench. These connectors can then be unfastened again which
makes it possible to disassemble the system, into smaller parts, for
easier transport.
Dimensions for the parts used for the copper-piping system can be
found in Table 2. Figure 11. Schematic of the copper-piping system.
17
Table 2. Parts and measurements of the copper-piping system.
Part Dimensions (mm)
Inner diameter Outer diameter Length
Long copper tube (4 inner) 13 15 660
Long copper tube (2 outer) 13 15 640
Short copper tube 13 15 45
Copper T-connector 15 19 100/60
Copper bend 15 17 70/70
Brass T-connector 15 19 100/60
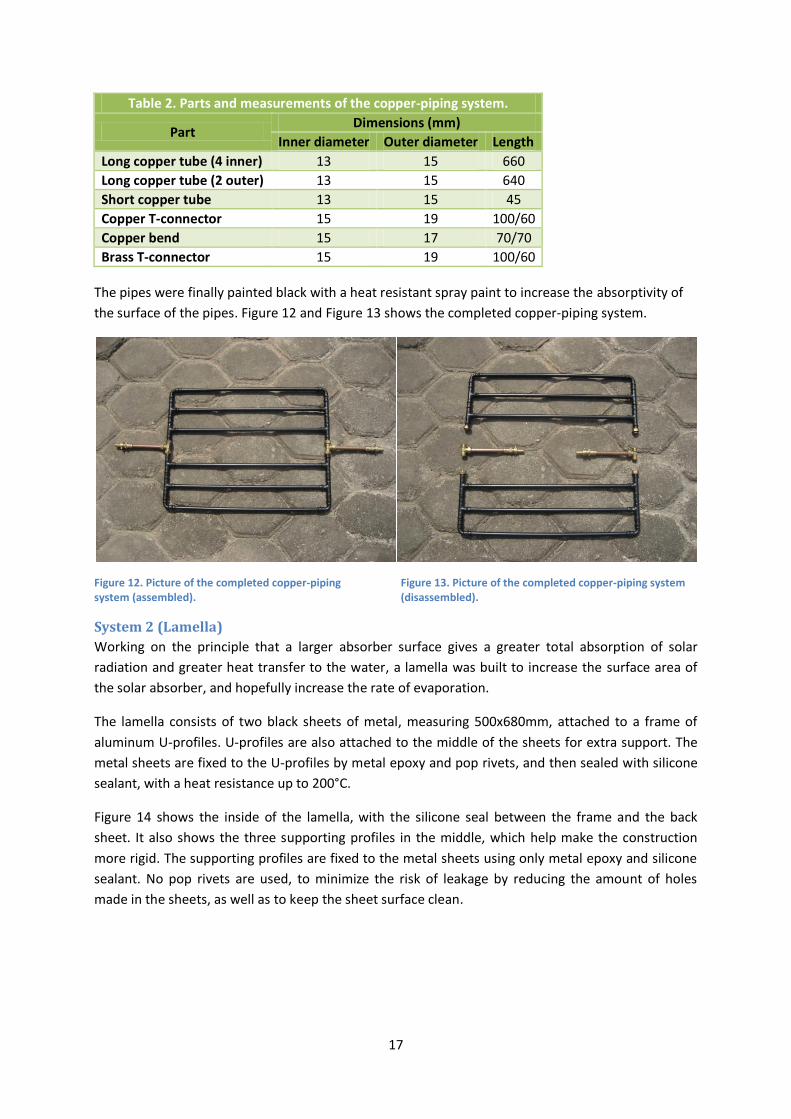
The pipes were finally painted black with a heat resistant spray paint to increase the absorptivity of
the surface of the pipes. Figure 12 and Figure 13 shows the completed copper-piping system.
Figure 12. Picture of the completed copper-piping system (assembled).
Figure 13. Picture of the completed copper-piping system (disassembled).
System 2 (Lamella)
Working on the principle that a larger absorber surface gives a greater total absorption of solar
radiation and greater heat transfer to the water, a lamella was built to increase the surface area of
the solar absorber, and hopefully increase the rate of evaporation.
The lamella consists of two black sheets of metal, measuring 500x680mm, attached to a frame of
aluminum U-profiles. U-profiles are also attached to the middle of the sheets for extra support. The
metal sheets are fixed to the U-profiles by metal epoxy and pop rivets, and then sealed with silicone
sealant, with a heat resistance up to 200°C.
Figure 14 shows the inside of the lamella, with the silicone seal between the frame and the back
sheet. It also shows the three supporting profiles in the middle, which help make the construction
more rigid. The supporting profiles are fixed to the metal sheets using only metal epoxy and silicone
sealant. No pop rivets are used, to minimize the risk of leakage by reducing the amount of holes
made in the sheets, as well as to keep the sheet surface clean.

18
Figure 14. Picture of the lamellas back sheet joined to the aluminum frame.
The second metal sheet is attached to the frame, shown in Figure 15, using metal epoxy and pop
rivets. Because the second sheet couldn’t be sealed internally, as done with the first sheet, it was
riveted with frequent intervals to ensure a tight fit between the sheet and the aluminum frame.
Silicone sealant is applied to the outside of the frame to seal the joint externally.
Figure 15. Picture of the fully assembled lamella with external silicone sealant on the front plate.

19
Pre-field study
Test runs
Before the actual field study a pre-field study were conducted in order to determine whether or not
the prototype would actually work, and to make potential adjustments to its design.
Operating conditions were simulated by the use of 2 spotlights á 500w, mounted orthogonally to the
prototype at a distance that would make the radiation intensity match that of the sun light during a
normal day in Ghana (Arku, 2011).
It should however be noted that the spotlights does not match the sun lights spectrum allocation,
but only match the overall effect. This may result in some differences in the radiation absorption
between pre-tests and field study, but it still gives a good idea of what can be expect from the
prototype.
Properties of the materials
A combination of literature study and experiments where performed to determine the physical
properties of the materials involved. They were determined for later use in a computer model that
simulates operation of the prototype, which will eventually be used to examine potential
improvements of the prototype, as well as determine the influence of solar radiation, ambient air
temperature, size changes and material properties on the effectiveness of the prototype.
By using an infrared camera, thermal emissivity could be obtained for the prototypes respective
surfaces. This was done by using a temperature sensor to determine the surface temperature, and
then adjusting the emissivity settings of the camera until it showed the same temperature as the
sensor. This enabled the surface emissivity to be deduced, with a margin of error of ±0.02. The
margin of error was determined by examining how much the cameras emissivity setting could be
altered without making it show a showing a different temperature than the temperature sensor.
Physical properties of the insulation and plywood were supplied by the reseller, Byggmax (Byggmax,
2013), as well as the web tool Engineering Toolbox (Engineering Toolbox, 2012). Engineering toolbox
was also used to obtain properties for the glass sheet, copper pipes, metal sheets and the physical
properties of water and air. Convection factors and equations used to calculate heat distribution etc
are taken from the books Heat and Mass Transfer: an Engineering Approach (Çengel, 2006) and
Formler och Tabeller (Björk, et al., 2006)
Field Study The field study was conducted at the University of Cape Coast (UCC), and tests were performed both
on water gathered from a small stream on campus and well-water from a small coastal village called
Edumafa, situated between Cape Coast and Accra. The system was set up on the UCC campus
according to Figure 16.

20
Figure 16. Picture of the prototype set for the testing during the field study.
The suitcase used for transporting the prototype was used during the tests to shade the
condensation chamber.
The condensation chamber, placed under the
suitcase, was lined up according to Figure 17, to
create a "trap" for the vapor in the upper part of the
container to prevent it from slipping out. Instead the
vapor accumulates in the upper part of the container
and raises the vapor content in the air, which
promotes condensation of the vapor in the chamber.
This works under the same principle as a
conventional solar still.
During the tests, three temperature sensors where
placed on and around the prototype for logging
relevant temperature data.
The first sensor was placed approximately 2 meters from the prototype to measure the ambient air
temperature. The sensor was overshadowed by a piece of paper to prevent misleading temperature
readings due to direct exposure to solar radiation.
The second sensor was placed in the suitcase to log the temperature of the air surrounding the
condensation chamber. By doing so it was possible to determine how large cooling effect the shading
had on the temperature of the air, which is important since a reduced air temperature around the
condensation chamber is desired to promote condensation of the vapor.
The third sensor was placed in the prototype and was used to log the temperature between the
aluminum foil and the plywood. The temperature curve obtained by this sensor was used as
comparative values against the computer model to further confirm its accuracy, in addition to
comparing the measured and simulated throughputs of the prototype.
Figure 17. Outline sketch of the condensation chamber lined diagonally to create a vapor trap.

21
In addition to the temperature measurements, solar radiation was measured as well, using a solar
sensor. Data from this sensor, along with the ambient air temperature was used as input data for the
computer model.
The input from the sensors was logged using Mitec Universal data logger AT40g (Mitec, 2013).
Because of software incompatibilities, temperature and radiation readings had to be recorded
manually using the logger. This data was therefore only recorded in 5 minute intervals, instead of
being recorded per second.
A preliminary test where performed on the prototype to examine both solar collector systems for
damage and leakage after the transport, to see if any reparative measures needed to be taken before
the actual tests could begin.
Throughput The prototypes throughput was determined by measuring, per hour, the amount of water collected
in the condensation chamber, using a measurement tube. Several throughput tests were conducted
in order to verify the measured amounts of water and get results under different operating
conditions to be used as comparative data against the computer model.
In addition to these tests, throughputs was also measured during the purification tests, but then with
less frequent intervals, as quantitative flow measurements in order to further confirm the
throughput tests.
Methods of measurement and analysis The effectiveness of the prototypes water treatment was tested by measuring the in and out
concentrations/values of the following parameters:
Total Coliform bacteria
Arsenic
Iron
Chloride
pH
Total Coliform bacteria
Total Coliform bacteria tests were performed on treated and untreated water samples using Hach
paddle testers (Hach, 2013) according to their user manual (Hach, 2013).
When using a treatment method like SODIS, there is always a major concern of re-growth of bacteria
in the water. It is therefore said that the water should be consumed within 24 hours of treatment
(Arvidsson, In Press).
Because of this risk of re-growth of Coliform bacteria in the water over time, additional tests were
performed on the treated water after 24 and 72 hours, to determine the re-growth of bacteria over
time.
The treated water will be stored in closed containers, since this is the recommended method of
storage for actual use as well, to minimize exposure to airborne pathogens.

22
Tests were also performed on the water inside the evaporation chamber after four hours of use, since (if the system works properly) boiling will occur, which is a proven method of water treatment, regarding pathogens and other organic contaminants.
If these tests show a successful eradication of bacteria it would mean that the facility could be used simply to boil water to purify it. Assuming bacteria or other pathogens are the only major contaminants in the water.
After the tests had been performed and the results were examined and documented, the paddles where sterilized with bleach to destroy the pathogens on the paddles. This was done to prevent any potential spread of the highly concentrated bacterial cultures in connection with the disposal of the used paddles.
Arsenic
In order to test the concentration of arsenic in the ground water, as well as the treated water, an
arsenator was brought to Ghana. The use of an arsenator has been proven to be a reliable method of
field testing arsenic concentrations in water supplies in Ghana, as shown in the study Treatment of
arsenic contaminated drinking water in Ghana (Lindström & Sundell, 2004). This study also confirms
arsenic concentrations well above the WHO guide lines in several water supplies in Ghana, especially
around the mining industries. The specific arsenator used in these tests where the Wagtech Wag-We
10500 Digital Arsenator (Wagtech WTD, 2013) and tests were performed in detail according to the
manuals shown in appendix 1.
Water sources near the university were examined for arsenic, along with well-water from Edumafa,
using the arsenator. Any water source that showed the presence of arsenic was collected and treated
with the prototype.
The arsenic content was measured in both the collected condensate and in the evaporation chamber
after a long period of operation. This was done to determine the buildup of arsenic, and in extension
to confirm the measurements made on the condensate. Since any amount of arsenic removed from
the treated water remains in the evaporation chamber. The concentration of arsenic in the
evaporation chamber should therefore be consistent with Equation 1, which describes the buildup of
arsenic in the evaporation chamber during operation.
[Eq 1]
Table 3. Description of entities in Equation 1.
Entity Description Value Unit
Concentration of arsenic in the evaporation chamber
Calculated μg/L
Throughput of the prototype Measured L
Concentration of arsenic in the influent Measures μg/L
Concentration of arsenic in the effluent Measured μg/L
Concentration of arsenic in the evaporation chamber at start of operation
Measured (same as )
μg/L
Water volume in the copper-piping system 0.54 L
23
When low concentrations of arsenic where found in the water sample, duplicate measurements were
performed. One normal (according to appendix 1) and one with double water volume to better
measure the concentration and verify the measurements, so it can be determined if the discoloration
of the paper is actually caused by arsenic vapor, or if it is a simple misread by the arsenator due to
fouling of the paper.
Iron
Because no practical or reliable method of testing iron concentrations in the water could be procured
for the field study, water samples were collected and brought back to KAU for analysis. The following
six water samples were collected and analyzed:
Untreated water from UCC
Treated water from UCC
Concentrated water from UCC (Gathered from the evaporation chamber after four hours of
operation)
Two samples of untreated water from Edumafa
Treated water from Edumafa
Iron was, for practical reasons, chosen as the only metal contaminant to be measured in each
sample. This was, according to the principals of distillation, considered to work as a sort of indicator
of the prototypes ability to remove other metals and metal compounds from the treated water as
well.
The concentrations in the samples were measured using Hach Lange LCK311 Iron cuvette tests (Hach
Lange, 2013), which were analyzed in a Hach DR-2800 spectrophotometer (Hach, 2013). Duplicate
measurements were also performed on each sample to verify the results.
Equation 1 was applied on the iron concentrations as well, to further verify the measurements in the
condensate and concentrate.
Chloride
To get a good indication of the salt content of the water the concentration of chloride were also
measured in the water samples brought back to KAU. This was done using Hach Lange LCK321
Chloride cuvette tests (Hach Lange, 2013). These tests were analyzed using the Hach DR-2800
spectrophotometer as well.
Duplicate measurements were performed on the chloride tests as well, to verify the results, and
again, Equation 1 was applied to verify the measured concentrations.
pH
To determine whether or not the treated water becomes acidic of if acidification occurs in the
treated water over time pH will be measured in both untreated and recently treated water, as well as
treated water that has been stored a while. pH was determined using litmus paper, compared
visually to a color–chart.
Economic study In addition to the practical experiments an investigative study was also performed to see what
materials were available for construction of identical, or equivalent, facilities in Ghana and what the

24
onsite production cost would be for new facilities. This is a very important aspect of the project since
cost effectiveness has a great influence on overall sustainability.
The gathered data was at the end of the field study summarized, along with a comparison of the
facility’s construction cost, and the cost of buying sachet water. The resulting statistics was then
analyzed to determine whether solar evaporation can be considered a viable, sustainable method of
water purification or not.
Simulink model To supplement the practical examination of the prototype, a computer model of the system was
created to determine the throughput of the prototype under different operating conditions.
It was also used to determine the influence of solar radiation, ambient air temperature, increased
size and material properties on the throughput.
The model was also used to simulate the effectiveness of a facility built from the materials available
on site in Ghana.
The computer model was constructed using Simulink (MathWorks, 2013), a block diagram simulation
tool, using explicit matrix calculations.
The temperatures in each of the systems control volumes were calculated based on a net energy
flow in each volume through convection, conduction and radiation (denoted , and respectively)
to and from the volume, based on the three basic formulas presented below.
The heat transfer through convection from the contact surface of one control volume (a) to another
(b) was calculated as:
Where:
h is the convection factor of the surface
A is the surface area (contact area)
is the temperature of the control volume being analyzed
is the temperature of the other control volume
Heat transfer through conduction from a temperature node (a) to another (b) in a control volume
was calculated as:
Or:
If it is a node in a surface layer.

25
Where:
is the sum of the length/conduction ratios of all layers between the
temperature nodes in the control volume. Where m represents the total amount of layers.
L is the length of the layer (in the one-dimensional direction of the heat flow)
K is the conductivity of the layer
A is the cross-sectional area (in the one-dimensional direction of the heat flow)
h is the convection factor of the surface
is the temperature of the node being analyzed
is the temperature of the other node
Heat transfer through radiation from a control volumes surface (a) to another (b) was calculated as:
Where:
ε is the emissivity of the surface
A is the surface area
Σ is the Stefan-Boltzmann constant
is the view factor between the surfaces of the control volumes (from volume a to b)
that were calculated using equations in Heat and Mass Transfer: an Engineering Approach
(Çengel, 2006)
is the temperature of the control volume being analyzed
is the temperature of the other control volume
Table 4 contains the input values for the entities used in the computer models.
Table 4. Computer model input values.
Entity Value Unit Entity Value Unit
5.67×10⁻⁸ W/m2, K4 0.027 W/m, K
0.95 - 0.2 W/m, K
0.05 - 0.005 m
0.4494 m2 0.095 m
0.4494 m2 0.012 m
0.368 m2 (Glass)
m
0.1666 m2 (Glass)
m
0.06444 m2 (Glass)
m
0.4494 m2
m
0.2024 m2
m
0.08172 m2
m

26
0.02964 m2
m
420 J/Kg, K
m
1005 J/Kg, K
m
840 J/Kg, K 0.02587 Kg
795 J/Kg, K 0.01293 Kg
420 J/Kg, K 0.00776 Kg
2500 J/Kg, K 2.386 Kg
910 J/Kg, K 0.6375 Kg
4180 J/Kg, K 3.07 Kg
15 W/m2, K 0.1399 Kg
500 W/m2, K 0.06997 Kg
10 W/m2, K 0.688 Kg
2260000 J/Kg 2.386 Kg
10 W/m2, K 0.4862 Kg
10 W/m2, K 0.2431 Kg
20 W/m2, K 2.39 Kg
10 W/m2, K 0.2206 Kg
500 W/m2, K 0.08 Kg
500 W/m2, K 0.5415 Kg
10 W/m2, K 0.9 -
1.05 W/m, K

27
Model 1 (Copper-piping)
The model is based on energy and heat transfers as demonstrated in Figure 18.
Figure 18. Diagram of the control volumes used and heat transfer principles applied in the computer model of the copper-piping system.
The energy and heat transfers shown in Figure 18 where calculated by using Simulink simulations,
based on Equation 2 to Equation 25.
When calculating heat conduction through the ”outer control volumes”, i.e. the walls, bottom and
glass sheet, the volumes were divided into sub-control volumes where the temperature changes
were calculated for a node in each sub-control volume, according to Figure 19 and Figure 20 Fig.
Node zero represents the inner layer used in the calculations of energy exchanges with the other
surfaces in the box. The other nodes represent the five sub-control volumes in the walls and bottom
(Figure 19), and the two sub-control volumes in the glass sheet (Figure 20).
Glas sheet Upper part of wall Lower part of wall
Bottom Air volume Copper pipes
Radiation Convection occurs from all open surfaces in
the prototype
Conduction
Water volume
Heat transfer
Control volumes
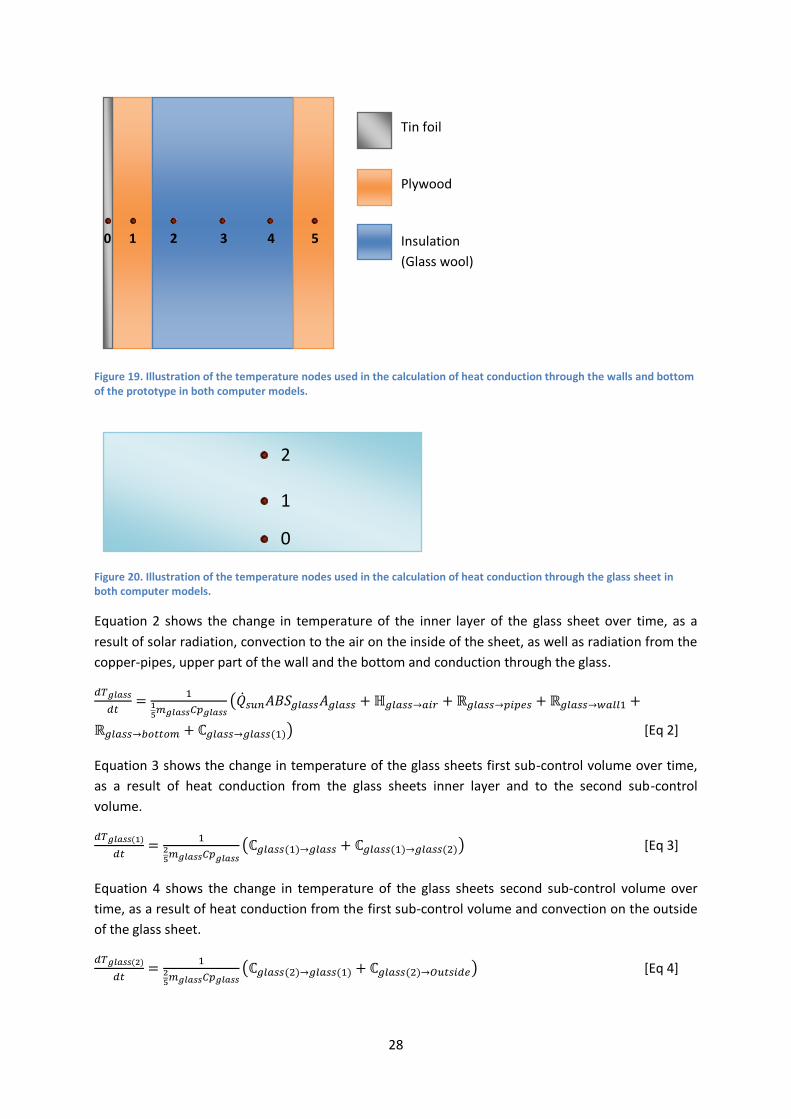
28
Figure 19. Illustration of the temperature nodes used in the calculation of heat conduction through the walls and bottom of the prototype in both computer models.
Figure 20. Illustration of the temperature nodes used in the calculation of heat conduction through the glass sheet in both computer models.
Equation 2 shows the change in temperature of the inner layer of the glass sheet over time, as a
result of solar radiation, convection to the air on the inside of the sheet, as well as radiation from the
copper-pipes, upper part of the wall and the bottom and conduction through the glass.
[Eq 2]
Equation 3 shows the change in temperature of the glass sheets first sub-control volume over time,
as a result of heat conduction from the glass sheets inner layer and to the second sub-control
volume.
[Eq 3]
Equation 4 shows the change in temperature of the glass sheets second sub-control volume over
time, as a result of heat conduction from the first sub-control volume and convection on the outside
of the glass sheet.
[Eq 4]
2
1
0
0 1 2 3 4 5
Tin foil
Plywood
Insulation
(Glass wool)

29
Equation 5 shows the change in temperature of the inner layer of the upper part of the wall over
time, as a result of convection from the air inside the box, radiation from the copper-pipes and glass
sheet and conduction through the wall.
[Eq 5]
Equation 6 shows the change in temperature of the upper walls first sub-control volume over time,
as a result of heat conduction from the upper walls inner layer and to the second sub-control
volume.
[Eq 6]
Equation 7 shows the change in temperature of the upper walls second sub-control volume over
time, as a result of heat conduction from the first sub-control volume and to the third sub-control
volume.
[Eq 7]
Equation 8 shows the change in temperature of the upper walls third sub-control volume over time,
as a result of heat conduction from the second sub-control volume and to the fourth sub-control
volume.
[Eq 8]
Equation 9 shows the change in temperature of the upper walls fourth sub-control volume over time,
as a result of heat conduction from the third sub-control volume and to the fifth sub-control volume.
[Eq 9]
Equation 10 shows the change in temperature of the upper walls fifth sub-control volume over time,
as a result of heat conduction from the fourth sub-control volume and convection on the outside of
the wall.
[Eq 10]
Equation 11 shows the change in temperature of the inner layer of the lower part of the wall over
time, as a result of convection from the air inside the box, radiation from the copper-pipes, glass
sheet and bottom and conduction through the wall.
[Eq 11]
Equation 12 shows the change in temperature of the lower walls first sub-control volume over time,
as a result of heat conduction from the lower walls inner layer and to the second sub-control volume.
[Eq 12]

30
Equation 13 shows the change in temperature of the lower walls second sub-control volume over
time, as a result of heat conduction from the first sub-control volume and to the third sub-control
volume.
[Eq 13]
Equation 14 shows the change in temperature of the lower walls third sub-control volume over time,
as a result of heat conduction from the second sub-control volume and to the fourth sub-control
volume.
[Eq 14]
Equation 15 shows the change in temperature of the lower walls fourth sub-control volume over
time, as a result of heat conduction from the third sub-control volume and to the fifth sub-control
volume.
[Eq 15]
Equation 16 shows the change in temperature of the lower walls fifth sub-control volume over time,
as a result of heat conduction from the fourth sub-control volume and convection on the outside of
the wall.
[Eq 16]
Equation 17 shows the change in temperature of the inner layer of the bottom over time, as a result
of solar radiation, convection from the air inside the box, radiation from the copper-pipes, radiation
from the glass sheet and bottom and conduction through the housing.
[Eq 17]
Equation 18 shows the change in temperature of the bottoms first sub-control volume over time, as
a result of heat conduction from the bottoms inner layer and to the second sub-control volume.
[Eq 18]
Equation 19 shows the change in temperature of the bottoms second sub-control volume over time,
as a result of heat conduction from the first sub-control volume and to the third sub-control volume.
[Eq 19]
Equation 20 shows the change in temperature of the bottoms third sub-control volume over time, as
a result of heat conduction from the second sub-control volume and to the fourth sub-control
volume.

31
[Eq 20]
Equation 21 shows the change in temperature of the bottoms fourth sub-control volume over time,
as a result of heat conduction from the third sub-control volume and to the fifth sub-control volume.
[Eq 21]
Equation 22 shows the change in temperature of the bottoms fifth sub-control volume over time, as
a result of heat conduction from the fourth sub-control volume and convection on the outside of the
bottom.
[Eq 22]
Equation 23 shows the change in temperature of the air inside the prototype over time, as a result of
solar radiation, convection from the air inside the box, radiation from the copper-pipes, radiation
from the glass sheet and bottom and conduction through the housing.
[Eq 23]
Equation 24 shows the change in temperature of the pipes over time, as a result of solar radiation,
convection from the air inside the box, convection to the water inside the pipes, radiation from the
glass sheet, the upper and lower part of the wall and the bottom.
[Eq 24]
Equation 25 shows the change in temperature of the water in the pipes over time, as a result of
convection from the copper-pipes and evaporation of water in the pipes and heating of influent
water.
[Eq 25]
Model 2 (Lamella)
The model is based on the principles of energy and heat transfer as demonstrated in Figure 21.

32
Figure 21. Diagram of the control volumes used and heat transfer principles applied in the computer model of the lamella system.
Note that there are two air volumes in the box, one above and one beneath the lamella. Letting the
lamella sit suspended was done simply for practical reasons, to reduce the amount of holes made in
the box. By using the same holes for the copper-piping and lamella construction the box is easier to
seal.
The energy and heat transfers shown in Figure 21 where calculated using Equation 26 to Equation 51.
Like in the copper-piping model “outer control” volumes were calculated using the principles
described in Figure 19 and Figure 20.
Glas sheet Upper part of wall Lower part of wall
Bottom Upper air volume Lower air volume
Absorber plate Lamella back plate
Radiation Convection occurs from all open surfaces in
the prototype
Conduction
Water volume
Heat transfer
Control volumes

33
Equation 26 shows the change in temperature of the inner layer of the glass sheet over time, as a
result of solar radiation, convection to the air on the inside of the glass sheet, radiation from the
lamella, and upper part of the wall and conduction through the glass sheet.
[Eq 26]
Equation 27 shows the change in temperature of the glass sheets first sub-control volume over time,
as a result of heat conduction from the glass sheets inner layer and to the second sub-control
volume.
[Eq 27]
Equation 28 shows the change in temperature of the glass sheets second sub-control volume over
time, as a result of heat conduction from the first sub-control volume and convection on the outside
of the glass sheet.
[Eq 28]
Equation 29 shows the change in temperature of the absorber plate over time, as a result of solar
radiation, convection from the upper air volume, convection to the water inside the lamella and
radiation from the glass sheet, and upper part of the wall.
[Eq 29]
Equation 30 shows the change in temperature of the lamellas lower plate over time, as a result of
convection from the lower air volume inside the box, convection from the water inside the lamella
and radiation from the bottom, and lower part of the wall.
[Eq 30]
Equation 31 shows the change in temperature of the inner layer of the upper part of the wall over
time, as a result of convection from the upper air volume inside the box, radiation from the absorber
plate and glass sheet and conduction through the housing.
[Eq 31]
Equation 32 shows the change in temperature of the upper walls first sub-control volume over time,
as a result of heat conduction from the upper walls inner layer and to the second sub-control
volume.
[Eq 32]

34
Equation 33 shows the change in temperature of the upper walls second sub-control volume over
time, as a result of heat conduction from the first sub-control volume and to the third sub-control
volume.
[Eq 33]
Equation 34 shows the change in temperature of the upper walls third sub-control volume over time,
as a result of heat conduction from the second sub-control volume and to the fourth sub-control
volume.
[Eq 34]
Equation 35 shows the change in temperature of the upper walls fourth sub-control volume over
time, as a result of heat conduction from the third sub-control volume and to the fourth sub-control
volume.
[Eq 35]
Equation 36 shows the change in temperature of the upper walls fifth sub-control volume over time,
as a result of heat conduction from the fourth sub-control volume and convection on the outside of
the wall.
[Eq 36]
Equation 37 shows the change in temperature of the inner layer of the lower part of the wall over
time, as a result of convection from the lower air volume inside the box, radiation from the lamellas
lower plate and the bottom and conduction through the wall.
[Eq 37]
Equation 38 shows the change in temperature of the lower walls first sub-control volume over time,
as a result of heat conduction from the lower walls inner layer and to the second sub-control volume.
[Eq 38]
Equation 39 shows the change in temperature of the lower walls second sub-control volume over
time, as a result of heat conduction from the first sub-control volume and to the third sub-control
volume.
[Eq 39]
Equation 40 shows the change in temperature of the lower walls third sub-control volume over time,
as a result of heat conduction from the second sub-control volume and to the fourth sub-control
volume.

35
[Eq 40]
Equation 41 shows the change in temperature of the lower walls fourth sub-control volume over
time, as a result of heat conduction from the third sub-control volume and to the fifth sub-control
volume.
[Eq 41]
Equation 42 shows the change in temperature of the lower walls fifth sub-control volume over time,
as a result of heat conduction from the fourth sub-control volume and convection on the outside of
the wall.
[Eq 42]
Equation 43 shows the change in temperature of the inner layer of the bottom over time, as a result
of convection from the lower air volume inside the box, radiation from the lamellas lower plate and
the lower part of the wall and conduction through the bottom.
[Eq 43]
Equation 44 shows the change in temperature of the bottoms first sub-control volume over time, as
a result of heat conduction from the bottoms inner layer and to the second sub-control volume.
[Eq 44]
Equation 45 shows the change in temperature of the bottoms second sub-control volume over time,
as a result of heat conduction from the first sub-control volume and to the third sub-control volume.
[Eq 45]
Equation 46 shows the change in temperature of the bottoms third sub-control volume over time, as
a result of heat conduction from the second sub-control volume and to the fourth sub-control
volume.
[Eq 46]
Equation 47 shows the change in temperature of the bottoms fourth sub-control volume over time,
as a result of heat conduction from the third sub-control volume and to the fifth sub-control volume.
[Eq 47]
Equation 48 shows the change in temperature of the bottoms fifth sub-control volume over time, as
a result of heat conduction from the fourth sub-control volume and convection on the outside of the
bottom.

36
[Eq 48]
Equation 49 shows the change in temperature of the upper air volume over time, as a result of
convection from the absorber plate, upper part of the wall and glass sheet.
[Eq 49]
Equation 50 shows the change in temperature of the lower air volume over time, as a result of
convection from the lamellas lower plate, the lower part of the wall and the bottom.
[Eq 50]
Equation 51 shows the change in temperature of the water volume over time, as a result of
convection from the absorber plate and the lamellas lower plate as well as evaporation of water in
the lamella and heating of influent water.
[Eq 51]
The model is constructed to convert the entire net energy flow to the water into a change in water
temperature as long as it is below 100°C. When the temperature reaches 100°C the entire net energy
flow, if positive, result in the evaporation of water in the pipes and heating of influent water caused
by the resulting mass flow in the system. If the net energy flow is negative this results in a lowering
of the waters temperature.
The view factors in the model where calculated using equations from table 13-1 and 13-2 in Heat and
Mass Transfer: an Engineering Approach (Çengel, 2006).
The following assumptions and simplifications were made when constructing the models:
All surfaces act as gray bodies.
Solar radiation occurs orthogonal to the prototype.
No heat loss occurred through the corners of the housing.
All densities and specific heat capacities were considered to be unchanged at varying
temperatures (mean operating temperatures used when selecting values).
Assumed the relative humidity of ambient air of the prototype. (85%, based on the mean
relative humidity of Ghana (Climatemps, 2013)).
Negligible radiation from the outer box into the environment, because the surrounding
objects view factors were considered to advanced to model, and the temperature difference
between the outer box surface and the surroundings are very small (because of the
insulation in the housing).
Simplified view factor of the walls from the piping system/neglected small radiation angles.
Negligible radiation exchange between surfaces with small view factors (i.e. between the
lower part of the wall and the glass sheet, and between the upper part of the wall and the
bottom, in the copper-piping model).

37
Assumed default values for heat capacities and densities of the components of the prototype
where data had not been specified and could not be determined experimentally.
Neglected potential air flow through the box (due to non-airtight structure).
Uniform temperature of the control volumes.
Neglected thermal resistance in the aluminum foil, copper-pipes and lamella plates
(Confirmed to be negligible by computation).
No absorption of radiation occurs in the air volumes.
Sensitivity analysis
A sensitivity analysis was performed on the computer model to determine its reliability. Each entity's
impact on the result, i.e. the throughput, was examined and the entities were divided into the
following groups:
Given values – these are entities whose value considered without a doubt to be correct. This includes
material values specified by the supplier (densities, thickness etc) and well known constants (Stefan-
Boltzmann constant and the enthalpy of evaporation of water at atmospheric pressure).
Measured values – values determined experimentally during the pre-field study, this includes the
emissivity of various components (Pre-field study, p. 19), as well as their dimensions and weight.
Negligible or very small influence – variables, whose impact on the result of the simulations can be
considered negligible, or very small (<2.2%). These variables values are adjusted (within reasonable
limits) to determine their maximum impact on the results of the simulations. For example, the
convection factor against air with natural convection is assumed to be between 5 and 25 W/m2
(Engineering Toolbox, 2012).
Noticeable influence – these variables were considered to have sufficient impact on the results of the
simulation to be taken into extra consideration.
Improvement measures In order to expand the study and provide a basis for further studies an analysis of possible
improvement measures were performed, in order to see how the plant's efficiency could be
increased. This was done to see how higher throughput could be achieved as well as better reliability
at lower solar radiation and ambient temperature. By developing such improvement it is also
possible to increase the area in which the method can be used efficiently.
The following parameters were examined as possible improvement measures:
Change in material properties.
Change in collector area size.
The effect of differing operating conditions on the prototypes throughput was examined as well.

38
Results
Pre-field study The pre-field throughput tests performed on the lamella gave an evaporation rate of about 300ml
per hour at an irradiance of 950 W/m2. The copper-piping system showed a slightly lower
evaporation rate at about 250ml per hour.
Throughput
Lamella
A preliminary test of the lamella showed only negligible throughput at a solar irradiance of
approximately 920 W/m2.
The test also showed leakage in the silicone joints, which is considered to be the most likely reason
for the poor throughput.
The first test, after additional sealing, showed a throughput of about 10ml/h at a solar irradiance of
approximately 920 W/m2. Again some leakage occurred (although much less than before), which
shows the problem of keeping the lamella water-tight, when using it as it is currently designed.
Because of the leakage of the lamella the test was ended and no operating conditions were
recorded.
The second test was performed after additional sealing of the design during the operating conditions
described in Figure 22 and Figure 23.
Figure 22. Solar irradiance during second throughput measurement of the lamella system
925
930
935
940
945
950
955
960
0 10 20 30 40 50 60 70 80 90 100 110 120 130
W/m²
Run time (Minutes)
Solar irradiance

39
Figure 23. Diagram of ambient air temperatures for the evaporator and the condensation chamber (shaded), during the second throughput measurement of the lamella system
This time the lamella produced a throughput of 85ml after the first hour and an additional 95ml after
the second hour.
After the second hour considerable leakage started occurring in the silicone joints of the lamella. This
was most likely caused by too much stress on the joints due to thermal expansion of the materials in
the lamella, as well as excessive heating of the silicone itself.
Because of the recurring problems of keeping the lamella’s sealing intact it was decided that no
further testing will be performed on the lamella. It was also decided that subsequent tests regarding
the prototypes rate of purification would be performed using only the copper-piping system.
Copper-piping system
The first test of the copper-piping system showed better results than the lamella (because of the
lamellas leakage problem) since no leakage occurred in the copper-piping system. The system
produced about 35ml/h at the solar irradiance shown in Figure 24, and ambient air temperatures
shown in Figure 25.
35
37
39
41
43
45
47
0 10 20 30 40 50 60 70 80 90 100 110 120 130
°C
Run time (minutes)
Air temperatures
Air temperature
Air temperature (shaded)

40
Figure 24. Diagram of total solar irradiance during first throughput measurement of the copper-piping system
Figure 25. Diagram of ambient air temperatures for the evaporator and the condensation chamber (shaded) during the first throughput measurement of the copper-piping system
At this rate of throughput the prototype produces about 4dl of treated water a day, which is not
enough to make it the sole source of drinking water (at its current size).
But even though this amount is too low to singularly sustain a person, temperature measurements of
the water inside the system showed a temperature of only 65°C. This means no actual boiling had
occurred, which would have produced a much greater amount of water vapor. Therefore the amount
of water treated, although low, was considered good under current conditions.
A second test, performed under the conditions described in Figure 26 and Figure 27 resulted in a
throughput of 115ml after the first hour, an additional 290ml after the second hour and finally 120ml
more after the third hour. This would produce between 2.5 and 3 liters of treated water in a day,
which is enough to sustain a full grown person.
300
400
500
600
700
800 0 10
20
30
40
50
60
70
80
90
100
110
120
130
140
150
160
170
180
190
200
W/m²
Run time (Minutes)
Solar irradiance (Day 1)
31
32
33
34
35
36
37
38
39
40
0 20 40 60 80 100 120 140 160 180 200
°C
Run time (minutes)
Air temperatures (Day 1)
Air temperature
Air temperature (Shaded)
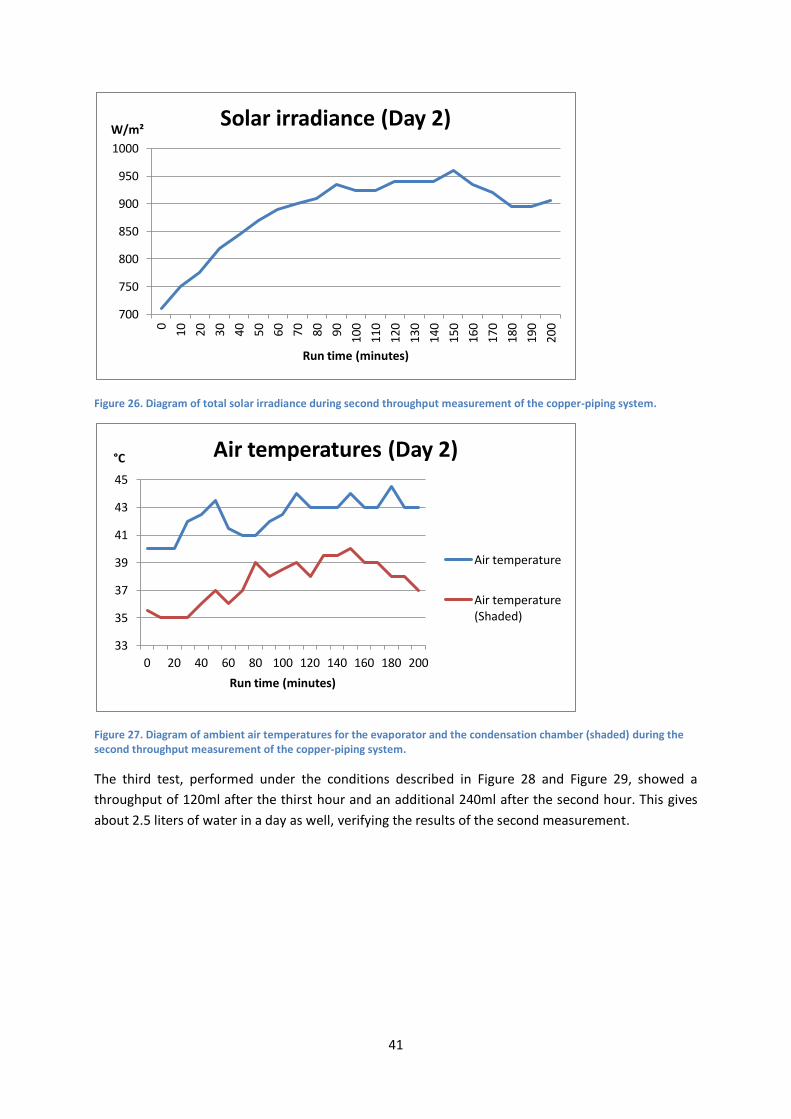
41
Figure 26. Diagram of total solar irradiance during second throughput measurement of the copper-piping system.
Figure 27. Diagram of ambient air temperatures for the evaporator and the condensation chamber (shaded) during the second throughput measurement of the copper-piping system.
The third test, performed under the conditions described in Figure 28 and Figure 29, showed a
throughput of 120ml after the thirst hour and an additional 240ml after the second hour. This gives
about 2.5 liters of water in a day as well, verifying the results of the second measurement.
700
750
800
850
900
950
1000 0
10
20
30
40
50
60
70
80
90
100
110
120
130
140
150
160
170
180
190
200
W/m²
Run time (minutes)
Solar irradiance (Day 2)
33
35
37
39
41
43
45
0 20 40 60 80 100 120 140 160 180 200
°C
Run time (minutes)
Air temperatures (Day 2)
Air temperature
Air temperature (Shaded)
42
Figure 28. Diagram of total solar irradiance during third throughput measurement of the copper-piping system.
Figure 29. Diagram of ambient air temperatures for the evaporator and the condensation chamber (shaded) during the third throughput measurement of the copper-piping system.
Physical examination of the solar evaporator showed a leakage of hot air from the inner-box. This
causes heat loss from the prototype which lowers the rate of evaporation. By creating a tighter seal
around the box a higher rate of throughput could be achieved. This was however not practical during
prototype field testing since the box had to be assembled and disassembled several times, in order to
exchange evaporation systems and place temperature sensors etc.
Further throughput measurements conducted during the rate of purification tests verified the
accuracy of previous measurements on the copper-piping system, except the first test which was
considered a deviation. These measurements, conducted over a longer period than the first ones,
also indicated a throughput closer to 3 liters a day.
840
860
880
900
920
940
960
980
0 10 20 30 40 50 60 70 80 90 100 110 120 130
W/m²
Run time (minutes)
Solar irradiance (Day 3)
33
35
37
39
41
43
45
0 20 40 60 80 100 120
°C
Run time (minutes)
Air temperatures (Day 3)
Air temperature
Air temperature (Shaded)
43
Rate of purification The results of these tests showed a high rate of purification of all measured contaminants. This in
turn showed that the prototype have good, versatile treatment capabilities. The pH tests did not
show any noticeable acidification of the water. Detailed results of all measurements performed
regarding the rate of purification are described in the rest of this section.
Total Coliform bacteria
A bacterial test of the untreated water collected near the Institute of Development Studies on UCC
showed a concentration of approximately five million Coliform bacteria colonies/liter in the water, as
shown in Figure 30.
Bacterial colony density (Colonies/Liter)
1,000,000 (106) 10,000,000 (107)
Figure 30. Result of total Coliform bacteria test on untreated test water, compared to a bacterial colony density chart
The first measurement of the bacterial concentration in the treated water was performed in
conjunction with the first throughput test and showed a concentration of about 1000 bacterial
colonies/liter in the treated water, as shown in Figure 31.

44
Bacterial Colony Densities (colonies/liter)
1000 (103) 10,000 (104) 100,000 (105)
Figure 31. Result of total Coliform bacteria test on test water treated in conjunction with the first throughput test, compared to a bacterial colony density chart
The presence of bacteria in this water samples is believed to be due to contamination of the water
sample as a result of measurement errors in the entire test, as evidenced by the divergent
throughput values obtained during this test.
A second examination of the treated water, conducted in connection with the second throughput
test, showed no signs of Coliform bacteria at all. Further testing of the water after 24 hours of
storage in a closed container showed that no bacterial re-growth had occurred.
An additional test, performed on the water after 72 hours of storage showed a concentration of
about ten thousand Coliform bacteria colonies/liter, shown in Figure 32. Meaning that re-growth had
started to occur during this time span.
Bacterial Colony Densities (colonies/liter)
1000 (103) 10,000 (104) 100,000 (105)
Figure 32. Result of total coliform bacteria test on treated test water, stored for three days in a closed container, compared to a bacterial colony density chart.

45
A bacterial test performed on the water from the evaporation chamber, collected after 4 hours of
operation showed no presence of bacteria in the water, as shown in Figure 33. Additional tests on
the water showed that no re-growth had occurred in the water, which was stored in a closed
container, until after seven days (Figure 33).
Bacterial colony density (Colonies/Liter)
100 (102)
Figure 33. Result of total coliform bacteria test on water from the evaporation chamber after 4 hours inside the copper-piping system, directly after treatment (Left) and stored for seven days in a closed container (right), compared to a bacterial colony density chart.
This means that the installation can also be used to remove bacteria simply by heating the water in
the prototype rather than evaporating it, which would be a much faster process. It also avoids the
potential risk of desalination and acidification associated with drinking distilled water since all
minerals and salts present in the source water would remain in the treated water.
This is however only an appropriate treatment method using source water that doesn’t contain high
levels of salt or metals, any heavy metals or other non-organic contaminants, since all of it would
remain in the treated water.
Arsenic
Measurements performed on the well-water in Edumafa showed a concentration of Arsenic of
3µg/liter. This was confirmed by a second test performed on the water.
Although the concentration is very low, it is enough to use for examination of the prototypes ability
to remove arsenic from the water, since the principles behind the process are such that the rate of
purification is either absolute or non-existent.
It is therefore enough to evaluate the prototypes ability to treat water containing low concentrations
of arsenic and apply the results to any water sample containing arsenic, regardless of the
concentration.
The reference sample, performed on tap water showed a concentration of 0μg/liter which further
attests the arsenators accuracy, in addition to the previously conducted work using the arsenator in
Ghana (Lindström & Sundell, 2004).
46
Measurements performed on the treated water showed no presence of arsenic. Meaning the
prototype can successfully remove arsenic.
The two measurements performed on the concentrate in the evaporation chamber were done so
after about 0.5 liters of water had been evaporated and showed concentrations of 5μg/liter and
6μg/liter in the water.
These results corresponds well with the estimated concentration of 5.8 according to Equation 1
(based on an inlet concentration of 3μg/liter), verifying that the prototype actually removes all of the
arsenic from the treated water.
Iron
Analysis of the water samples brought back to KAU showed concentrations of iron as demonstrated
in Figure 34.
Figure 34. Comparative chart of the concentration of iron in the water samples brought back to KAU for analysis.
Because of very low concentrations of iron in the source water collected in Edumafa it was decided
that the result of the iron concentration test will be focused on the water collected at UCC. Several
tests performed on the Edumafa source water gave an error message when using the
spectrophotometer because of the concentration being too low to accurately measure.
Using Equation 1 and the measured concentrations of iron in the source water and concentrate
samples the concentrations in the condensate were calculated to be between 0.380 – 0.409 mg/l.
This corresponds well with the measured concentrations in the condensate which indicates that the
measurements have been performed correctly and are accurate. It also shows that the solar
evaporator manages to greatly reduce the amount of iron in the treated water.
UCC Source water
UCC Condensate
UCC Concentrate
Edumafa Source water
1
Edumafa Source water
2
Edumafa Condensate
Test 1 2,31 0,409 3,62 0,089 0,066 0,063
Test 2 2,4 0,402 3,7 0,096 0,081 0,073
0
0,5
1
1,5
2
2,5
3
3,5
4
4,5 mg/l
Water sample
Concentration of Iron in the water samples
Test 1
Test 2

47
Chloride
The results of the analysis of concentration of chloride in the water samples brought back to KAU can
be seen in Figure 35.
Figure 35. Comparative chart of the concentration of chloride in the water samples brought back to KAU for analysis.
The diagram shows a fairly high concentration of chloride in the treated condensate of the water
collected at UCC. This is believed to be due to the water in the evaporation chamber boiling over so
that some of the untreated water contaminated the condensation chamber.
Using Equation 1 and the measured concentrations of chloride in the source water and concentrate
the concentration in the condensate was calculated to be between 17.3-17.6 mg/l.
This deviates slightly from the measure values of 18.1 and 26.1. The reason of which is unclear.
Since no concentrate sample from Edumafa was available during the chloride tests at KAU, the
concentration in these condensate samples could not be verified by calculation.
Because the measurements could not be verified by calculation extra tests were performed on these
samples. Since these yielded the same results the concentrations were considered accurate.
UCC Source water
UCC Condensate
UCC Concentrate
Edumafa Source water 1
Edumafa Source water 2
Edumafa Condensate
Test 1 36,2 18,1 53,7 625 603 5,71
Test 2 36,5 26,1 54 681 616 5,6
0
100
200
300
400
500
600
700
800
mg/l
Water sample
Concentration of Chloride in the water samples
Test 1
Test 2

48
pH
Examination of the pH level in the water
treated in the solar evaporator showed a pH of
7 before treatment, as shown in Figure 36. The
tests also showed that the newly treated water
also had a pH level of 7. The examination of
the treated water stored in a closed container
for two days only showed a barely noticeable
color difference on the litmus paper. This could
just as likely be attributed to a normal margin
of error when using the litmus paper. A
comparison of these three tests is shown in
Figure 36.
The second test of the stored water, was performed after six days of storage in a closed container,
and showed a pH level of 7 as well, meaning no acidification occur in the treated water during
storage.
It should be noted that although the water was stored in a closed container, the container was
opened during several occasions, allowing the air in the container to be exchanged. This would
correspond to actual use, where water is taken from a large container at regular intervals. Or if it is
stored in drinking bottles that is opened several times, which indicates that the risk of acidification of
the treated water over time is very small.
Simulation/Computer models
Analysis of models
The completed model of the copper-piping system was compared with measured data. Figure 37
show a comparison of the measured and simulated throughput of the prototype from the first
throughput test. Figure 38 shows a comparison of the measured and simulated wall temperatures
during the same test.
Figure 36. The pH levels of the water used in the solar evaporator. From top to bottom: Untreated, newly treated and treated and stored for 2 days in a closed container.
49
Figure 37. Comparative diagram of measured and simulated throughput of the prototype during the first throughput test of the copper-piping system.
Figure 38. Comparative diagram of measured and simulated wall temperatures during the first throughput test of the copper-piping system.
The comparative examination was repeated for the second and third throughput test and the results
are shown in Figure 39 to Figure 42.
0
50
100
150
200
250
300
350
0 0,5 1 1,5 2 2,5 3
°C
Run time (h)
Comparison of measured and simulated throughput (Day 1)
Measured throughput
Simulated throughput
0 10 20 30 40 50 60 70 80 90
0 0,5 1 1,5 2 2,5 3
°C
Run time (h)
Comparison of measured and simulated wall temperatures (Day 1)
Measured temperature
Simulated temperature

50
Figure 39. Comparative diagram of measured and simulated throughput of the prototype during the second throughput test of the copper-piping system.
Figure 40. Comparative diagram of measured and simulated wall temperatures during the second throughput test of the copper-piping system.
0
100
200
300
400
500
600
0 0,5 1 1,5 2 2,5 3
°C
Run time (h)
Comparison of measured and simulated throughput (Day 2)
Measured throughput
Simulated throughput
0
20
40
60
80
100
120
0 0,5 1 1,5 2 2,5 3
°C
Run time (h)
Comparison of measured and simulated wall temperatures (Day 2)
Measured temperature
Simulated temperatures
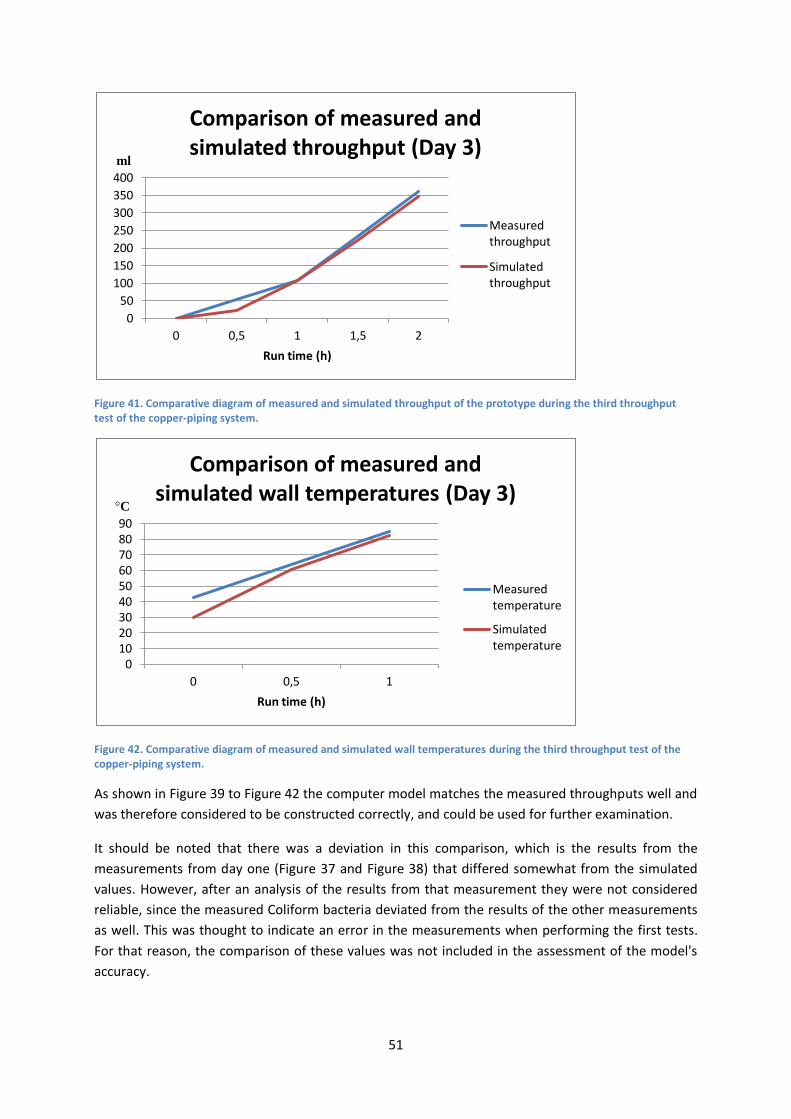
51
Figure 41. Comparative diagram of measured and simulated throughput of the prototype during the third throughput test of the copper-piping system.
Figure 42. Comparative diagram of measured and simulated wall temperatures during the third throughput test of the copper-piping system.
As shown in Figure 39 to Figure 42 the computer model matches the measured throughputs well and
was therefore considered to be constructed correctly, and could be used for further examination.
It should be noted that there was a deviation in this comparison, which is the results from the
measurements from day one (Figure 37 and Figure 38) that differed somewhat from the simulated
values. However, after an analysis of the results from that measurement they were not considered
reliable, since the measured Coliform bacteria deviated from the results of the other measurements
as well. This was thought to indicate an error in the measurements when performing the first tests.
For that reason, the comparison of these values was not included in the assessment of the model's
accuracy.
0
50
100
150
200
250
300
350
400
0 0,5 1 1,5 2
ml
Run time (h)
Comparison of measured and simulated throughput (Day 3)
Measured throughput
Simulated throughput
0 10 20 30 40 50 60 70 80 90
0 0,5 1
°C
Run time (h)
Comparison of measured and simulated wall temperatures (Day 3)
Measured temperature
Simulated temperature

52
The simulated and measured wall temperatures differ somewhat in the beginning of the graphs
because the model assumes a starting temperature of 30°C in the wall, which is not the actual case.
Because of problems adjusting the model of the lamella according to the measured data (due to the
leakage of the system), as well as the fact that all other practical tests were performed using the
copper-piping system, the remaining simulations were performed using the model of the copper-
piping system exclusively.
Analysis of varying operating condition
This segment of the report shows the compiled results regarding the effect of different operating
conditions on the throughput of the prototype.
Figure 43 shows the effect of varying solar radiation intensity on the prototype's throughput, and is
specified at a constant ambient air temperature of 40°C.
Figure 43. Diagram showing the influence of solar radiation on the throughput of the prototype, at a constant ambient air temperature of 40°C.
Figure 44 shows a similar comparison of air temperature on the flow, specified at a constant solar
irradiance of 900W/m2.
0
200
400
600
800
1000
1200
0 0,5 1 1,5 2 2,5 3 3,5 4
ml
Run time (h)
Influence of solar radiation on throughput
1100 W/m²
1000 W/m²
900 W/m²
800 W/m²
700 W/m²

53
Figure 44. Diagram showing the influence of ambient air temperature on the throughput of the prototype, at a constant solar irradiance of 900W/m
2.
Sensitivity analysis
The results of the sensitivity analysis are presented in Table 5 through Table 8, where all variables
have been divided into their appropriate categories.
Table 5 and Table 6 show the computer model entities whose values were considered completely
accurate as these were either generally recognized values, supplied from manufacturers or
determined through practical examination. Because they were considered completely accurate their
margins of error were all set to zero percent.
Table 5. Description of computer model entities with given values.
Entity Description
Stefan-Boltzmann’s constant
Specific heat capacity of the inner layer of the wall (aluminum foil)
Enthalpy of vaporization for water
Thermal conductivity of the insulation
Thickness of the insulation
Thickness of the plywood
Table 6. Description of computer model entities with measured values.
Entity Description
Emissivity of the piping system
Emissivity of the wall
Inner surface area of the bottom
Surface area of glass sheet
Inner surface area of the piping system
Projected surface area of the pipes
Pipes outer surface
Inner surface area of the upper part of the wall
0
100
200
300
400
500
600
700
800
900
0 0,5 1 1,5 2 2,5 3 3,5 4
ml
Run time (h)
Influnce of ambient air temperature on throughput
45°C
40°C
35°C
30°C
25°C

54
Inner surface area of the lower part of the wall
Thickness of glass sheet
Mass of the bottom
Mass of the insulation in the upper part of the wall
Mass of the insulation in the lower part of the wall
Mass of the insulation in the bottom
Mass of a plywood sheet in the upper part of the wall
Mass of a plywood sheet in the lower part of the wall
Mass of a plywood sheet in the bottom
Mass of the inner layer of the upper part of the wall (aluminum foil)
Mass of the inner layer of the lower part of the wall (aluminum foil)
Mass of the water volume
Table 7 and Table 8 describe the entities whose values were assumed and could therefore be
inaccurate and cause a margin of error in the results of the computer simulations. The category
maximal margin of error refers the largest percentage change in throughput due to changes in the
value of the concerned variable. This was based on 4 hours of runtime at a solar irradiation of
900W/m2 and an ambient air temperature of 40°C.
Table 7. Description of computer model entities with negligible or very small influence on simulation results and reliability.
Entity Description Chosen value
Value interval
Unit Maximal margin of error
Specific heat capacity of the air
1005 1005-1026 J/Kg, K 0.34% less
Specific heat capacity of the glass sheet
840 0,7-0,84 J/Kg, K 0.9% more
Specific heat capacity of the insulation
795 500-1000 J/Kg, K 0.34% more or 0.22% less
Specific heat capacity of the plywood
2500 2000-3000 J/Kg, K 1,05% more or 1,07% less
Specific heat capacity of the water volume
4180 4180-4220 J/Kg, K 0.05% less
Convection factor of the glass sheets inner surface
10 5-25 W/m2 0.1% more or 0.5% less
Convection factor of the inner surface of the piping system
500 500-100 000 (extreme case)
W/m2 1.18% more
Convection factor of the walls inner surface
10 5-25 W/m2 0.036% more or 0.07% less
Convection factor of the walls outer surface
10 5-25 W/m2 0.07% more or 0.02% less
Thermal conductivity of the glass sheet
1.05 0.96-1.2 W/m, K 0.036% more or 0.037% less
Thermal conductivity of the plywood
0,2 0.07-2 W/m, K 2.2% more or 1.1% less
Mass of the air volume ρ=1147 ρ=946-1147 Kg (Kg/m3)
0.012% more
Mass of the glass sheet 3.07 ρ=2400-2800 Kg 0.41% more or

55
ρ=2600 (Kg/m3) 0.4% less
Table 8. Description of computer model entities with noticeable influence on simulation results and reliability.
Entity Description Chosen value
Value interval
Unit Maximal margin of error
Convection factor of the glass sheets outer surface
10 5-25 W/m2 0.2% more or 29.5% less
Convection factor of the outer surface of the piping system
20 5-25 W/m2 1.1% more or 8.1% less
As Table 5 through Table 8 shows most of the entities only had a very small, or negligible, impact on
the results of the simulations. Only two variables showed noticeable influence on the results of the
simulations.
The entities that were found to have the greatest impact on the reliability of the computer model
were the convection factor of the outer surface of the glass sheet and the convection factor of the
outer surface of the piping-system.
Although the convection factor of the outer surface of the piping system is specified to give a
maximal margin of error of up to 8 percent it is more likely to have a smaller impact than that. This is
due to the fact that the 8% margin of error is stated for a very low (and unlikely) convection factor on
the surface of the pipes. It is therefore a more likely assumption that the maximal margin of error of
the convection factor is closer to 3-4% (using a more realistic variable interval).
Improvement measures
All results given in Figure 45 to Figure 48 are specified at a solar irradiance of 900W/m2, an ambient
air temperature of 40°C and a run time of 4 hours.
Figure 45 and Figure 46 shows the effect on throughput as a result of increased size of the prototype.
600
1100
1600
2100
2600
3100
3600
1 2 3 4
ml
Size increase factor
Effects of increase in length or width on throughput
Width
Length

56
Figure 45. Diagram showing the effects of increase in the prototypes length or width on the throughput.
Figure 46. Diagram showing the effects of increase in the prototypes length and width on the throughput.
The size increase factor in Figure 46 means an increase in size of both length and width. This means
that a size increase factor of 4 in this diagram gives a surface area 16 times greater than that of the
prototype.
Apart from the actual effect of the increase in size on the prototypes throughput, Figure 45 and
Figure 46 also show that a size increase of both length and width has greater effect on the
prototypes throughput than the sum of the individual size increases.
Figure 47 and Figure 48 shows the effect of varying absorber properties on the throughput of the
prototype.
Figure 47. Diagram of the influence of the solar absorbers emissivity on prototype throughput.
0
2000
4000
6000
8000
10000
12000
14000
16000
1 2 3 4
ml
Size increase factor
Effects of increase in length and width on throughput
Length and width
806
808
810
812
814
816
818
820
822
0,8 0,85 0,9 0,95 1
ml
Emissivity
Influence of absorber plate emissivity on throughput
Throughput

57
Figure 48. Diagram showing the influence of the specific heat capacity of the solar absorber on throughput.
As shown in Figure 47 and Figure 48, absorber plate materials with high emissivity, and low specific
heat capacity are desired to increase throughput of the prototype. This is because both these
properties increase the temperature of the absorber which in turn increases the heat transfer to the
water.
795
800
805
810
815
820
825
830
200 400 600 800
ml
Specific heat capacity (J/Kg,K)
Influence of absorber plates specific heat capacity on throughput
Throughput

58
Economic study The investigative, economic study resulted in the material costs shown in Table 9.
Table 9. Cost of materials for facilities constructed on site, based on the size of the prototype.
Part Cost (Cedi) Cost (USD)
Glass sheet 9 4.5
Pipes (x8)(Stainless steel) 25 12.6
Metal sheet (x2) 20 10
Plywood 15 7.5
Nails 10 5
Total cost – Copper piping system 59 29.6
Total cost – Lamella 54 27.1
During the investigative study, neither insulation nor aluminum foil were found, as they do not seem
to be commonly available materials in Ghana. This means that neither they, nor the outer box of the
housing (since it becomes redundant without insulation) would be used in a real plant, and are
therefore not included in the estimated cost.
The cost of the two systems, which is 59 Cedi for the copper-piping system and 54 Cedi for the
lamella system, equals the cost of 590 and 540 water sachets (295/270 liters). With a normal
throughput of about 3 liters of water per day, this gives a payback period of 98 days for the copper-
piping system. It is unclear how long it would take for a working lamella system to pay off, since its
throughput rate could not be tested properly in this field study. But based on the preliminary study
which indicated that the evaporation rate was about the same as for the copper-piping system, this
would give a payback period of about 90 days for the lamella.
Since not all materials used in the prototype where available on site the throughput of a facility built
by the material specified in Table 9 was simulated, at a solar irradiance of 900W/m2 and a constant
ambient air temperature of 40°C. Figure 49 shows the throughput of this “Ghanaian equivalent” as
compared to the prototype used in the field study.
0 100 200 300 400 500 600 700 800 900
0 0,5 1 1,5 2 2,5 3 3,5 4
ml
Run time (h)
Comparison of throughput between prototype and Ghanaian equivalent
Prototype
Ghanaian equivalent

59
Figure 49. Comparison of throughput between the prototype used in the field study and Ghanaian equivalent, based on material available on site. Throughput is calculated at a solar irradiance of 900W/m
2 and ambient air temperature at
40°C.
As Figure 49 shows, a facility of the same size as the prototype, constructed of the same kind of
materials procured on site in this study (provided that all material properties are assumed correctly),
would produce closer to 2 liters per day instead of the 3 liters per day the prototype can produce.
During the simulation of the expected throughput of the Ghanaian equivalent the following absorber
material properties (steel) where assumed:
Emissivity: 0.95
Density: 7800 kg/m3
Specific heat capacity: 490 KJ/Kg, K
All other properties such as convection factors, and volume were assumed to be the same as for the
copper pipes.
Summary Table 10 shows a complete summarization of the results regarding the rate of purification of the
prototype, as presented in this study.
Table 10. Summary of test results regarding rate of purification.
Contaminant Sampling site Concentration/Value
Before After Coliform bacteria – Test 1 UCC 5,000,000 colonies/l 1,000 colonies/l
Coliform bacteria – Test 2 UCC 5,000,000 colonies/l 0 colonies/l
Coliform bacteria – Test 2, Storage (24h) UCC - 0 colonies/l
Coliform bacteria – Test 2, Storage (72h) UCC - 10,000 colonies/l
Coliform bacteria – Concentrate UCC 5,000,000 colonies/l 0 colonies/l
Coliform bacteria – Concentrate, Storage (7 days)
UCC - 100 colonies/l
Arsenic – Test 1 Edumafa 3 µg/l 0 µg/l
Arsenic – Test 2 Edumafa 3 µg/l 0 µg/l
Arsenic – Reference UCC 0 µg/l -
Iron – Test 1 UCC 2,31/2,4 mg/l 0,41/0,4 mg/l
Iron – Test 2 Edumafa 0,09/0,1 mg/l 0,06/0,07 mg/l
Iron – Test 3 Edumafa 0,7/0,8 mg/l -
Iron – Concentrate UCC 2,31/2,4 mg/l 4,07/4,27 mg/l
Chloride – Test 1 UCC 36,2/36,5 mg/l 18,1/26,1 mg/l
Chloride – Test 2 Edumafa 625/681 mg/l 5,71/5,6 mg/l
Chloride – Test 3 Edumafa 603/616 mg/l -
Chloride – Concentrate UCC 36,2/36,5 mg/l 53,7/54 mg/l
pH – Test 1 UCC 7 7
pH – Test 2 UCC 7 7
pH – Storage (24h) UCC 7 7
pH – Storage (72h) UCC 7 7

60
Discussion
Results As the results show the prototype performed well, treating about 3 liters of water during a normal
day (with the copper-piping system). It also managed to drastically reduce the concentrations of all
measured contaminants from the treated water, without any noticeable acidification. This shows
that solar evaporation is a functional and sustainable water treatment method even though more
studies are needed before any full scale implementation of the method can be performed.
Given the current cost of a solar evaporator, as presented in this study, and the economic situation
of the people living in the rural areas of Ghana, the evaporator do present a rather large expense.
But although the purchase of such a facility would be a major investment for people in the rural
areas of Ghana, it has a relatively short payback period and is a good long-term investment to
promote sustainable development for several reasons.
It reduces the country's electricity needs by replacing the consumption of plastic bags, thereby
reducing both the production of the bags and the use of electricity in the UV purification processes in
the water treatment plants. Through these actions it replaces the use of electricity (a scarce resource
in Ghana) with solar heat, one of the most abundant resources available in Ghana.
Another positive effect on the sustainable development is the fact that the facility could reduce the
need for transport of the currently used water sachets to remote parts of the country. It would also
reduce the overall consumption of plastic in the country. Which in turn reduces the emissions of air
pollutants, currently caused by incineration of the resulting plastic waste, due to the lack of recycling
systems and organized waste disposal.
With a reduced or eliminated need for water sachets, the people on the Ghanaian countryside would
become more independent by being able to supply themselves with safe drinking water. They would
no longer be dependent on regular water deliveries or would have to store large amounts of plastic
bags for longer periods of time, resulting in a high risk of bacterial re-growth, even in the treated
sachets.
But perhaps the most rewarding effect of the solar evaporator, from the Ghanaian people´s point of
view, would be the long term economic benefit. By replacing the need for water sachets with self-
supplied water, each person saves an average of 45 Pesewa a day, or 164 Cedi per year. This is a
significant sum of money, to any Ghanaian, but especially those living in rural areas where the
incomes, if they exist at all, are very low.
Because the financial burden of buying water is so great in some remote parts of the country, there
are also a large percentage of people who instead rely on untreated water from natural sources. This
may in some cases also be caused by a lack of regular distribution of water sachets in remote or
isolated areas in Ghana. Since the consumption of untreated water in these areas in many cases lead
to recurring disease, there is good reason to introduce this method in these areas.
By replacing the existing unfiltered local water source with treated water, a stronger work force can
be obtained, which people in rural areas may be very dependent on.

61
From a longer perspective the positive effects of consuming treated water are reinforced by the
reduction of child illness (which is normally a great concern regarding contaminated water). This is
achieved partly by reducing the amount of resources required for the treatment of the children. It is
also achieved through the increased educational opportunities by reducing the restrictive element of
chronic disease.
By helping to give rural people the opportunity to educate themselves, as well as improve their
overall quality of life it is possible to reduce the clear social inequality in the country. This
opportunity can also be seen as a long term investment in the rural areas (but also in the entire
country), since an educated population will be more self sufficient and less dependent in outside
help. This applies to more efficient farming and fishing, as well as health treatment and prevention of
illnesses. Educated people also tend to get a better understanding of concepts such as household
economics, which also helps strengthen their financial situation.
As a result of improved health and education these areas also receives social empowerment, and
become more resilient, which helps maintain a solar and cultural diversity.
Rate of purification
Total Coliform bacteria
During the examination of the prototypes ability to remove coliform bacteria from the treated water,
the analysis showed that the condensate from the first test contained small amounts of coliform
bacteria. The analysis also showed that the concentrate in the evaporation chamber did not contain
any noticeable amount of bacteria at all. The reason for this was considered to be most likely due to
airborne bacteria that contaminated the condensation chamber during operation, as the container
had been open during the test.
During the following tests extra precautionary measures were taken to minimize the condensation
chambers exposure to airborne bacteria. Since these tests showed lower/no concentrations of
bacteria in the condensate (in accordance with the expected result), this was considered to confirm
that it was airborne bacteria that contaminated the original result. Possibly in combination with small
amounts of water from the evaporation chamber that overflowed in the beginning of the test.
By completely sealing the condensation chamber the risk of airborne bacteria contaminating the
condensate can be completely removed. This does however have two side effects, one positive and
one negative. The positive side effect of sealing the chamber is that the risk of vapor leakage is
minimized, as opposed to the vapor trap concept used in this study where there is still a chance that
some of the vapor escapes.
The second, negative, effect of sealing the condensation chamber is that as more and more vapor is
collected the pressure in the chamber increases. This in turn increases the pressure in the rest of the
system which increases the vapor pressure and by that the temperature needed in the evaporation
chamber to continue the evaporation process.
Because the test paddles couldn’t be stored in a dark space, at a maximum of 8°C at all times (which
is their recommended storage conditions), it is possible that the results from these test aren’t fully
reliable. The fact that the test weren’t performed under ideal conditions either, attests this
assumption.
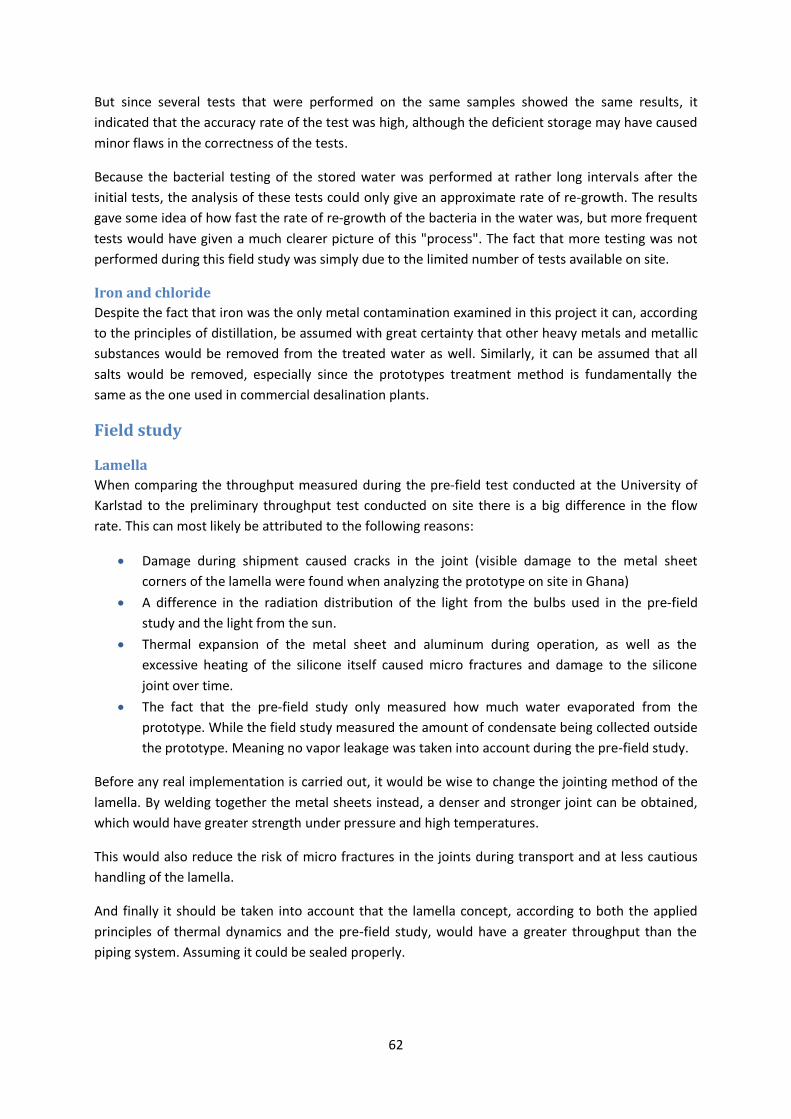
62
But since several tests that were performed on the same samples showed the same results, it
indicated that the accuracy rate of the test was high, although the deficient storage may have caused
minor flaws in the correctness of the tests.
Because the bacterial testing of the stored water was performed at rather long intervals after the
initial tests, the analysis of these tests could only give an approximate rate of re-growth. The results
gave some idea of how fast the rate of re-growth of the bacteria in the water was, but more frequent
tests would have given a much clearer picture of this "process". The fact that more testing was not
performed during this field study was simply due to the limited number of tests available on site.
Iron and chloride
Despite the fact that iron was the only metal contamination examined in this project it can, according
to the principles of distillation, be assumed with great certainty that other heavy metals and metallic
substances would be removed from the treated water as well. Similarly, it can be assumed that all
salts would be removed, especially since the prototypes treatment method is fundamentally the
same as the one used in commercial desalination plants.
Field study
Lamella
When comparing the throughput measured during the pre-field test conducted at the University of
Karlstad to the preliminary throughput test conducted on site there is a big difference in the flow
rate. This can most likely be attributed to the following reasons:
Damage during shipment caused cracks in the joint (visible damage to the metal sheet
corners of the lamella were found when analyzing the prototype on site in Ghana) A difference in the radiation distribution of the light from the bulbs used in the pre-field
study and the light from the sun. Thermal expansion of the metal sheet and aluminum during operation, as well as the
excessive heating of the silicone itself caused micro fractures and damage to the silicone
joint over time. The fact that the pre-field study only measured how much water evaporated from the
prototype. While the field study measured the amount of condensate being collected outside
the prototype. Meaning no vapor leakage was taken into account during the pre-field study.
Before any real implementation is carried out, it would be wise to change the jointing method of the
lamella. By welding together the metal sheets instead, a denser and stronger joint can be obtained,
which would have greater strength under pressure and high temperatures.
This would also reduce the risk of micro fractures in the joints during transport and at less cautious
handling of the lamella.
And finally it should be taken into account that the lamella concept, according to both the applied
principles of thermal dynamics and the pre-field study, would have a greater throughput than the
piping system. Assuming it could be sealed properly.

63
Copper-piping system
The copper-piping system on the other hand showed no signs of leakage. However both the
materials used, and the method of construction was, although relatively simple, on a construction
level above that of a normal village in Ghana. That means for this system to get a greater chance of
successful implementation two changes should to be made:
Change the materials used in the construction of the piping system to something cheaper
and more commonly available than copper, like stainless steel. Which would still performed
relatively good compared to the copper piping system.
Instead of on site construction in every area the method is implemented in, the system could
be assembled at a centralized location with more suitable equipment for large scale
production (which would lower the cost of the individual facilities), and then be sold or
donated to villages in the rural areas.
In the second throughput measurement the temperature of the air in the suitcase stayed
approximately 4 degrees below the ambient air temperature, as opposed to the first measurement
where it stayed relatively constant, even when it became warmer than the ambient air temperature.
This was assumed to be due to the fact that the suitcase, during the first test, was set up so that the
air in the bag was trapped, thus forming a kind of heat storage. For the second test the paper used to
shade the open sides (shown in Figure 16, p. 20) were ripped in places, allowing air to flow through
the suitcase. This gives a lower air temperature for the condensation chamber since heat doesn’t
build up inside the suitcase, and the air remains shaded.
It is worth mentioning that there is one noticeable difference between the prototype and a finished
“product” that could have a large impact on the plants efficiency and throughput.
Due to the need of a design that could easily be assembled and disassembled (as mentioned in the
results section), the box could not be completely sealed. This meant that air could flow through the
construction, thus creating a heat loss.
Simulations Even though practical examination of the results of the computer model simulations and the
measured throughput corresponded well with each other there were still several aspects of the
models that could have been improved.
For example, all values related to specific heat capacities and conductivities were taken at average
operating temperatures for the plant. By adding dynamic values for the variables, so that they would
have changed according to the changes in temperature of the various materials, the model would
have become even more precise.
Another thing that affected the model is the fact that no conduction through the corners of the
housing were taken into account. This heat loss had admittedly been very low due to the insulation
used in the housing, but could still have been included, if more time had been available for the
construction of the computer models.
Sensor data collected during the measurements was originally intended to be logged automatically,
but could not due to technical problems between the logger’s software and the laptop used in the

64
study. Instead the data was logged manually, at an interval of five or ten minutes (varying between
different measurements). If the data had been logged as intended, sensor data could have been
recorded at one second intervals giving more accurate readings from the simulations.
But even though the model did not use continuous sets of data it managed to give results that
matched well with the measurements, suggesting that highly accurate sensor data may not have
been as important as it first was.
Sensitivity analysis Since the sensitivity analysis performed in this study only examined single entities impact on the
simulation results, it didn’t take any regard to how the different variables impact each other’s effect
on the model.
By not examining this, the sensitivity analysis didn’t take any regard to any possible “stack up” effect
of several variables margins of error. It is therefore possible that several variables together, could
have created a larger margin of error than stated in the sensitivity analysis.
This was, however, disregarded in this study since a more thorough sensitivity analysis, than the one
performed, was considered to lie outside the focus area of the study. It was also disregarded due to
the fact that the model was considered to be tuned well with the measured data under several
different operating conditions, which was thought to indicate that the model (and the assumptions
made in it) was very well-made.
Additional improvement measures One problem that arose during the field study was the lack of a practical way to keep a constant
water level in the system. This proved to be a concern since it is would be most desirable to have a
constant water level, at about the same height as the outlet from the evaporation chamber.
Such a water level would maximize the contact area between the water and the absorber plate, or
piping walls, as well as to minimize the room for larger vapor pockets near the chambers outlet.
If larger vapor pockets are created they will lead to overheating of the steam. This becomes a huge
loss of energy in the system by reducing the amount of water being evaporated, since the
overheated vapor “steals” heat. It also increases the risk of overheated vapor filling the vapor trap in
the condensation chamber, allowing some of it to escape through the unsealed inlet before it can
cool down and condense.
But having the system filled up so close to the outlet also poses the risk of overflow into the
condensation chamber, which would mean that untreated water would contaminate the condensate.
Because of these practical problems two improvement measures was conceived that was not
investigated in the original improvement study conducted using the computer model. The purpose of
these two improvements is to assure a constant and desired water level in the system.
The first improvement were taken directly from the design of conventional distilleries, and is as
simple as raising the hose from the evaporation chambers outlet. This creates a water barrier that
still allows vapor through but stop water, up to a certain level. The principle of this idea is shown in
Figure 50.

65
Figure 50. Principle diagram of the outlet water barrier.
The second improvement is little more advance than the first but would work well for larger facilities
and would remove the need for continuous monitoring and adjusting of the water level to maintain
maximal evaporation.
The improvement is meant to work on the principles demonstrated in Figure 51.
Figure 51. Principle diagram of the constant intake water level system.
Figure 51 shows two water chambers being connected in series to the inlet of the actual facility.
These are connected to each other by tubing from the base of one chamber to the other.
The idea of the design is to pass a string through the tube and connect it to a float in each end. The
density of these floats will be much lower than that of water, and differ from one another, giving the
float in chamber two (on the right) a lower density than the one in chamber one (on the left).
66
Because the float in the chamber two has a lower density than the one in chamber one it will cause
that float to sink and clog the tube whenever the water in chamber two reaches a high enough level.
When the water level in chamber two lowers, as water is being evaporated in the system, it allows
the float in chamber one to rise and unclog the tube connecting the chamber. This allows water to
flow from the first chamber to the second, refilling it. As the water level increases in chamber two its
float rises as well. This causes the float in chamber one to be drawn down and seal the mouth of the
tube again.
Through periodic increase and decrease in water level in chamber two, the system manages to
maintain an almost constant water level in the main system. By also implementing the first
improvement measure, the main system can handle small variations in the water level without risk of
overflow and contamination of the condensate.
The second improvement measure is, as mentioned, more advanced than the first but is well suited
for larger facilities and has the advantage of allowing periodic refilling of the inlet tank, and still
assuring a continuous flow at the inlet of the evaporator.
It is also easily adapted to maintain any desired water level, since it is adjusted simply by changing
the length of the string between the two floats.
Economic study The materials given from the economic study where commonly available materials that where
considered most similar to the materials used in the prototype. But since no facility was actually
constructed and tested using these material it is unclear what the throughput of such a facility would
actually be. By assuming standardized physical properties for the materials and modifying the already
constructed computer model, it was possible to estimate a probable throughput of this facility. But if
any further studies where to be performed regarding this subject, investigating the efficiency of
locally constructed facilities should be considered a highly prioritized part of that study.
Further investigation should also be performed regarding the expected lifespan of the facility since
this have a major impact on the economical aspect of the facilities sustainability.
The fact that a facility built from local materials would have a slightly lower throughput than the
prototype was somewhat expected since the copper pipes were chosen specifically to ensure better
heat conduction and greater throughput of the prototype. This was done to increase the chance of
obtaining enough treated water during the field study to carry out all necessary tests.
It should also be noted that the estimated cost of locally constructed facilities, presented in this
report, is based on the price of buying low quantities of materials as a white foreigner (which can
increase the cost considerably). By purchasing larger quantities of the materials, as well as further
investigating normal price ratings in Ghana to achieve a much better price negotiation it is very likely
that the cost of materials could be cut considerably.
Secondary to the cost investigation the economic study also included the estimation of a payback
period. Since this only focuses on when the evaporator “breaks even” without regard to any further
savings, it does give a complete picture of how the solar evaporator impacts personal finance. To get
an even better idea of the economic impact of introducing the solar evaporator it would also be a

67
good idea to take into account an expected service life of the solar evaporator. By doing so it would
not only be possible to see the payback period but also the total amount of money that can be saved
by the reduced cost of buying water sachets.
It is also a possibility that the solar evaporator has a shorter service life than the payback period
(although this seems highly unlikely) which would make it an unsustainable investment. This further
emphasizes the importance of determining its expected service life.
Further studies Although many promising and useful results were obtained in the study, there is still much work to
be done in a number of areas related to the development of solar evaporation as a water treatment
method.
Listed below are suggestions for suitable subjects for further studies of this work:
Maximum storage time
Improved computer simulation model and sensitivity analysis
Suit case integration and mobile design
Practical examination of on-site facilities
Improvement measures
Improvement of design and efficiency (in a controlled environment)
Risk and rate of precipitation
Life Cycle Analysis and environmental impact
Cost analysis
Maximum storage time
As part of the investigation of the prototypes ability to remove Coliform bacteria from the treated
water, the re-growth rate of bacteria in the stored water was analyzed as well. Since the containers
holding the water aren’t themselves stored in any specially isolated environment, and are meant to
be opened and closed several times, it is practically impossible to keep the water free from bacteria
over time.
The study did however perform a very limited investigation of the re-growth rate, in far too
inadequate forms to give any definite results as to how long exactly the water can be stored without
risk of high concentrations of bacteria being regenerated in the water. This was considered an
important aspect to keep in mind during the field study, as bacterial contamination of drinking water
is one of the most common causes of water-related diseases.
For that reason this would be an incredibly relevant aspect to consider for further study in order to
determine how long treated water from the plant can actually be stored without becoming a health
risk, before it should be discarded.
Improved computer simulation model and sensitivity analysis
By improving the model in which the efficiency of the plant is simulated it is possible to obtain more
reliable simulated data regarding throughput under various operating conditions.
In order to improve the existing model additional equations could be added to the models to adjust
the value of variables such as specific heat, thermal conductivity and convection factors of the

68
various materials according to their temperature. This would result in more accurate heat flow at all
operating conditions and temperatures. More accurate calculation of the view factors between the
inner surfaces would also help to improve the model. This mainly concerns the piping system model,
since view factors between the pipes and walls are more difficult to accurately calculate. Additional
view factor should also be added so that radiation between the upper part of the wall and the
bottom, and between the lower part of the wall and glass sheet can be taken into account as well.
In addition to this these measures, the model could also be improved by dividing the current control
volumes into even smaller ones. This would result in more accurate temperatures and energy flows
in each specific part of the model, which improves its overall accuracy.
Even though it does not really concern improvement of the computer model itself, it would also be a
good idea to use more detailed input data (i.e. logged data), to help obtain more accurate results in
the computer model. To supplement this improved computer model a more detailed sensitivity
analysis should also be performed.
In contrast to the sensitivity analysis performed in this study, this analysis should include an
examination of different variables cumulative impact on the outcome.
The main advantage of an improved computer model is that it would provide a solid foundation for
further studies. This especially applies for studies on improvement measures and investigation of the
water treatment methods potential in other parts of the world as well, with different climates.
Suit case integration and mobile design
Although the suit case was only used in this study for transportation purposes by pure necessity, as
well as used during the field study to shade the condensation chamber, for lack of a better tool. It
would be a good idea to look into ways to integrate a similar system into a suit case, or make it
otherwise mobile.
This would make the system easier to transport than a fixed one, and could be a practical solution to
help spread the technology. Especially if a centralized mass construction of smaller treatment
facilities would be considered.
In contrast to fixed facilities this would be used in cases where a mobile water treatment method is
desired. It could also be used as emergency equipment for use in areas suddenly lacking access to
clean water, as a result of a natural disaster or other reasons.
Similar projects where water treatment facilities have been integrated into cases have already
proved to be effective ways of transporting and spreading treatment methods (Inhabitat, 2013)
(Aqua Sun International, 2013). This suggests that it might be a good idea for further studying.
Practical examination of on-site facilities
During the field study performed during this thesis work the prototype and its properties were
practically examined during a 5 week period in Ghana. During that time important tests were carried
out regarding the prototypes purification capabilities, and throughput under what was considered to
be typical weather conditions in Ghana.

69
This testing period, however, was too short to investigate how the prototype performs under
different operating conditions, mainly since weather conditions remained almost constant. It was
also too limited to investigate how different placement and design affects its throughput.
A third important, social, aspect that was overlooked in this study was the treatment methods
impact on the local population it is meant to be used by.
It would therefore be a good idea for further study to examine how the system can be designed, built
and modified on site to make it simple, efficient and reliable. And to investigate how the method
best can be implemented in rural areas in Ghana in order to get people to learn and, more
importantly, actually start using similar facilities for their own use.
Improvement measures
Related to the previously proposed study, a stand-alone or supportive study could be conducted with
focus on the improvement of the facility, through change in design and materials (with focus on
material properties). By improving the design the facility becomes both more efficient and more
reliable.
Through a higher throughput the number of water sachets that can be replaced by the facility is
increased, resulting in a shorter payback period. This does however assume that all water treated by
the facility is used.
This study should also examine how different building materials, available on site, can be used to
improve the facility´s throughput. By studying the different material properties influence on
throughout in more detail, the study could also develop guidelines for the selection of materials for
future facilities.
Improvement of design and efficiency (in a controlled environment)
In contrast to the original idea of a facility developed and constructed on-site, it would also be of
great interest to look at how the plant can become more efficient through development in a
controlled environment and through specialized manufacturing.
The idea behind this is that if the plant were to be developed and manufactured in a manner more
similar to how conventional solar panels are treated, it would be possible to construct a system with
significantly greater efficiency than the prototype used in this study (Or any on-site developed
facility).
This would provide a higher throughput, which would reduce the collector area required to treat a
given amount of water a day, which is handy if the plant is supposed to be mounted on smaller
rooftops or such.
A higher efficiency would also, as mentioned earlier in the report, help to provide a more reliable
throughput at lower solar irradiation, and would make it possible to use the facility in areas with
cooler climate and less solar irradiation as well.
Assuming the resulting increase in efficiency, and probably life span as well, are greater than the cost
increase, it would make the facility a more sound investment with an even shorter payback period.
Again this of course assumes that the plant never stands idle and that all of the treated water is
consumed.
70
It should also be note that if the increase in price is too high it may discourage or even make it
impossible for people with very low income to invest in it.
Risk and rate of precipitation
As the process in the solar evaporator works to treat water it increases the concentration of various
substances in the evaporation chamber. The substances remaining in the chamber are then at risk of
precipitating, and sticking to its inner surfaces.
Due to the facility´s need for unobstructed inner surfaces of the evaporation chamber, both to assure
high thermal conductivity through the walls as well as to obtain a larger heat transfer surface area
and free fluid flow through the chamber, it is an important aspect to consider.
Further studies regarding this subject should therefore both examine the effects of precipitation on
the efficiency of the facility, and at what rate precipitation occurs in the evaporation chamber. It
would also be prudent to examine how various contaminants affect the rate of precipitation and,
perhaps most importantly, what measures can be taken to prevent precipitation in the evaporation
chamber. This could for example include filtering out larger particles before they enter the chamber,
by a simple fabric filter made from small pieces of cloth, or any other simple adjustment to the
design.
Life Cycle Analysis and environmental impact
During the field study an examination was performed, to a lesser extent, on the effect of the
implementation of solar evaporation on the consumption of plastic bags. Since the sale of water
sachets is the current method of providing clean water to the majority of the population.
This examination however focused on the economic aspect of buying these sachet, which meant the
other aspects of the sustainability of the method was not investigated.
To focus more on the environmental aspect of this, it would be a good idea to examine how the
reduction in consumption of the plastic bags affects sustainable development from an environmental
stand point, by looking at the total environmental impact of these sachets.
This includes everything from manufacturing and processing to transportation and disposal, which in
Ghana usually means incineration. Since this is primarily done by individuals burning the plastic in
large piles, it means it is disposed through unfiltered, and often incomplete, combustion.
But in order to provide a full and fair view of the methods environmental impact the study would
also have to include a thorough Life Cycle Analysis (LCA) of the facility.
Such an analysis would need to consider the overall environmental impact of every production and
work process associated with the construction and use of the facility, from preliminary work to final
disposal, and can be divided into the following key elements:
Total environmental burden of the production of the facility´s individual components.
Total environmental burden of the production of the facility.
Total environmental burden of the facility´s operation.
Life expectancy of the system.
Total environmental burden of final disposal of the facility and its components.

71
By weighing the result of the facility´s LCA against an equivalent analysis of the plastic bags the study
can obtain a clear understanding of the facility´s total impact on the sustainable development in
Ghana, from an environmental perspective.
The LCA study could, in addition to this, be expanded to also examine how the choice of materials
may affect the facility´s environmental impact. It can also be used to help set up guidelines for the
selection of material for future facilities.
Cost analysis
In addition to the environmentally-based LCA, it is also very important to get a clear picture of the
cost of future facilities, as this is vital for the economic aspect of the facilities impact on the
sustainable development in Ghana.
It is also one of the most crucial factors to make the method successful, since it in many contexts is
the main driving factor for both potential benefactors who want to contribute to future facilities, and
the people who will invest in (and actually benefit from) the facility.
For those reason it would be a good idea to expand the already performed cost analysis, into a more
in depth analysis.
Through a more detailed examination of the cost of materials it would be possible to determine a
much more accurate construction cost of the facility. Such a study should investigate both large and
small scale production of facilities either on-site or through centralized production, to also account
for different manufacturing strategies impact on production cost.
The study should also be conducted in cooperation with domestic partners or organizations to
ensure better knowledge and better bargaining power regarding the price of materials needed.
By conducting a broader analysis of production costs, and by having a stronger price negotiating
position, it is very likely that the cost of materials would be significantly lower than what is stated in
this report.

72
Conclusion Even though the method is new, and requires much further work to reach commercialized
implementation, it has already proven to be a relatively simple and reliable method.
The study has also, in addition to presenting its own findings, provided a basis for a series of further
studies of solar evaporation as a sustainable water treatment method.
Despite some difficulty in performing measurement during the field study the results of these tests
were considered sufficiently reliable to provide a clear indication of the prototype´s ability to treat
water.
Although the process can be difficult to manage perfectly in such a small scale as the prototype, the
tests still showed that the concentrations of all measured contaminants decreased drastically in the
treated water. This proves that the method works with a high rate of purification and is well suited as
an independent water purification method in rural areas of Ghana, as well as other areas with similar
climate.
The conclusion of the thesis is therefore that solar evaporation is a functioning and sustainable water
treatment method, suitable for implementation in rural areas in Ghana (as well as a large number of
other areas despite widely varying water contaminants). The study also showed that the method has
the potential to be implemented in much greater areas than just the ones with continuous high
levels of solar radiation.
73
References Aboah, J., 2013. Employee at Institute for Development Studies at University of Cape Coast
[Interview] (03 04 2013).
Aqua Sun International, 2013. Aqua Sun. [Online]
Available at: http://www.aqua-sun-intl.com/home?start=15
[Accessed 16 07 2013].
Arku, F. S., 2011. Academic Journals. The modelled solar radiation pattern of Ghana: Its prospects for
alternative energy source. [Online]
Available at: http://www.academicjournals.org/jasd/PDF/pdf2011/Mar/Arku.pdf
[Accessed 29 01 2013].
Arvidsson, D., In Press. SODIS, Karlstad: University of Karlstad.
Asante, A. K. & Ntow, J. W., 2009. Status of Environmental Contamination in Ghana, the Perspective
of a Research Scientist. In: Y. Obayashi, et al. eds. Interdisciplinary Studies on Environmental
Chemistry - Environmental Research in Asia. Matsuyama(Ehime): Center for Marine Environmental
Studies, pp. 257-260.
Beerendonk, E., Medema, G. & Hijnen, W., 2006. Science Direct. Inactivation credit of UV radiation
for viruses, bacteria and protozoan (oo)cysts in water: A review, 3(22).
Björk, L.-E., Brolin, H., Pilström, H. & Alphonce, R., 2006. Formler och Tabeller. 1st Edition ed.
Eskilstuna: Bokförlaget Natur och Kultur.
Byggmax, 2013. Byggmax. [Online]
Available at: http://www.byggmax.com/se-sv
[Accessed 02 2013].
Çengel, A. Y., 2006. Heat and Mass Transfer: A Practical Approach. Third edition ed. New York:
McGraw-Hill.
Climatemps, 2013. Climatemps. [Online]
Available at: http://www.ghana.climatemps.com/
[Accessed 19 06 2013].
Corrosion-Doctors, 2013. Corrosion-Doctors. [Online]
Available at: http://corrosion-doctors.org/NaturalWaters/Health.htm
[Accessed 08 06 2013].
Engineering Toolbox, 2012. The Engineering Toolbox. [Online]
Available at: http://www.engineeringtoolbox.com/
[Accessed 03 2013].
Federal-Provincial-Territorial Committee on Drinking Water, 2008. Health Canada. [Online]
Available at: http://www.hc-sc.gc.ca/ewh-semt/alt_formats/hecs-sesc/pdf/pubs/water-
eau/pathogens-pathogenes/pathogens-pathogenes-eng.pdf
[Accessed 18 05 2013].

74
Ghana Statistical Service, 2008. Ghana Statistical Service. [Online]
Available at: http://www.statsghana.gov.gh/docfiles/glss5_report.pdf
[Accessed 21 05 2013].
Hach Lange, 2013. Hach Lange Sverige. [Online]
Available at: http://www.hach-
lange.se/view/HlPDFDownloadController;jsessionid=48EBA35A3675EB97BA886EF7BB7EEB90.worker
1?mediaCode=95123
[Accessed 04 06 2013].
Hach Lange, 2013. Hach Lange Sverige. [Online]
Available at: http://www.hach-lange.se/view/HlPDFDownloadController?mediaCode=88338
[Accessed 04 06 2013].
Hach, 2013. Hach. [Online]
Available at: http://www.hach.com/paddle-tester-total-aerobic-bacteria-total-coliforms-pk-
10/product?id=7640250861
[Accessed 20 05 2013].
Hach, 2013. Hach. [Online]
Available at: http://www.hach.com/dr-2800-portable-spectrophotometer-with-lithium-ion-
battery/product-details?id=7640439012
[Accessed 04 06 2013].
Hach, 2013. Paddle Tester, Total Aerobic Bacteria/Total Coliforms. [Online]
Available at: www.hach.com/asset-get.download-en.jsa?id=7639984033
[Accessed 15 10 2013].
index mundi, 2013. index mundi. [Online]
Available at: With an average consumption of 4.5 bags per person per day
[Accessed 20 05 2013].
Inhabitat, 2013. Inhabitat. [Online]
Available at: http://inhabitat.com/sodis-pet-bottles-can-serve-as-cheap-solar-water-disinfection-
systems/
[Accessed 16 07 2013].
Jones, G. T., 2013. Desert Survival: The Solar Still. [Online]
Available at: http://www.desertusa.com/mag98/dec/stories/water.html
[Accessed 19 03 2013].
Lenntech, 2013. WHO/EU drinking water standards comparative table. [Online]
Available at: www.lenntech.com/who-eu-water-standards.htm
[Accessed 03 04 2013].
Lindström, J. & Sundell, R., 2004. Treatment of arsenic contaminated drinking water in Ghana,
Karlstad: University of Karlstad.

75
M. Sanctuary, H. T. a. A. B., 2005. World Health Organization (WHO). Making water a part of
economic development. [Online]
Available at: http://www.who.int/entity/water_sanitation_health/waterandmacroecon.pdf
[Accessed 28 10 2012].
MathWorks, 2013. Simulink - Simulation and Model-Based Design. [Online]
Available at: http://www.mathworks.com/products/simulink/
[Accessed 20 05 2013].
Mensah, M., 2013. Visit at Brimsu new water works [Interview] (16 04 2013).
Michigan Department of Environmental Quality, 2013. eWashtenaw. [Online]
Available at:
http://www.ewashtenaw.org/government/departments/environmental_health/wells_septic/well_se
ptic_pdf/eh_coliformfactsheet.pdf
[Accessed 18 05 2013].
Mitec, 2013. Mitec Instrument. [Online]
Available at: http://www.mitec.se/en/products_services_data-loggers_at40g.html
[Accessed 19 05 2013].
Munasinghe, M., 2013. The Encyclopedia Of Earth. [Online]
Available at: http://www.eoearth.org/view/article/156365/
[Accessed 16 06 2013].
New Hampshire Department of Environmental Services, 2013. NH Department of Environmental
Services. [Online]
Available at: http://des.nh.gov/organization/commissioner/pip/factsheets/ard/documents/ard-ehp-
21.pdf
[Accessed 21 08 2013].
New York Department of Health, 2011. Coliform Bacteria in Drinking Water Supplies. [Online]
Available at: http://www.health.ny.gov/environmental/water/drinking/coliform_bacteria.htm
[Accessed 20 03 2013].
Privata affärer, 2009. Privataaffärer.se. [Online]
Available at: http://www.privataaffarer.se/familjeekonomi/sa-mycket-kostar-vattnet-i-91662
[Accessed 13 05 2013].
Rona, Z. P., n.d. Early Death Comes From Drinking Distilled Water. [Online]
Available at: http://www.mercola.com/article/water/distilled_water.htm
[Accessed 15 03 2013].
Statistiska Centralbyrån, 2010. Ekonomifakta. [Online]
Available at: http://www.ekonomifakta.se/sv/Fakta/Regional-statistik/Alla-lan/Skane-
lan/Malmo/?var=8946
[Accessed 21 05 2013].

76
Tay, C. & Momade, F. W., n.d. African Journals Online (AJOL). [Online]
Available at:
http://www.google.se/url?sa=t&rct=j&q=&esrc=s&source=web&cd=1&ved=0CDUQFjAA&url=http%3
A%2F%2Fwww.ajol.info%2Findex.php%2Fwajae%2Farticle%2Fdownload%2F45714%2F29192&ei=N_
FaUYbfC9Dn7AaTkYGwCA&usg=AFQjCNEptmqjBYyprvjXlFS_bBoZiWrQDA&bvm=bv.44442042,d.d2k&
cad=
[Accessed 02 04 2013].
US EPA, 2013. US EPA. [Online]
Available at: http://www.epa.gov/nrmrl/wswrd/cr/corr_res_iron.html
[Accessed 04 06 2013].
US EPA, 2013. US EPA: Drinking Water Contaminants. [Online]
Available at: http://water.epa.gov/drink/contaminants/index.cfm#List
[Accessed 03 06 2013].
Wagtech WTD, 2013. Arsenator: Digital Arsenic Test Kit. [Online]
Available at: http://www.wagtech.co.uk/products/water-and-environmental/water-test-
kits/arsenator%C2%AE-digital-arsenic-test-kit
[Accessed 29 03 2013].
WCED, 1987. Chapter 2: Towards Sustainable Development. In: Our Common Future. Oxford: Oxford
University Press, p. 43.
WECD, 1987. Our Common Future. 1 ed. Oxford: Oxford University Press.
WECF, 2012. Women in Europe for a Common Future. [Online]
Available at: http://www.wecf.eu/cms/download/2004-2005/homeburning_plastics.pdf
[Accessed 02 06 2013].
Wegelin, M., 2008. Solar Water Disinfection: A Water Treatment Process. [Online]
Available at:
http://www.afarfriends.org/Dok%20t%20websida/Water%20treatment/SODIS_pamphlet_e_afr.pdf
[Accessed 19 03 2013].
WHO and Unicef, 2010. World Health Organization. Progress on Sanitation and Drinking-water: 2010
Update. [Online]
Available at: http://www.wssinfo.org/fileadmin/user_upload/resources/1278061137-
JMP_report_2010_en.pdf
[Accessed 23 10 2012].
WHO, 1996. Guidelines for drinking-water quality. 2 ed. Geneva: World Health Organization.
WHO, 2004. World Health Organization (WHO). Safer Water, Better Health: Costs, benefits, and
sustainability of interventions to protect and promote health; Updated Table 1: WSH deaths by
region. [Online]
Available at: http://www.who.int/entity/quantifying_ehimpacts/publications/wshdeaths2004.pdf
[Accessed 23 10 2012].

77
WHO, 2005. WHO. [Online]
Available at: http://www.who.int/water_sanitation_health/dwq/chemicals/en/ph.pdf
[Accessed 06 07 2013].
WHO, 2010. World Health Organization. [Online]
Available at: http://www.who.int/ipcs/features/arsenic.pdf
[Accessed 18 05 2013].
WHO, 2013. WHO | Arsenic. [Online]
Available at: http://www.who.int/mediacentre/factsheets/fs372/en/index.html
[Accessed 01 04 2013].
Wikipedia, 2013. Wikipedia. [Online]
Available at: http://en.wikipedia.org/wiki/Solar_humidification
[Accessed 15 05 2013].
WQA Science Advisory Committee, 1993. Water Quality Association (WQA). Consumption on low TDS
water. [Online]
Available at: http://www.wqa.org/pdf/Consumer%20Briefs/LowTDS.pdf
[Accessed 17 03 2013].
XE, 2013. XE Currency Converter. [Online]
Available at: http://www.xe.com/currencyconverter/
[Accessed 13 05 2013].
Yoshida, T., Yamauchi, H. & Sun, G. F., 2004. Chronic health effects in people exposed to arsenic via
the drinking water: dose–response relationships in review. Toxicology and Applied Pharmacology, 01
08, 198(3), pp. 243-252.

i
Appendix 1 – Wag-We 10500 Wagtech Digital Arsenator operations
manual

ii
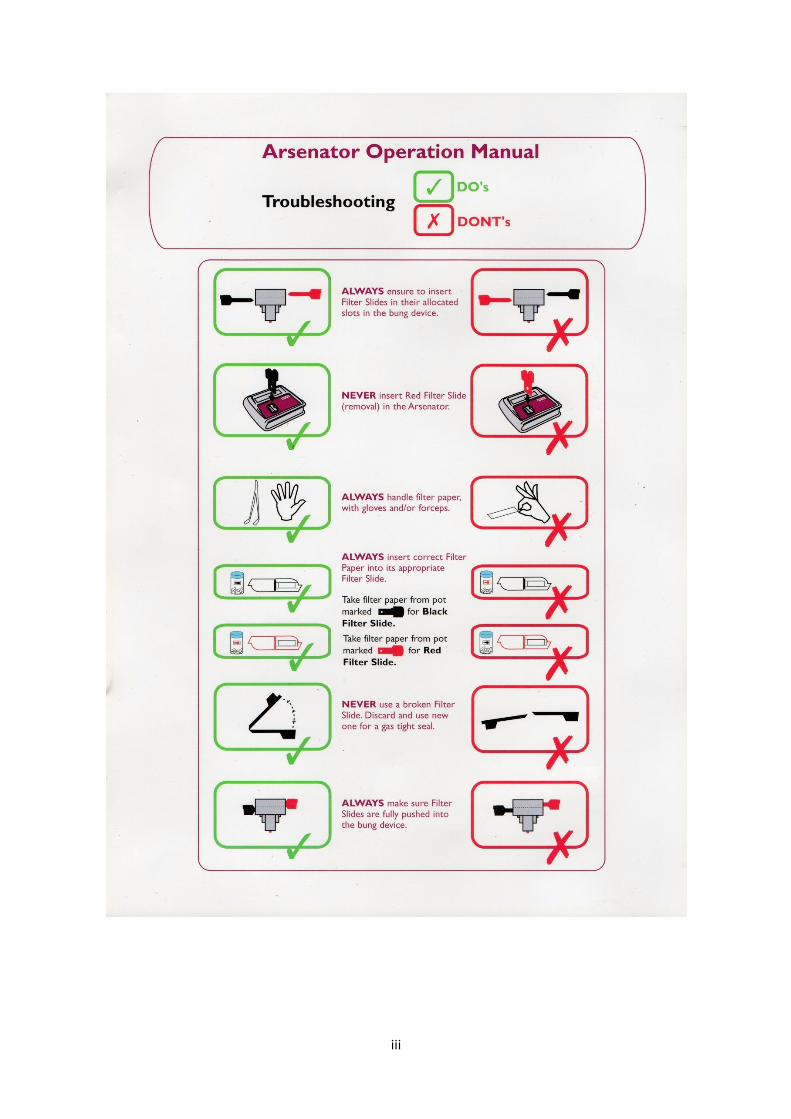
iii

iv

v