solar-powered electrokinetic remediation for the treatment
TRANSCRIPT
- 1 -
Solar-powered electrokinetic remediation for the
treatment of soil polluted with the herbicide 2,4-D
F. L. Souza1, C. Saéz2,*, J. Llanos2, M. R. V. Lanza1, P. Cañizares2, M. A. Rodrigo2 1 Institute of Chemistry of São Carlos, University of São Paulo, P.O. Box 780, 13560-970 São Carlos-SP, Brazil 2 Chemical Engineering Department, University of Castilla-La Mancha, Edificio Enrique Costa Novella. Campus Universitario s/n, 13005 Ciudad Real, Spain
Abstract
In this work, the removal of a model pesticide (2,4-Dichlorophenoxyacetic acid, 2,4-D)
using Electrokinetic Soil Flushing (EKSF) powered directly by DC current or by solar
panels during a 15 days long treatment has been studied. Results show changes in
operating conditions during the solar test, which can be clearly related to the day-night
cycle, with a maximum solar irradiation intensity of 513 W m-2 at noon and an average
daily charge supplied of 6.2 Ah d-1. The fluctuations in the intensity supplied to the
electrochemical system lead to softer pH and conductivity profiles between anodic and
cathodic wells in the case of photovoltaic (PV) powered system. After the 15 days long
tests, the removal of 2,4-D reaches 90.2 % and 73.6% in the electroremediation powered
with DC power supply and solar panels, respectively. In this period,the total applied
charge passed is 4.3 and 24.3 Ah kg-1 in both system, respectively. This means that the
PV-powered electroremediation results in a much less efficient system, in which a much
higher amount of charge is required to reach the same removal of pollutants in the soil.
This fact may be related to the significantly lower EO flux observed during the operation
of the PV-powered system.

- 2 -
Keywords: Solar energy, soil remediation, herbicide, photovoltaic, electrokinetic soil
remediation.
*Corresponding author Tel: (+34)902204100 ext. 6708 Fax: (+34)926295256 e-mail: [email protected]
Highlights
- The average daily charge supplied during EKSF powered with solar panel is 6.2
Ah d-1
- The pH profile between anodic and cathodic sides is softer in solar-driven
processes.
- In solar-driven processes electromigration seems to be the most important
remediation mechanisms.
- After 15 days, 90.2 % and 73.6% of 2,4-D removal were attained with EKSF
powered with DC power supply and PV solar panels.
- 3 -
1. Introduction During the recent years, an increasing interest in the electroremediation of soils with
pesticides has appeared due to their excessive use in agricultural regions that can put at
risk the quality of soil and water and have serious effects on drinking water reservoirs
[1]. Among them, herbicide 2,4-dichlorophenoxy acetic acid (2,4-D) has been one of the
most used pesticides [2] and, as a consequence of its high solubility and acidic properties
it has become a serious problem of soil and groundwater contamination. In the recent
years, its removal from surface or groundwater has been widely studied [3-14] and now
the scientific effort is focused on its removal from soil and the design of strategies to
control its diffusion into the soil.
In this context, the electrokinetic remediation could be a good alternative to contain
and/or remove organic pollutants from soil. Electrokinetic soil flushing (EKSF) is carried
out by the combination of processes that occur in the soil when a direct current (DC) is
applied through electrodes placed into the soil. Among them, electrokinetic transport
processes (electromigration, electrophoresis and electro-osmosis) favor the transport of
pollutants and their removal from soil [15-18]. In order to enhance the performance of
EKSF, recent studies have evaluated the influence of the electrode configuration, the
electrode material and the addition of certain fluids to enhance the mobility of the
pollutants. However, despite the high versatility of EKSF, the electrical energy
consumption (around 10-15 % of the total cost [18], is a main barrier to applying this
technology. In this context, powering soil eletroremediation with green energy is a
challenge in the search for novel eco-friendly environmental remediation processes. In
fact, in recent years the use of solar photovoltaic panels as an energy source for powering
electrochemical systems has begun to be developed, and currently several works have

- 4 -
focused on the use of renewable energy power sources to decrease both the investment
and maintenance costs of electrokinetic remediation processes [19-23]. As known, power
generation of solar panel depends on sunlight (that is, daytime and weather conditions)
and thus it leads to significant energy fluctuations, and as a consequence the system
becomes fed by a non-constant energy source. However, duration of remediation
treatment is typically very long and due to the large time-constants coupling of a non-
continuous supply should not have a negative impact on results. In fact, several works[20,
24-27] have reported that a pulsed EK process can enhance the removal of contaminants
form soil and even decrease the electrical energy consumption and minimize the operation
problems related to electrode corrosion. Likewise, recent studies [19-23] show that solar
powered electrokinetic remediation drive the treatment of metals polluted soils with
removal efficiency comparable with that achieved by DC power supply. However, many
of the studies on solar-based EKSF were limited to short treatment periods in which it is
difficult to evaluate correctly the advantages of using this energy source.
Thus, with this background, this work aims at studying the differences between the
removal of a model pesticide (2,4-D) using EKSF powered directly with DC current or
with the output of solar panels during a 15 days long treatment. To do this, two
experiments at bench scale were run under the same operation conditions and main
operation parameters were monitored and compared.
2. Materials and methods
2.1. Chemicals
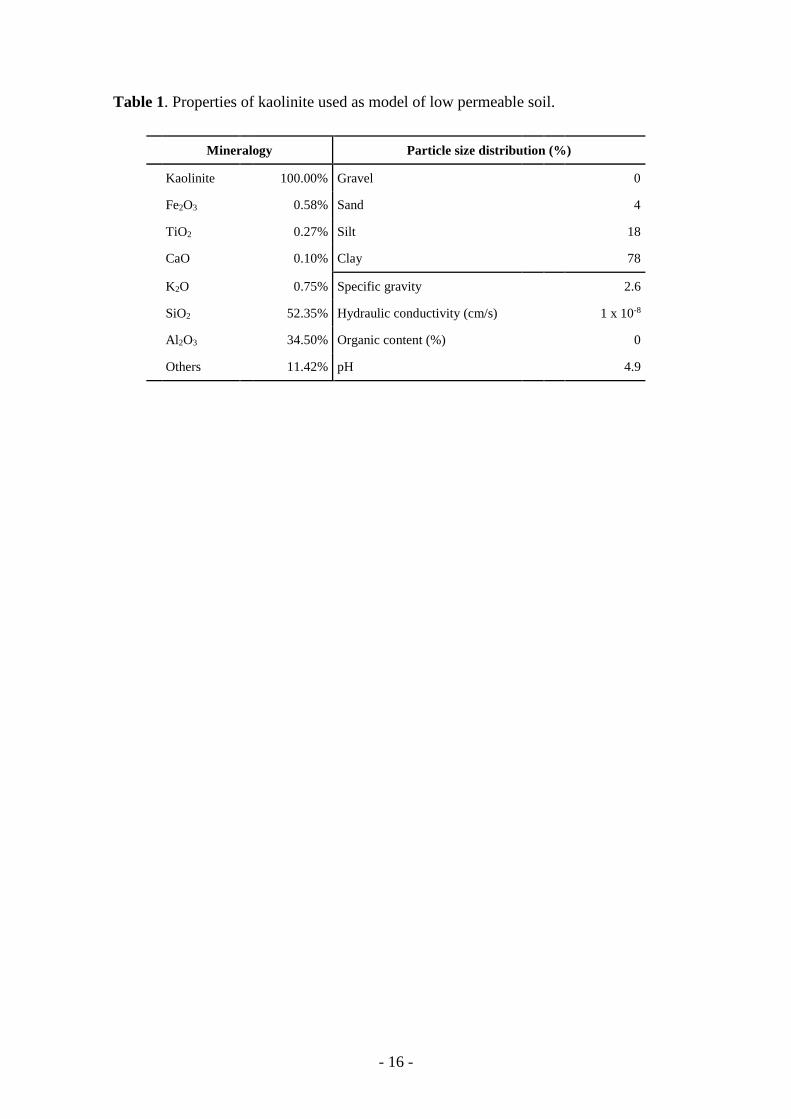
Kaolinite provided by Manuel Riesgo Chemical Products (Madrid, Spain), was used as
a model of clay soil. Kaolinite is not reactive and it has low hydraulic conductivity, low

- 5 -
cation exchange capacity and no organic content, and for these reason it is frequently used
as a model of low-permeability soils. Properties of this synthetic clay soil were provided
by the commercial supplier, and are detailed in Table 1. All chemicals, including
anhydrous sodium sulphate, sodium phosphate (Fluka, Spain), 2,4 dichlorophenoxyacetic
acid (Sigma-Aldrich) were analytical grade and used as received. Acetonitrile HPLC
grade (Sigma-Aldrich, Spain) was used for the mobile phase. Double deionized water
(Millipore Milli-Q system, resistivity = 18.2 MΩ cm at 25 ºC) was used to prepare all
solutions.
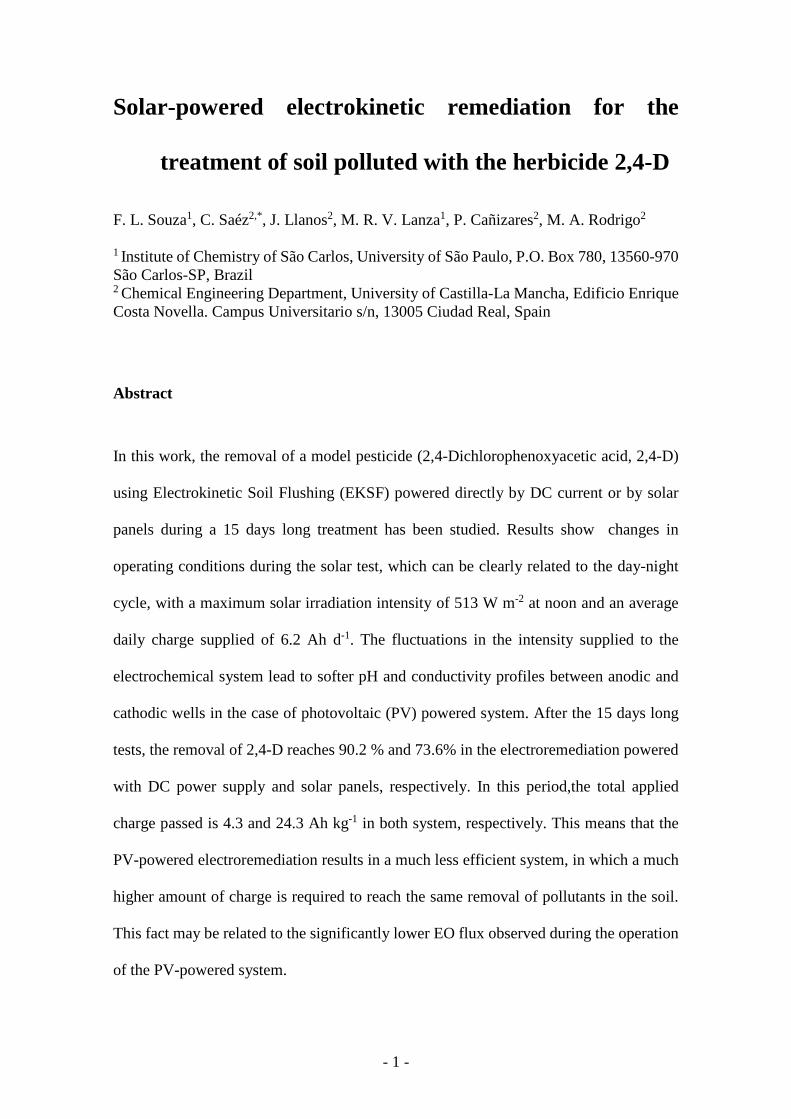
2.2. Electrokinetic bench-scale cell
Bench-scale setup was made of methacrylate and consists of an orthoedric tank divided
into five compartments (Figure 1). The central compartment (with a total length of 20
cm) was loaded with herbicide-polluted soil, which was compacted manually and
separated from the electrode compartments by a 0.5 mm nylon mesh. In one of these
compartments it was placed the anode and in other the cathode. Graphite electrodes (10.0
cm × 10.0 cm × 1.0 cm), provided by Carbosystem (Madrid, Spain) were used as electrode
material. Each electrode compartment was connected to an additional collector
compartments to collect the liquid overflowing from the wells that is transported by the
electrokinetic processes (electro-osmotic flow). In one of the experiments the EKSF cell
was connected to a DC power supply while in the other to photovoltaic panels. Electricity
produced by two photovoltaic plates connected in series (area of 1.313 m2 each panel)
can be used to power the electrochemical cell or it can be stored in batteries. Computer
software (Labview, National Instruments) was used to control the process, and during the
tests, energy was directly supplied to the electrochemical cells. The PV panels were
located on the roof of the Environmental Engineering Laboratory (E3L) of the University
- 6 -
of Castilla-la Mancha (38.59 N 3.55 O) and oriented to the south. The duration of the
experiments was 15 days and they took place during January 2015.
To prepare the soil column, firstly, a pesticide solution containing 500 mg dm-3 of 2,4-D
was prepared with tap water. This solution was used to pollute the soil, up to a 30% of
the moisture. Then, herbicide-polluted soil was compacted manually in the central
compartment of the cell. This compaction was done very carefully, in order to avoid the
formation of heterogeneities in the soil that may result in preferential paths for the
hydraulic fluid transport. Tap water was used as electrolyte in the soil and in the electrodic
wells. The loses of water due to the evaporation process and also due to the electro-
osmosis were replaced with the same electrolyte, added to the anodic well by means of a
on/off regulation loop.
2.1. Analysis procedures
Daily, the electrical current, the temperature on different portions of the soil, the electro-
osmotic volume removed from the cathode collector, pH, conductivity, pesticide and
TOC concentration of the electro-osmotic fluid were monitored. The liquids contained in
the electrolyte wells were also daily monitored measuring pH, conductivity and pesticide
concentration. At the end of the experiment, a post mortem analysis was carried out to
evaluate the final state of the treated soil and pH, conductivity, humidity and pesticide
concentration were measured. For this analysis, the soil compartment was divided into
sixteen pieces [28]. Sampling procedure of each point of the soil consists of taking it out
carefully from the set up and manually homogenizing it. Once it was homogeneous,
representative samples were taken for carrying out each analysis. Measurement of the
moisture was carried out by drying the soil samples in an oven for 24 h at 105 ◦C. Moisture
- 7 -
was calculated taking into account the weight difference in the samples before and after
drying. For the determination of the pH and conductivity in the soil samples, the standard
method of the saturated paste (E.P.A.-9045C, 1995) was used. This method consists of
the mixture of 10 g of dry soil with 25 mL of distilled water which was magnetically
agitated for 20 min. After sedimentation, the aqueous supernatant phase was prepared to
analysis. All the samples (pre and post mortem) were filtered with 0.45 µm nylon filters
from Whatman before their analysis. The decay of herbicides was followed by reversed-
phase chromatography. The chromatography system was an Agilent 1100 series coupled
a UV detector. The analytical column Phenomenex Gemini 5 μm C18 was used. Mobile
phase consisted of 60 % acetonitrile and 40 % water to 2 % acetic acid with a flow rate
of 0.4 cm3 min−1. The detection wavelength used was 280 nm. Temperature oven was
maintained at 25 ºC and volume injection of 20 μL. Measurements of pH were carried out
with an InoLab WTW pH-meter. Conductivity was measured using a Conductimeter GLP
31 (Crisol Instruments, Spain). The soil temperature was monitored using a Digital Soil
thermometer (Spectrum Technologies, Inc.)
3. Results and discussion
3.1. Current profiles in electrokinetic system fed with PV panels.
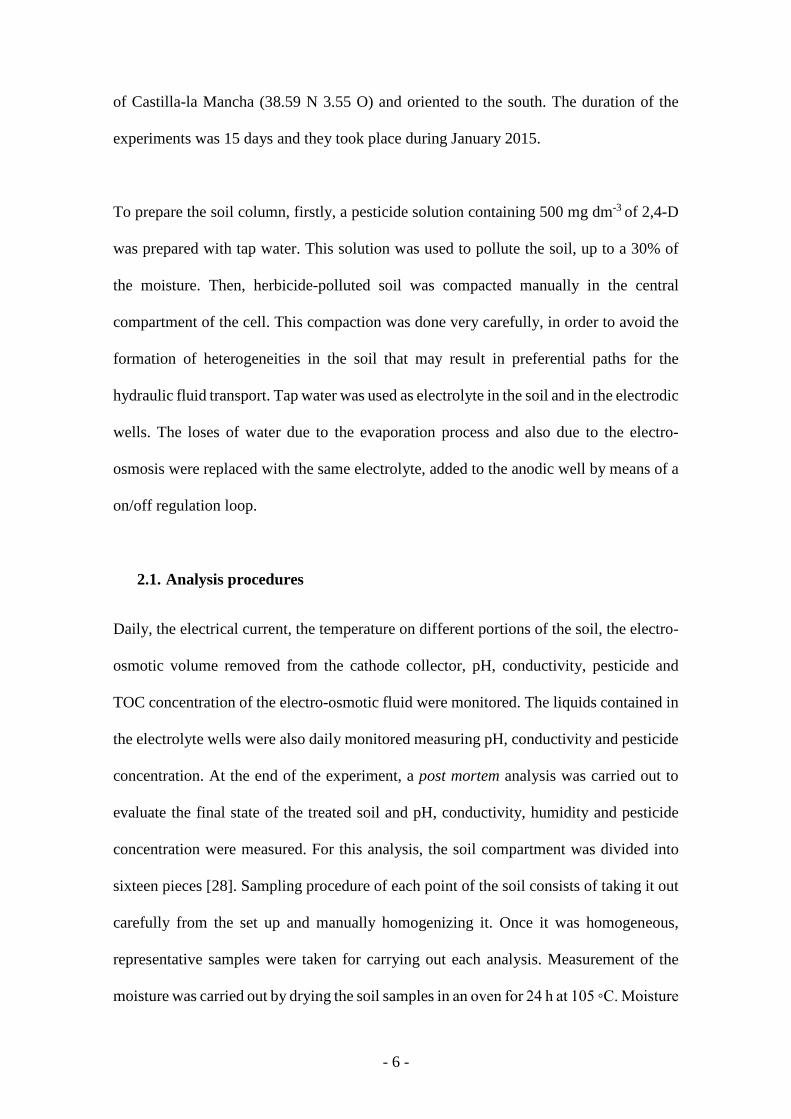
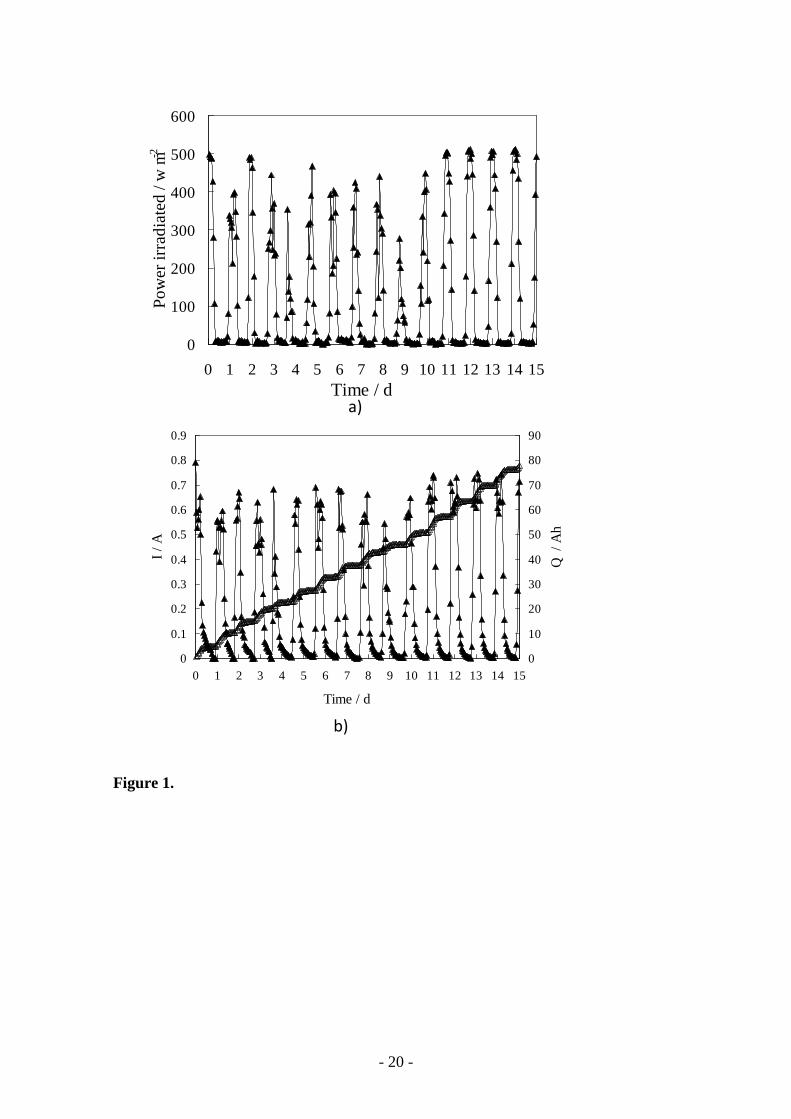
Figure 2 shows profiles of the solar irradiation intensity and the resulting total current
charge passed to the EKSF cell during the continuous 15 days-test in which the soil
column was electrically powered by the set of two photovoltaic solar panels. These results
aimed to show the main features of the electric powering of the EKSF system.

- 8 -
As expected, the solar irradiation profile (part a) was clearly related to the day-night
cycles, with maximum solar irradiation values during the noon time slot and minimum
values during the night. The changes in the climatologic conditions (with alternative
sunny and cloudy days) explain the fluctuations in the maximum values (ranging from
275 to 513 W m-2) attained day by day. Part b of the Figure shows the intensity powered
to the EKSF cell. As shown, the solar irradiation profile clearly affects the current
intensity supplied. Thus, the current intensity profiles follow almost the same trend, with
maximum daily peaks of intensity ranging from 0.59 to 0.77 A and negligible current
during nights. This pattern clearly reflects on the total current charge applied to the cell,
which exhibits a marked stepwise trend. During the test, a total electric charge of 77.8 Ah
was applied to the electrokinetic remediation reactor.
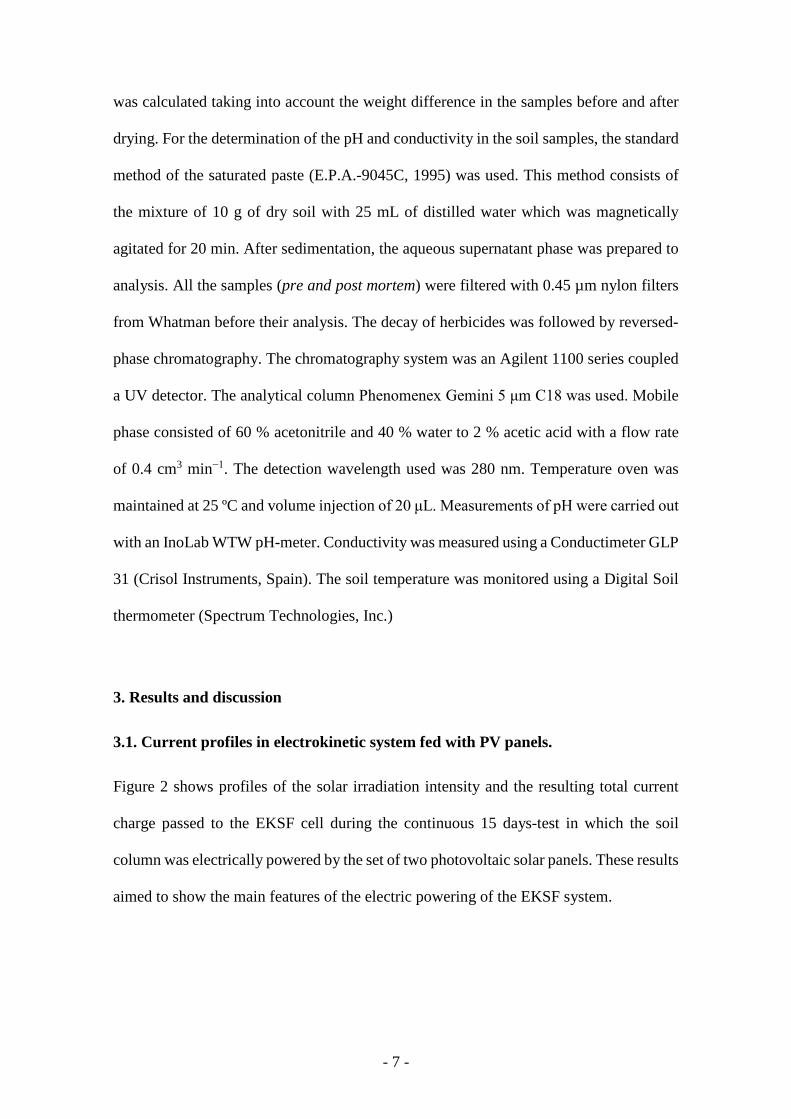
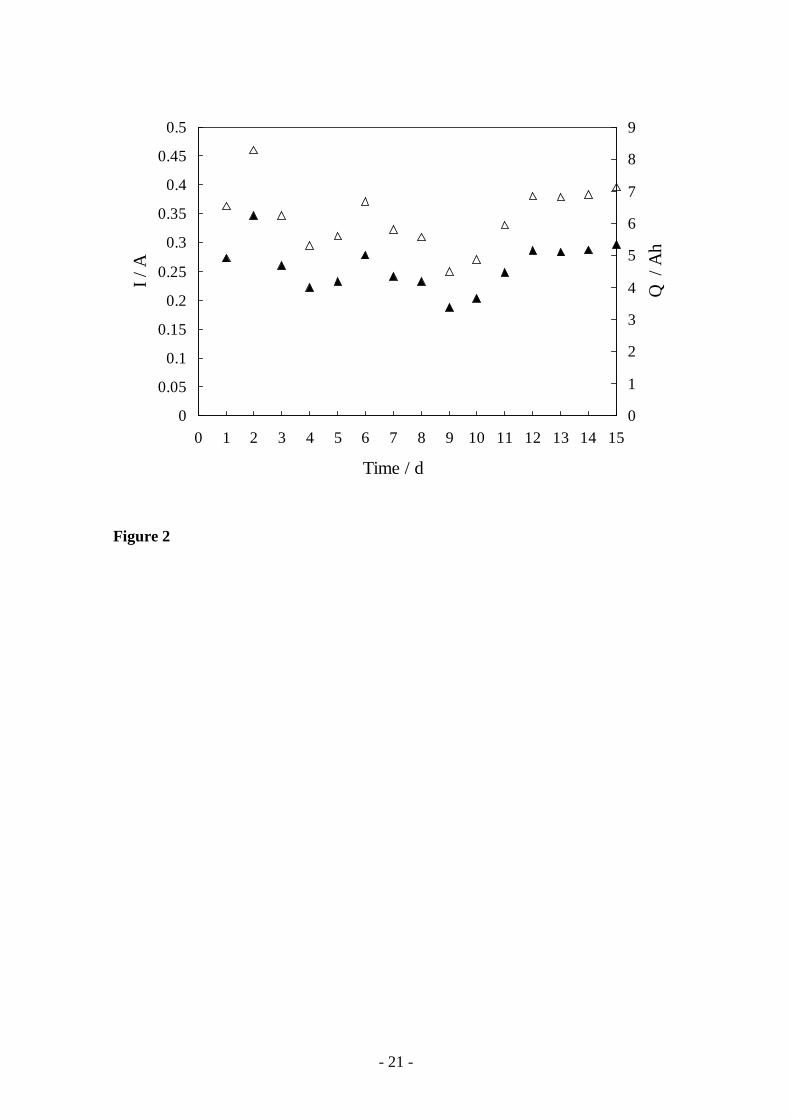
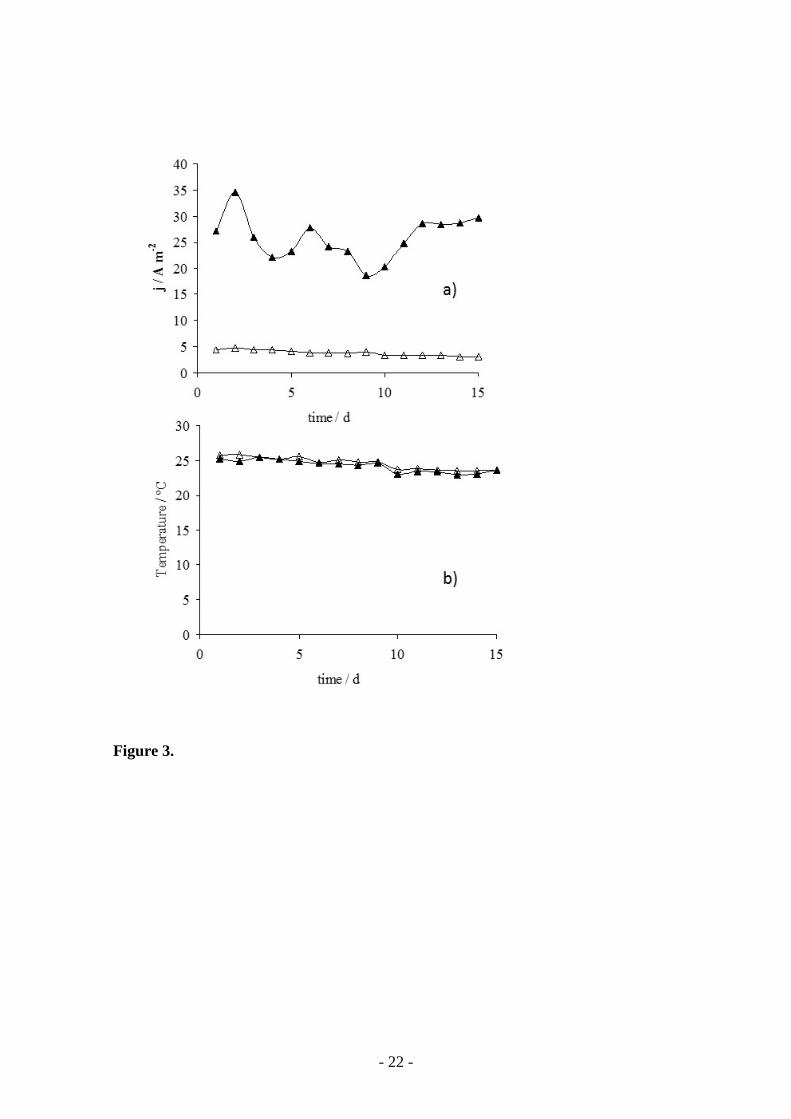
Figure 3 shows the average daily current intensity and applied charges during the fifteen
days of testing. As can be observed, daily values exhibit deviations up to 30% with respect
to the average value, which may be clearly related to the solar power irradiation profile
(Figure 2a). However, even in the worst climatologic conditions (from days 7 to 12) the
daily intensity and electrical charge supplied were above 0.2 A and 4.5 Ah. Likewise,
these values indicate that the average daily charge supplied by this power source is 6.2
Ah d-1, which taking into account the surface of the PV panels corresponds to 2.4 Ah d-1
m-2
3.2. Electroremediation of soil powered by PV panels.
To evaluate the influence of the changing current produced by the PV powering system
on the electrokinetic remediation of a soil polluted with 2,4-D, results of the EKSF
powered by PV panels were compared with those obtained in a EKSF powered by a
- 9 -
conventional power supply. In this latter case, the EKSF was driven potentiostatically (1
VDC cm-1).
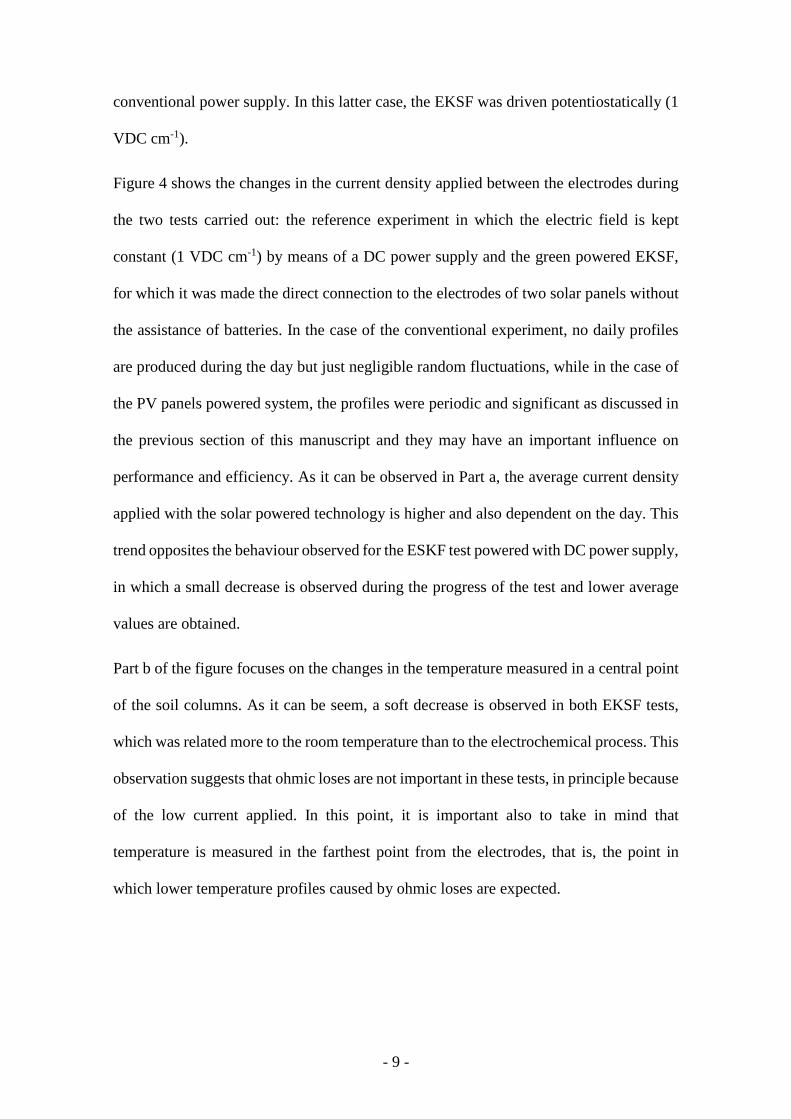
Figure 4 shows the changes in the current density applied between the electrodes during
the two tests carried out: the reference experiment in which the electric field is kept
constant (1 VDC cm-1) by means of a DC power supply and the green powered EKSF,
for which it was made the direct connection to the electrodes of two solar panels without
the assistance of batteries. In the case of the conventional experiment, no daily profiles
are produced during the day but just negligible random fluctuations, while in the case of
the PV panels powered system, the profiles were periodic and significant as discussed in
the previous section of this manuscript and they may have an important influence on
performance and efficiency. As it can be observed in Part a, the average current density
applied with the solar powered technology is higher and also dependent on the day. This
trend opposites the behaviour observed for the ESKF test powered with DC power supply,
in which a small decrease is observed during the progress of the test and lower average
values are obtained.
Part b of the figure focuses on the changes in the temperature measured in a central point
of the soil columns. As it can be seem, a soft decrease is observed in both EKSF tests,
which was related more to the room temperature than to the electrochemical process. This
observation suggests that ohmic loses are not important in these tests, in principle because
of the low current applied. In this point, it is important also to take in mind that
temperature is measured in the farthest point from the electrodes, that is, the point in
which lower temperature profiles caused by ohmic loses are expected.

- 10 -
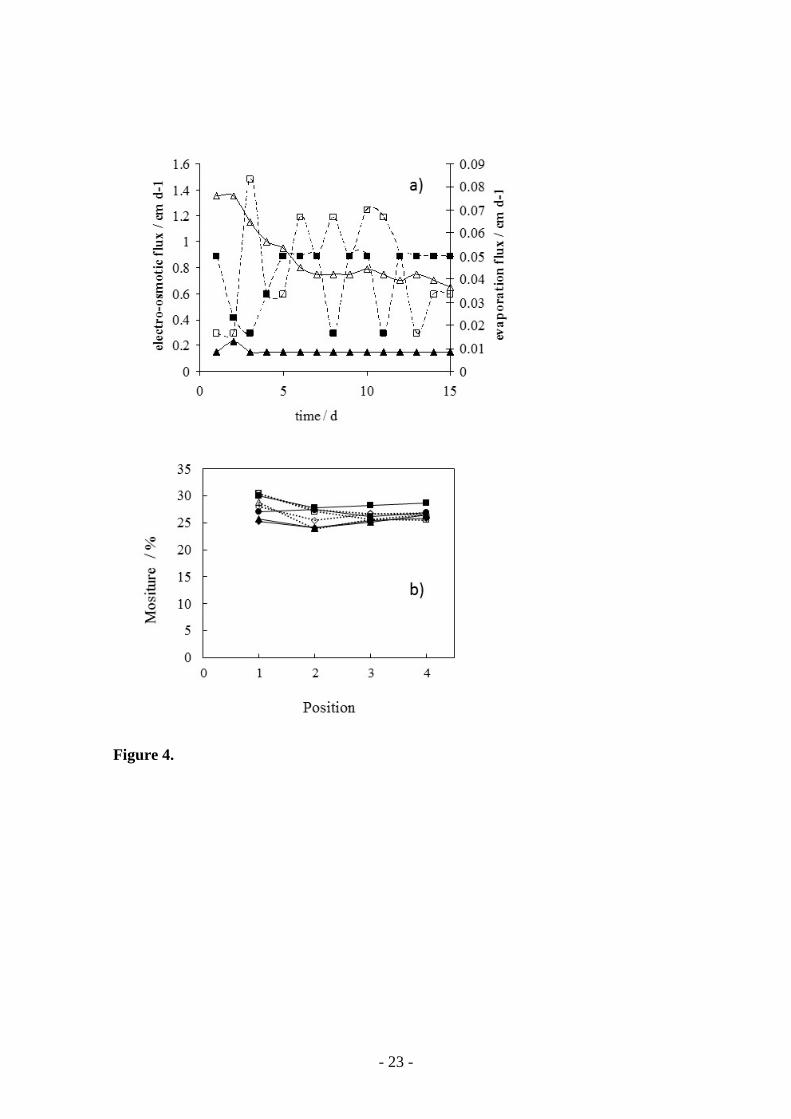
Because of the low influence of the ohmic loses on the process performance, the
electrokinetic processes are expected to become the most important processes associated
to the application of an electric field to soil. In particular, the transport of water by electro-
osmosis (EO) is of interest because it may drag the pollutant from the soil. Figure 5
compares the electro-osmotic fluxes measured in both systems. Despite the higher applied
current density in the system powered by the PV panels, the resulting EO flux is much
higher in the conventionally DC powered system, suggesting that the extreme daily
profiles of intensity are not good to promote a continuous flow of water. On the other
hand, in comparing the values of the evaporation flows, it can be observed that daily
values fluctuate importantly, which can be associated to the different environmental
conditions affecting the process. However, the average values of the evaporation flux
obtained in the two tests are comparable (0.041 vs 0.046 cm3 cm-2 d-1 in the solar powered
and conventionally powered systems, respectively).
As it has been described in the methodology section, after the tests a postmortem analysis
was carried out to characterize the most relevant parameters and to obtain 3-D plots. As
it can be observed, not great differences are obtained between both systems, with
measured moistures in the range 25-30%. There is a higher moisture in the zones closed
to the anode. This increase is observed in the two experiments and may be explained in
terms of the continuous addition of water to anodic well to compensate the loses of water
by EO flux to cathode well and by evaporation.
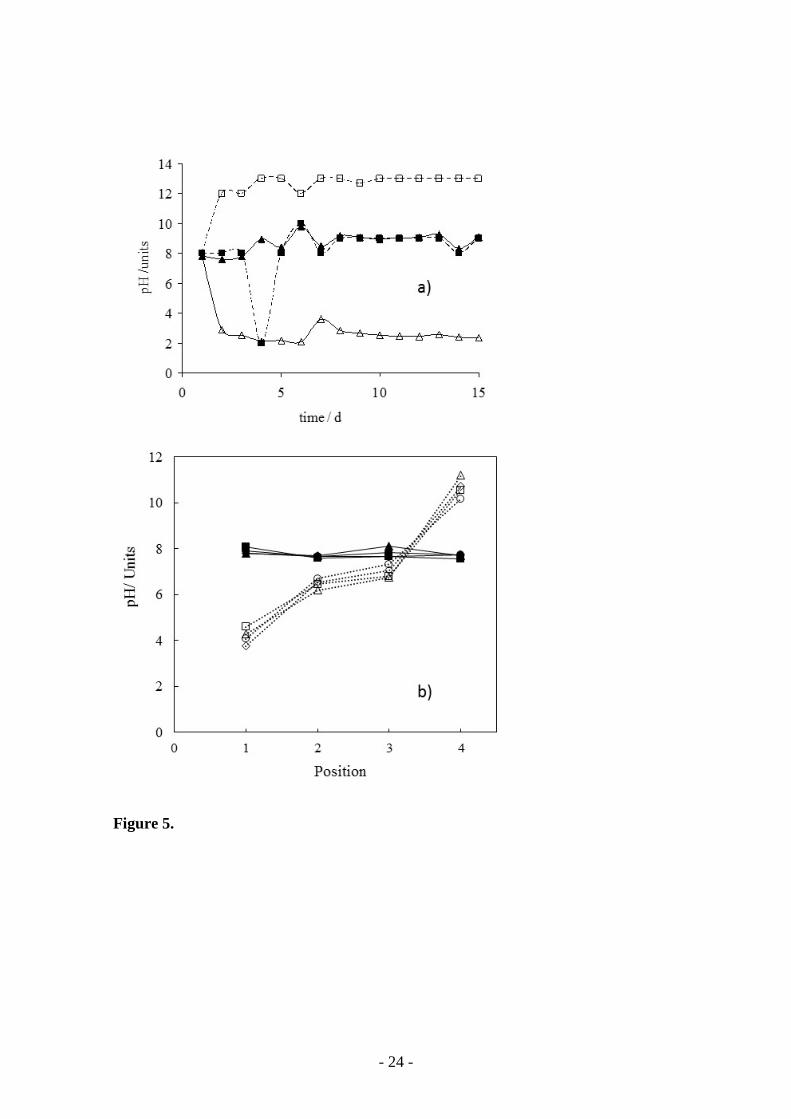
One of the most characteristic changes produced during electrochemically assisted
remediation processes are the changes in the pH caused by the oxidation and reduction of
water on the surface of the electrodes. Typically, these changes make that the catholyte
- 11 -
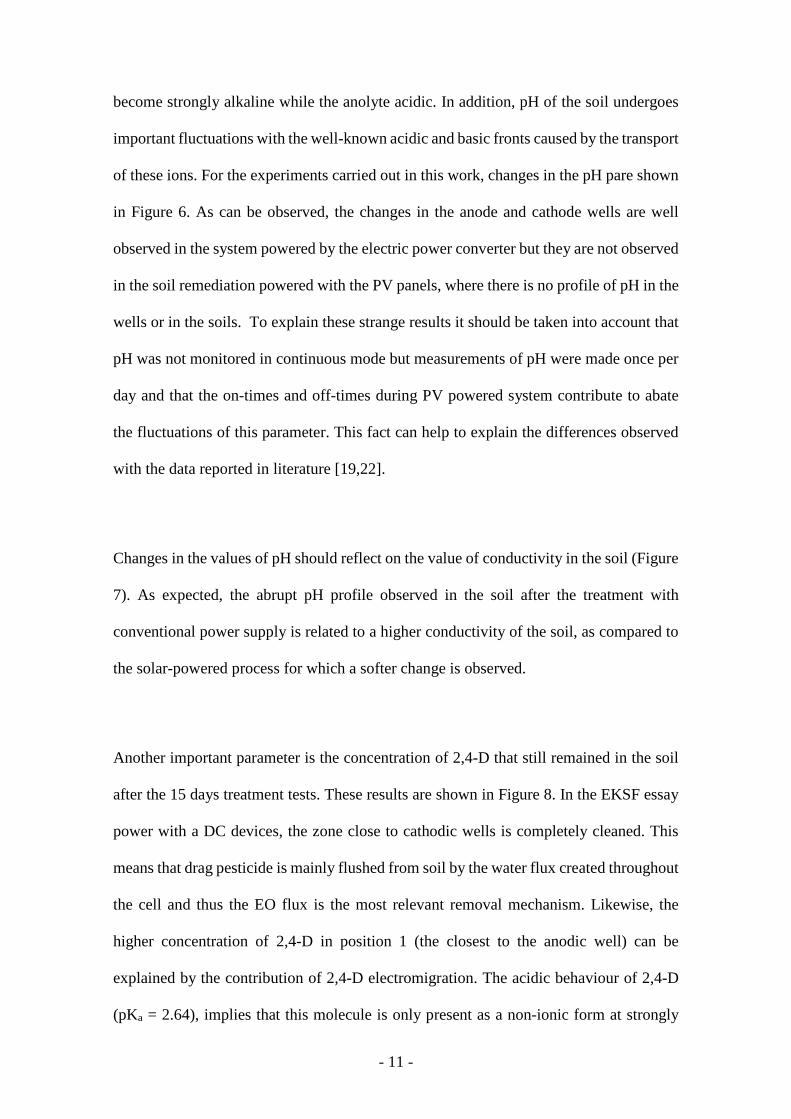
become strongly alkaline while the anolyte acidic. In addition, pH of the soil undergoes
important fluctuations with the well-known acidic and basic fronts caused by the transport
of these ions. For the experiments carried out in this work, changes in the pH pare shown
in Figure 6. As can be observed, the changes in the anode and cathode wells are well
observed in the system powered by the electric power converter but they are not observed
in the soil remediation powered with the PV panels, where there is no profile of pH in the
wells or in the soils. To explain these strange results it should be taken into account that
pH was not monitored in continuous mode but measurements of pH were made once per
day and that the on-times and off-times during PV powered system contribute to abate
the fluctuations of this parameter. This fact can help to explain the differences observed
with the data reported in literature [19,22].
Changes in the values of pH should reflect on the value of conductivity in the soil (Figure
7). As expected, the abrupt pH profile observed in the soil after the treatment with
conventional power supply is related to a higher conductivity of the soil, as compared to
the solar-powered process for which a softer change is observed.
Another important parameter is the concentration of 2,4-D that still remained in the soil
after the 15 days treatment tests. These results are shown in Figure 8. In the EKSF essay
power with a DC devices, the zone close to cathodic wells is completely cleaned. This
means that drag pesticide is mainly flushed from soil by the water flux created throughout
the cell and thus the EO flux is the most relevant removal mechanism. Likewise, the
higher concentration of 2,4-D in position 1 (the closest to the anodic well) can be
explained by the contribution of 2,4-D electromigration. The acidic behaviour of 2,4-D
(pKa = 2.64), implies that this molecule is only present as a non-ionic form at strongly
- 12 -
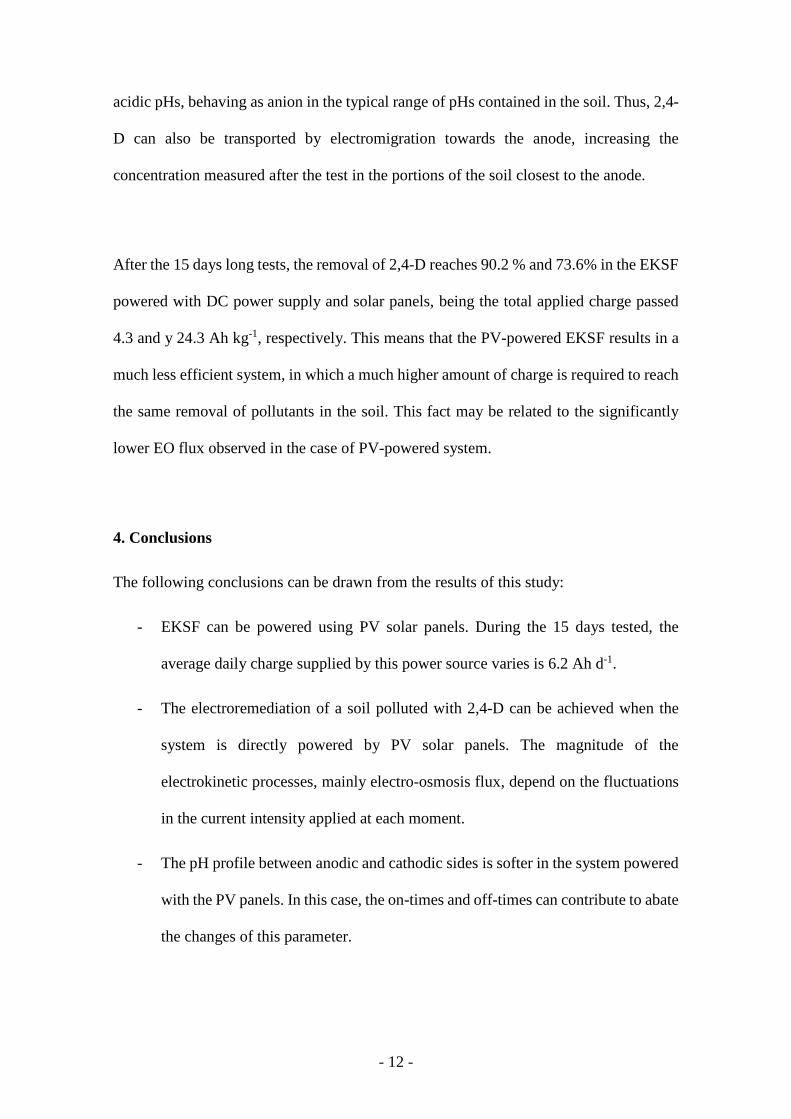
acidic pHs, behaving as anion in the typical range of pHs contained in the soil. Thus, 2,4-
D can also be transported by electromigration towards the anode, increasing the
concentration measured after the test in the portions of the soil closest to the anode.
After the 15 days long tests, the removal of 2,4-D reaches 90.2 % and 73.6% in the EKSF
powered with DC power supply and solar panels, being the total applied charge passed
4.3 and y 24.3 Ah kg-1, respectively. This means that the PV-powered EKSF results in a
much less efficient system, in which a much higher amount of charge is required to reach
the same removal of pollutants in the soil. This fact may be related to the significantly
lower EO flux observed in the case of PV-powered system.
4. Conclusions
The following conclusions can be drawn from the results of this study:
- EKSF can be powered using PV solar panels. During the 15 days tested, the
average daily charge supplied by this power source varies is 6.2 Ah d-1.
- The electroremediation of a soil polluted with 2,4-D can be achieved when the
system is directly powered by PV solar panels. The magnitude of the
electrokinetic processes, mainly electro-osmosis flux, depend on the fluctuations
in the current intensity applied at each moment.
- The pH profile between anodic and cathodic sides is softer in the system powered
with the PV panels. In this case, the on-times and off-times can contribute to abate
the changes of this parameter.
- 13 -
- After the 15 days long tests, it was possible to remove 90.2 % and 73.6% of 2,4-
D in the electroremediation powered with DC power supply and PV solar panels,
respectively. The worse results obtained with PV-powered system could be
related to the lower electro-osmotic flux registered in this case and thus to the
lower amount of 2,4-D drained in the cathode well. In solar-driven processes
electromigration seems to be the most important remediation mechanisms.
Acknowledgements
The authors acknowledge funding support from the EU and Spanish Government through
the MINECO Project CTM2013-45612-R, FEDER 2007-2013 PP201010 (Planta Piloto
de Estación de Regeneración de Aguas Depuradas) and INNOCAMPUS. Funding from
the Brazilian government through grant 2014/02580-7, São Paulo Research Foundation
(FAPESP), is gratefully acknowledged.
References
[1] G.Y. Sheng, C.T. Johnston, B.J. Teppen, S.A. Boyd, Potential contributions of smectite clays and organic matter to pesticide retention in soils, Journal of Agricultural and Food Chemistry, 49 (2001) 2899-2907. [2] I.C. Munro, G.L. Carlo, J.C. Orr, K.G. Sund, R.M. Wilson, E. Kennepohl, B.S. Lynch, M. Jablinske, N.L. Lee, A COMPREHENSIVE, INTEGRATED REVIEW AND EVALUATION OF THE SCIENTIFIC EVIDENCE RELATING TO THE SAFETY OF THE HERBICIDE 2,4-D, Journal of the American College of Toxicology, 11 (1992) 559-&. [3] G. Fang, Y. Si, C. Tian, G. Zhang, D. Zhou, Degradation of 2,4-D in soils by Fe3O4 nanoparticles combined with stimulating indigenous microbes, Environmental Science and Pollution Research, 19 (2012) 784-793. [4] X. Bian, J. Chen, R. Ji, Degradation of 2,4-Dichlorophenoxyacetic Acid (2,4-D) by Novel Photocatalytic Material of Tourmaline-Coated TiO2 Nanoparticles: Kinetic Study and Model, Materials, 6 (2013) 1530-1542. [5] A.C. de Velosa, R.F. Pupo Nogueira, 2,4-Dichlorophenoxyacetic acid (2,4-D) degradation promoted by nanoparticulate zerovalent iron (nZVI) in aerobic suspensions, Journal of Environmental Management, 121 (2013) 72-79.
- 14 -
[6] C. Girardi, K.M. Nowak, O. Carranza-Diaz, B. Lewkow, A. Miltner, M. Gehre, A. Schäffer, M. Kästner, Microbial degradation of the pharmaceutical ibuprofen and the herbicide 2,4-D in water and soil — Use and limits of data obtained from aqueous systems for predicting their fate in soil, Science of The Total Environment, 444 (2013) 32-42. [7] B. Niedree, H. Vereecken, P. Burauel, Radiation-induced impacts on the degradation of 2,4-D and the microbial population in soil microcosms, Journal of Environmental Radioactivity, 115 (2013) 168-174. [8] O. Garcia, E. Isarain-Chavez, A. El-Ghenymy, E. Brillas, J.M. Peralta-Hernandez, Degradation of 2,4-D herbicide in a recirculation flow plant with a Pt/air-diffusion and a BDD/BDD cell by electrochemical oxidation and electro-Fenton process, Journal of Electroanalytical Chemistry, 728 (2014) 1-9. [9] Y. Ordaz-Guillen, C. Juvencio Galindez-Mayer, N. Ruiz-Ordaz, C. Juarez-Ramirez, F. Santoyo-Tepole, O. Ramos-Monroy, Evaluating the degradation of the herbicides picloram and 2,4-D in a compartmentalized reactive biobarrier with internal liquid recirculation, Environmental Science and Pollution Research, 21 (2014) 8765-8773. [10] H.-y. Zhou, S.-s. Zeng, S. Liang, J. Han, Degradation of 2, 4-D by combined catalytic dechlorination and biological oxidation, Huan jing ke xue= Huanjing kexue / [bian ji, Zhongguo ke xue yuan huan jing ke xue wei yuan hui "Huan jing ke xue" bian ji wei yuan hui.], 35 (2014) 3430-3435. [11] M.L. Maya-Trevino, M. Villanueva-Rodriguez, J.L. Guzman-Mar, L. Hinojosa-Reyes, A. Hernandez-Ramirez, Comparison of the solar photocatalytic activity of ZnO-Fe2O3 and ZnO-Fe-0 on 2,4-D degradation in a CPC reactor, Photochemical & Photobiological Sciences, 14 (2015) 543-549. [12] A.V. Schenone, L.O. Conte, M.A. Botta, O.M. Alfano, Modeling and optimization of photo-Fenton degradation of 2,4-D using ferrioxalate complex and response surface methodology (RSM), Journal of Environmental Management, 155 (2015) 177-183. [13] J.-M. Fontmorin, F. Fourcade, F. Geneste, D. Floner, S. Huguet, A. Amrane, Combined process for 2,4-Dichlorophenoxyacetic acid treatment-Coupling of an electrochemical system with a biological treatment, Biochemical Engineering Journal, 70 (2013) 17-22. [14] O. Garcia, E. Isarain-Chavez, S. Garcia-Segura, E. Brillas, J.M. Peralta-Hernandez, Degradation of 2,4-Dichlorophenoxyacetic Acid by Electro-oxidation and Electro-Fenton/BDD Processes Using a Pre-pilot Plant, Electrocatalysis, 4 (2013) 224-234. [15] M.M. Page, C.L. Page, A review of electroremediation of contaminated soils, J. Environ. Eng, (2002) 81. [16] R.E. Saichek, K.R. Reddy, Electrokinetically enhanced remediation of hydrophobic organic compounds in soils: A review, Critical Reviews in Environmental Science and Technology, 35 (2005) 115-192. [17] M. Pazos, E. Rosales, T. Alcantara, J. Gomez, M.A. Sanroman, Decontamination of soils containing PAHs by electroremediation: A review, Journal of Hazardous Materials, 177 (2010) 1-11. [18] J. Virkutyte, M. Sillanpaa, P. Latostenmaa, Electrokinetic soil remediation - critical overview, Science of the Total Environment, 289 (2002) 97-121. [19] S. Yuan, Z. Zheng, J. Chen, X. Lu, Use of solar cell in electrokinetic remediation of cadmium-contaminated soil, Journal of hazardous materials, 162 (2009) 1583-1587. [20] D.-H. Kim, S.-U. Jo, J.-C. Yoo, K. Baek, Ex situ pilot scale electrokinetic restoration of saline soil using pulsed current, Separation and Purification Technology, 120 (2013) 282-288.

- 15 -
[21] S. Zhang, J. Zhang, W. Wang, F. Li, X. Cheng, Removal of phosphate from landscape water using an electrocoagulation process powered directly by photovoltaic solar modules, Solar Energy Materials and Solar Cells, 117 (2013) 73-80. [22] I. Hassan, E. Mohamedelhassan, E.K. Yanful, Solar powered electrokinetic remediation of Cu polluted soil using a novel anode configuration, Electrochimica Acta, (2015). [23] E.-K. Jeon, S.-R. Ryu, K. Baek, Application of solar-cells in the electrokinetic remediation of As-contaminated soil, Electrochimica Acta, (2015). [24] H.K. Hansen, A. Rojo, L.M. Ottosen, Electrokinetic remediation of copper mine tailings, Electrochimica Acta, 52 (2007) 3355-3359. [25] B.-G. Ryu, J.-S. Yang, D.-H. Kim, K. Baek, Pulsed electrokinetic removal of Cd and Zn from fine-grained soil, Journal of Applied Electrochemistry, 40 (2009) 1039-1047. [26] S.-U. Jo, D.-H. Kim, J.-S. Yang, K. Baek, Pulse-enhanced electrokinetic restoration of sulfate-containing saline greenhouse soil, Electrochimica Acta, 86 (2012) 57-62. [27] B.-G. Ryu, S.-W. Park, K. Baek, J.-S. Yang, Pulsed Electrokinetic Decontamination of Agricultural Lands around Abandoned Mines Contaminated with Heavy Metals, Separation Science and Technology, 44 (2009) 2421-2436.
- 16 -
Table 1. Properties of kaolinite used as model of low permeable soil.
Mineralogy Particle size distribution (%)
Kaolinite 100.00% Gravel 0
Fe2O3 0.58% Sand 4
TiO2 0.27% Silt 18
CaO 0.10% Clay 78
K2O 0.75% Specific gravity 2.6
SiO2 52.35% Hydraulic conductivity (cm/s) 1 x 10⁻⁸
Al2O3 34.50% Organic content (%) 0
Others 11.42% pH 4.9

- 17 -
Figure Captions
Figure 1. a) Layout of the experimental setup. b) Sections of the soil for the post-mortem
analysis.
Figure 2. Changes in the a) solar power irradiation intensity and b) applied current
intensity and total current charge passed during the test.
Figure 3. Changes in the average daily applied current intensity (▲) and current charge
passed (∆) during the test.
Figure 4. Changes in the applied current density (part a) and temperature (part b) during
the EKSF tests powered by PV panels () and DC power supply ()
Figure 5. Water management during the electroremediation tests powered by PV panels
(full symbols) and DC power supply (empty symbols). a) Changes in the evaporation (,
) and electro-osmotic fluxes (, ) b) . Moisture distribution in the soil after the 15
days remediation tests. Upper right position (●, ○), upper left position (■, □), bottom right
position (♦, ◊) and bottom left position (▲, ∆).
Figure 6. Changes in the pH during the electroremediation tests powered by PV panels
(full symbols) and DC power supply (empty symbols). a) time course of the pH in the
catholyte well (, ) and anolyte well (,). b) pH map of the soil after the
remediation tests. Upper right position (●, ○), upper left position (■, □), bottom right
position (♦, ◊) and bottom left position (▲, ).
Figure 7. Conductivity map of the soil after the remediation tests powered by PV panels
(full symbols) and DC power supply (empty symbols). Upper right position (●, ○), upper
left position (■, □), bottom right position (♦, ◊) and bottom left position (▲, ∆).

- 18 -
Figure 8. 2,4-D pesticide map of the soil after the remediation tests powered by PV panels
(full symbols) and DC power supply (empty symbols). Upper right position (●, ○), upper
left position (■, □), bottom right position (♦, ◊) and bottom left position (▲, ∆).

- 19 -
Figure 1.
Cathodic CompartmentAnodic Compartment
CollectorCompartment
CollectorCompartment
20 cm.
10cm
.
Polluted Soil
a)
Anode (+) 1 2 43 Cathode (-)
Right
LeftUpper
Bottom
b)
Polluted Soil
Photovoltaic panels
Control Panel Computer / control software
+ -
- 20 -
Figure 1.
0
0.1
0.2
0.3
0.4
0.5
0.6
0.7
0.8
0.9
0 1 2 3 4 5 6 7 8 9 10 11 12 13 14 15
Time / d
I / A
0
10
20
30
40
50
60
70
80
90
Q /
Ah
0
100
200
300
400
500
600
0 1 2 3 4 5 6 7 8 9 10 11 12 13 14 15Time / d
Pow
er ir
radi
ated
/ w
m-2
a)
b)
- 21 -
Figure 2
0
0.05
0.1
0.15
0.2
0.25
0.3
0.35
0.4
0.45
0.5
0 1 2 3 4 5 6 7 8 9 10 11 12 13 14 15
Time / d
I / A
0
1
2
3
4
5
6
7
8
9
Q /
Ah
- 22 -
Figure 3.
- 23 -
Figure 4.
- 24 -
Figure 5.

- 25 -
Figure 6.
Figure 7.