solar energy utilization in the united stateslocal.ans.org/norcal/wp-content/uploads/2013/02/ans...
TRANSCRIPT

Solar Energy Utilization in the United States
For the American Nuclear Society Nor Cal
Ali Moharrer, P.E. February 21, 2013

Professional Experience
• 20 years project engineer experience, including the overall engineering of: • Hydro electric power • Gas turbines • Steam turbines • CSP solar steam turbine • Photovoltaic power
• Project Engineering experience with world’s largest hydrogen generation plant: 220 MMSCFD (million standard cubic feet per day )
• Power Projects: 50- 1000 MW • Mechanical design and fabrication
background
2

Earth Climate: A global solar power plant Fuel source: ~ 240 W/m2 solar flux (average annual)

CAISO (2/16/2013)

CAISO (2/16/2013)
CA Renewable Portfolio Standard 33% by 2020
• Established in 2002 and accelerated in 2006. • It is procurement program requiring utilities,
and other electric service providers to increase their annual use of (eligible) renewable generation sources.

California Solar Energy Potential
• High direct normal incident solar radiation • Access/proximity to transmission lines • Large urban areas • Most populous State in the US.

Electric Net Summer Capacity ( x1000 MW) Total (All Sectors), 2011 values (EIA, Annual Energy Review 2011)
0
200
400
600
800
1000
1200
2011
SolarNGNuclearTotal

Solar vs. Conventional Power Plant: similarities/differences
Similarities • Single/multiple generation
sources • Fit for utility scale • Controllable output • Dispatch-able • Support the base load (CSP) • Scalable (n x MW)
Differences • Costly (LCOE high) • Subject to solar irradiation • Need sunlight, clear skies • Variable output (PV) • Low capacity factor (<2000
hours/year) • Zero cost of fuel, • Low O&M cost • Large footprints (~ 5 acres
/1 MW)

Existing Capacity by Energy Source (MW), EIA 2011
Energy Source Number of Generators Generator Nameplate Capacity Net Summer Capacity Net Winter Capacity
Coal 1,400 343,757 317,640 320,185
Petroleum 3,738 57,537 51,208 55,179
Natural Gas 5,574 477,387 415,191 448,456
Other Gases 91 2,202 1,934 1,919
Nuclear 104 107,001 101,419 103,507
Hydroelectric Conventional 4,048 78,194 78,652 78,107
Wind 781 45,982 45,676 45,689
Solar Thermal and Photovoltaic 326 1,564 1,524 1,411
Wood and Wood-Derived Fuels 345 8,014 7,077 7,151
Geothermal 226 3,500 2,409 2,596
Other Biomass 1,660 5,192 4,536 4,600
Hydroelectric Pumped Storage 154 20,816 22,293 22,268
Other Energy Sources 81 1,697 1,420 1,424
Total 18,530 1,153,149 1,051,251 1,092,780

U.S. Photovoltaic Solar Resource

Capacity Factor CF= (Actual annual output energy/name plate power at 8760 hr)

Utility‐Scale Solar Projects in the United States (SEIA Nov 2012)

Incoming Solar Energy

Sun at 5670 K (visible): Earth at 255 K (IR) (effective temp) Radiation balance between two black bodies

Solar Energy Utilization: CSP vs. PV
Thermal (solar concentration) Electrical: PV module
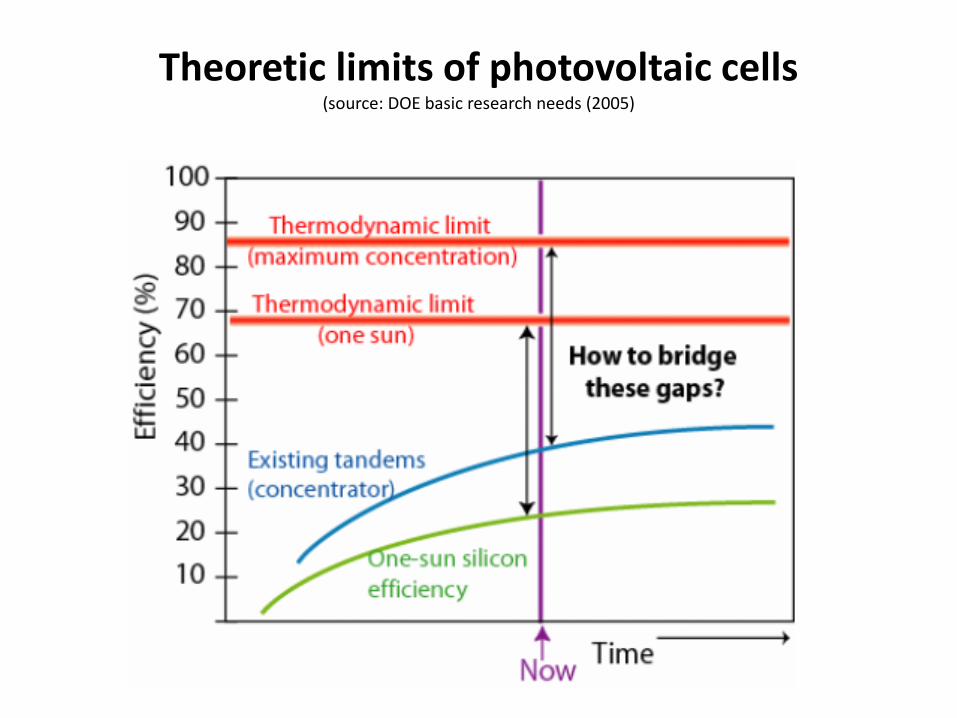
Theoretic limits of photovoltaic cells (source: DOE basic research needs (2005)

Solar Cells Thermodynamic efficiencies (black body approximation)
1. Shockley-Queisser
thermodynamic limit (March 1961) established the max theoretical limit of thermal efficiency a single junction solar cell (regardless of technology)
2. Max efficiency: ~30% at 1 x sun
• Can we push this limit higher? (see Eli Yablonovitch’s paper of 2011)

BrightSource Ivanpah, CA (3 x 123 MW)

Ivanpah Solar Plant Key Data
Component Value Plant name plate 3 x 123 MW Turbine SST-900 dual-casing reheat turbine Footprint ~3,500 acres (BLM) Annual generation ~ 1,079 GW hr Total installed cost $2.18 billion Solar technology Luz power tower 550 Commercial operation
March 2013?

Ivanpah CSP: Power Block
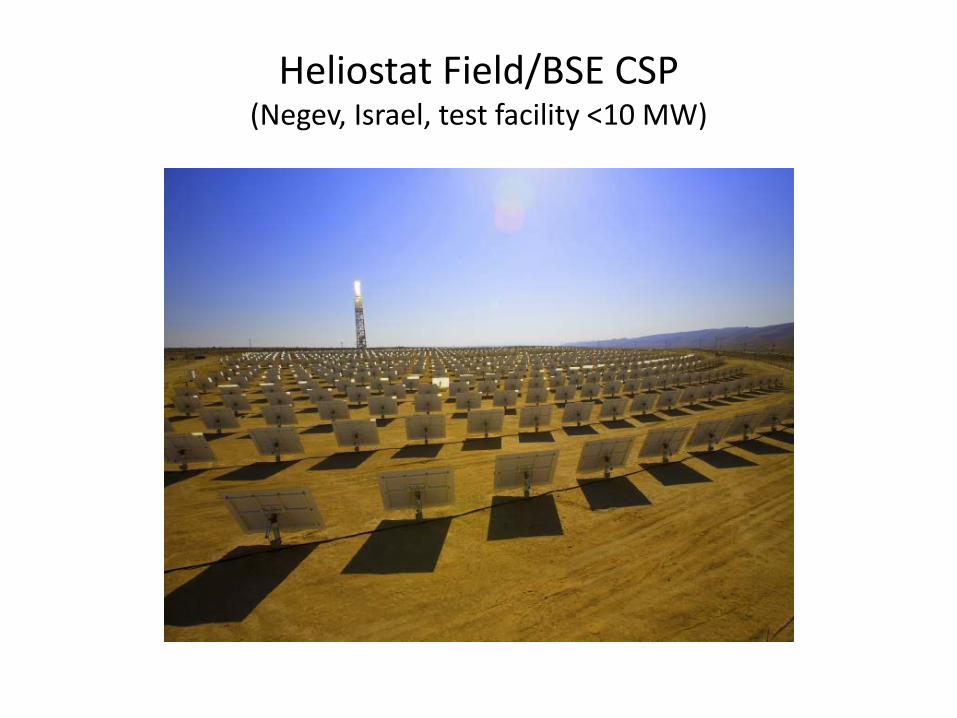
Heliostat Field/BSE CSP (Negev, Israel, test facility <10 MW)

CSP: Power Tower

25
(Rocketdyne) Molten Salt Technology (cycle diagram)

26
SolarReserve Power Tower 150 MW Rice Project, CA (approved by CEC for construction Feb 2012)

CVSR/ SunPower 250 MW (CA)

CVSR/ Plant Key Data San Luis Obispo, CA
Component Value Plant name plate 250 MW Power Block 1.5 MW ac (Oasis) PV module E20, 435 W (STC) Footprint ~1,500 acres Annual generation ~ 550 GW hr Total installed cost $? Solar technology SunPower Oasis power block
T0 single axis tracking Commercial operation
1st phase 2012 (130 MW on grid) Complete : 2013
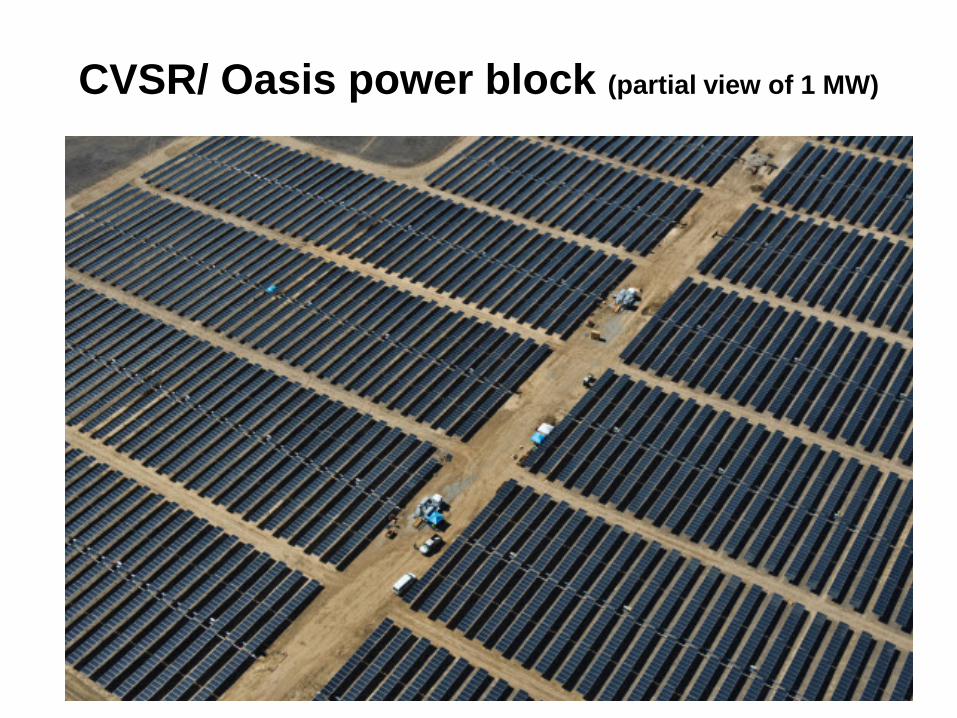
CVSR/ Oasis power block (partial view of 1 MW)

SunPower E 20 module, 327 Wp

Solar Cell: Current-Voltage Map Energy harvest

Power profile: PV Power Plant
Power Plant: 20 MW ac
Power Block: 1 MW ac
PV Array: 1 MW
PV string: 3000 W
PV module: ~300 W
PV cell: ~5 W

Nevada Solar-1/CSP/(64 MW) Source: Acciona

PV power plant operation (100 kWp)

Intermittency: La Ola PV System, HI (1.3 MW) Sandia Report: Energy Storage, 11/2011

Dealing with intermittency: Energy (thermal) storage concepts/technologies
• Atmospheric conditions sit between the solar power plants
and the clear solar irradiation. 1. Intermittent operation (cloud passage, rain, snow, etc) 2. Ability to dispatch (look ahead requirements from
transmission system operators, see CAISO guidelines for large solar power projects)
3. Variability (PV power plants have instantaneous mega Watt outputs)
– How to deal with 1-3 above? • Thermal storage • Energy storage • Grid regulation (voltage, frequency, peak shaving, …)

PV variable generation (MW /min) Source: SEPA 02-08, , Hoff-Perez

CSP: Tracking Collector Trough

Nevada Solar-1: 65 MW (400 acres)
Built 2007 (Boulder City, NV)

Energy Conversion Efficiency Cascades: CSP Representative & Rough

Andasol 1-2, 50 MW, Spain Solar Millennium AG

Thermal Storage source: Solar Millennium/Andasol

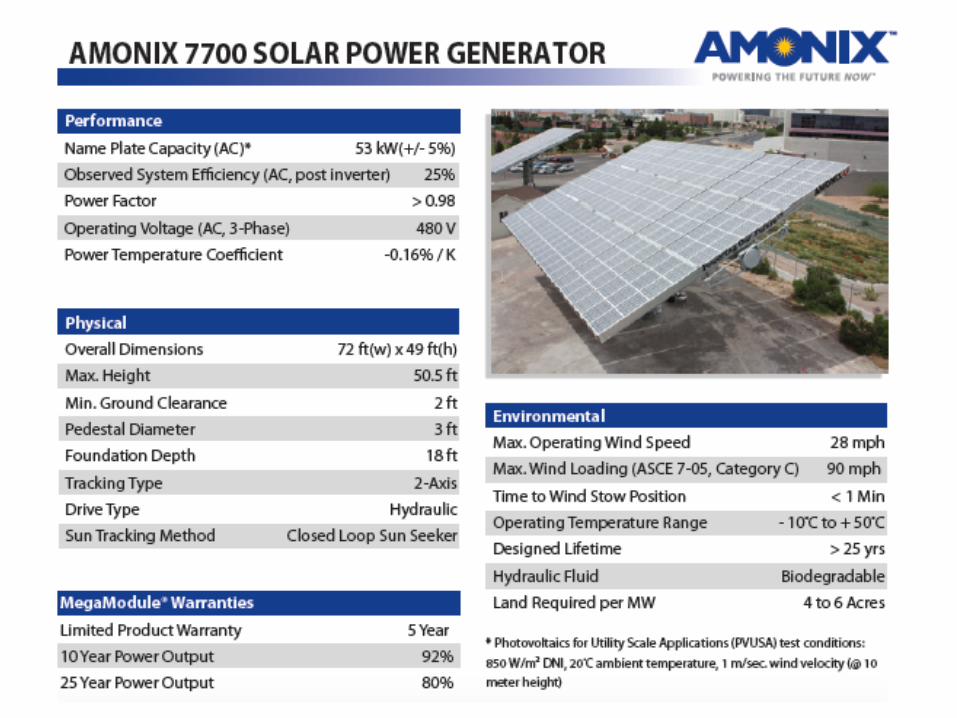
Amonix CPV modules/53 kW Alamosa 30 MW CPV plant, CO

Amonix CPV (500 x SUN)

Concentrated PV: SP C7 tracker module (mono-Si, 20.1%, (108 x 138W) @C7, 14.7kWp)

PV vs. CPV (energy yield) Normal production operating hours

Thermo-photovoltaic power (MIT TPV)

Other Solar Technologies that were put on hold…
1. Google Energy: solarized gas turbine (<1000 kW)
2. Tessera Sterling Dish (800 MW) 3. Solar Millennium Blythe Super scaled
Heliotrough project (Blythe 1000 MW)

50
Blythe Solar Power Project Site (4 blocks of 250 MW each), Blythe, CA
51
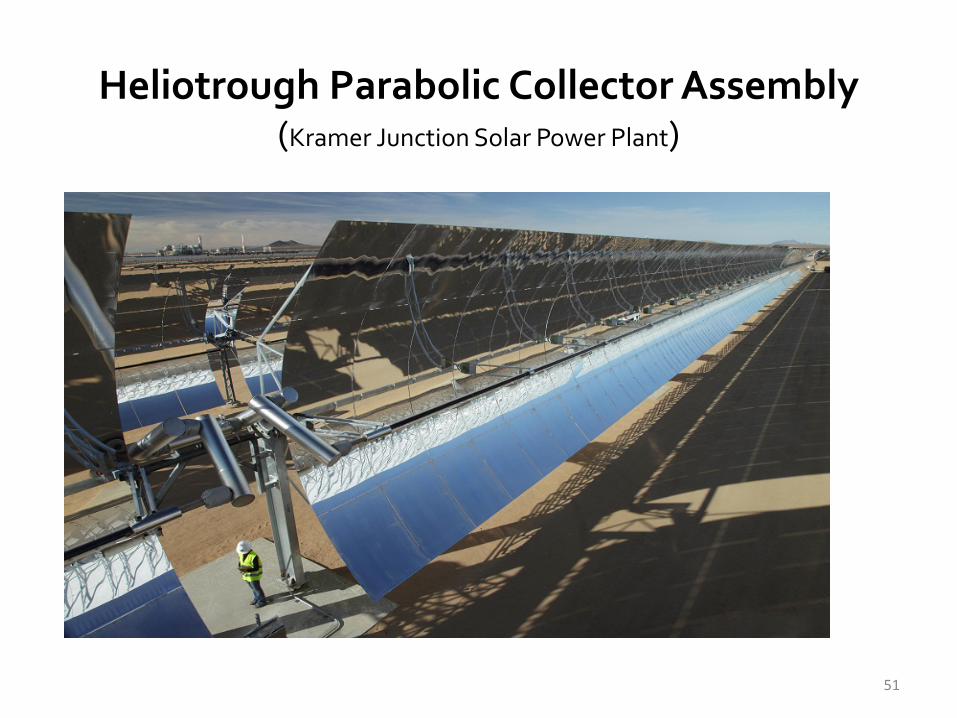
Heliotrough Parabolic Collector Assembly
(Kramer Junction Solar Power Plant)

52
Bythe‐1: 3D Model Power Block Area

53
Blythe Solar Power Plant Process Flow Diagram

54
Blythe-1 Solar Field Key Design Data Parameter Unit Value Solar Field output MW th 700
Maximum thermal efficiency % 75
Maximum optical efficiency % 83 Solar Concentration 80 Max fluid temp F 750 Collector Loops 280
Solar Collector Elements 11,200
Tracking Accuracy deg ±0.1
Working medium volume gal 2 million
Solar Field Availability % 99 Mirrors (RP4) pieces (~5’ x 6’) 499,200
Flow Control: Variable Drive
Thermal Storage hr 0 Solar Field Control SCADA

Heliotrough parabolic trough collector (~ 2.3 MW th at design point condition)
SEGS, Kramer Junction, CA Key Data • Optical concentration: 80 x sun • Optical efficiency: ~<83% • Thermal efficiency: ~ 74% (at
design point condition)
• Aperture: 12,600 ft2 • # of mirrors: 480 • Alignment: ±0.1 deg arc • Funded by DOE (SEGS power
plant) • Engineer: Flagsol-Schlaich Bergermann

56
Heliotrough being set on its support pylons

• A new industry for the new scaled up technologies. • Need to improve collector optical efficiency. • Need to improve thermal efficiency heat collecting elements. • Ability to increase turbine inlet steam temperature. • Developing advanced air cooling systems. • Reduce plant parasitic loads (lower below 10% of gross output). • Configure new emergency power systems for solar field. • Advanced thermal storage materials and technologies. • Reducing solar field cost: mirrors, steel frame, bulk commodities. • Reducing use of water (and mirror wash): ~120 gal/MW-hr
• Better modularized design for collectors (fast construction).
57
Inherent challenges in CSP solar technology

PV power plant equivalent circuit Utility Scale PV plant/topology

Grid integration of solar power projects:
– Penetration of CSP vs. PV power plants on the electric power system
– Sandia (SEGIS) – What CAIO is doing? (solar field telemetry)

Cost of Installed Power levelized cost of electricity (B&V 2012)
Technology ($ /kW) (2010)
Nuclear (1125 MW) 6100
Gas Turbine (211 MW) 651
Combined Cycle (580 MW) 1230
Concentrated Thermal Solar (without thermal storage) 4910
Flat Panel PV (10 MW) tracking 2830
Flat Panel PV (10 MW), fixed tilt 2590

DOE Cost reduction target 2015 $1/Wp work shop summary
PV cost Data point 2010 2016 installed system $/W % module $1.7800 51.15% $1.0500 BOS/installation $1.4800 42.53% $0.9700 power electronics $0.2200 6.32% $0.1800 Total cost $3.4800 100.00% $2.2000 cost of energy module $0.0630 45.32% $0.0370 BOS/installation $0.0550 39.57% $0.0340 power electronics $0.0080 5.76% $0.0060 O&M $0.0130 9.35% $0.0090 LCOE $0.1390 100.00% $0.0860

Projections for levelized cost of electricity Source: Stefan Reichelstein (2012)

Commercialization: Viability to Bankability
• What constitutes a technology as commercial ready?
– Holds a successful proto-type run. – Has collected enough field operation data. – Independently reviewed by 3rd Party Engineers – Reliability – Possesses demonstrated Quality Assurance
program the across R&D and technology development
– Investors

Solar Project Development
– Power Purchase Agreement – Land (lease or BLM lands) – Transmission access (system interconnection):
• Large Generators or Small Generators
– Permitting (CEC or local county) – EPC Cost (engage an general contractor) – EPC contracts – Design life: 20 – 25 years

Solar Energy & Water Use