soil survey and land evaluation in the...
TRANSCRIPT

SOIL SURVEY AND LAND EVALUATION IN THE MANO RFVER UNION AEEÄ7
(eastern Sierra Leone and western Liberia)
r Scanned from original by ISRIC - World Soil Information, as ICSU World Data Centre for Soils. The purpose is to make a safe depository for endangered documents and to make the accrued information available for consultation, following Fair Use Guidelines. Every effort is taken to respect Copyright of the materials within the archives where the identification of the Copyright holder is clear and, where feasible, to contact the originators. For questions please contact soil.isric(p)wur.nl indicating the item reference number concerned.
W.J. Veldkamp
Land Resources Survey project
Mano River Union
Monrovia, Freetown
Liberia, Sierra Leone
October 1980

>L /S&0.0
- 1 -
Soil survey and land evaluation in the Mano River Union area;
(eastern Sierra Leone and western Liberia).
CONTENTS Page
Acknowledgements
1. INTRODUCTION
2. GEOGRAPHIC SETTING
2.1 People
2.2 Vegetation and present land use
2.3 Geology and geography
2.k Climate
2.5 Land regions
11
11
1U
17
19
21
3. SOILS AND SOIL CLASSIFICATION
3.1 Soil classification in the MRU-area
3.2 General soil characteristics
3.3 New framework for soil classification
3.k Examples of existing soil maps at various scales in the MRU-area
3.1+.1 Reconnaissance - exploratory scale
3.U.2 Semi-detailed scale
3.^.3 Detailed and very detailed scale
25
25
27
28
U5
57
78
k. LAND EVALUATION
k.1 Introductory
k.2 Exploratory - reconnaissance scale
U.3 Semi-detailed scale
k.k Detailed and very detailed scale
i+. i+. 1 Agricultural characteristics and management
k.k.2 Land evaluation procedure
1+. i+. 3 Land qualities and crop requirements
U.i+.U Ecological suitability
107
107
110
119
120
12U
129
132
152
7^39

- 2 -
Page
5. SOCIO-ECONOMIC CONSIDERATIONS AND REFLECTIONS ON FURTHER STUDIES " 15?
BIBLIOGRAPHY 159
The appendices belonging to this report are given as a separate
volume.
This report can be obtained through the Mano River Union,
P.M.B. 133, Freetown, Sierra Leone
P.O.Box 9050, Monrovia, Liberia.

- 3 -
LIST OF FIGURES
1. Base map of the MRU-area. 12
?.. Vegetation and land use of the MRU-area. 15
3. Geological map of the MRU-area.. 18
*4. MRU-area: agro-ecological zones, based on average annual
rainfall and length of the growing season. 20
5. Important land regions in the MRU-area. 23
6. Combinations of land systems in the MRU-area. k6
7. Sketched reconnaissance soil association map óf a part of
the Eastern Province of Siërra Leone. 50
8. Soil map of Kenema, Daru, Panguma, Bunumbu and Pendembu areas,
Eastern Province of Sierra Leone. 51
9. Photo-interpretation map of south-western Liberia, NW-sheet. 53
10. Photo-interpretation map of south-western Liberia, NE-sheet. 5U
11. Photo-interpretation map of south-western Liberia, SW-sheet. 55
12. Photo-interpretatión map of south-western Liberia, SE-sheet. 56
13. Soil association map of an area near Kenema, Sierra Leone. 58
1^. Reduced semi-detailed map of Upper Lofa, Liberia; north-western
sheet. . 6 0
15. Reduced semi-detailed map of Upper Lofa, Liberia; south-western
sheet. 61
16. Reduced semi-detailed map of Upper Lofa, Liberia; central-
northern sheet. 62
17- Reduced semi-detailed map of Upper Lofa, Liberia; central-
southern sheet. 63
18. Reduced semi-detailed map of Upper Lofa, Liberia; north-eastern
sheet. 6k
19. Reduced semi-detailed map of Upper Lofa, Liberia; south-eastern
sheet. 65
20. Photo-interpretation map of the Sinje/FDA-area, Cape Mount
county, Liberia, derived from enlarged aerial photographs. 72
21. South-western Liberia; study area MRU/Soils Division, 1979-19Ö0;
land systems, geology of Basement Complex and agro-ecological zones. 81
22. Soil map of the Sefula-area. 83
23. Soil map of the Bopolu-area. 87
2k. Soil map of the Wuilo-area. 92
25. Soil map of the Bembele-area. 95

- k -
Page
26. Schematic cross-section of the Zuani landscape. 99
27. Soil map of the Zuani-area. 101
28. Soil map of the Pendembu Agriculture Experiment Station. 10U
29. Soil map of the Cocoa and Coffee Experimental Station, Kpuabu. 106
30. Suitability for nine major crops in the Mano River Union area. 113
31. Sketched reconnaissance land suitability map of a part of the
Eastern Province, Sierra Leone. * 117

- 5 -
LIST OF TABLES Page
1. Vegetation/land use in the MRU-area. 16
2. Summarized key to the soil series of the framework for soil
classification in the MRU-area. k3
3. Correlation between the soil series of the framework 'for soil
classification in the MRU-area and the soil series (or soil
families or soil associations) of other studies in Liberia
and Sierra Leone. kh
k. Soil associations appearing within land systems in the Sierra
Leonean part of the MRU-area, east of the Sewa river. ^7
5. Distribution of land facets within the main land systems of
the MRU-area. *+9
6. Legend of the photo-interpretation map of south-western Liberia. 52
7. Legend of the semi-detailed survey of eastern Sierra Leone and
the comparable soil series of the framework. 66
8. Legend of the semi-detailed survey of Upper Lofa, Liberia, and
the comparable soil series of the framework. 67
9. Legend of the semi-detailed survey of Nimba county, Liberia,
scale 1:50 000. 68
10. Comparison of the extent of similar map units in the semi-detailed
and the reconnaissance maps of Nimba county, Liberia. 70
11. Tentative legend for semi-detailed soil survey in the Sinje/FDA-
area (Cape Mount, Liberia) at scale 1:20 000. 77
12. Tentative legend for the overall, systematic semi-detailed survey
of large tracts of land (only Basement Complex). 79
13. Characteristics of five survey areas in south-western Liberia. 80
1^. Main characteristics of the map units of the Sefula-area and the
classification according to the framework. 82
15. Main characteristics of the map units of the Bopolu-area and the
classification according to the framework. 86
16. Classification of the Wuilo soils according to the framework. 9 I
17. Main characteristics of the Bembele map units and the classification
according to the framework. 9*+
18. Details about the suitability of nine major crops in the MRU-area. 11*+
19. Summary of differences in the land evaluation methodology of two
studies. 118
20. Legend of the suitability map of Nimba county, Liberia, scale
1:50 000. 121

--G-Page
- 2*1 .-'ie^p'süri^riJtlfet%"e^ntltheT:extent3-öft:.ii»p.-units' in the- semi-detailed
and the'recohhaissance survey of Nimba county, Liberia and the
laiid,'UsePcpossi'bilities. 122
22. Prop^sed:^cTfè'cklri*st'^för suitability classification at a more
detailed scale in Nimba county, Liberia. 123
23. Quaii'tat-ïve'\.-sp'ëcifi*:ation of three management levels according
to "s'éïëc?€ed'efe"asiblë' factors. ,->l,-27
2 k . -Li-st3:'of'®ré'ïêV'anii-'il'dnd'''qualities i n t h e M R U - a r e a f o r t h e d e t e r -
mindtibflibfhthëUsüïtability of food and cash crops. 1,29
25. List^of^fäod^indic'süsh:-crops: used in the land evaluation procedure. ,1,30
26. Dëscrip'Ëïofii'offithêofouruland suitability .classes according to
•FAO'ri'^fö^andiBir.chélltetJ.al. (1979). -131
27. eöefficiüehts^'for'the~calculation of AWC , AWC^ and AWC . 133 s d vd
28.•--Qualification?of**'AWC 'iv.'AWC,nand AWC , . .A 3k t> s ~ d vd
"29'.' Ra-Mn'g'ofhthV^'äVai'O.abi'lityf'of-water". - ,:]3k
30. t rop^reqüi^remeht 's -^för i the . land q u a l i t y " a v a i l a b i l i t y of wa te r " . -.135
' ST . 'R ' a t ' i ng^o l fk t t i e^^ : ^ó136
" 3 2 . £ropeïëqm!'ement%1if^^^ of ( s o i l )
- b'kygen". - -. y137
- ' 3 3 . Kating'^olf^^h^^VcavalfliabiiM ofwnutr ier i t .s" . • --5I38 T 3k. 'Crop^ïë'qui'remeht's-'for tthe<rlajidMquality..- ,"ayailability of n u t r i e n t s " : ,-139
'35. cGropcrè'q^iT'ëméh"tfs^fo^ of s o i l - sa l in i ty ' ! ^ .-1^0
-36. cRäfiri&' of J c tne ^absence'" of ^impediment; of .rjoot development". -1^3
37•' rGröp'(-req^i"remëntsi'föf '-the.nlajid^q.üality-..jj''al)sence of impediment of
ïootrvdév>ëlopmënt". Akk
38. °Crdp9féqiïir"èménts "fortthenlanji;<qüalityv"a'bsence of su r f ace , s tones uand v rock r cóüt c r o p s " . 1^5
'39- "Crop'-^feqüirëmënts -'for•< t h e n l a n d qua l i ty» "absence of f l o o d i n g " . 1^8
UO. ' e rop^ réqü i r ëmën t s 'Tof^ then land^qüa l i ty . " r e s i s t a n c e to e r o s i o n " . 150
k\: "Cropqrèqü :i1rëmënts 'for ^thenDiandnqüality "absence of high, ,a i r . ,humidi ty
during* t h e - r a i n y - S e a s o n ' ' . ,151
°k2. Highly0aJiä^m'öderätely' s u i t e d c c r o p s onn-some.-common- s o i l s :under , , three r ' 'managëment^lèvels . 1 ..^153

- 7 -
ACKNOWLEDGEMENTS
The following persons and institutions are acknowledged for their
support, help'and advises:
Mano River Union : Mr. B.R.C.Banks, Mr. E.Eastman, Mrs. M.A.Ash,
Mrs. G.Freeman, Ms. I.Browne.
Soils Division, CARI, Suakoko, Liberia: Mr. E.K.Johnson, Mr. A.F.Harris
and the trainees; Mr. P.Korvah and Mr. Dolley of
the laboratory.
Land Resources Survey project, FAO/UNDP-MAF, Freetown, Sierra Leone:
Mr. D.C.Schwaar, Mr. M.S.Kargbo, Mr. L.Touber,
Mr. L.Cole, Mr. B.Schalk and Mr.Petard.
UNDP, Monrovia, Liberia: Mr. F.Paats.
UTA, Ibadan, Nigeria: Dr. A.S.R.Juo.
Forestry Development Authority, Monrovia, Liberia: Mr. E.Dow,
Mr. A.Lawrence, Mr. S.Bakundu.
Agricultural University Wageningen, the Netherlands: Mr. W.Blokhuis,
Dr. J.C.D.Dijkerman, Mr. R.Miedema.
Stiboka,.Wageningen, the Netherlands: Mr. R.P.H.P. van der Schans.
IAC, Wageningen, the Netherlands: Mr. A.M.Harteveld.
ILRI,.Wageningen, the Netherlands: Dr. K.J.Beek.
University of Utrecht, Utrecht, the Netherlands: Dr. F.R.Moormann,
Mr. H.Albers.
DTH, The Hague, the Netherlands: Mr. J.M.A.Hasselman, Mr. A.G.Vink,
Mr. Molenkamp.

- 9 -
INTRODUCTION
This report is the result of the Land Resources Survey pro
ject of the Mano River Union. This project was carried out du
ring 1976 to 1980; in the first years by Mr. D.van Mourik and
finished by the present author.
This report intends to give the existing information on
soils and soil maps within the Mano River Union area (inclu
ding eastern Sierra Leone from the Sewa-river and western Li
beria from the St.Paul river). After an introductory chapter on
geographic characteristics, more specific soils and soil clas
sification data are given. This chapter (3) consists of a new
framework for soil classification, which is based in the first
place on applicability and significance. The system is to be
used by soil surveyors in the field. Some examples of soil maps
are discussed in the rest of chapter 3.
Land evaluation forms" the main issue'of chapter k. After
discussing land evaluation on semi-detailéd and smaller scales,
the procedure for the larger scale iand-evaluatioh is explained.
The results and further discussion forms'"the rest of the report.
The soil classification and land' evaluation as given in
this report are of preliminary nature'and need revision and
continuous study in coming years. This report'is'intended to t ' • •
be a start in the direction of systematic soil survey and
land evaluation and should certainly hot be treated as final
text on this subject in the MRU-area.

2. GEOGRAPHIC SETTING
- 11 -
The Mano River Union (MRU) - area is shown in fig. 1. The
boundaries of the MRU-area are the Sewa river in Sierra Leone on
the western side and the St.Paul river in Liberia on the. eastern
side; in the north the border with the Republic of Guinea and
in the south the Atlantic Ocean determine the area.
The MRU-area is characterized by a large sparsely populated
rain-forest area in the centre. Around this centre agricul
ture and forestry are important economic sources of income.
Mining (iron ore, diamond, gold) plays a substantial role.
Industry of some extent does hardly occur. Important agricul
tural areas are found in the northern part of the MRU-area,
in Sierra Leone around Pendembu-Daru and in Liberia in Upper
Lof a.
In Sierra Leone a major road runs from Freetown through Bo
to Kenema-Pendembu-Kailahun. In Liberia, in the southern part
of the area, the road between Monrovia and the border with
Sierra Leone (at Bo, near the Manó River Union bridge over
the Mano River) form part of the Pan-African highway. Pre
sently a new road from the border to Bo in Sierra Leone is
planned to facilitate transport between Freetown and Monrovia.
In the northern liberian part the main road is running through
Gbangba to Zorzor-Voinjama-Kolahun-Foya and is connected with
Kailahun in Sierra Leone.
Major rivers run in a north-southern direction to the At
lantic Ocean. In Sierra Leone the Sewa and Moa rivers are the
main ones; in Liberia the St.Paul and Lofa. The border river
is the Mano/Morro river.
2.1 People
The population density within the MRU-area is variable;
areas with less than 10 persons/km are found in the central
part. Around this centre the density may increase to 120, but the
average density is between 20 and UO persons/km . The popu
lation growth is 2.5 to 3-5$ annually.
The population can be divided into several tribes. These
tribes still play an important role, especially due to their
specific traditions and language. The names and importance of
the tribes are not given.

- 12 -
' ) / cö '"* Jf 0)
y u j cö / 1
-f £3 7 «
2£ 0) ^ +> « H O
p< cö E <U
c 0) o cd V CQ u o •
r-
u • +* hO c •H o Ê4

- 13 -
A large part of the rural population is involved in tra
ditional agriculture. Most and probably all food consumed in
the rural areas is produced locally. The marketing system in
which agricultural products are brought to urban centres is
only marginally developed; the most important products are
(robusta) coffee, cocoa, cane juice and perhaps rice. Other
forms of employment are found in:
- some commercial plantations (rubber, oil palm)
- timber extraction by foreign companies
- mining. Iron ore is the most important form of mining,
especially in Liberia; secondary forms of mining involve
minerals as diamond, gold, rutile and bauxite
- road building, housing
- education, agricultural extension
- tourism; hardly developed yet, although plans are made to
make the beaches more attractive
- other forms of state-governed work (regional administration,
police, customs).
A severe urbanization can be observed involving cities
like Monrovia, Bo, Kenema. Some cities, such as Robersport
in Liberia seem to have a decreasing population (due to mi
gration to Monrovia). Three categories of cities can be devided:
- large cities with a mixed population, serving as administra
tive centre for large areas or a nation (e.g. Monrovia, Free
town); these cities are characterized by a severe population
growth
- cities with regional importance and with an increasing po
pulation (e.g. Kenema)
- cities with regional importance but with a decreasing po
pulation (e.g. Robertsport).
People have migrated since many years, formerly from the
rural areas to local centres. Nowadays urban centres in the
interior, and especially a city like Monrovia attracts many
people, either educated or not. Most urban centres within the
area will continue to grow. The expectation is that the rural
areas will be inhibitated by less people in the future. On
the other hand the urban centres will increasingly depend on
the production capacity of the rural areas, especially with
respect to food production. An increase of food imports seems
inevitable and at the same time dangerous. A serious effort
- 1 1 » -
to develop the rural areas especially with respect to food
production is of utmost importance.
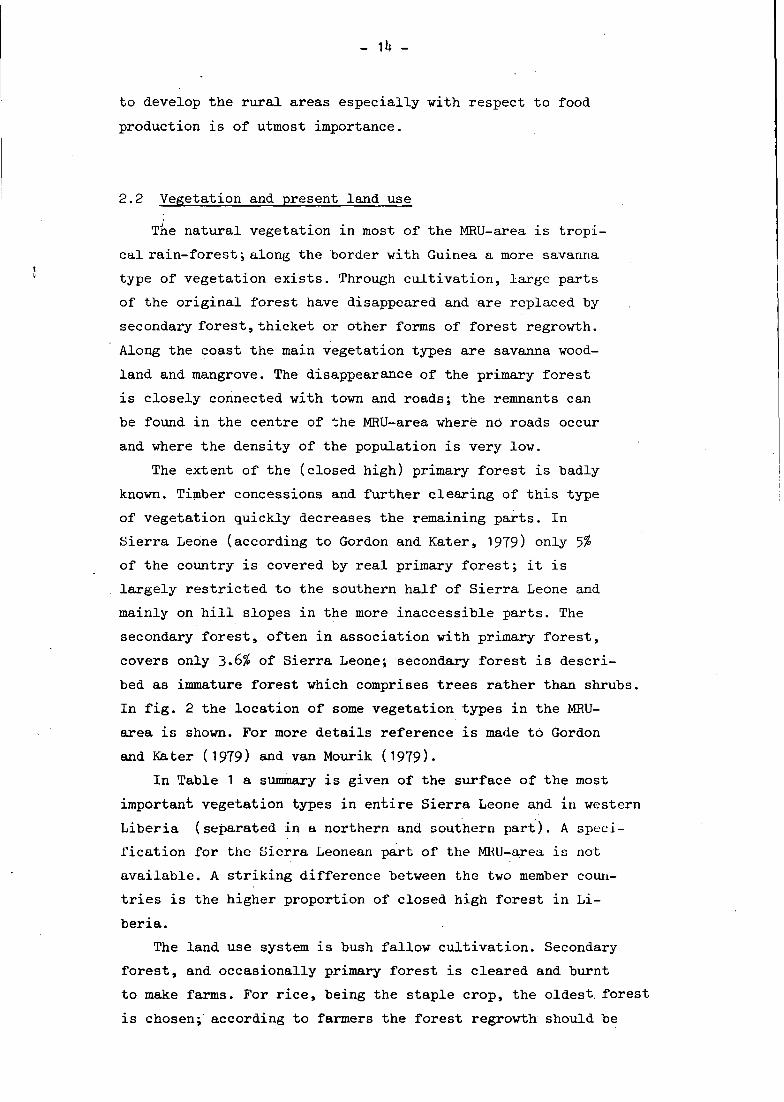
2.2 Vegetation and present land use
The natural vegetation in most of the MRU-area is tropi
cal rain-forest; along the border with Guinea a more savanna
type of vegetation exists. Through cultivation, large parts
of the original forest have disappeared and are replaced by
secondary forest, thicket or other forms of forest regrowth.
Along the coast the main vegetation types are savanna wood
land and mangrove. The disappearance of the primary forest
is closely connected with town and roads; the remnants can
be found in the centre of the MRU-area where nö roads occur
and where the density of the population is very low.
The extent of the (closed high) primary forest is badly
known. Timber concessions and further clearing of this type
of vegetation quickly decreases the remaining parts. In
Sierra Leone (according to Gordon and Kater, 1979) only 5%
of the country is covered by real primary forest; it is
largely restricted to the southern half of Sierra Leone and
mainly on hill slopes in the more inaccessible parts. The
secondary forest, often in association with primary forest,
covers only 3-6$ of Sierra Leone; secondary forest is descri
bed as immature forest which comprises trees rather than shrubs.
In fig. 2 the location of some vegetation types in the MRU-
area is shown. For more details reference is made to Gordon
and Ka ter (1979) and van Mourik (1979).
In Table 1 a summary is given of the surface of the most
important vegetation types in eniire Sierra Leone and in western
Liberia (separated in a northern and southern part). A speci
fication for the Sierra Leonean part of the MRU-area is not
available. A striking difference between the two member coun
tries is the higher proportion of closed high forest in Li
beria.
The land use system is bush fallow cultivation. Secondary
forest, and occasionally primary forest is cleared and burnt
to make farms. For rice, being the staple crop, the oldest, forest
is chosen; according to farmers the forest regrowth should be

- 15 -
O 20 40 60 SO km
F i g . 2 . Vegeta t ion and land use of the MRU-area
Legend.
1. Closed forests
2. Forest regrowth and farmland
3. Savanna woodland
ko Mixed tree savanna
5. Complex of Lophira tree savanna
and boliland swamps
6. Upland grassland
7. Montane grassland and rock
outcrop
8. Mangrove swamp forest
9„ Association of coastal for
and swamp grasslands
1Ö> Upland crops
+ oil palm/rubber

- 16 -
at least 15 to 20 years old to obtain one reasonable rice
yield'. .The second food crop is cassava for which a shorter
fallow period is sufficient; this crop is often cultivated
after the' first-year rice crop.
Besides food crops, smallholders have small plots of
tree crops, in particular coffee and cocoa. Sugar cane has
become a very attractive cash crop.
Table 1 Vegetation/land use in the MRU-area
Sierra Leone^'
km2
Western Liberia.
north' 2)
km*
south 3)
km£
1. closed primary and
secondary forest^'
2. forest regrowth and
farmland
3. savanna woodland
k. mixed tree savanna
5. complex of Liphira tree
savanna and boliland swamps kk65
6262 8.6 15557 73.7 97U 17.0
3 7 7 ^ 52.2
6226 8.6
7320 10.1
6. upland grassland
7. montane grassland and
rock outcrops
8. mangrove swamp forest
9. association of coastal
forests and swamp grass
land
10. upland crops
oil palm plantations or
rubber plantations
2552
5^0
1716
6.2
3.5
0.8
2.U
5018 23.8 U386 76.6
^9Ï^ 0.9
250 1.2
3729 5 .2 -
16)<0 2 .3 8()
63 0.1 1
21 _ 1
0.3
9 0.2
25*t
IL»
06
0.3
1.5
1)
2)
3)
M
Gordon and Kater, 1979
Van Mourik, 1979
Veldkamp, unpublished, see figs. 9-12 of this publication
Division of this unit into primary and secondary forest:
Sierra Leone ...primary 3,652 km2 (5.0$), secondary 2,610 km2 (3.<
Western Liberia (northern part) ....primary 13,660 km2 (6k.7%)
secondary 1,897 km2 (9.0$)
Western Liberia (southern part) ... no subdivision possible.

- 17 -
2.3 Geology and geography
The geology of the MRU-area is given in fig. 3. The MRU-
urea can be divided into two main sections:
a) Along the coast quarternary deposits are found with a
specific appearance. It is a relatively flat area with
swamps and lagoons. On aerial photographs irregular pat
terns are observed in many places indicating a complex of
well and poorly drained land types. Also more regular pat
terns, often close to the beach, occur forming the recent
and older beach ridges. The Coastal Plain has a width varying
from about 1 km (north-west of Monrovia) to about 20 km (along
the Sewa river near.Torma Bum in Sierra Leone). The greater
width in the latter case is mainly due to the obstruction
of the outlet of the Sewa river by long beach ridges, cau
sing the flooding of a large inland area. These beach ridges
are formed by a continuous westward flow of sediments along
the coast. The outlets of the other rivers are characterized
by sandbars at the eastward side. Some other outstanding fea
tures include Lake Piso, a shallow, but relatively large lake
and the norite body of Robertsport (Cape Mount).
b) The second section comprises the Basement Complex, covering
the rest of the area. This Complex is of Precambrian age
and consists mainly of gneisses and granites. The degree
of metamorphism of the rock is variable; its mineral compo
sition is very variable. Although the geological map shows
some distinction between more basic and more acid rocks, such
differences could hardly or not be found in the field. The
topography of the Basement Complex is undulating to rolling,
and locally hilly. In the northern parts monadnocks ("insel-
berge") are common. The land rises gradually from the Coastal
Plain to heigths of 700 m. The landscape is dissected by long
ranges of hills with peak altitudes up to 1800 m. Commercially
important are those ranges or hills consisting of itabirite,
an iron-containing mineral. Granite bodies are mainly found
in the north.
At the boundary of Coastal Plain and Basement Complex the
geology of the underlying bedrock is irregular; locally ter-
tiairy sandstone is found. Also characteristic are the flat
terrace-floodplain-like areas scattered at the boundary zone;

- 18 -
Legend.
Metamorphic rocks
1« Leucocratic gneiss, granitic gneiss, composite gneiss, quartz
diorite gneiss and granodiorite gneiss (granitic migmatite comple
2. Melanocratic gneiss (Kasila group, Mano-Mao granulites)
3. Schist, ampHiboiité k. Iron-formation, oxide facies (itabirite) in association with a
composite unit, consisting of quartzite, schist and amphobolite
5» Conglomeratic deposit consisting of clasts of iron-formation cemented by iron oxides
Plutonic igneous rocks
6. Unfoliated granitic rocks (Younger granite, Kongotan)
7. Norite
Sedimentary rocks (mostly unconsolidated)
8. Rokel River group, sandy and clayey sediments
9. Fluvial, deltaic, lacustrine and beach deposits, silty and sandy sediments (Bullom group)
t*-+*t- border Liberia/Sierra Leone
uncertain geological boundary (no evidence available)

- 19 -
apparently the river discharge during the rainy season is hampe
red "by Coastal Plain formations', causing flooding of these areas
and consequently deposition of sandy and clayey soil material.
In Sierra Leone an escarpment is observed in the Basement
Complex separating the interior plain area (elevation 1+0-200 m)
from the plateau region (elevation 300-700 m) (Birchell et al.
1979). This escarpment is very clear in north and central Sierra
Leone, but its distinctness decreases in south-western direction.
For more details reference is made to White and Leo (1969),
Williams (1978) and the Geological maps of Liberia, scale
1: 250 000 (19.77).
2.k Climate
Climatic characteristics of the MRU-area are the high
annual rainfall, the almost constant monthly mean temperatures
and the high air humidity. It is a typical climate of the humid
tropics. There are two distinct seasons, the wet season lasting
from April to October and the dry season from November to March.
The dry season is quite severe, although the natural vegetation
remains green throughout the year. The severeness of drought
during the months of January, February and partly March is re
flected by the lack of cultivation of annual crops during that
season on non-hydromorphic (well drained) soils. The range in
annual rainfall is 1Ö00 to ^500 mm, but with great variation
between years. The area around Monrovia, Liberia in the south
east of thé MRU-area is' thé wettest: annual rainfall up to
7000 mm occurs. •
Climatic data are scarce. There are not enough reliable
data of many consecutive years to delineate climatic zones.
With the available data ä preliminary division was made (fig.
h) using the length óf the growing season and the mean annual
rainfall. More data exist in Sierra Leone compared to Liberia.
The reliability of the lines for the length of the growing
season is limited; they are based on figures given by van Mou-
rik (1979) and by Kowal (1977). The growing season is defined
as the period during a year when rainfall exceeds half the po
tential evapotranspiration, plus a period required to evaporate
an assumed 100 mm of water from excess rainfall stored in the

- 20 -
N
t _____ _.Un« ofavarage annual rainfall
_ _ _ line of length of growing.settian
2 * S 0 . averag» annual rainlall (mmj 320 * length ol growing M a s o n
JUU aays • i 310 days 1 2000 mm •
' 3 , 5 d a y m j_aa.
F i g . k. MRU-area: a g r o - e c o l o g i c a l ztones, based on average annual
r a i n f a l l and l eng th of the growing season
l eng th ,of growing season (days) a v e r a g e , a n n u a l tfairifäll * , I i i n u l l u m
B e (ma? r a i m a x x y^Z^Q 300 -315 270 -300 more than 3500
3000 - 3500
2500 - 3000
2000 - 2500
1500 - 2000
more than 3000
A- B c D B F
G H I
J K L
M N 0
P Q R
Interior
Basement
Complex
Coastal Plain

- 21 -
the soil profile (FAO 1978). The lines for annual rainfall are
more reliable. For the Coastal Plain, taken apart from the rest
of the MRU-area for geological reasons, no separation in annual
rainfall was made; this whole area is indicated by an annual
rainfall of more than 3000 mm. Differences in annual rainfall
between 3000 and 1+500 mm in the Coastal Plain were assumed not
to be important enough to have a clear effect on agricultural
possibilities. The division of the Coastal Plain into three zo
nes by the length of the growing season already reflects even
tual differences.
A mid-dry season during July/August is observed most clear
ly in the higher rainfäll zones; the rainfall is reduced to some
extent during about three weeks. The mid-dry season is not severe
enough to separate the rainy season into two parts and the rain
fall pattern is taken as being mono-modal for the whole MRU-area.
For more detailed' information reference is made to Kowal
(1977), Lamin (1978) and van Mourik (1979).
2.5 Land regions
Based on the distinctions made by way of vegetation, geology,
climate and with the addition of the population density, the
following five land regions can be described.
- Generally low populated areas (with less than 25 persons/km^)
I Closed forest belt, consisting of secondary and primary
forest.
II Coastal zone, consisting of quarternary deposits, covered
by grasslands, forests and mangroves.
- Generally higher populated areas (up to about 120 persons/km^
- forest regrowth, farmland and patches of closed forest
III Areas with a relatively short growing season (less than
315 days) and a population density ranging between 10 and
100 persons/km^ .
- Areas with a relatively long growing season (more than 315
days)
IV Pendembu-Daru-Kenema area, a main coffee and cocoa belt
with a population density of 30-120 persons/km^ .
•V Monrovia-Bopolu area, with a population density of 10-
100 persons/km^, lower than area IV .

- 22 -
Each region has its significant characteristics, which may
be useful for planning purposes. This distinction can be used,
when a final land evaluation on reconnaissance scale is made
for the MRU-area (see fig. 30). In fig. 5 the regions are shown.

- 23 -
Fig. 5» Important land regions in the MRU-area

- 25 -
3. SOILS AND SOIL CLASSIFICATION
3.1 Soil classification in the MRU-area
Soil classification has only been practiced to a limited
extent in the MRU-area; usually local names were used. A tho
rough soil correlation of local soil series and directed to
wards international soil classification systems has only
begun recently. During the last 30 years several
soil surveys have been carried out. Usually each soil surveyor
used a new set of names to classify soils and this has resulted
in a lot of soil names in an uncorrelated way. Odell et al.
(197M were the first to publish a comprehensive soils report;
it deals with the soils of Sierra Leone.
In Liberia soil scientists from FAO, USAID and MRU have been
carrying out several soil surveys at various degrees of detail.
Two systems, those of Fanfant and Geiger remained; the one by
Fanfant originated in the north of the area (Upper Lofa) and
consists of soil families (or soil associations); the one by
Geiger was established in a detailed soil survey around Suakoko,
Liberia.
The most important soil surveys made in Sierra Leone sofar
are the ones by Dijkerman and Westerveld, Sivarajasingham, Stark,
Van Vuure and Miedema, Blokhuis et al. and most recently the
ones of the Land Resources Survey project (LRSP) organized by
FAO/UNDP-MAF, Freetown, Sierra Leone.
The LRSP, Freetown has put emphasis on photo-interpretation
in the first place. In Sierra Leone, and in Liberia by coopera
tion between LRSP and MRU, reconnaissance maps have been made,
using ihe land systems approach of CSIRÖ5 Australia» These
surveys were reported by van Mourik (1979) for western Liberia
and Birchell et al.(l979) for Sierra Leone. Besides land systems,
vegetation and land use were mapped (Gordon and Kater, 1979, van
Mourik, 1979). Information on soils in the reports is secondary
to the description of the land systems and their components, the
land facets. In Birchell et al. soils of the land systems/facets
are described very generally. Van Mourik used Fanfant*s soil
family names to describe the main soil families in each land
facet.

- 26 -
Soil correlation of Sierra Leonean and Liberian soil families
and series (or combined to soil associations) was carried out
by the author, working in the Land Resources Survey project of
the MRU, Monrovia, Liberia. All existing information on soils
was put together in a new comprehensive system to which will
be referred as the framework for soil classification (cf. pa
ragraph 3.3). The framework uses the soil series as the highest
level of classification; each series is divided into phases and
sub-phases.
The use of soil series and (sub-)phases means that the frame
work can only be used for detailed soil survey. For smaller scale
surveys (semi-detailed, reconnaissance) combinations of series
have to be made; in paragraphs 3. .2 and 3.^.3 this problem will
be discussed. An important characteristic of the soils in the
MRU-area is their variability, especially on the uplands. These
uplands comprise the major part of the land. Their soils differ
by gravel content, occurrence of fresh or partially weathered
rock fragments, thickness of the gravelfree surface soil and
parent material. On the Basement Complex these characteristics
may change over short distances. Moreover a clear relation be
tween physiography and soil series does not exist for the majority
of the upland soils. Fanfant's soil families and Sivarajasingham's
soil families are examples of soil associations where series are
combined. These soil associations are formulated by the dominant
soil series, the occurrence of minor associations or series and
eventually the variability among the constituent series within
each map unit. Mapping of these associations is difficult, as
clear morphometric differences have not been described; as a
result unclear physiographic characteristics were often added
in order to emphasize the differences. In practice, the soil
associations of Fanfant or Sivarajasingham are difficult to map.
On the other hand these associations are useful; they should be
brought together in.one clear system. The system should also be
applicable for systematic (semi-detailed) either physiographic
or soil surveys, especially outside the areas of origin. Such
a system has to be made yet.

- 27 -
So far, only detailed soil .surveys are reliable; the
survey scale in those cases is less than 1:10 000, often
as detailed as 1:2 500 or less.
3.2 General soil characteristics
For the discussion of general soil characteristics the
MRU-area is separated again on-a geological basis: the Coa
stal Plain and the interior Basement Complex. Firstly the
soils on the Basement Complex will be discussed.
As the Basement Complex rock is of Precainbrian age, soils
are supposed to be old. However, different climates occurred
during its history and erosion and deposition cycles have al
ternated. Very stable soils, as found in parts of Brazil ("oxi-
sols")probably do not occur: at least they have not been found
yet in the MRU-area. Most soils show evidence of on-going soil
formation processes, whether deposition on or erosion of their
surfaces, leaching of bases, weathering of minerals, occurrence
of clay illuviation (although not well understood sofar), occur
rence of residual ironstone and quartz gravel, homogenization
by termites and other animals, gley in hydromorphic soils, etc..
The most common soil on the Basement Complex is characterized
as follows:
- the gneiss bedrock is deeper than 1.5m.
- situated oh slopes of less than 13%
- covered by forest regrowth of 20 years of age or less
- well drained
- sandy loam surface soil covering a finer textured (often
sandy clay loam) subsoil
- a high variability in depth, thickness and amount of ironstone
and quartz gravel
- a moderate to slow soil permeability
- kaolinite as main clay mineral
- a very low cation exchange capacity
- a low base saturation
- a high proportion of aluminium on the exchange complex
- pH(H20) of less than 5.0
- a moderate amount of organic matter
- occurrence of plinthite, although very variable in intensity

- 28 -
- classification according to the Soil Taxonomy as Ultisols,
suborder Humult or Udult.
The above described soil occurs on upland positions. To
wards the bottom of the slope generally less gravelly soils
are found. The topographically lower positions are made up
either by 1) floodplains with poorly or very poorly drained
soils with variability in texture profile and gravel layers
or 2) terraces with moderately well to imperfectly drained
soils with an uniform texture and relatively high silt (or very
fine sand) contents; these soils are of special interest due to
their soil drainage'conditions, their low slope gradient and their
relatively good structure.
In the Coastal Plain not many soil surveys were carried out
yet. Soils data can be found in Dijkerman and Westerveld (1969) and
Eschweiler and Sessay (1980). The variability in soils increases from
the beach landinwards as the irregularity of the land increases.
T V * A *i v » i » o r » i l T ö ^ T + n r n o A Q i l f l o ^ V \^r 4* V I A S \ A V M ^ ^ I A V r r o i r ^ N + * A A V N A ^ -I +- ^ / \ M •• v\ XXXI»» X X X V . Q U X U ^ X W j X Ü t » C * M » * t ~ t X L/JT U U C W i U ^ X & A W Ö.Jf *-*X U C ^ W O I U I V U X t i
which the soil drainage varies within short distances. Moreover,
clear patterns of deposition are often hard to describe. The
soils, however, can be generally described as sandy and podsolic.
The ultimate soil is a clear podsol (see Gbamani-series). Besides
the degree of podsolization the soil drainage is the most impor
tant characteristic in mapping Coastal Plain soils.
3*3 New framework for soil eiassifiaction
The following framework is meant as a systematic soil classi
fication system. The framework is based on research of many soil se
ries and soil families found throughout the MRU-area and some par
ticular areas outside the MRU-area (e.g. Makeni, Sierra Leone and
Suakoko, University Farm, Liberia, areas with similar conditions
as within the MRU-area).
In the framework the soil series is the highest level of
classification. Such a level belongs to surveys at scale of at
least less.than 1:10 000. The soil series are classified accor
ding to a key, comparable to a flora. The soil series are sepa
rated on basis of the following characteristics:

- 29 -
- applicability in the soil survey
_ significant for land evaluation purposes.
Phases are the next kind of division within the framework. The
details about the phases can be found in Appendix I. The phases
are treated apart for each series. Subphases and even eventual
subphases are also mentioned; they might have quite some impor
tance in the evaluation of the profile in question, but cannot be
mapped due to the variability of the specific characteristic.
The key to the soil series is based on the following cha
racteristics (for the definitons of used names see Soil Survey
Manual or Soil Taxonomy):
- physiography
- soil depth
- soil drainage
- lithic, paralithic or petroferric contact
- type of parent rock
- coarse ironstone and/or quartz fragment content'
- coarse rocky fragments content'
- coarse weatherable fragment content'
- thickness of gravelly layer
- color
-occurrence of a spodic horizon
- percentage silt
- particle size class
- occurrence of acid sulphate soil conditions
Series names were not yet chosen, although proposals are given
in the descriptions in Appendix I. So far, only figures and
additionally numbers are used. Figures of soil series are not
in alphabetic order and have no meaning as such.
Critical depths mentioned in the key may differ among the
various criteria:'
- soil depth J two Criteria! depth are üied - 50 and 100 cm.
- texture : for sand % - within 1.0 m depth
for silt % - between 25 and 100 cm depth
for clay % - the control section, assumed to be
between 10 and 60 cm for all profiles
': differences between the coarse fragments are explained in
the following key.

- 30 -
- coarse fragment content the 60 and 120 cm depth criteria
are used, following a similar distinction as made
by Odell et al. (197^, Table 2, p. 16/17).
The studies involved in the determination of the framework
are mentioned below:
- Liberia : -Fanfant 1972 (Liberia in general, but especially
Upper Lofa)
-Geiger, 197I+ (Suakoko)
• -Van Mourik, 1979 (western Liberia)
-Soils Division, Suakoko (unpublished material
concerning Liberia in general)
-MRU-LRSP/Soils Division, 1980 (South-Western
Liberia)
- Sierra Leone: -Sivarajasingham, 1968 (North-east Sierra Leone)
-Stark, 1968 (North-eastern Sierra Leone)
-Dijkerman and Westerveid, I969 (Torma Bum)
-Van Vuure and Miedema, 1973 (Makeni)
-Odell et al, 197^ (Sierra Leone in general)
-Land Resources Survey project (FAO/UNDP-MAF)
1980 (Turner's Peninsula, Tigbema).
Key to the soil series
1.-Coastal Plain soils: sandy or very sandy in texture; these
soils contain 90% or more sand in all horizons within 1.0 m
depth. Go to 2.
-Basement Complex soils:
- Upland, which comprises the excessively, well and mode
rately well drained soils on topographically higher places
in the landscape ;. Go to k.
- Lower or foot-slope, terracej i'loodpläin oi* swampy those
are the topographically lower places in the landscape.
This subdivision comprises all imperfectly and poorlier
drained soils and also the well and moderately well
drained soils, providing their content of non-weatherable
coarse fragments, excluding in-situ hardened, but brittle
plinthite nodules, is less than 30$ (by volume) within
60 cm depth Go to 21

- 31 -
Phyaiographically three major divisions are made. Firstly
the soils on the Coastal Plain are separated from those
on the Basement Complex.- There are several differences
between these two divisions. The color of the soils on
summits is often redder on the Basement Complex than on
the Coastal Plain, where the summit soils are /brownish
or even whitish. Secondly, Basement Complex soils are
often gravelly,;whereas gravels are not found in the
Coastal Plain soils. Thirdly, Basement Complex soils are
more clayey than Coastal Plain soils.
The Coastal Plain is geomorphologically different in the
absence, of high hill ridges; it is a nearly flat area
with slopes of less than 5%. The Coastal Plain is formed
from materials deposited from the sea against the al
ready existing Basement Complex. The Basement Complex
has a more undulating topography, consisting of hills,
ridges and valleys. Rock can be observed in the Basement
Complex area at several summits (esp. in road cuts). The
vegetation on the Basement Complex is often more luxuriant
and comprises more and higher forest.
The transition zone between the Coastal Plain and the
Basement Complex may show both divisions in a mixed way.
Hills may belong to the Basement Complex, whereas the in
termediate surroundings may consist of Coastal Plain ma
terial. Another type, the lacustrine plain, has been dis
tinguished on photo-interpretation maps; so far the lacu
strine plain has not been separated as a single division.
Physiographically the lacustrine plain has many similari
ties with the Coastal Plain and more studies are needed
before a clear distinction can be made on basis of occur
rence of special soil series.
The Basement Complex is divided into two sub-divisions:
uplands on one hand and lower or foot-slopes, terraces,
floodplains and swamps on the other hand. The boundary
between those two subdivisions may be unclear; the defi
nition of the maximal occurrence of non-weathorablc coarse
is meant to indicate the boundary. -Non-weatherable coarse
fragments are ironstone (laterite) or quartz gravel with
a diameter of more than 2 mm, not including gneiss
or granite particles. Plinthite nodules

- 32 -
(hardened, non-transported subsoil mottles) have been ex
cluded from the non-weathereable coarse fragments as such
nodules are especially formed at the boundary zone between
the two sub-divisions.The distinction between both sub-divisions
can only be made by way of the content of transported mate
rials like quartz and ironstone gravel (N.B. this criteria
is limited to moderately well or better drained soils; im
perfectly or poorlier drained soils automatically fall in
the topographically lower position group).
2. Well drained and eventually moderately well drained soils.
Go to 3.
Poorly drained soils and eventually very poorly and imperfectly
drained soils Series N.
The Coastal Plain soils are distinguished in the first
place on soil drainage. Only two drainage classes are
used, as it is assumed that intermediate classes occur rarely.
3. Spodie horizon is non-existing or poorly developed ....Series K1.
Spodic horizon is strongly developed ; Series K2.
The well drained soils are tentatively divided on basis
of the occurrence of a spodic horizon. A spodic horizon
is an horizon with humus and iron illuviation, observable
by a brittle, dark colored B-horizon. An extensive des
cription can be found in Soil Taxonomy, p.29.
U. Soil depth is less than 100 cm Go to 5.
Soil depth is more than 100 cm Go to 6.
Firstly these soils are divided on basis of the soil
depth. The soil depth is defined as the depth of the
soil profile, including the C-horizon if present, over
bedrock or strongly contrasting non-conforming rock ma
terial (Soil Survey Manual p. 297). Separation by soil
depth should be significant to land use and management;
therefore the depth of a soil is determined by root
restricting material, which means a kind of material
which is not penetratable by roots. A harder layer in
the soil profile should be studied carefully in order
to decide whether a soil is shallow or not. (N.B. the
depth of the pit has no meaning to soil depth whatsoever;
a shallow pit does not implicit a shallow soil depth).
Within the MRU-area shallow soils are only found on

- 33 -
summits and on steep slopes (mostly with a lithic con
tact or, in case of a lateritic sheet at shallow depth ,
a petroferric contact) and on Tower slopes, where a hard
pan severely restricting root growth has been formed by
strong iron accumulation. A petroferric contact in im
perfectly or poorlier drained soils will be separated
at phase level in the sub-division of the topographical
ly lower situated soils (see under 1. and 21.).
Lithic/paralithic contact is defined as follows: bedrock
within 1.0 m depth; lithic contact in case of continuous
hard material, except for some cracks. Paralithic contact
in case of hard, but broken material with clear cracks.
However, the distinction between lithic and paralithic
is not separated at soil series level. Eventually at
phase level such a distinction can be made; so far such
a distinction has not been made yet. For more information
see Soil Taxonomy, p. U8-1+9-
Petroferric contact is defined as a sheet or large boul
ders of indurated ironstone (laterite) occurring within
. 1.0 m depth. See Soil Taxonomy, p. 50 for the official
description.
5. Soil depth is less than 50 cm ( very shallow soils)
Go to 7. •
Soil depth is between 50 and 100 cm (shallow soils) ......
Go to 8.
The soils with a soil depth of less than 100 cm are di
vided into very shallow and shallow soils, as shown above.
6* Soils on consolidated or partly consolidated (metä-) sedi^
mentary sandstone Series Q.
Other soils Go to 9.
The soils, deeper than 100 cm, are firstly separated on
basis of the type of parent rock. The parent rock may be
the parent material from which the soil has formed; how
ever, it may also be the rock found in profile pits without
a clear indication of the soil forming relation between the
rock and the soil. This distinction is especially made to
exclude soils containing sandstones from other soils on
the Basement Complex. Soils on sandstone were found lo
cally near Dia in south-western Liberia at the transition
of the Coastal Plain and the Basement Complex where younger,

- 3k -
mostly tertiairy rock types occur close to the surface.
7. Lithic or paralithic contact Go to 10.
Petroferric contact Series X3.
This distinction is clear. Lithic and paralithic contact
are not separated for the very shallow soils as explained
before.
8. Lithic or paralithic contact Go to 11.
Petroferric contact Series U.
The. same distinction as under 7• is made for the shallow
soils.
9. The content of coarse ironstone and/or quartz fragments within
60 cm depth is less than 30$ by volume Go to 12.
The content of coarse ironstone and/or quartz fragments within
60 cm depth is more than 30$ by volume or when in doubt .....
Go to 13.
Most upland soils on Basement Complex will pass this
section in the framework. These soils are distinguished
in the first place on the content of coarse ironstone
and/or quartz fragments, having ä diameter of more than
2 mm, within a depth of 60 cm. Ironstone is defined as
very hard iron-containing gravel or stones without any
rock structure, which are either angular, sub-rounded or
rounded, either black coated or reddish/yellowish. The
content of such fragments is estimated in the field by
determining the volume percentage of the coarse, frag
ments in the soil. The estimation is very subjective
and should be done by experienced surveyors on a consi
stent basis. The 30$ criterium used here means that
- roughly one third of a horizon above 60 cm depth con
sists of non-weathereable coarse fragments (N.B. not in
cluding hard or soft rock pieces).
10. Red soils having ä color-hue in the B-horizon of 2.5 YR or
redder or soils in which the presence of basic rocks (or
rather a predominance of basic rock material) is clear or
both characteristics Series X1.
Other soils Series X2.
The very shallow soils with a lithic or paralithic con
tact are separated on the soil color or the kind of rock
or both. Most soils are formed on acid types of rock
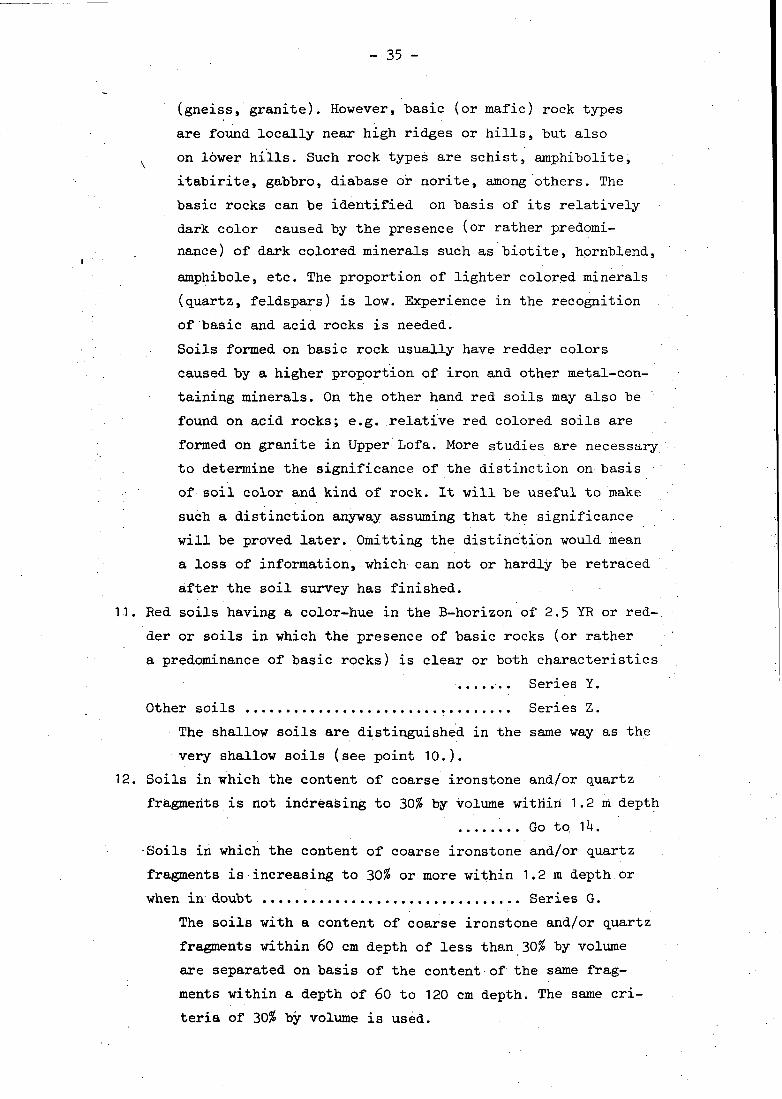
- 35 -
(gneiss, granite). However, "basic (or mafic) rock types
are found locally near high ridges or hills, but also
on lower hills. Such rock types are schist, amphibolite,
itabirite, gabbro, diabase or norite, among others. The
basic rocks can be identified on basis of its relatively
dark color caused by the presence (or rather predomi
nance) of dark colored minerals such as biotite, hprnblend,
amphibole, etc. The proportion of lighter colored minerals
(quartz, feldspars) is low. Experience in the recognition
of basic and acid rocks is needed.
Soils formed on basic rock usually have redder colors
caused by a higher proportion of iron and other metal-con
taining minerals. On the other hand red soils may also be
found on acid rocks; e.g. relative red colored soils are
formed on granite in Upper Lofa. More studies are necessary
to determine the significance of the distinction on basis
of soil color and kind of rock. It will be useful to make
such a distinction anyway assuming that the significance
will be proved later. Omitting the distinction would mean
a loss of information, which can not or hardly be retraced
after the soil survey has finished.
11. Red soils having a color-hue in the B-horizon of 2.5 YR or red
der or soils in which the presence of basic rocks (or rather
a predominance of basic rocks) is clear or both characteristics
Series Y.
Other soils Series Z.
The shallow soils are distinguished in the same way as the
very shallow soils (see point 10.).
12. Soils in which the content of coarse ironstone and/or quartz
fragments is not increasing to 30% by volume withiri 1.2 m depth
Go to. 1 IK
•Soils in which the content of coarse ironstone and/or quartz
fragments is increasing to 30% or more within 1.2 m depth or
when in doubt Series G.
The soils with a content of coarse ironstone and/or quartz
fragments within 60 cm depth of less than 30% by volume
are separated on basis of the content of the same frag
ments within a depth of 60 to 120 cm depth. The same cri
teria of 30% by volume is used.

- 36 -
13. Soils containing more than 10$ by volume of coarse weatherable
fragments within 1.2 m depth Go to 17-
Other soils . ... Go to 18.
The gravelly soils with more than 30$ by volume coarse
ironstone and/or quartz fragments within 60 cm depth
are divided on basis of the content óf coarse weatherable
fragments within 1.2 m depth. Coarse weatherable fragments
are particles with a diameter of more than 2 mm, which
are either fresh (non-weathered) or partially weathered.
Fresh fragments are fragments showing little or no signs
of weathering; there is no crumbling of mineral grains
when scratched with a finger nail. Fresh fragments are
weatherable when consisting of rock, like gneiss or gra
nite, but not in case of ironstone or quartz. Partially
weathered fragments are fragments in which the weathering
process is indicated by discolorization and loss of crystal
form in the outer parts of the fragments, but in which the
centre remains relatively fresh and the fragments have
lost little of their original strength; they cannot
entirely broken. N.B. Partially weathered coarse frag
ments should not have a hard iron-coating on their outer
side. All softer fragments are considered strongly weathered
or decomposed.
The meaning of the distinction between on one side fresh
or partially weathered and on the other side strongly
weathered or decomposed fragMehts is the release of mine
rals nutrients to the plants. It is assumed, and certainly
not proved yet, that the less weathered materials do re
lease some nutrients. This characteristic may have signifi
cance for annual crops, but especially for perennial crops.
A 10$ by volume is taken as criterium, being a significant
and observable amount of weatherable coarse fragments. The
occurrence of only few gneiss gravel or stones is consi
dered insufficient for a change at soil series level.
11+. Soils having a 2.5 YR hue or redder in the B-horizon ..Go to 15-
Other soils Go to 16.
The gravelfree or slightly gravelly soils on upland po
sitions are separated in the first place on the color of
the B-horizon. This is done to separate a special soil

- 37 -
series which is rare in Liberia up to now, but quite
extensive in north-eastern Sierra Leone (where it is
given the Segbwema-series name). In Liberia van Mourik
found one such profile, which was named Comasadu-series;
Such soils are found at relatively high elevations. They
hardly contain gravel but some stones are common. The
main characteristic of these soils is their uniform red
color. Information reveals that, the color of the gravel-
free Bß-horizon is the best critical depth, although is
not specified as such in the framework.
15. Well drained or more excessively drained soils ... Series W1.,
Moderately well drained soils Series W2.
These red soils are divided upon the soil drainage class.
Moderately well drained soils can be found in local depres
sions; the color requirement for these soils can be omitted.
16. Soils having more than 10$ by volume of coarse rocky frag
ments within 60 cm depth Go to 19 •
Other soils . Go to 20.
The gravelfree or slightly gravelly soils on upland po
sitions which do not have a generally uniform red (2.5
YR or redder) color are distinguished by the content of
rocky fragments within 60 cm depth. Coarse rocky fragments
are fragments with a diameter of more than 2 mm in which a rock
structure is visible; at least half of each fragment
should be hard in such a way that it cannot be broken
by hand. (Note that here a depth criterium of 60 cm is
used). The description of rocky fragments also involves
those fragments which have a rock structure
inside, but which are coated. Such fragments were found
in south-western Liberia; a separation of soils con
taining such fragments could not be made at series level.
Considering such fragments as coarse non-weatherable
fragments, together with ironstone and quartz, seems
less appropriate than the inclusion as rocky, fragments.
The term rocky fragments is meant as a combination of
uncoated and coated weatherable fragments.
17. Soils in which the content of coarse ironstone and/or quartz
fragments is 30$ by volume or more over more than 60 cm, verti
cally in the profile Series I.
Other soils Series H.

- 38 -
The gravelly soils with a considerable amount of
weatherable coarse fragments are separated on basis
of the thickness of the gravelly layer. The gravelly
layer is defined as the part of the soil which con
tains more than 30$ by volume coarse ironstone and/
or quartz fragments. The significance of this characte
ristic is assumed to be the root restricting capacity
of such a layer and the reduction in "available water
holding .capacity" of the soil. The latter is based on
the assumption that gravels do not. contribute to the
total water holding capacity. N.B. Studies in the
Gambia revealed a higher difference in moisture
content between the dry season and the rainy season
extremes in case of gravelly subsoils. According to
this author, water Keld by nori-weatherable coarse
fragments, such as quartz and ironstone, being massive
gravel, is neglectible. The interstitial water which
is readily lost, however, may cause the higher diffe
rence in moisture content. In this respect the diffe-
rence in porosity, caused by the presence of many gra
vels is important; a higher porosity may lead to a
higher water holding capacity.
18. Soils in which the content of coarse ironstone and/or quartz
fragments is 30$ by volume or more over more than 60 cm ver
tically in the profile Series B.
Other soils Series D.
The gravelly soils without a considerable amount of
weatherable coarse fragments are separated in the same
way as pointed out under 17.
19. Well drained or more excessively drained soils ... Series V1.
Moderately weil dMihed" soils . i» J ;.. ä........ s... ëeriës V2 5
The gravelfree or slightly gravelly soils (gravel con
sisting of ironstone and/or quartz) with a considei-able
amount of coarse rocky fragments (and which often con
tains stones i.e. fragments with a diameter, of more than
7.5 cm) within 60 cm depth are separated on basis of soil
drainage. Moderately well drained soils of this type can
be found in depressions on upland positions.
20. Well drained or more excessively drained soils .... Series T1.
Moderately well drained soils Series T2.

- 39 -
A similar separation is made here as was done under 19.
21. Well, moderately well or imperfectly drained soils: none or
only periodically waterlogged;groundwater level remains at
1.0 m depth or deeper in the dry season ... Go to 22.
Poorly, very poorly drained or wetter soils: waterlogging is
common in the rainy season; groundwater level is within 1.0
m depth (almost) throughout the year Go to 23.
The soils on the topographically lower positions in the
landscape, situated either on the lower slope, footslope,
terrace, floodplain or in swamps are firstly divided upon
soil drainage class. Such a division is difficult to
apply as a clear difference between drainage classes cannot
easily be identified from profile characteristics. Infor
mation from nearby living inhabitants is therefore useful.
The soil drainage class should reflect the fluctuation of
the groundwater table. Occurrence of mottles in the sub
soil and in the surface soil means saturation by water,
but the duration of saturation or degree of saturation,
especially in the tropical soils of the MRU-area, cannot
or hardly be determined from soil characteristics. In this
respect a permanently saturated (reduced) horizon with a
uniform gray or bluish<-green color is the only exception
where the soil characteristic may be translated to ground
water conditions at a certain depth in the soil.
The first division separated well, moderately well and
imperfectly drained soils (found on lower slopes, foot-
slopes, terraces and the transition from lower or foot-
slope to floodplain) from poorly, very poorly drained
and wetter soils (found in the floodplains, in local de
pressions and in swamps).
22. Soils having less than 20$ silt in any horizon within 1.0 m
depth i. . . i Go to 2k.
Other soils Go to 25. :
The well, moderately well and imperfectly drained soils
on topographically lower places in the landscape are se
parated on basis of the silt content within 1.0 m depth.
This criterium was chosen to distinguish among terraces
and other soils. Terrace soils and to some extent levee
and related soils along wider rivers have a clear indi-

-lo
cation of higher silt contents. The significance of this
criterium is found in a higher water holding capacity, a
relatively good soil structure, the absence of gravels
and soil fertility characteristics. The latter factor
soil fertility is rather complex; a higher silt content
might be related to a higher exchange capacity, but a
higher silt content may also be considered to be con
nected to a more weathered kind of soil material from
which no or hardly any release of nutrients can be expected.
23. Soils having more than 30$ silt and more than 35$ clay in
all horizons within 1.0 m depth Go to 26.
Soils having either less than 30$ silt or less than 35$ clay
in all horizons within 1.0 m depth Go to 27.
The poorly drained, very poorly drained or wetter soils
are divided on basis of both the silt and the clay con
tent. Soils with high silt as well as high clay contents
are only found in tidal plains or in floodplains along
wide rivers. Most poorly or poorlier drained soils, have a
silt content of less than 30$ and a clay content of less
than 35$; soils with a clay content of more than 35$,
but without the high silt content will be separated at
series level in a next stage.
2h. Well and moderately well drained soils: waterlogging absent
or only during less than 15 days in one year; each waterlogging
period lasts for one day or less; outside peak rain periods
the groundwater level remains at 1.0 m depth or deeper; none
or only few (and near irrigated plots common) distinct or pro
minent gley (reddish/yellowish/brownish) mottles within 1.0
m depth Series L.
Imperfectly drained soils: waterlogging only in peak rain
periods; the groundwater level is within 1.0 m depth during
at least the rainy season and can often be found within 2.0
m depth in the dry season; common or many distinct or promi
nent gley mottles are found within 1.0 m depth .. Series S.
The soils with low silt contents and with a relatively
good (good to imperfect) soil drainage are separated in
a way by which the imperfectly drained soils are taken
apart. In order to define the drainage classes, xmramo-
ters on basis of waterlogging, actual groundwater levels

- Ui -
and some indications on basis of distinct or prominent
mottles were used. The latter may be doubtful, as ex
plained under 21. Still, the description of gley mottling
may help in those cases where a distinction on basis of
waterlogging or groundwater level is not possible.
25. Soils with more than 30% silt in all horizons within 1.0 m
depth Go to 28.
Soils with less than 30% silt in any horizon within 1.0m
depth Series A.
The well, moderately well and imperfectly drained on
topographically lower places in the landscape, containing
more than 20% silt in any horizon within 1.0 m depth are
divided into two groups depending again on the silt con
tent within 1.0 m depth. The soils with more than 30%
silt throughout the first 1.0m are levee or related
soils.
26. Soils with acid sulphate soil conditions, either in reduced
or in oxidized circumstances, either clearly developed or
undeveloped Series 0.
Other soils Series J.
The poorly or poorlier drained soils with a relatively
high silt content within 1.0 m. depth are distinguished
by the occurrence of acid sulphate soil conditions. Such
conditions are not easily recognizable. They occur in
marine sediments which contain a considerable amount of
sulphur or sulphide* Further recognition depends on the
aeration status of these generally wet soils. Relatively
dry soils of this category, after natural or artificial
drainage, may show faint yellowish mottles in certain
parts of the soil. In very clear cases gypsum crystals
are found above the mottled zone. Normally, however, acid
sulphate soils will be found in wet places obscuring such
characteristics. In case of suspecting an acid sulphate
soils, a sample should be taken, which is repeatedly dried
and wetted; pH-H20-values lower than 3.5 after about two
weeks, give rise to suspection of acid sulphate soils.
The location of acid sulphate soils is usually along or
near the coast. In the interior MRU-area such soils are
not likely to occur.

- U2 -
27- Soils in which the major part of the control section
(roughly 10 to 60 cm from the soil surface) has a sand,
loamy sand or sandy loam texture with less than 20% clay
Series M1.
Soils in which the major part of the control section
(roughly 10 to 60 cm from the soil surface) has a sandy
clay loam, sandy clay or clay texture with more than 20%
clay and eventually interlayered with thin sandier layers
Series M2.
The common floodplain soils with low silt contents are
divided in two series on basis on the soil texture in
the control section. A separation into three parts did
not function well; the current separation works better
in surveys and in further interpretations.
28. Well or moderately well drained soils: waterlogging absent
or only during less than 15 days in one year; each water
logging period lasts for one day or less; outside peak rain
periods the groundwater level remains at 1.0 m depth or
deeper; none or only few (and near irrigated plats common)
distinct or prominent gley (reddish/yellowish/brownish)
mottles within 1.0m depth Series P.
Imperfectly drained soils: waterlogging only in peak rain
periods; the groundwater level is within 1.0 m depth during
at least the rainy season and can often be found within 2.0
m depth in the dry season; common or many distinct or promi
nent gley mottles are found within 1.0 m depth .. Series R.
These silty soils with a good, moderately good or imper
fect drainage are divided in a similar way as under 2k.
The following two tables comprise a summarized key (table
2) for a quick identification of soil series and a table in
which the soil series of the framework are correlated to existing
soil series names derived from the studies as mentioned earlier
in this paragraph (Table 3).

- U3 -
Table 2 Summarized key to the soil series of the framework for soil classification in the MRU-area.
rioil series Coastal Plain soils, containing more than 90% sand in all-horizons within 1.0m depth:
- Well drained soils: 1. Without a spodic horizon K1. 2. With a spodic horizon K2.
- Poorly drained N
Basement Complex soils.
- Excessively, somewhat excessively, well and moderately well drained upland soils on topographically higher positions in the landscape:
- Soil depth is less than 100 cm: 1. Soil depth is less than 50 cm:
1.1 Lithic or paralithic contact: 1.1.1 Red/basic X1 . 1.1.2 ïellowiah/acid X2.
1.2 Petroferric contact X3. 2. Soil depth is between 50 and 100 cm:
2.1 Lithic or paralithic contact: 2.1.1 Red/basic Y 2.1.2 Yellowish/acid Z
2.2 Petroferric contact U
- Soil depth is more than 100 cm: 1. Parent rock is (meta-) sedimentary sandstone Q 2. Parent rock is igneous or metamorphic Basement Complex rock:
2.1 Less than 30% (by Vol.) coarse ironstone and/or quartz fragments within 60 cm depth: 2.1.1 Content of coarse ironstone and/or quartz fragments is not increasing to 30%
(by Vol.) or more within 1.2 m depth: 2.1.1.1 Color of the B-horizon has a hue of 2.5 YR or redder:
2.1.1.1.1 Well or more excessively drained W1. 2.1.1.1.2 Moderately well drained; color requirement omitted W2.
2.1.1.2 Color of the B-horizon has a hue of 5 YR or yellower: 2.1.1.2.1 More than 10% (by Vol.) coarse rocky fragments within 60 cm depth:
2.1.1.2.1.1 Well or more excessively drained VI. 2.1.1.2.1.2 Moderately well drained V2.
2.1.1.2.1 Less than 10% (by Vol.) coarse rocky fragments within 60 cm depth: 2.1.1.2.1.1 Well or more excessively drained Tl. 2.1.1.2.1.2 Moderately well drained T2.
2.1.2 Content of coarse ironstone and/or quartz fragments is increasing to 30% (by Vol.) or more within 1.2m depth G.
2.2 More than 30% (by Vol.) coarse ironstone and/or quartz fragments within 60 cm depth: 2.2.1 More than 10% (by Vol.) coarse weatherable fragments within 1.2 m depth:
2.2.1.1 Gravelly layer with more than 30% (by Vol.) coarse ironstone and/or quartz fragments extends vertically over more than 6o cm I.
2.2.1.2 Gravelly layer with more than 30% (by Vol.) coarse ironstone and/or quartz fragments extends vertically over less than 60 cm H.
2.2.2 Less than 10% (by Vol.) coarse weatherable fragments within 1.2 m depth: 2.2.2.1 Gravelly layer with more than 30% (by Vol.) coarse ironstone and/or
quartz fragments extends vertically over more than 6o cm B. 2.2.2.2 Gravelly layer with more than 30% (by Vol.) coarse ironstone and/or
quartz fragments extends vertically over less than 60 cm D.
- Imperfectly, poorly, very poorly and poorlier drained soils, and those well and moderately well drained soils which have a content of coarse ironstone and/or quartz fragments of less than 30% (by Vol.) within 60 cm depth, on topographically lower positions in the landscape, such as lower slopes, footslopes, terraces, floodplains or swamps:
- Well, moderately well or imperfectly drained soils: 1. Less than 20% silt in any horizon within 1.0 m depth:
1.1 Well or moderately well drained L. 1.2 Imperfectly drained S.
2. More than 20% silt in any horizon within 1.0 m depth: 2.1 More than 30% silt in all horizons within 1.0 m depth:
2.1.1 Well or moderately well drained P. 2.1. t\ Imperfectly drained .-. R.
2.2 Less than 30% silt in any horizon within 1.0 m depth A.
- Poorly or poorlier drained soils: 1. More than 30% silt and more than 35% clay in all horizons within 1.0 m depth:
1.1 Acid sulphate soil 0. 1.2 No acid sulphate soil J.
2. Soil does not contain both more than 30% silt and more than 35% clay in all horizons within 1.0 m depth: 2.1 The major part of the control section (roughly 10 to 60 cm depth) has a sandy, loamy sand
or sandy loam tecture with less than 20% clay Ml. 2.2 The major part of the control section (roughly 10 to 60 cm depth) has a sandy clay loam,
sandy clay or clayey texture with more than 20% clay -..•»'.'. M2.

- UU -
Table 3 Correlation between the soil series of the framework for soil classification in the MRU-arc-a
and the soil series (or soil families or soil associations) of other studies in Liberia and
Sierra Leone
Soil series framework
Liberia Sierra Leone
Fanfant1) Soils Div.3^ Van Mourik^) Geiger^'
North-east^' Makeni-area") Torma Bum?' Rokupr°)
K1.
K2.
N.
X1.
X2.
X3.
Y.
Z.
U.
Q.
W1.
W2.
V1.
V2.
T1.
T2.
G
I.
H.
B.
D.
L.
Bomi
Fali
Dalia Latia
Sielo
Sielo
Gboma
Comasadu
Vagbe
Foya(d)
Foya(sh)
Kon jo
Foya(sh)
Kon jo
Weledu
Makona
Makona
Gheh
Gbedin
Gewi
Sosomalahun Kolahun Weledu Suakoko Tijala
Wegah
Kaveh
Sinyea Gbaokele
Kpatawee Kollieta Sumakata
Gbangai Kitoma
Balama Gendaja Gokai
A. Makona
0.
J. Kpain Gbelle
M1. Dalia Cuttingt Phebe
M2. Ngissankonja Ballam Grayzohn
Note: 1' Fanfant, 1972 2)
3)
(Fanima)
Vaahun
Fanima
Segbvema
Mandu
Hgelehun Yumbunia
Baoma Tisso (Panderu)
(Boama)
Manowa Waima Giema
(Fanima)
(Panderu)
Pendembu
Moa
Keya
Kparva Dow jo Blama
Sahama
Gbaman i
Hahun Mani
Mabanta
(Timbo)
Mabassia(d+sh)
(Timbo?)
Makeni Rosinth Mabassia (v.sh)
Bosor Tubum Masheka Masuba
Makundu
Mankane Panlap
Bali
Talia
Taso Koyema
Sangama Torma Bum (Sewa)
Ubehan Senehun Sewa
Naba Mamu (Sewa)
Rokupr
Van Mourik, 1979
Soils Division, 1977b
U) ' Soils Division, 1977a
Sivarajasingham, 1968 and Stark, 1968
' Van Vuure and Miedema, 1973
7)
8)
Dijkerman and Wester-veld, 1969
Odell et al., 197U

- 1*5 -
3.1+ Examples of existing soil maps at various scales in the
MRU-area
3.1*. 1 Reconnaissance-exploratory scale
Exploratory.
Fig. 6 shows a map of the whole MRU-area. It is a combina
tion of two maps, made by van Mourik (1979) for western Liberia
and by Birchell et al. (1979) for Sierra Leone. These maps are
based on photo-interpretation with addition of field checks. The
map units consist of land systems (according to the CSIRO, Austra
lia - approach). Some original map units have been generalized.
The value of this map is to be found at the exploratory scale
level. Hill ranges and hilly areas are separated from the undu
lating to rolling areas. The land systems of the Coastal Plain
are clearly distinct from those of the Basement Complex.
A clear relation between the occurrence of soils within
each land system and the differences in soils among land systems
can hardly be indicated. Birchell et al. give a summary of broad
soil associations appearing in groups of land systems (Table h).
These soil associations have been classified according to the
three most important international soil classification systems
as well as to soil series names of local surveys (not presented
here). Van Mourik went into more detail; he described the soils
in each land system. An estimation of the occurrence of soil
families (partly derived from studies by Fanfant and with addition
of newly found families or sometimes series) within each of the
land systems of western Liberia was given and the estimation
was carried out at the land facet level. There are usually three
to six facets in each land system. Each facet has its own distri
bution of soil families/series. Although quite useful, the same
families or series occur in many of the 16 land systems. With a
different proportion of land facets, the occurrence of soils is
indicated accordingly. It happens that the description of soils
at the exploratory level remains poor, while actual mapping of
soils at such a scale is completely impossible, even at the
original larger published scale of 1:500 000.

F i g . 6. Combinations of land systems
in the MRU-area
tand rtitlaa Lwd aub-ragloa H»rra L»on« i lbarla
Coaatal
»lala
2atariar
plalna and
plataaax
m
Baack rldga
Alluvial plalna and lacuatrlna t trracta
Toro.rC» Savat <ll Shtrbrod) "a*el»a (2) BaatfcaC}) Saal (J)
Toraa Bus(S) . '» . - too (7) Zu*al/7aadoa Ï»)
• Vary gantljr U a a a r d j ) and erntljr l iana (13) undulating plain» and platanus
f ^ B o l t l a a d »
Bo <ïai Kahuadu(2l)
Kla ( ! ) Baadajra (6) Vaahun (7) Oendalahua (9)
Banaaraa(10)
3Undulating Vad»(?u) Foja (-0)
and r a i l i n g Kaidu<27) «aklauu (11) plaina Kall*tun(2S) Zortor i f )
»oUjaoa (12)
Tana and
pltdaoat-
plalna
• I l i a and aouatalaa
U Bollln« plalna and h l l l a
*ary gant l j 'undulating pla ins
Sandar«(32) Gala l i j )
Kulofa)ta(l.l) Sala»ala <H) Saiana(«2)
^9aale recka Xaaawa(«e) Vola*itt (1J)
« • • * • kauadary Slurra Wana/LtbarU
jUflJB) laka/lago«a
• •
t
<$}
A >«a
e>ot
<s>
CO
o>
<

- l»7 -
Table h Soil associations appearing within land systems in the
Sierra Leonean part of the MRU-area, east of the Sewa
river (derived from Birchell et al. 1979)
Soil association Land system(s)
Sands on coastal beach plains
Hydromorphic clays and gravelfree ferralitic soils on coastal floodplains
Gravelfree ferralitic soils on coastal terraces
Gravelly ferralitic and plinthic hydromorphic soils on inland terraces, depressions and floodplains
Very gravelly ferralitic soils over collu-vial gravel on western interior plains
Gravelly ferralitic soils over weathered granitic basement or colluvial gravel on southern interior and plateau plains
Stony and gravelly ferralitic soils over weathered granitic basement or colluvial gravel on low to moderate relief hills
Stony and gravelly ferralitic soils with shallow soils on moderate to high relief hills formed from predominantly acid rocks
Very gravelly ferralitic soils with shallow soils on moderate to high relief hills formed from basic and ultrabasic rocks
Shallow soils on plateau mountains and lateritic hills and terraces
Turner, Sherbro, Bonthe
Torma Bum
Newton
Senehun
Lunsar, Makundu
Blama, Bo, Wadu, Koidu, Kailahun
Sandaru
Kulufaga, Saiama
Kas ewe
Loma

- 1+8 -
In Table 5 the distribution of land facets within the main
map units of fig. 6 (but limited to the Basement Complex) is
given. Figures by van Mourik and Birchell have been combined
to one figure. Some difference in estimation of proportion of
land facets within similar land systems occurred, but were
straigthen out to get more generalized figures.
Rec onnai s s anc e.
Reconnaissance maps exist for two areas: north-eastern
Sierra Leone and south-western Liberia.
North-eastern Sierra Leone: The map made by Sivarajasingham
(1968) in eastern Sierra Leone was actually meant as semide-
tailed survey and was published originally at a scale of
1:50 000. His map has been generalized and reduced to 1:7*+0 000;
the result is shown in fig. 7. In the original publication the
map units are soil associations, or rather combination of soil
associations. In fig. 7 the combinations have been recombined
to give a reconnaissance picture of that part of Sierra Leone.
It shows five map units which have clear differences among
each other. Each map unit can easily be identified in the field
and very generalized land evaluation seems possible with these
units (see paragraph k.3). An example of the original reconnais
sance map of the northern half of fig. 7 is given in fig.8 at scale
1:390 000. In table 3 the correlation of the used soil associa
tions with other soil series of the MRU-area can be found.
South-western Liberia: SW-Liberia has been mapped at scale
1:268 000 by this author, using aerial photographs without
field checks (figs. 9-12). The legend of these maps (Table 6)
gives broad descriptions of map units in terms of geomorphology,
geology and vegetation.
It is comparable to the photo-interpretation results of
Birchell et al. and van Mourik. However, some more detail was
retained as the map was not reduced to 1:500 000, but only to
1:263 000. The more detail is also caused by the indication of
vegetation and cultivation details besides the other features.
In the legend a correlation with the land systems of van Mourik
and Birchell et al. is made. It appears that in many cases a
clear correlation could not be made and often a combination of
two land systems has been given.

Table 5 Distribution of land facets within the main land systems of the MRU-area
Interior plains and plateaux kmc
- Very gently and gently undulating plains and plateaux:
- hills - interfluves and dissected footslopes - interfluve footslopes and low colluvial terraces - valley swamps - river terraces and minor floodplains
895 17,213
1.U69 2,823
551
3.9 75.0 6.U 12.3 2.U
22,951 50.136 of the MRU-area
- Undulating and rolling plains:
- hills - interfluves, interfluve crests and dissected footslopes - interfluve footslopes and low colluvial terraces - valley swamps and minor floodplains
39^ 3,370
762
519
7.8 66.8 15.1 10.3
5,0^5 11.0% of the MRU-area
- Rolling plains and hills:
- hill slopes - irregular interfluves and footslopes - valley swamps - minor floodplains
4,525 3,81+3
395 215
50. U. U'2.8
k.h 2.1+
8,978 19.6^ of the MRU-area

- 'JO -
Fig. 7» Sketched reconnaissance soil association map of a part
of the Eastern Province, Sierra Leone (after Sivarajasingham,
Stark 1968). Scale 1:7^0,000 (scale of original map units
1:80,000).
Legend,
- Waima, Baoma - Manowa, Panderu - Moa, Kparva
- Pendembu, Waima
- Keya, Kparva
- Segbwemä, Vaahun
- Fanima, Ngelehun
- ^aahun, Rocky land - Rocky land

F i g . 8 . SOIL MAP OF KENEMA.DARU.PANGUMA.BUNUMBU AND PENDEMBU AREAS EASTERN PROVINCE OF SIERRA LEONE
Shown in more detail in fig

- 52 -
Table ó Legend of the photo-interpretation map of south-western Liberia
i'iap
unit Description Vegetation, cultivation Land system according to
Van Mourik Birchell et al
10 11
12 13
1U
15 16
17
COASTAL I'LAIN
sandbar, beach recent and older beach ridges coastal floodplain along wide river coastal plain with remnants of beach ridges and some swamps and lagoons
coastal plain with many depressions in an irregular pattern
LACUSTRINE PLAIN
lacustrine plain with many depressions in an irregular pattern lacustrine plain without depressions and sandbanks or islands in Lake Piso
INTERIOR
high floodplain or terrace near transition to coastal plain; also in association with map units k and 5; nearly level landscape river floodplain in gently undulating landscape terrace or floodplain along wide river probably sandstone area; slightly different from map unit 13 by way of a lighter gray tone pattern norite body near Robertsport gently undulating Basement Complex landscape with very low relief
gently undulating Basement Complex landscape with low relief or as isolated hills in map unit 13
undulating Basement Complex landscape undulating-rolling Basement Complex landscape or as isolated hills in map unit ^k (mainly acid rocks)
hill ranges (basic and/or iron-rich rocks)
hardly any vegetation, no cultivation shrubs + forest patches, no cultivation mangrove, no cultivation shrubs/forest, no cultivation x: thin strips of shrubs, remainder bare or very low (grass) vegetation shrubs and mangrove and patches of forest, no cultivation; x: hardly any or very low (grass) vegetation
shrubs + patches of forest, hardly any cultivation shrubs, hardly or no vegetation
savanna grass land + patches of forest hardly or no cultivation
shrubs/forest, some cultivation
shrubs/forest, some cultivation shrubs/forest, cultivated
11II111190% or more fo r e s t c u l t i v a t e d EZZZI60-90Ï f o r e s t ; i iiiiiiQO» or more f o r e s t 0 - o i l palm r - rubber r i - r i c e p r o j e c t x - ha rd ly any c u l t i v a t i o n or f o r e s t c u l t i v a t e d EZZ2360-9OJS f o r e s t 1 111111190% or more fo r e s t r - rubber x - hardly any cultivation visible,
but few patches of forest u - uncultivated, no forest, probably
will be planted with trees cultivated ZZZZ3 60-90% f o r e s t c - cultivated 1111111190% or more f o r e s t r - rubber LLLLLLUmore than 90* f o r e s t eZZZa 60-90? f o r e s t
Sowui Turner Sowui Turner Sowui Tasso Maveima Sherbro
Bomi
Fondoo
Fondoo
Kle/Bendaya
Kle/Bendaya Bendaya/Gola
Gola/Wologisi
Bonthe
Zuani Torma Bum
Kle Torma Bum
Kle Torma Bum Bomi Newton (?)
Wologisi Kasewe Kle Lunsar/Blama
Bo
Bo/Makundu Bo/Sandaru
Sandaru/Kas ewe
_ vegetation/cultivation boundary
» boundary between main map units (coastal plain, lacustrine plain, interior)
— — boundary between map units
-~ road
^j-S^wide river
,,——narrow river (gallery forest along river visible)
imwi railway
^ mine
£&• swamp
^0* lake
////////tentative interpretation, due to lack of photo coverage, based on 1:50 000 topographic maps
Note: Cultivated means the common bush fallow system with a pattern of cultivated plots mixed with forest; forest covers not more than 60? and usually less than OjS of the area.
General note: The lines on the map were not checked with a base map; therefore some displacement is likely to occur.

U I

Fig . 10. Photo-Interpretation map of south-western Liberia
NE-SHEET
Approulmate scale 1:l6i,000
Pholo scale 1:70.000
Dale photograph : Oec '78- Jan 79
•Cr

- 55 -

F i g . 12.
Photo-Interpretation map ot south- western L i b e r i a
SE-SHEET
Approximate scale 1:Ji j .000
Photo scale 1:70.000
Date photographs
Dec 7 8 - Jan. 79
Legend : see t e i l
C7\

- 57 -
3. .2 Semi-detailed scale
The semi-dëtailed soil survey, intermediate between
reconnaissance and detailed," is the most suited to survey large
tracts of land. The goal of semi-detailed survey is to get
enough detail to be meaningful and to survey with a speed at which
systematic maps, can be produced.
Two large semi-detailed surveys have been made in the MRU-
area:
a) in north-eastern Sierra Leone by Sivarajasingham (1968) and
Stark (1968) .
b) in Upper Lof a, Liberia by Agrar- und Hydrotechnik (197M.
North-eastern Sierra Leone: The survey by Sivarajasingham and
Stark was already mentioned in the former paragraph under re
connaissance survey, where a detail of the map was shown. In
this paragraph another more detailed part, again as example,
is shown (fig. 13); its location is indicated in fig. 8. The
original scale was 1:50 000; fig. 13 shows the same map at
the reduced scale of 1:185 000. The legend of the semi-detailed
map does not differ very much from the other maps of the same
area, as the survey was meant to be semi-detailed in the first
place. The legend is based on geomorphological data, supplied
with the dominant soil association or series. However, the map
is not a real soil map, as the basis of the legend is of physio
graphic nature; the description of soils is only secondary.
Soils are supposed to be related to geomorphological features
of the landscape and this is indicated by the dominance of one soil
association or soil series. Although this may be true to some
extent, a consequent relation of this kind seems to be doubtful.
The dominant soil association or series is accompanied by several
inclusions, which together may amount as much as 50% of the map
unit. These inclusions vary among the mapped units of the same
kind. The map does not show the location of soils, but rather
the assumed predominance of specific soils within geomorpholo
gical (and physiographic) boundaries. Very likely, the map
resulted mainly from photo interpretation and the addition of
field work. The latter probably only dealt with the relation
between geomorphology/physiography and soils.
Upper Lofa, Liberia: Agrar- und Hydrotechnik, a consultancy
firm based in Essen, W.Germany, carried out semi-detailed sur-

- 58 -
KENEMA SIERRA LEONE SIIIXT 92
O 5 |t> Km
Fig. 13. Soil association map of an area near Kenema, Sierra Leone
(derived from Sivarajasingham 1968)
Legend. Dominant
Soils on very steep hills of great relief soil series
- Mainly shallow stony and often badly eroded soils: V Vaahun - Moderately deep less eroded soils:
Soils on hills of intermediate relief:
Soils on the low dissected Moa basin peneplain - On low flat topped hills:
- On low round topped hills:
Soils on old terraces:
Soils on recent river terraces and floodplains:
Soils on the inland valley swamps:
E Segbwema
A Waima
F Fanima
M Manowa
P Pendembu
T Moa
S Keya

- 59 -
veys in N.W.-Liberia (Upper Lofa). This survey was followed
in recent years by a survey in Nimba country, situated south
east of Upper Lofa in central-north Liberia (outside the MRU-
area). The semi-detailed map of Upper Lofa is shown in figs.
1U to 19. The original scale of these maps is 1:Uo 000; by re
duction the scale became 1:161 000.
The Upper Lofa map has a legend, which basis differs from
the one used by Sivarajasingham and Stark in Sierra Leone.
While in Sierra Leone a clear and more general geomorphologi-
cal/physiographic basis was used, Agrar- und Hydrotechnik used
the slope as primary base. Firstly the valley bottoms and ter
races were combined. The uplands are divided on basis of the
steepest slope. The dominant soil family (derived from Fänfant
1972) was indicated for each unit in an almost similar way
as the usage of dominant soil associations by Sivarajasing
ham and Stark. Inclusions for each map unit are indicated, but
the importance of each inclusion was not mentioned. In this
legend a relation between physiography and soils is again
presumed, although in comparison to the older semi-detailed
survey in Sierra Leone more distinction among soils within
each physiographic unit has been made. Such a distinction,
however, must have been mapped by photo-interpretation
in the first place,..followed by field checks. One
wonders whether such an effort can be done for a very large
tract of land, i.e. Upper Lofa. In our own experience, in
Cape Mount county, Liberia such a simplification in terms of
occurrence of soil families is an overestimation of the relation
between physiography and soils and also an underestimation of the
variability among soil families within a map unit at semi-
detailed scale.
For the comparison of the two described semi-detailed
surveys, both legends are given in Tables 7 and 8. The corre
lation of the legend units and the soil series of the frame
work is mentioned: the correlation is rather poor, as many
soils series of the framework seem to occur in each unit.
Nimba, Liberia: The more recent survey in Nimba (Agrar- und
Hydrotechnik 1978) at scale 1:50 000 shows a more usuable
legend. This is shown in table 9. No map is given of this
area, as it is situated outside the MRU-area. Its legend
is interesting in the scope of the development of a workable

GUINEA C -1
(
Fig. Ik. Reduced semi-detailed map of Upper Lofa, Liberia; north-western sheet,
(derived from Agrar- und Hydrotechnik, 197*0. Legend: see table 8.

- 61 -

; main road
Fig. 16. deduced semi-detailed map of Upper Lofa, Liberia; central-northern sheet,
(derived from Agrar- und Hydrotechnik, 197*0. Legend: see table 8.

OA (JO
Fig. 17. Reduced semi-detailed map of Upper Lofa, Liberia; central-southern sheet,
(derived from Agrar-und Hydrotechnik, 197^). Legend: see table 8.

- 6k -
< ii
CD
II II II
in II
4 " • • ^ \
.-;^. «0^ •> . - ; . 0* / c / .•-• 3 ^ \
• o \ w >
—- -.-- ?

Lofa, Liberia; south-eastern sheet, (derived
from Agrar- und Hydrotechnik, 197^). egend: see table 8.

- 66 -
legend for semi-detailed (soil-) survey. This is especially
so on the Basement Complex, for which the problem of an
usuable legend for soil survey is still not solved. In the
rest of this paragraph the problem will be faced and some
guidelines towards its solution are proposed.
Table 7 Legend of the semi-detailed survey of eastern Sierra
Leone (Sivarajasingham 1968; Stark 1968) and the com
parable soil series of the framework (dominant soil
families and series are underlined).
•o - I * Soil series framework Bare rock outcrops R Rocky land XI, X2
Soils on very steep hills of great relief 1. Mainly shallow stony and often badly eroded soils V Vaahun; Rocky land; Segbwema Y, Z; X1, X2; W1 2. Moderately deep less eroded soils E Segbwema; Vaahun; Rock outcrops W1_, W2; Y, Z; X1, X2
Soils on hills of intermediate relief A Waima; Baoma; Manowa B; G; B, I
Soils of the low dissected (Mao Basin) peneplain 1. On low flat topped hills F Fanima; Manowa; Ngelehun U, X3; B, I; T2 2. On low round topped hills M Manowa; Fanima B, I; U, D, H
Soils on old terraces P Pendembu S
Soils on recent river terraces and floodplains T Moa; Kparva; Keya A; M2; M1
Soils of the inland valley swamps S Keya; Kparva M1; M2
The legend of the Nimba survey starts with a division on
physiography. Three clear divisions are made:
- valley
- upland (including hot mappablé valleys)
- hills.
These units can easily be separated by photo-interpretation.
Each of these units is subdivided at the map unit level (see
Table 9). Sub-units are indicated together with the occurrence
of soil families per sub-unit and the slope. Again, soils were
not mapped, as the sub-units could not be mapped at the scale
of 1:50 000. Yet, the basis for semi-detailed soil survey is
sound, although not practable. The solution has to be found
by increasing the scale and thus, increasing of time, man-

- 61 -
pover and money, to arrive at a workable legend for syste
matic soil survey.
Table 8 Legend of the semi-detailed survey of Upper Lofa, Liberia
(Agrar- und Hydrotechnik, 197M and the comparable soil
series of the framework (dominant soil families and series
are underlined) •
Valley bottom Soil series framework A Makona; Ngissankonja; Dalia A, R, S; M2; M1
Almost flat and undulating dissected plateaux (steepest slope 2-%%) Be Comasadu W1 Bcc Comasadu; Foya+laterite gravel (footslope) W1_; B, I Bcf Comasadu; Foya+locally laterite gravel (footslope) W1_; B, I, G, T Bf Foya B, I Bk Kon.jo; Weledu; Foya U, D, H; T, G; B, I Bw Weledu; Foya; Konjo T, G; B; U, D, H Bu undifferentiated (Bf, Bk, Bw)
Rolling dissected plateaux and footslopes (steepest slope 8-16%) Cc complex of Weledu, Foya, Konjo, Sheloe (footslope) L, T, G; B, I; U, D,
H; X, Y, Z Cf Foya; Konjo (summit) B, I; U, D Ck Konjo; Weledu (hills) U, D, H; T, G Cw Weledu; Konjo (hills) T, G; U, D, H Cu undifferentiated (Cf, Ck, Cw)
Rounded low hills (Steepest slope 16-30$) Dc complex of Weledu, Konjo, Sheloe+undefined families T, G;, U, D; X, Y, Z Dk Konjo; Weledu U, D, H; T, G Dw Weledu; Konjo T, G; U, D, H
Steep high hills Sc complex of Comasadu, Weledu, Sheloe+undefined
families W1; T, G; X, Y* Z Ss Sheloe; Weledu; Comasadu X, Y, Z; T, G; W1 M denuded monadnocks X
The subdivision of sub-units and their associated soil families
offers such a workable legend..The slope is one of the main
factors to be mapped together with soil characteristics as
depth of gravel and soil depth and physiographic characte
ristics such as swamp, floodplain, footslope and summit. A
comparison of the extent of slope phases in Nimba with the
main units of the Upper Lofa study is not possible, as the
sub-division of the sub-units of Nimba is not available.

Table 9 Legend of the semi-detailed survey of Nimba county, Liberia, scale 1:50 UOü (Agru- und Hydrotechnik, t.n:
Map symbol Physiographic unit semi-
det. r e c o n
Mapping units Sub-units Slope
Soil families Area in ha
Percent of total
area
valley AI AI Swamp (• foot-slopes )
A2
Association of:
- swamps - footslopes
21 U20 <2
2- 8 Dalia, Ngissankonja Weledu
A2 Flood plain (+ footslopes)
Association of:
- flood plain - footslopes
3 750 <2
2- 8 Makona, Bomi Weledu
upland
including
not mappable
valleys
B1
B2
B3
Bh
B5
B6
Gentle concave footslopes
Not subdivided 2- 8 Weledu U 760
B1 Undulating upland with dense drainage pattern
Association of:
- slightly convex slopes with gravel at <25 cm
- transition slopes with gravel at 25-80 cm
- slightly concave slopes with gravel at >80 cm
- valleys
23 800
<8
<8
<8
Foya
Foya
Weledu
<2 Dalia, Ngissankonja
B2 Dissected peneplain
Association of:
- peneplain remnants with gravel at >8o cm
- peneplain remnants with gravel at <80 cm
=* slopes with gravel at <80 cm
- gentle concave slopes with gravel at >80 cm
- valleys
33 320
<5 Weledu, Comasadu
<5 Foya, Konjo
2- 8
r oya, itonjo
Weledu
<2 D a l i a , Ngissankonja
B3 Rolling upland with dense drainage pattern
Association of: 16 660
<8 8-16
- summits - slopes with gravel
at <80 cm - slopes with shallow 8-16
soils - concave slopes with <8
gravel at >8o cm - valleys <2
Weledu, Foya Foya, Konjo
Sheloe
Weledu
Dalia, Ngissankonja
Footslopes of high hills complex of:
- hilly and rolling footslopes
undulating footslopes
2 380
Convex upperslope, with >8 association of:
- shallow soils - gravel at >80 cm - gravel at <8o cm
concave lower part of <8 the slope with gravel at >80 cm
Sheloe, Weledu Foya, Konjo
Weledu
Rolling and hilly upland with dense drainage pattern
Association of:
- summits <8 - slopes with shallow 8-30
soils - slopes with gravel 8-30
at <8o cm - concave slopes with <8
gravel at <80 cm - valleys <2
7 1U0
Weledu, Foya Sheloe
Foya
Weledu
Dalia, Ngissankonja
20
28
Ht
hills CI
C2
Moderately steep to steep, strongly eroded slopes
Association of:
- slopes with shallow >13 soils
- slopes with gravel >13 at >80 cm
1 190
Sheloe, Foya
Weledu
Moderately steep to very steep, eroded slopes
Association of: I» 760
>13 - slopes with rock outcrop
- slopes with shallow >13
soils - slopes with gravel >13
Sheloe
Sheloe
Weledu

- 69 -
Another comparison of interest is the reconnaissance
and semi-detailed legends of Nimba. These names apply to
the scales 1:50 000 and 1:100 000 (AHT uses exploratory
and reconnaissance resp.). Out of 720 900 ha (reconnais
sance) 119 000 ha were surveyed at semi-detailed scale.
Although a scale of 1:50 000 is usually considered to be
semi-detailed, it is remarkable that the orginal authors
called this scale reconnaissance; it shows exactly the
problem of soil survey at the Basement Complex. Apart from
the names of surveys and their range in scale, the extent
of the map units in both surveys is of interest. By combi
ning the more detailed map units of the 1:50 000 survey, a
comparison between the two surveys can be made. The result
is shown in Table 10. The difference is remarkable. Unit
A1 (swamp (+ footslopes)) is much higher at semi-detailed
level. Unit B3 and Bk on the other hand are 6 and 10$ (ab
solute) lower at the semi-detailed level. The same applies,
although to a lesser extent, to category C. The more detail
of the semi-detailed 1:50 000 survey is apparently indicated
by an enormous increase in what is called swamps. In other
words, an increase in scale reveals a lot more valleys of
the Basement Complex. Remarkable on the other hand is the
almost constant proportion of unit A2, called floodplains
(N.B. in this author's opinion this unit should be named
terraces). Note: The term floodplain should be used in
Unit A1 to describe the swampy or at least poorly drained
soils of the topographically"lowest places in the landscape
on both sides of creeks, streams or small rivers, which are
flooded regularly during the rain periods or which have re
latively high groundwater levels during most óf the year.
Terraces, on the other hand, was the name given to areas
adjoining streams, but which are elevated about 0.5-1.0 m
(or even more) above the average annual level of the stream.
Flooding only occurs occasionally after heavy rain periods;
the flooding period is often less than one day. The term
floodplain and terrace are described and used in the frame
work (cf. paragraph 3.3). The reader is reminded that the
Nimba legend uses swamp and floodplain respectively in stead
of floodplain and terrace.

- 70 -
Table,10 Comparison of the extent of similar map units on
the semi-detailed and the reconnaissance maps of
Nimba county, Liberia (derived from Agrar- und
Hydrotechnik, 1978)
Reconnaissance (1 100 000 ) Semi--detailed (1:50 000)
Map symbol Extent (km2) % Map symbol Extent (km2) %
A1 U1 792 6 A1 21 U20 18
A2 32 28U k A2 3 750 3
- B1 k 760 1+
B1 135 281 19 B2 23 800 20
B2 2kk U16 3h B3 33 320 28
B3 171 900 2k Bk 16 660 1U
D k2 106 6 . B5
: B6
2 380
7 1 0
2
6
C 53 121 7 ; ci C2
1 190
k 760
119 180
1
k
Total 720 900
7 ; ci C2
1 190
k 760
119 180
Sinje/FDA-area, south-western Libe: ria: In order
ni-detailed)
to get a mc
soil survey
>re
workable legend for systematic (sei
ria: In order
ni-detailed)
to get a mc
soil survey a
study area,the Sinje/FDA-area in SW-Liberia was chosen (for
location see fig. 21). This study area will be surveyed du
ring the dry season 1980/1981 by the Soils Division. The pre
parations made sofar and the reasons for the location will
be explained. Some legend proposals and survey problems will
be discussed. The Sinje/FDA-area was chosen in the first place
because the most recent detailed to very detailed soil surveys
took place in the vicinity of the Sinje area. Secondly,
while making field-checks for the reconnaissance sur
vey, Van Mourlk worked moëtly in the same äreä äs well.Thirdly,
in cooperation with FDA (Forestry Development Authority, Mon
rovia, Liberia) a joint projectwas proposed to use soils in
formation fcr forest plantation purposes and the FDA camp near
Sinje (Cape Mount county) was found suitable.
All kinds of preparatory materials such as aerial photographs
(1:70 000), their enlargements (app.l^O 000), a topographic map
(1:50 000) and a geological map (1:250 000) are available.In a working

- 71 -
paper (Veldkamp, April 1980) these materials were interpreted
on landform (physiography), slope classes, elevation classes,
vegetation and geology. It appeared that the most usuable re
sult was obtained from the enlarged photographs. The details
of the topographic map did not accurately resemble the ones
on the enlarged photographs and the photographs are thought
to be more reliable for interpretation purposes. Fig. 20 shows
the physiographic division at scale,1:63 000. Also a geologi
cal division could be made: the unit "relatively steep slope
in hilly landscape" as located in the south-western part of
the Sinje/FDA-area, reflects a more basic type of gneiss (i.e.
melanocratic gneiss, unit gnm on the geological map); the
remainder, except a single hill, is underlain by a more acid
gneiss (i.e. composite gneiss, unit gn1.). Elevation and slope
classes, as derived from the topographic map, were useless.
The vegetation does not have a relation with the physiography
and is more related with the distance to villages (towns) and
the population density. As FDA has made new clearings during recent
years (after the aerial photographs were produced)the pictu
re becomes even less clear. Along the roads the disturbtion
of the vegetation is higher compared to areas on the western
side, especially close to the western border formed by a
creek.
The legend of fig. 20 already resembles the one used by
AHT in Nimba to some extent. Swamps and floodplains as used
in the Nimba legend (or as used in this text: valley bottom-
floodplain-swamp and terrace respectively) could not be
separated on the enlarged photographs. In the Nimba legend
the uplands of the Sinje/FDA-area would probably classified
as unit B2 (or eventually BU), i.e. undulating (or rolling)
upland with dense drainage pattern. The hilly areas may be
identified as unit C1 of the Nimba legend. A great advantage
of the photo-interpretation of the enlarged photographs is
the distinction among lower slope versus upper and middle
slope versus relatively flat summits. This distinction is
also made in the Nimba legend. Lower slopes are indicated
in the Nimba legend as concave slopes with the Weledu soil
family as main soils representant.
Proposal for the semi-detailed survey of the Sinje/FDA-area.
In detailed surveys carried out in the vicinity of

Fig.20. Photo-interpretation map of the Sinje/FDA-Mrea, Gape Mount county, Liberia Approximate sc?'le l:63fOOO. Derived from enlarged aerial photographs of approximate ncale !•:'K), 000, line 6, noes. ^0-^.3; Date ph/tographs dry season 1978/79.
Legend: fiSSIvalley bottom, floodplain, terrace, swamp tEEDlower slope I jupper +• middle slope i irelatively large flat summit, only in rolling landscape EEE3.rolatj.vely steep elope in hilly landscape

- 73 -
the Sinje/FDA-area by a.MRU/Soils Division team during the dry
season 1979/1980, (c.f. paragraph. 3.^.3) the used grid sy
stem was 50x25 m. (i.e. 50 m between traverses and augering
at 25 m interval along each traverse). The field map of those
surveys had a scale of 1:1 000; the final map was reduced to
1:2 500, resulting in a density of observations of 8/ha or
1/cm map surface, which is rather low. Normally a density
of observations/cm^ map surface should amount 5 to 9» although
a lower density is allowed when a survey is carried out in
an area with a clear relation between soils and physiography
and especially when aerial photographs are available. Actually,
the soil maps of the detailed surveys had to be reduced to
1:7 000 to get a density of k observation/cm map surface.
The matter of scale is also important for the semi-detailed
survey in relation to availability of information as well as
to the amount of soils informations requested.
The main problem in semi-detailed survey on the Basement
Complex, like the one in the Sinja/FDA-area, will be the pro
blem of whether one wants to produce a soil map or a more
physiographic map. On a semi-detailed soil map the map units
are considered to be soil associations. On a more physiogra
phic map the map units are of physiographic nature in the
first place and the occurrence of soils becomes of secondary
importance and therefore, as will be shown in landscape of the
Basement Complex, rather meaningless. Moreover, when informa
tion on soils is limited, the possibility of a detailed land
evaluation in which crop suitabilities are determined, is
severely reduced. The practical problems in producing a soil
or physiographic map will be discussed next,
a. Production of a semi-detailed soil map. Based on the ex
perience of the detailed surveys during the dry season
1979/1980, a grid system of 100 x 50 m seems to be the
absolute minimum density of observations, if a soil map
is to be produced. With such a grid system, two observa
tions are made in each hectare of land. The density of
observations per cm map surface depends on.the required
accuracy, the availability of aerial photographs or enlarge
ments of a suitable scale (at least larger than 1:1+0 000)
and the proportion.of physiography allowed in the survey

ff"
- & -
classification or legend. The accuracy increases with
the number of observations per cm map surface. Based
on the assumption that photographs, their-enlargements
and the topographic map are available and that the physio
graphy only plays a secondary role in the classification
(as one wants to make a soil map), a density of k obser
vations per cm^ map surface seems to be allright. The
scale of the map would than be 1:1U UOO. Reducing the
scale to 1:20 000, the number of observations per cm^ map
surface rises to 8, which is more than sufficient. How
ever, two observations each hectare means a huge number
of observations in case of the whole Sinje/FDA-area. The
total surface of that area is 6 000 ha, meaning 12 000 ob
servations to be done! If a hard working surveyor in a
cultivated (non-forest) area does some 100 observations
in one week, either 120 surveyors are needed during one
week or with 3 surveyors ^0 weeks. It is clear that the
production of real soil maps can hardly be done, because
of its immense input of surveyors, labor and money. There
fore a more physiographic approach is inevitable.
Production of a semi-detailed physiographic map. The main
problem of this production is the content of the map units
and the purpose of mapping. From topographic maps, aerial
photographs and especially their enlargements already many
physiographic elements of the landscape can be mapped. The
enlarged photographs with an approximate scale of 1: 0 000
allow the production of a preliminary map and field work
is needed to add more detail and to supply soil data of
the map units. However, as was experienced in the detailed
soil surveys, this process will prove to be difficult. Soils
are quite variable and knowledge about the combination of
several soils into consistent soil associations is still
rather limited.
A compromise between on one hand the production of a real
soil map using a scale of ~\h 1+00 and on the other hand the
production of a physiographic map using scales of 1:k0 000
or more, may be reached by a survey scale of 1:20 000. A
similar compromise can be reached with respect to the den
sity of observations per hectare. This was assumed to be

- 75 -
' 2/ha as minimum requirement for soils mapping. For
physiography/soils - mapping at scale 1: 0 000 and assu
ming one observation per cm^ map surface, a density of one
observation in each 12.25 ha results. The proposed com
promise is one observation in each 8 ha.
For the methodology the actual number of observations
per ha (as average) is important.
The location of an observation site on the field map is
one of the main problems. These observations can be made
in a grid system, ad random, or on specific locations.
By way of a grid system (lines with a fixed direction and a
determined distance from existing locations) many trails through
forest regrowth and thicket are necessary, and thus less suitable
for semi-detailed work. At random observations will not be sui
table in comparison with a more fixed network of observations,as
each map unit, as distinguished in the preliminary photo-interpre
tation, might not get the appropriate observation density.
Especially in the case of the sub-division of valley soils
into floodplain and terrace» more specific locations of ob
servation sites is needed. A difficulty in specific location
sites is the exact location on the field map too, but recent
enlarged photographs are useful (actually enlargement to
scale 1:20 000 would be most suited). As base maps showing
every trail usually do not exist, enlarged photo's are in
evitable for the location of the observation sites. A network
of the specific sites should than be made beforehand.
Another important matter in case of semi-detailed soil
survey is concerned with the detail of the legend. With phases
included, the legend is already quite detailed. From test sur
veys the optimal (in terms of mappability and significance) legend
is to be found. Those characteristics which cannot or hardly
be mapped should be omitted from the legend. Some considera
tion to interpretation of the map units (i.e. land evaluation)
is needed. One property dividing two or more map units may
have a high importance for the determination of the suitabi
lity for a specific land use purpose, while another one, which
can be mapped (e.g. subsoil color), may have a relatively low
impact on the suitability. An important phase forms the slope
class; this phase can often be mapped easily either by the
enlarged photographs or by field work.

- 76 -
A new development for Liberia might be the introduction
of SLAR (side looking airborne radar). As good weather condi
tions for aerial photography are very scarce especially along
the coast, the costs, and time of making a complete photo-cove
rage has recently brought the initiator (FDA) to face the pos
sibility of SLAR instead. SLAR has the advantage of being im-
plementable at any day of the year. Furthermore, an advanced
computer program exists which is able to interpretate the
SLAR-images and can make maps of the interpretation units. A
program with an extensive legend on vegetation exists for
west-Africa. A very attractive program for semi-detailed sur
veys would be one which can map slopes and elevation diffe
rences, the latter especially with respect to the terraces
along streams. Whether such a program exist, is still unsure.
Also, the accuracy of computerized maps has to be investigated
in the field.
Proposed legends: The relation between physiography and soils
is of utmost importance in semi-detailed surveys and needs
further study. This relation is clearest in the topographically
lower positions in the landscape.Soils on valley bottoms, terraces
and parts of the lower slopes can be mapped satisfactory and
combination of soil series and phases seems to be possible
for those physiographic units. Soils on upper and middle slopes
and on the summits, however, can hardly be combined into con
sistent soil associations. Gravel content, thickness of the
gravelfree surface soil, content of weatherable minerals, all
important characteristics of slope and summit soils, are poorly
related to physiographic position. Augering is hardly possible
in most soils, due to the gravel. In the following discussion
on proposed legends these problems will be encountered in more
detail.
A tentative legend for the semi-detailed survey in the
Sinje/FDA-area is given in Table 11. Concurrent series of the
framework are indicated. Some phases of series are proposed.
The possibility of mapping the indicated phases seems uncer
tain and depends on the experience to be obtained during the
coming semi-detailed survey of the Sinje/FDA-area.

- rr -
."able 11 Tentative legend for the semi-detailed soil survey in the Sinje/FDA-area (Cape-Mount, Liberia) at scale 1:20 000 •
Physiographic D i t i c s o i l characteristics Ma?T Concurrent p h & s e s
unit unit series in framework
summit+slope - more than 30? (by Vol.) ironstone , and/or quartz gravel within 60 cm (well and depth1) (very gravelly soils) 3 B, I, D, H slope, tt, wm moderately _ l e s s t h a n ^ (by V o l > ) i r o n s t o n e
well drained and/or quartz gravel within 60 cm upland soils) depth1) (gravelfree to somewhat
gravelly soils) - more than 10? (by Vol.) partially weathered or fresh gneiss or gra- . nitic fragments within 60 cm depth ' (rocky soils) 1 V slope, tt
- less than 10? (by Vol.) partially weathered or fresh gneiss or granitic fragments within 60 cm depth2' (non-rocky soils) - located on summit, upper or middle slope - less than 30% (by Vol.) ironstone and/or quartz gravel within 1.2 m depth1' 2 T slope, wm
- more than 30? (by Vol.) ironstone and/or quartz gravel between 60 and 120 cm depth1' h a slope, wm
- located on lower slope*' 5 L slope, gr
terrace**' - more than 30? silt in all horizons within 1.0 m depth^' (silty terrace soils) 6 P, R
- less than 30? silt, but more than 20? silt in any horizon within 1.0 m deptlr*) (silty-sandy terrace soils).. 7 A
- less than 20? silt in any horizon within 1.0 m depth^) (sandy terrace soils) 8 S
floodplain***' - major texture class between 10 and 60 (valley cm depth is sand, loamy sand or sandy bottom + loam"' (coarse textured valley soils).. 9 M1 sw, ps swamp) - major texture class between 10 and 60
cm depth is sandy clay loam, sandy clay or clay ' (fine textured valley soils) 10 M2 sw, vf
Explanation of notes:
*) lower slope : lower part of the slope where the soils are characterized by a relatively thick deposition (surface) layer of gravelfree erosion (hill-wash) material.
**' terrace : flat area along streams, which are flooded (very) occasionally and which have dry season groundwater levels below 1.0m depth.
***) floodplain : flat area along streams, which are flooded regularly and which have a shallow (within 1i0 in depth) groundwater table throughout trie year.
1' 30? (by Vol.): this volumetric gravel content can be taken as the boundary at which augering becomes impossible, unless the gravel size is relatively big.
2) partially weathered or fresh gneiss or granitic fragments: rock fragments, which are completely hard unveathered for more than 50? of their volume.
3) more than 30? silt: real silty, soft feeling (clay, silty clay, clay loam, silty clay loam, loam or silt loam texture).
*' between 20 and 30? silt: soft feeling, but sand particles can be felt, especially by tasting the soil.
5) less than 20? silt: no soft feeling, although sand particles may be fine (sandy clay, sandy clay loam, sandy loam, loamy sand or sand texture).
°l sandy loam-sandy clay loam boundary: this boundary is represented by a clay percentage of 20?, which has to be estimated by feeling.
Explanation of phases:
slope: four classes are distinguished - a slope of less than 2? b slope between 2 and 6% c_ slope between ó and 13? d slope of more than 13?
tt (thick topsoil): upper 30 cm of the soil has less than 15? (by Vol.) gravel of any kind. wm (weatherable minerals): clear evidence (more than 5? (by Vol.) of partially weathered or fresh gneiss
or granitic fragments. gr (gravelly, only used in map unit 5): more than 30? (by Vol.) gravel between 60 and 120 cm depth. sw (duration of surface water): three classes are distinguished
- MD: surface water up to mid-December - EF: surface water up to end of February - AT: surface water almost throughout the year
ps (psammentic): sand or loamy sand texture throughout the upper 1.0 m. vf (very fine textured): major texture class between 10 and 60 cm depth is clay or sandy clay (containing
more than 35* clay).

- 78 -
As last, issue on semi-detailed surveys a legend (Table 12)
is given, which represents an overall legend for systematic
surveys. The series of the framework can serve as basis for
the map units. A similar division is found in Table 11. The
main problem to be solved remains with the topographically
higher places (upland positions). The soil depth may serve
as one of the main characteristics, probably in connection
with the slope class. The legend is only given to serve as
a guideline. In conjunction with table 11 and further expe
rience in field surveys better versions should be made.
To solve the mapping of the variable upland soils,
especially with respect to gravelcontent, depth of gravel
(or depth of gravelfree surface soil), amount of weather-
able rock fragments, consistent combinations (or associa
tions) of soil series, and eventually phases, have to be
established. An example:
Physiographic element Topography Soil associations
Upper slope (Basement gentle slope 1. 90$ series B, 10$
Complex) series D.
2. 50$ series B, 10$
series D, k0% se
ries L.
3. 10$ series B, 90$
series L.
The consistency and mappability of such soil associations
have to be studied. Further field work has to be awaited be
fore such associations can be fixed and described.
3.4.3 Detailed and very detailed scale
Many detailed soil surveys have been made during the last
30 years in the MRU-area. Birchell et al. (1979) and van Mou-
rik (1979) both have listed all such surveys in Sierra Leone
and Liberia respectively. From most of these surveys however,
no data exist anymore. The soil correlation between these
surveys so far has been very poor; correlation between Libe-
rian and Sierra Leonean soiJs has never been carried out.
In this paragraph five areas in Liberia and two in Sierra
Leone will be presented. The areas in Liberia were surveyed

Table 12 Tentative legend for the overall, systematic semi-detailed survey of large tracts of land
(only Basement Complex)
Series of framework
Topographically higher places:
- Steep uplands:
- Shallow soils:
- Over bedrock X1, X2, Y and Z
- Over petroferric (laterite) contact X3 and U
- Deeper soils:
- On nearly level summit slopes .. V, T, (I) and (B)
- On other slopes B, D, H, I, G, (T) and (V)
Topographically lower places:
- Imperfectly or better drained soils:
- Lower slope soils:
- Well or moderately well drained soils L
- Imperfectly drained soils S
- Terrace soils:
- Along creeks A
- Along meandering rivers
- Well or moderately well drained (levee soils) P
- Imperfectly drained soils R
- Poorly or poorlier drained soils:
- Soils with a silty texture:
- Soils in floodplain depressions J
- Soils in tidal swamps 0
- Soils with a non-silty texture:
- Coarse-textured soils M1
- Fine-textured soils M2

- 80 -
by a team of the Soil Division, supervised by the author,
while the two Sierra Leonean areas are derived from stu
dies by Sivarajasingham (1968) and Stark (1968). Soil clas
sification will only be made according to the framework of
paragraph 3.3; classification according to the Soil Taxonomy
is dealt with in Appendix I.
Detailed soil surveys in south-western Liberia: During the
dry season of 1979-1980 five areas were surveyed in coope
ration between the Soils Division, CARI, Suakoko, Liberia
and the Land Resources Survey Project, Mano River Union,
Monrovia, Liberia. The location of the survey areas can be
found in figure 21. Four out of the five areas are situated
on Basement Complex. The fifth one (Zuani) is situated on a geo
logically complex terrain intermediate between Basement
Complex and the Coastal Plain; however, there is a clear
alluvial influence of probably recent date. Other diffe
rences among the five areas are indicated in Table 13.
Table 13 Characteristics of five survey areas in south
western Liberia
Name Geology Av.an.rainfall (mm) Length growing season (days)
Sefula Melanocratic gneiss >3500 315-3^0
Bopolu . Granitic gneiss 2500-3000 315-3^0
Wuilo Melanocratic gneiss >3500 300-315
Bembele Quartz diorite gneiss 3000-3500 300-315
Zuani Alluvial floodplain >3500 30Ö-315
All areas include a Summit on one side and a creek on the
other side. A comprehensive description of the five areas can
be found in an internal mimeographed publication (Veldkamp,
Ed., 1980 ).A summary of that version will be presented here.
Only general soil data will be given.
Sefula: An area of 8 ha was surveyed and nine map units could
be distinguished, although with great difficulty due to the
common occurrence of gravel in the soils on upper and middle
slope positions. A summary of the main characteristics of the
map units and the classification according to the framework
is given in Table Ik. The soil map is shown in fig. 22.
Detailed soil surveys in south-western Liberia, MRU-Soils Division.

F ig . 21é South -Western Liberia Study area MRU/Soils Division 1979-1980 .'
* 25 » tt no asim-
<f-Stimmte
Bopolu.ß
Land systems
2500-3000 mm' t \
3000-3500 mm '
3OOO-3SO0 mm
> 3500mm
MDHrcOFAEE 0AM
BTTT|| Coastal p la in (1 .2 .3 )
I I A l l u v i a l , l a c u s t r i n e pla in ( * ) .
D issected plains (13 )
Hills ( 14.15 )
I I I n t e r i o r p la in (5 .SJ
Geology of Basement Complex
| I Compos i te gneiss ( g n l )
| ' M e l a n o c r a t i c gneiss ( g n m )
L e u c o c r a t l c gneiss ( g n l , g n l t )
Q u a r t z d i o r i t e gneiss ( g n d q }
Granodlorlte gneiss (gngd)
. * * * J M o s t l y basic rocks ( s .am.z . l t , pg. u. gbn )
Agro-ecological zone
I
CD

- 82 -
Table ll» Hain characteristics of the map units of the Sefula-area and the classification according to the framework
Map Unit Slope
Location a Soil depth Drainage Thickness Gravelfree Surface soil (cm)
Deep 1 Summit 0-2 (to mod.deep) Well Less than 30 2 Upper slope 2-6 Deep Well Less than 10 3 Upper, middle
+ lower slope 1-2 Deep Well Less than 15 It Upper slope 2-5 Mod.Deep Well Less than 10 5 Midd.slope 1-2 Deep Well Less than 20 6 Midd.slope . 1 Deep Well 20-50 7 Lower slope 1 Deep Well 50-80 8 Lower slope 1 Deep Mod.Well 50-90 9 Terrace 1 Deep Imperfect more than 120
Plinthite in subsoil
Unit Texture profile Surf, soil/subsoil
Gneiss gravel Strongly/part
Weath.
Map Unit Texture profile Surf, soil/subsoil
Gneiss gravel Strongly/part
Weath. Upper Boundary Contrast of Mottles
1 SL/SCL common/frequent - _ 2 SL/SCL common/ — - -3 SL/SCL very/few - - -It SL/SCL few/frequent - -5 SL/SCL very few/ - 60- 90 cm prominent 6 SL/SCL -/- prob.60- 90 cm prominent 7 SiL-SL/SiCL-SCL-C -/- 50-120 cm prominent 8 SiL/SiCL -/- 50- 90 cm very prom. 9 SiL/SiCL -/- 50- 90 cm dist.faint
Map unit Gravels in gravelly layer (no gneiss) Surface (%)
1 Common ironstone gravel It 2 Many quartz and ironstone gravel 15 3 Many quartz and ironstone gravel 23 U Common quartz and ironstone gravel 3 5 Very many ironstone and quartz gravel 20 6 Many ironstone and quartz gravel 5 7 Common ironstone and quartz gravel 8 8 Common ironstone gravel 6 9 Locally few quartz gravel 16
Map unit Classification
1 I-typic 2 I-shallow-gravelly 3 B-shallow-gravelly, non plinthic, very gently sloping It H-shallow-gravelly, mica, very gently sloping 5 B-shallow-gravelly, very gently sloping 6 Probably G-typic 7 B-slightly gravelly, thick topsoil, very gently sloping 8 L-somewhat gravelly, nearly level 9 A-typic

F i g . 22. S o i l map of
the Sefu la -a rea
2f fo ff IM *
LEGSHD.
1. "eep to almost moderately deep, well drained, yellowish brown, atony and often gravelly soil,
containing frequent partially weathered gneiss gravel and stones, covered by a 5 to 20 en thick
gravelfrce surface soil
2. Deep, well drained, yellowish brown, gravelly soil, containing common to frequent often strongly
weathered gneiss fragments, covered by a mostly slightly gravelly 10 to 20 cm thick surface soil«
3. Deep, well drained, yellowish brown, gravelly (to very gravelly) soil without weatherable gneiss
fragments.
*u Moderately deep, well drained, yellowish brown, slightly gravelly to gravelly soil vlth.unweathered i
and partially weathered mica In the subsoil.
5. Deep, well drained, yellowish brown, very gravelly soil with plinthite in the lower subsoil.
6. Deep, well drained, brown to yellowish brown, (very) gravelly soil with a relatively thick C*0-
50 cm) gravelfree surface soil.
7. Deep, well drained, yellowish brown soil with a gravelfre« surface soil over 50 to 80 cm, covering
a gravelly subsoil; the soil contains a relatively high content of silt in comparison to units 1 to 6*
8. Deep, moderately well drained, yellowish brown, gravelfree soil covering a gravelly plinthite subsoil.
9> Deep, imperfectly drained, yellowish brown, gravelfree soil with soft plinthite in the subsoil.
Location of soil profile and profile number,
quartz rock outcrop.
Termite mound.
Trail.

- 8U -
The map units will be described briefly, beginning on the
summit and continuing towards the creek. Map unit 1 is located on
the summit position and has a substantial amount of gneiss frag
ments in the subsoil. Weathered bedrock fragments are found
within 2 m depth. Ironstone gravel is found in most parts of
the profile, although a gravelfree surface soil exists with
a depth variable between 10 and 30 cm. Map unit 2 is a com
mon upper slope soil which is very gravelly in ironstone and
quartz gravel, but also contains enough gneiss fragments to
be separated from map unit 3. Map unit 3 is the most common
upland soil, which is very gravelly without a substantial
amount of gneiss fragments. Map unit h is a very locally
occurring gravelly soil situated on weathered mica. The mica
particles (muscovite) are clearly visible in the subsoil:
the question of an eventual release of minerals from the mica
is not solved yet. Map unit 5 resembles unit 3, but is cha
racterized by plinthite in the subsoil; this map unit is si
tuated on middle slopes. Map unit 6 differs from unit 5 by
its thicker gravelfree surface soil. Map unit 7 represents
soils on the lower slope with a gravelfree surface soil up
to 50 to 80 cm underlain by a gravelly layer together with
plinthite formation. Map unit 8 is the next soil in the catena
in which eventually gravels occur in the deep subsoil only,
if any; these soils are moderately well drained. The texture
is silty loam to silty clay loam. Clear plinthite is visible
in the subsoil. Map unit 9 is the real terrace soil with a
äilty texture, without gravel and with gley mottling rather
than plinthite.
General Characteristics of the Sefula Soils.
Color. The colors of the surface and the sub-soil are nor
mally in the 10 YR hue with few exceptions on the slopes where
part of the subsoil may be 7.5 YR. Map unit 6 often has rela
tively dark colors over greater depth than the other units.
Map unit 3 may have red colors (2.5 YR) in the subsoil.
Texture. The texture-profile of the well drained soils show
a gradual increase in clay content with depth; normally the
surface soil is sandy loam, while the subsoil has a sandy clay
loam texture (or exceptionally sandy clay). The moderately
well and imperfectly drained units (Nos. 8 and 9) and partial
ly No. 7» being transitional between the well and moderately

- 85 -
well drained soils, are more silty than the well drained map
units; in the imperfectly and poorlier drained soils an in
crease in clay content is not clear.
Plinthite. In middle and lower slopes profiles, plinthite
could be observed in the subsoil. Down slope the plinthite
more often occurs at shallower depth and the matrix of the
plinthite becomes softer; the segregation of iron mottles
increases, causing hard nodules, especially in map unit 8.
In map unit 9the mottles are faint or distinct due to more
fluctuation of the groundwater level.
Thickness of the surface soil. The thickness of the gravel-
free surface soil is variable for the well drained soils and
cannot always be mapped. In the description of the map units
(and in Table iH) this characteristic is expressed. The lo
wer slope and terrace soils have a deeper gravelfree surface
soil.
Gravel and weatherable fragment content. The map unit repre
sentative for the summit (map unit 1) has a clear amount of
partially weathered gneiss gravel and stones, while in map
unit k mica is present in fresh or partially weathered stage.
The amount of ironstone and quartz gravel increases from the
summit along the slope. After reaching a maximum in unit 5,
the amount of gravel decreases and occurs at greather depth.
It is obvious that an accurate survey is not possible by only
using.augers; a limited number of pits and interpolation
between observations was needed to survey the gravelly soils.
Slope and erosion hazard. The slopes are maximal 6%, but
usually 2% or less. Signs of (sheet) erosion could be detected
on the middle and lower slopes. Also the presence of gravel
close to the surface in upper slope profiles is indicative
of erosion.
Bopolu: The Bopolu area of k.3 ha was surveyed with eight
map units. A summary of the main characteristics of the map
units and the classification according to the framework is
given in Table 15. The soil map is shown in fig. 23.

- 86 -
Table 15 Main characteristics of the map units of the- Bopolu-ar»a and the classification according to the framework
Map Unit Location Slope % Drainage
Thickness gravclfree surface soil (cm)
1 la Summit 0-5 Well Less than 10 1b Upper slope 5-8
2 Upper slope + 5 Well 5 cm or less 3 Upper midd.slope* 7 Well 5 cm or less
(and up to 16) 1» Upper+midd.slope+_ 5 Well Mostly slightly
gravelly over 20 to 30 cm depth
5 Midd.+lower slope + 3 Well-
well mod.
50 cm or more 6 Floodplain 0-1 poorly Variable 7 Floodplain 0-1 very poorly Variable
Map Unit Texture profile Surf, soil/subsoil
Gneiss gravel Strongly/part
Weath.
Mottling/ Plinthite in subsoil
1 SL/SCL/SC few/frequent _ 2 SL/SCL few/common Few or none reddish
mottles 3 SL/SCL variable/very
to common few Faint to distinct
mottling or plinthite 1» SL/SCL common/common Few reddish mottles 5 SL/SCL -/- Distinct reddish
Variable (LS-SC) Variable
-/--/-
mottles, either hardened "plinthite" or unhardened gley
Faint mottling No data
Map Unit Gravels in gravelly layer (no gneiss) Surface (%)
1 Few ironstone and quartz gravels 2 Common ironstone and quartz gravels 3 Common to very many ironstone and quartz gravels k Few to common ironstone gravels, few quartz gravels 5 Common to many quartz and ironstone gravel and
hardened mottles (nodules) 6 Variable; occasionally few to many mostly quartz
gravels eventually mixed with ironstone gravels 7 Variable
6(1»), 15db) 10 3U 2
21 6
Map Unit Classification
1(la) Vj-gravelly, basic (?), nearly level 2 I-shallow-gravelly, slightly gravelly 3 B-non-plinthic (?), stony, slightly gravelly U B-shallow-grayelly
I-shallow-gravelly 5 L-plinthic, somewhat gravelly
L-moderately well drained 6 Mg-MD, almost flat
M2-very gently sloping M2-MD, gravelly, almost flat
7 • M2-EF 7

LEGEND. Fig. 23. Soil map of the Bopolu-area.
1. Deep, well drained,, strong brown, (somewhat) gravelly soil containing a considerable amount of partially-weathered gneiss fragments, occurring on various summit and slope positions.
2. Deep, well drained, yellowish brown, gravelly soil with a small amount of partially weathered gneiss fragments, occurring on upper slope positions.
3. Deep, well drained, yellowish brown, ' ' gravelly to very gravelly soil with some mottling in the deep subsoil and without any amount of weatherable gneiss fragments; they occur on various slope positions; sometimes slopes are as steep as 16 %.
h. Deep, well drained, yellowish brown, (somewhat) gravelly soil with a sligthly gravelly surface soil of 20 to 30 cm thickness; weatherable gneiss fragments occur in various amounts; occurring on middle and upper., slope positions.
5. Deep, well to moderately well drained, yellowish brown, gravelfree soil,often underlain at 50 cm or in some cases at 100 cm depth by more gravelly inert material; either plinthite or gley mottling can be obse'rved in the subsoil.
6. Complex of deep, poorly drained floodplain soils composed of layers with variable textures (mostly sandy loam and sandy clay loam, interlayered with sandier textures), colors and mottling.
7. I'eep, very poorly drained soil, similar in characteristics to unit 6.
r' Location of soil profile and profile number is,v Gneiss rock outcrop ^ Termite mound
--- Trail -^>Creek or shallow drainage way

- 88 -
Gravelly soils occupy the major part of the landscape;
these soils can "be found almost up to the main creek or its
tributary. Due to the radial pattern of the survey(as the
surveyed hill was small), the proportion of the more poorly
drained soils is relatively high. In the southern corner of
the survey area some map units (nos. U, 5 and 6) were distin
guished, which happened to have only limited extention in the
area. The transition from well drained soils towards poorly
drained soils occurs within few metres distance; often slopes
up to 16# were measured at these boundaries. In case of mode
rately well drained soils occurring between the well and poorly
drained soils, slopes are more regular and less steep (usually
around 3%). All soils are deep soils with a depth of more than
Map unit 1 is a summit soil with not many ironstone gravel,
but with a substantial amount of gneiss fragments. Map units
2 and 3 are the common upper slope soils, which are very gra
velly in ironstone and quartz making augering in these soils
difficult. Gneiss fragments are found throughout the profile
in various proportions. Unit 3 is separated from unit 2 by the
occurrence of plinthite and the location on somewhat steeper
slopes (7 versus 3% as average). Map unit k forms a transition
between the common gravelly soils of units 2 and 3 and map units
with gravelfree surface soils (units 5 and 6). Unit k frequently
contains partially and strongly weathered gneiss fragments. Map
Unit 5 consists of gravelfree soils underlain by gravelly sub
soils with plinthite; they are situated on lower slope positions
mainly.
General characteristics of the Bopolu soils.
Color. The color of the surface and the subsoil is normally in the
10 YR hue. The deep subsoils of the profiles on the upper slope
and the summit usually have a 5 ÏR color. Some of the subsoil
horizons of the poorly drained soils have a 2.5 Y hue.
Texture. The texture-profiles of the well and moderately well
drained soils show a gradual increase in clay content with depth;
normally the surface soil has a sandy loam texture, while with
depth sandy clay loam textures occur. The texture-profile of
the poorly drained floodplain soils is irregular and fluventic
in character; several layers alternate, although the question of

- 89 -
classification into entisol/inceptisols (Soil Taxonomy) is
unclear.
Plinthite. The occurrence of plinthite is not very clear; it
appears in well drained soils on middle and lower slopes (map
unit 3) and also in the gravelfree soils on the lower slope
(map unit 5). Plinthite occurs to a lesser extent and less
developed, compared to the Sefula area; especially the plinthite
containing well and moderately well drained soils, which were
found near Sefula, were not observed in the survey area near
Bopolu.
Thickness of the surface soil. All well drained soils, with the
exception of map unit 5, have thin (about 10 cm) surface soils,
which are often gravelly. Only unit 5» which has a much thicker
gravelfree surface and sub-surface soils have a somewhat deeper
surface soil (up to 20 cm). The poorly drained soils have sur
face soils of up to 25 cm.
Gravel and weatherable fragment content. Weatherable coarse frag
ments are found in the units 1 to U, covering most of the well
drained upland part of the landscape. The highest content of
weatherable fragments is clearly found in the summit profile.
The other units have relatively high gravel contents, especially
unit 2 and more specifically unit 3. In the other units (nos 5-7)
gravels are also found, but mostly in the subsoil only.
Slope and erosion hazard. The slopes are generally steeper than
in the Sefula area. The occurrence of erosion on the steeper
slopes was observed by the absence of a slightly gravelly or
gravelfree surface soil; occasionally small and very shallow
erosion "streams" were found. On the lower part of the slope
where slopes may be up to 16$, a clear erosion hazard exists af
ter clearing of the vegetation.
Differences between the Bopolo and Sefula survey areas.
1. As slopes are steeper in the Bopolu area, the transition
from well to poorly drained soils takes place within a shor
ter distance by which moderately well drained soils occur
only in one small map unit; imperfectly drained soils occur
in strips along the slope which were too small to be mapped
at the scale of the survey.
2. In the Sefula area the soils along the creek are situated
on a river terrace; in the Bopolu area there is no terrace

- 90 -
but a floodplain. In-the Sefula area the terrace soils are
imperfectly drained. In the Bopolu area the floodplain soils
are poorly drained, while very poorly drained soils occur
near a swamp. Probably this difference is due to the higher
order of the creek in Sefula as compared to the lower order
of the creek and its tributary in Bopolu. Also the diffe
rence in topography may explain this difference.
3. Soils which contain partially weathered gneiss fragments
occur in some places almost up to the creek in the Bopolu
area, whereas in the Sefula areatfis type of soils occurred
only on summit and upper slope positions.
k. Plinthite was clearly found in middle and lower slope soils
in the Sefula area. In the Bopolu area plinthite occurs as
well, but is less clearly developed; actually it seems to
be a faint mottling only, either due to differences in the
parent rock, differences in weathering stage or eventually
some groundwater influence. Plinthite, as found in the Bopolu
area in map unit 5 is the only occurrence of plinthite which
shows similarities with the plinthite as found in the Sefula
area.
Wuilo: The area near Wuilo had an extent of 5.5 ha. Four map
units were distinguished, while three extra slope phase were
mapped. In general the soils of the Wuilo area are very simi
lar to the ones of the Bopolu area, although the slopes are less
steep. Differences by geology between the melanocratic gneiss of
the Wuilo area and the granitic gneiss of the Bopolu area were
not found. Differences among soils due to differences in cli
mate could not be found too. Apparently the division in agro-
ecological zones does not reflect any differences in soil for
mation.
No summary of main soil characteristics is given; only the
classification of the map units and slopes phases is indicated
(Table 16). The soil map of the Wuilo area can be found in fig.
2k.
Map unit 1 represents the common gravelly soils containing
a substantial amount of partially weathered gneiss fragments;
they occur on summit and upper slope positions. Two slopes were
distinguished: 1a. nearly level (up to 2% slope) and 1b. very
gently sloping (2-5$). Map unit 2 represents the common gravelly

- 91 -
soils on the upper and middle slopes. Some cementation of the
gravelly subsoil could be observed. Two slope phases are sepa
rated: nearly level (up to 2% slope) and very gently sloping
(2-5$). Clear differences in soils between the two slope phases
could not be detected. Map unit 3 is the typical sandy lower
slope soil in which a gravelfree surface soil up to hó to 50 cm
depth overlies more gravelly subsoil material. There are two
slope/drainage phases: 3a. well drained soils in relatively
higher slope positions; 3b. moderately well to imperfectly
drained soils on relatively lower slope positions. Map unit k
represents the normal floodplain soils with coarse textured,
sometimes gravelly and very locally cemented subsoils.
Table 16 Classification of the Wuilo soils according to the
framework
Map unit Classification
1a I-slightly gravelly, thick topsoil, nearly level
1b no profile available
2a B-shallow-gravelly, nearly level .
2b B-shallow-gravelly, petróferric, very gently sloping
3a B-thick topsoil, slightly gravelly, very gently sloping
3b S-gravelly, very gently sloping
h M2-gravelly, petroferric, shallow, very gently sloping
General characteristics of the Wuilo soils.
There are many gravelly soils in the Wuila area, in which
only the depth of the more or less gravelfree surfacesoil is
variable, apart from the distinguished slope phases. Further
more, the presence of partially weathered gneiss fragments
could be observed and mapped. The slopes are ranging from 1
to 5%, which is less steep compared to the Bopolu area, making
the erosion hazard less as well. Reddish colore hardly
appear, although during augering 5 YR colors were observed;
however, these colors are due to the augering of the iron-coxi-
training gravel itself. As stated before, the Wuilo area,
apart from the more gentler slopes, is quite comparable
to the Bopolu area.

- 92 -
Fig. 2*f. Soil, map of the Wuilo-area
LEGEND
1. Deep, well drained, gravelly, yellowish brown soil containing a considerable amount of partially weathered gneiss fragments in the subsoil; 1a. nearly level phase 1b. very gently sloping phase
2. Deep, well drained, very gravelly, yellowish brown soil in which the gravel content may be very high at a shallow depth of around 20 cm; 2a. nearly level phase 2b. very gently sloping phase
3. Deep, gravelly»yellowish brown to brownish yellow soil with a gravel-free or slightly gravelly surface soil over 1*0/50 cm; 3a. well drained phase 3b. imperfectly drained phase
4. Shallow, poorly drained, gravelly, cemented, light yellowish brown soil, covered by a gravelfree to slightly gravelly loamy surface soil.
5. Deep, poorly to very poorly drained soil with sandy and loamy textures occurring as a complex.
Soil boundary
. -Shallow tributary of Wui creek
\^s\Disturbed soils along the road
"* Termite mounds
»»' Location and number of profile

- 93 -•
Bembele: The Bembele area is the relatively driest one of the
five survey areas in SW-Liberia, but no indications as such
were found in the soils. The soils of the Bembele area have
many similarities with the other areas; a terrace comparable
to the one in the Sefula area was found. Slopes are comparable
to the ones of the Sefula and the Wuilo area. The occurrence
of gravels (either ironstone and/or quartz and weathered gneiss
fragments) does not really differ from the pattern as found in
the other areas. The only distinct differences are the occurrence
of more uncoated ironstone gravel and the almost absence of plin-
thite. The classification of the nine map units is given in Table
17- The soil map is presented as fig. 25.
Map unit 1 is a summit soil with a clear gravelfree surface
soil underlain by a gravelly subsoil consisting of uncoated
ironstone gravel, mixed with quartz, coated ironstone gravel
and to some extent partially weathered gneiss fragments. These
soils do normally occur on nearly level summits or upper slo
pes, but were only found locally on lower slopes positions
as weIL;however, these two phases have not been separated in
the legend. Map unit 2 represents a rare gravelfree soil of the
upper slopes; normally upper slope soils have more gravels clo
ser to the soil surface. Map unit 2 resembles unit 6 on lower
slope positions. Map unit 3 is the common gravelly slope soil.
Map unit k is a soil with a relatively low gravel content on
the upper and middle slopes with few to common, partially and
strongly weathered gneiss fragments and a low content of hard
gravel, which makes aügering in these soils possible. Map unit
5 is a somewhat gravelly soil occurring on all slope positions,
but with a small extention in the area; it contains mainly un
coated ironstone gravel besides partially weathered gneiss frag
ments. Map unit 6 is a common relatively gravelfree soil on lo
wer slope positions. Map unit 7 represents the transition be
tween lower slope and terrace. The soil texture is somewhat
silty. Although resembling units 6 and 8, they could be mapped
as a separate unit. Map unit 8 is the real silty terrace soil,
comparable to unit 9 of the Sefula-area; it is an imperfectly
drained soil with an uniform appearance. Map unit 9 represents
some levee soils in an inner bend of a creek. Their drainage
can be characterized as moderately good. Their characteristics
are comparable to map unit 8.

- OU -
Table 17 Main characteristics of the Bembele "map units and the classification according to the framework
Map Unit Location Slope
% Drainage
Thickness Gravelfree
Texture Surf.(?)
1 Summit 0-1 Well 50-70 SL/SCL 12.2 lower slope 3-6
2 Upper slope 2-3 Well up to 110 SL/SCL 2.7 3 Upper slope 2-1» Well 5-20 SL/SCL 16.0 U Upper+middle 2-5 Well .• 15-"*0 SL/SCL/SC - 15.!* 5 Upper+middle+
lower 3-6 Well 30-55 SL/SCL U.9 6 Lower slope 2-6 Well throughout SL/SCL 11.1» 7 Terrace-lower Mod.well imper- SiL/SiCL
slope K-2) fectly throughout SCL/S 23.6 8 Terrace 0-1 imperfectly throughout SiL/SiCL 12.7 9 Levee 1 mod.well imperf. throughout LS/S 1.1
Map Unit Gneiss fragment s Ironstone and/or quartz
Map Unit strongly/partially weathered gravel in gravelly layer
1 Few/few + 50 (by vol.) + +
2 None Slightly gravelly in deep subsoil
>** 3 Many strongly weathered particles below gravelly layer 50-70? (by vol. >** U Few to common of both 5% or less (by vol.)
5 Common to many; coated, uncoated* 25* (by vol.) + +
6 None Eventually few gravels in deep subsoil
7 None None 8 None None
9 None None
U n _ Tf«*-*-W.MIBO.L* XUC*b.LWU
1 2 3 1» 5
6 7
8 9
Notes:
G-stony, non plinthic, nearly level Probably: T1-very gently sloping B-IL, non-plinthic, nearly level to very gently sloping I-thick topsoil, slightly gravelly, very gently sloping V1-gravelly, thick topsoil, slightly stony?, very gently sloping Vi-graveliy, thick topsoil, coated, very gently sloping L-very gently sloping L-silty, moderately well drained, nearly level or S-silty, nearly level A-typic Probably: L-moderately well drained, coarse textured, nearly level or S-typic, nearly level.
+" partially weathered predominant in upper subsoil; with depth increase of strongly weathered particles.
** mainly uncoated ironstone gravel, rest is coated ironstone gravel and quartz.

Fig. 25. Soil map of the Bembele-area
LEGEND
1. Deep, well drained, yellowish brown soil with a thick (50-70 cm) gravelfree surface and upper subsoil covering a gravelly subsoil.
2. Deep, well drained, gravelfree, dark yellowish brown soil on upper slope positions.
3. Deep, well drained, gravelly to very gravelly, yellowish brown soil.
k. Deep, v/ell drained, gravelly, yellowish brown soil with few to common partially weathered gneiss fragments.
5. ^eep, well drained, gravelly, yellowish brown soil with a thick gravelfree surface soil and containing a considerable amount of coated and uncoated partially and strongly weathered small and large gneiss fragments.
6. Deep, well drained, gravelfree, dark yellowish brown to yellowish brown soil on lower slope positions.
7» ^eep, moderately well to imperfectly drained, gravelfree, yellowish brown soil with silty loam to silty clay loam textures in the surface and upper subsoil and sandy clay loam and sandier textures in the subsoil; occurring on terrace-like lower slopes.
8. ^eep, imperfectly drained, gravelfree, silty, dark yellowish brown to yellow terrace soil.
9. Deep, moderately sell to imperfectly drained, gravelfree, (light) yellowish brown, sandy levee soil.
-—-Soil boundary ».oiti Location of soil profile and profile number ^^Creek ^ "tributary
& Termite mound
a vaartz outcrop
vo VJ1

- 96 -
General characteristics of the Bembele soils.
Color. All soil colors are in the range dark yellowish "brown to
yellowish brown except the more yellow terrace soils.
Gravel. Mostly uncoated (IL) gravel. The content of black coated
detrital (DL) ironstone gravel is relatively low. The content of
quartz also low; this may be due to the parent rock which con
sists of a more basic type, notably dioritic gneiss containing
less quartz. It also appears that the landscape is not as old
as in the other studied areas.
Partially weathered gneiss was found in summits and on the
slopes. In some cases the gneiss was coated by iron and was
observed to be strongly weathered inside. As the particles
appear to be hard, they were classified as partially weathered;
as this is not true, a coated phase of series V (cf Appendix I)
was established. It was preferred to classify the soil of map
unit 2 as V-series due to its specific characteristics (i.e.
a thick topsoil, a low ironstone and quartz content in the sub
soil and a considerable amount of gneiss).
Plinthite. Hardly any (soft) plinthite was found. It was even
less visible than in the Bopolu area.
Thickness gravelfree topsoil. Many more relatively deep gravel-
free topsoils were found in the Bembele area compared to the
other areas. They occur on the summit and on the slopes.
Slope. The slopes are relatively short and not very steep (highest
slope 6%).
Further remarks on ironstone gravel formation in the Bembele
area.
Uncoated ironstone gravel was observed to be formed in upper
slope profiles from gneiss stones, which were transported in
the colluvial layer and which were enriched with iron, forming
irregular streaks inside the gneiss fragments. These streaks
may be due to trans-location of iron inside the weathered gneiss
material. It appears clear, that these particles are the common
uncoated irregularly formed hard (iL) ironstone gravel with
reddish/yellowish colors. On the other hand the formation of
such ironstone gravel may also be due to plinthite formation,
although no evidence was found for such a process.
For the formation of ironstone gravel, the following pro
cesses are proposed:

- 97 -
A. Gley mottling - plinthite - rounded nodules - rounded
uncoated ironstone gravel - transportation - rounded
coated ironstone gravel.
£1.Gneiss fragments - transportation - weathering - iron
enrichment; only steaks of iron inside the fragments -
loss of soft weathered material - uncoated angular
ironstone (IL) gravel - transportation - sub-rounded
coated ironstone gravel - transportation - rounded
coated ironstone gravel.
B2.Gneiss fragments - transportation - weathering - iron
enrichment; steaks inside and on outside of fragments -
loss of soft weathered material - angular and uncoated
porous ironstone gravel - transportation - broken
sub-rounded, coated and uncoated ironstone gravel -
transportation - rounded coated ironstone gravel.
Comparison among four sample areas on Basement Complex.
Before the soils of the Zuani-area will be described,
the four areas on Basement Complex are compared on simi
larities among map units. In general, it may be stated that
the map units of . equal physiographic positions have many
similarities. However, the differences among map units within
physiographic elements are variable, especially on upland po
sitions. Series B, I, H, V1 and T1 of the framework were found
on the topographically higher places. Within each series, esp.
B and I, being the most common ones, a great variability was ob
served. Several combinations of phases were found. A few map
units of the four areas are really comparable:
- unit 5-Sefula, unit U-Bopolu(partially) and unit 2a-Wuilo,
being series B, shallow-gravelly on a nearly level to very
gentle slope. -
- unit 2-Sefula, unit 2-Bopolu and unit i+-Bopolu( partially),
being series I, shallow-gravelly.
- unit 1a-Wuilo and unit U-Bembele, being series I-slightly
gravelly, thick topsoil on a nearly level to very gentle slope.
The rest of the map units are not clearly comparable and
even within map units, although the surveys were quite detailed,
several phases or subphases of series were found, but could not
be mapped. The result of these surveys indicates the enormous
variability and therefore the great need for a sound generali-

- 98 -
zation. The framework forms the base for such a generalization,
but the basics of the framework, applicability and signifi-
canoe,have to be kept alive. In fact, the series of the framework
form already a generalization of phases on basis of one, mappable,
criterium» In paragraph 3.^.2, an effort has been made towards
a further generalization for semi-detailed survey.
Zuani: The Zuani area is an isolated area close to the Mano River
in Grand Cape Mount County, Liberia. The special purpose of
surveying this area was its unusual character of the landscape.
The land is relatively flat, intersected by shallow drainage
ways and deeper valleys. Such landscapes are found at the
transition of the Basement Complex and the Coastal Plain. Streams
and rivers flowing southwards from the Basement Complex hills are
probably hampered in their discharge during the rainy season and
large floodplains are formed. Within these floodplains low and
very low hills can be observed. Also, but uncertain, is the pos
sibility of marine flooding during the Pleistocene; no evidence,
however, was found of such occasions. The vegetation of these
plains is savanna-like grass, which is burnt regularly during
the dry season. The land is hardly or not in use, although in
a similar area south of Madina (Cape Mount) a rice project was
started years ago. The hydrology of the area is characterized
by flooding during the rainy season and drought and subsequent
deep groundwater levels during the dry season. The soils are
alluvial in character, but might show some soil formation in
the form of clay illuviation; evidence for clay illuviation
could not be observed in the field. In general, these soils
are young, especially as flooding continues to occur; together
with the flood water very thin Jayers of sand and clay are depo
sited; these layers are quickly mixed with the dark colored top-
soil. The area is isolated and people only live on the edge of
the plain, where Basement Complex hills give rise to somewhat
more fertile soils.
In fig. 26 a schematic cross-section of the plain is given,
together with the soil drainage and the physiographic sections.
The verticle scale was composed from estimations of the
height of the flood water. In the lowest part of the landscape,
the swampy valley bottom, moss growth on trees at a height of
2.1 m above the soil surface indicated the height of the flood

PHYSIO GRAPHY
Profile pit number Soil drainage
Map unit
F ig«26.Schemat ic cross-sect ion of the Zuani l a n d s c a p e
Very low hill
Summit ISIope
^ 0235-
Well 'mod. w. imp.
Terrace- flood pla in
drainage! way, | Plain plain
~i—:—r •drainage* I way, Idepress-Inn
0191
very poorly
3a. 3 b
-4—^ 0216
poorly imp poorly
2a
\±—4 0229
very poorly
3a. 3b
plain
0192
poorl y
L 2a
horizontal scale: 1cm : 2 0 m
Vertical scale 1cm r 0.8m
transition • real flood plain . flood plain
t rans i t io n
0193
very very poorly
swampy valley bottom
0194
very.very, very poorly

- 100 -
water during a substantial part of the rainy season. People
living close to the area mentioned a height of 20 to 50 cm on
the regular plain. The map units of the soil map and the re
presentative profile pits are indicated in fig. 26..The soil
map of the Zuani area can be found in fig. 27-
Four major physiographic sections can be distinguished:
the hills, the terrace-plain, the transition-plain and the
real floodplain. The latter three are regularly flooded du
ring the rainy season. The variability in texture profile of
the soils on the plains is usually great. Thickness of dark
colored surface soil, small differences in texture and mottling
pattern appeared to be too variable to be mapped at the used
field scale (1:1 000).
Hills. One very low hill was indicated in the survey area. On
the soil map the whole hill was mapped as one unit; no separa
tion was made between the summit soils and the slope soils,
although a drainage sequence is likely to exist as the summit
seems to be well drained, while within 50 m from the summit the
poorly drained soils of the plain are found. Map unit 1 com
prises the soils of the very low hills. The clay content is in
creasing with depth. The texture of the surface soil is (coarse)
sandy loam; the subsoil texture is (coarse) sandy clay loam.
No stones or coarse fragments were found in this unit. Surface
about 5$-
Terrae e^lain. The terrace-plain comprises the largest part of
the survey area. Map unit 2 is representative of this unit. Ac
tually, it is a complex of several plain soils with variability
of thickness of the dark-colored topsoil, in texture-profile and
also in mottling pattern. The soils are all gravelfree and deep.
The soil drainage was described as poorly drained. Regular
flooding occurs up to a maximum of 50 cm above the soil surface,
but usually not more than 20 cm. Deep groundwater levels occur
in the dry season. Map unit 2: A black or dark brown sandy
loam surface soil of various thickness (from 5 to 20 cm) over
lies a fine textured subsoil, in which the clay content increases
with depth. The subsoil color is light grey with common distinct
faint mottles, especially at depth between 30 and 80 cm. Below
80 cm only faint mottles occur. The total surface occupied by
this map unit is 667».
Under forest vegetation a phase is distinguished because

- 101 -
25 75 125
125 M
Fig. 27. Soil map of the Zuani-area
LEGEND Legend: see text.
1. Soils of the very low hills; well drained on the summits and moderately well and imperfectly drained on the very gentle to gentle slope; deep, gravelfree yellowish brown sandy clay loam soils.
2. Poorly drained soils on the terrace-plain with a sandy loam surface soil covering a sandy clay loam subsoil with an increasing clay content with depth; the topsoil is black or dark brown in constrast to the light greyish subsoil; unit 2 represents the higher parts of the terrace-plain. (Phase 2a: grass vegetation; phase 2b: forest vegetation).
3. Very poorly drained soils in drainage ways or in depressions on the terrace-plain with a coarser textured layer within 1.0 m depth. (Phase 3a: loamy sand to sandy clay loam, eventually sandy clay textures) (Phase 3b: silty loam to silty clay loam over sandy clay loam texture)
h. Very very poorly drained medium textured soils with coarse textured subsoil, situated on the very gently sloping transition floodplain.
5. Very very very poorly drained silty soils covering more sandy subsoils, situated in swampy valley.bottoms.

- 102 -
of a slightly better drainage (imperfectly to poorly drained);
in the field the better drainage could not be explained; it is
either due to the transpiration by the forest or due to a
slightly higher position above the rest of the plain. The former
explanation seems to be more plausible. (This phase is indicated
as 2b, which the common poorly drained soil unit is indicated
as 2a). Surface of 2b is approximately 0.5 to \% of the total
survey area.
In the terrace-plain long drainage ways and also depressions
were found. The height of the flood water in these depressions
is about 20 to 30 cm higher than the rest of the plain. Very
poorly drained soils are found in those places. These units
are separated on the map as units 3a and 3b. Some of these soils
have a slightly thicker topsoil, but this is not consistent for
all the very poorly drained soils. The variability in texture
pattern within the profile could only be mapped to some extent.
Soils in or near drainage ways, apart from having a very poor
drainage, differ from map unit 2 by the occurrence of coarse
textured layers at depth between 20 and 100 cm. Actually three
sub-units were found:
3a. Soils quite similar to the unit 2, but differing by a loamy
sandy layer within 0.5 m depth. Surface of 3a: + k%.
3b. Soils with a siltier texture in the upper layers up to 1+5
cm depth. Surface 3b: + 5$.
3c. Soils with loamy sand or sand textures only within 1.0 m
depth; this unit could not be mapped.
Transition floodplain. There is a remarkable boundary in the
landscape where the terrace-plain changes into a lower lying
floodplain with steeper slopes. This transition-floodplain does
not occur at all in places between the terrace-plain and the
vailëy bottoms'. The slopes of the transitiöh-floödpiäin are Up
to 2%. Map unit k is representative for the transition-flood-
plain.
Map unit k: A thin (5-10 cm) black surface soil with a loamy
(silty) texture covers a sandy clay loam or clayier subsoil with
a light grey matrix color with faint brownish yellow to reddish
yeLbw mottles. At a depth of 50 to 80 cm more coarser textured
material (sandy loam or loamy sand) is found. The soils of this
map unit are poorlier drained than the ones of the tërrace-
plain. In order to make them distinct from the soils in the

- 103 -
drainage ways and the depressions on the terrace-plain, the
soil drainage of map unit U is named very very poorly drained.
The total surface occupied by map unit U is h%.
Real floodglain. This floodplain is called real as it is located
close to the stream in the lowest part of the landscape. Flooding
occurs regularly, except during the driest periods in the dry
season. Map unit 5 represents this unit which consists of swampy
valley bottom soils.
Map unit 5: Very dark grey' surface soil with silty loam texture
overlies a light grey silty loam to silty clay subsoil; the silt
content decreases with depth and at about 30 to 100 cm (coarse)
sandy clay loam is observed with a light grey color.These soils occur
in the lowest parts of the landscape, the swampy valley bottoms.
These soils are the only ones in the survey area, which have a
groundwater level within 1.0 m throughout the year. On trees
in this unit a clear indication of very high floodwater levels
could be observed; a height of 2.1 m above the soil surface was
marked by distinct moss growth on trees. In order to indicate
its wetness, the soil drainage of this unit is given as very
very very poorly drained. The surface occupied is estimated
to be 15*.
Two detailed soil surveys in Sierra Leone.
For the sake of information the data of two areas in Sierra
Leone are given:
- the Pendembu agricultural experiment station
- the cocoa and coffee experimental station at Kpuabu, west of
Kenema.
Both areas were surveyed by FA0 (either Sivarajasingham or
Stark). The actual description of the map units will not be given.
Only the correlation with the framework will be indicated. More
details about the soils can be found under the respective soils
series in Appendix I.
Pendembu: The area near Pendembu is mapped at scale 1:10 000
(fig. 28). The well and moderately weli drained part of the land
is represented by the following series (between brackets the
concurrent series of the framework):
- Waima and Giema (B), Yumbuma (T2), Segbwema (W), Vaahun (Z)
and Tisso (G). Vaahun and Segbwema are situated on the highest

- 10U -
Map symbol Series
framework
Pendembu S
Pendembu- S / A S / W > S/B+
shallow Giema
Yumbuma
Waima
B
T2
B
Segbwema W1
Vaahun Z
Tisso
Moa
Blama
K eya
+ intergrades
G
A
M2
H1
Fig. 28. Soil map of the Pendembu Agriculture Experiment Station
(derived from Sivarajasingham, Stark 1968).

- 105 -
places with the äbeepest slopes. The other series occupy the
remaining uplands.
- Pendembu shallow (intergrade between series S and A, B or W)
is located at intermediate positions between the upland and
the lower slope.
- Pendembu (L/S) is a moderately well to imperfectly drained
light textured soil formed in gravelfree to sligthly gravelly
colluvial material, situated in upland depressions.
-The remaining three map units are Moa (A), representing imper
fectly drained terrace soils, Blama (M2) and Keya (M1) repre
senting the heavy and light textured respectively, poorly drained
floodplain soils.
Kpuabu: The area near Kpuabu (fig. 29) is partly characterized
by the same soil series:
- Waima, Segbwema and Tisso (upland)
- Pendembu (intermediate)
- Moa and Blama (terrace, floodplain).
Other series are:
- Manowa (B), a very common soil, comparable to Waima and Giema.
- Fanima (D, U); apparently not found in the survey area near Pen
dembu, the Famina series is characterized by lateritic gravel
near the surface, without gravel beneath.
- Panderu (S) is similar to Pendembu series, apart from the occu
rence of gravel in the subsoil.
- Kparya (M2) is a relatively heavy textured, poorly drained
floodplain soil, usually with a sandy clay loam texture.
Comparing these two Sierra Leonean areas with the areas sur
veyed in SW-Liberia the apparent difference is found in the occur
rence of Fanima, Segbwema and Vaahun soils,which do not occur in
the south-western Liberian areas. It is known that Fanima and Segbwema
series are found in Upper Lofa in Liberia, where the local names
are Konjo and Comasadu. Vaahun series probably can be found in
SW-Liberia on the steeper slopes of hill peaks.

- 106 -
Series
Map symbol framework
M Manowa B p *" anima U
T Tisso G w Waima B
^ Segbwema W1 P Pendembu S P Panderu G or L
Ho Hoa A bBlama M2 K Kparva M2 5 Swamp ?
Fig. 29« Soil map of the Cocoa and Coffee Experimental
Station, Kpuabu, Sierra Leone (derived from
Sivarajasingham, Stark 1968).

- 107 -
k. LAND EVALUATION
U.1 Introductory
Sivarajasingham (1968) applied the capability classification
of Klingebiel and Montgomery (1961). Later Odell-'et al. (197*0
used the same system for more soils of Sierra Leone. With the
appearance of the modern land evaluation method (Beek and Ben-
nema 1972, FAO 1976), Bleeker (1976) devised a quantitative
rating system for the most important land qualities for Sierra
Leone. The suitability of land for four land use possibilities
in Bleeker's system was determined by the severeness of limi
tation of each land quality and the number of limitations. The
four land use possibilities were: arable crops, tree crops,
pastures and paddy rice.
Bleeker's system was used by Birchell et al. (1979) in a
modified way. Eight land characteristics were defined, which
were related to five land qualities. Each land quality was
build up by one or more of these land characteristics. However,
each land characteristic determined the suitability of the
land in its own specific way and not always by way of land
qualities. E.g. a soil with a low water holding capacity, situated
in a high rainfall zone, could be determined to have a rela
tively low suitability, although the actual land quality "availa
bility of water" should have a rating sufficient for a higer
suitability.
A strong improvement made by Birchell in Bleeker's system
consisted of thé separation of land use possibilities into
single crop cultivation possibilities. However, only one manage
ment level was considered: as the current (traditional) level
was assumed of no importance for agricultural development aims
and thus for the land evaluation, only an improved level was
defined. This level included improvements such as better per
forming crop varieties, fertilizer application, drainage, etc.
As final result, Birchell et al. gave suitability maps for
Sierra Leone for eight selected crops; due to-the scale of these
maps the length of the growing season as main part of the land
characteristic "climate" (being the major component of the
land quality "availability of water") is actually the only
distinct parameter for the devision of suitability zones.

- 108 -
Van Mourik (1978) used the method of Birchell et al. in a
modified way. After defining Fanfant's soil families in each
land facet, the land characteristics of all occurring facets
were determined. By using Bleeker's morphometric method and
applying the result to the suitability determination method
of Birchell, the suitability for ten selected crops resulted.
However, the suitability map shows a very generalized picture,
which only divides western Liberia into three parts:
- areas with steep slopes and a hilly topography, being un
suitable
- areas with moderate steep slopes and an undulating to rol
ling topography, being poorly and fairly suitable in an asso
ciated way
- areas with gentle or gentlier slopes, being suitable.
The determined suitability applies to the dominant part of the
land facet and was only described in terms of suitable crops
for the constituent components of the land systems. The map
units on the suitability map of a scale of 1:500 000, however,
present the suitability of the land systems, for which again
the dominant part of each land system was taken. The management
level for which the suitability was determined is the same im
proved traditional management level as used by Birchell et al.
Land evaluation approach of this report.
In this report the land evaluation approach followed re
sembles the one worked out in detail by Birchell, Bleeker and
Cusani-Visconti (Birchell et al. 1979)» "but amended to the
approach of detailed land evaluation as was used in SW-Nigeria
(Veldkamp, 1979). The following changes, in comparison to
Birchell et al., have been made:
- the land qualities are as much mutually independent as
possible; land characteristics forming the components of a
land quality are combined up to the level of the land quality.
The land quality rating is the one used in the matching pro
cess with the land use requirements.
- the framework for soil classification (cf. paragraph 3.3)
forms the basis for land evaluation at the detailed level.
Each series, phase and sub-phase has its own set of charac
teristics, which will be transformed into ratings for land
qualities.

- 109 -
- only the agricultural system of the common smallholder is
involved in the approach. Commercial farming, e.g. large-
scale plantations or holdings are hardly or not mentioned.As the
used land evaluation approach is concentrated on crops, the
suitability of a crop for such commercial systems could have
been identified, but as the circumstances of farming are
economically very different from the smallholders type of
farming, such systems have been omitted.
- the land evaluation directed to the smallholders farming sy
stem takes place at three management levels; traditional, im
proved traditional and western. Major improvements like large-
scale irrigation, mechanization is thought not to be feasible
within smallholders agriculture due to socio-economic reasons
as well to reasons connected to the less suitable landforms
prevailing within the MRU-area and these improvements are not
included in the management levels.
- only one land utilization type is considered. The differentia
tion between the three management levels is the only
difference made in the studied land utilization, which is
assumed not enough to be separated into more than one land
utilization type as described by Beek (1978). The one land
utilization type can be described as:
produce: major and minor food crops and some cash crops
labour : high labour intensity
technology: low, no mechanization, no draught-animals,
only hand labour,
scale of operations: farm size small (less than 3 ha);
plot size small (less than 1 ha)
technical knowledge level: low to moderate
- the timing of field operations depends on weather conditions
and availability of labour.
- the level of crop husbandry is moderate for annual crops and
poor to fair for perennial crops; especially for the latter
crops improvements are suggested for the higher management
level.
- the use of inputs is low.
- the water control is poor to moderate, using hand labor to
level plots and make and restore bunds.
- marketing of supplies usually forms only a small part of the
total produce

- 110 -
recurrent capital inputs: these are low and remain relati
vely low in the higher management levels.
A detailed picture of the farming system in the MRU-area will
not be given. Only some main characteristics are described in
paragraph H.U.1. Further reference is made to the many publi
cations covering this aspect (among others Mc.Courtie 1973,
Van Santen 197^, Odell et al. 197U, Carpenter 1975, Birchell
et al. 1979).
The land evaluation procedure followed in the report is a
physical land evaluation in the first place. Economic analysis
takes place after the physical land evaluation in order to ob
tain a constant physical base, which can be re-evaluated with
changed economic circumstances; land characteristics and there
fore land qualities are considered to be more or less constant
with time, apart from annual dynamics.
Crops and the cultivation of crops during a certain period
are the main land use types to be involved in the applied land
evaluation approach. After the physical land evaluation, sui
table crop combinations and rotations can be worked out, together
with some socio-economic considerations.
The impact of improvements (the management specifications
of the improved and western management levels in reference to
the traditional level} in the land evaluation procedure is dealt
with in three different ways:
a) by their influence on the rating of one or more land quali
ties
b) by their influence on the crop requirements
c) by definition in the management levels.
The actual land evaluation procedure of this report is
carried out at the detailed level. Before going into this mat
ter, the methods of some land evaluations at smaller scales
(exploratory, reconnaissance and semi-detailed) as used during
the last 12 years in Liberia and Sierra Leone will be shown in
paragraphs k.2 and k.3.
h.2 Exploratory-reconnaissance scale
Exploratory: whole MRU-area
An exploratory land evaluation of the whole MRU-area has

- 111 -
been made on the basis of data given by Birchell et al. (1979).
and van Mourik (1979). The land evaluation procedure as was
used in both reports was described in paragraph U.1.. The basic
data are the land systems and their land facets, the distribu
tion of land facets per land system, the land characteristics
of the land facets and a rating system of land characteristics
to determine the suitability for crops (under one, improved
traditional management level).
Modifications applied on the basic data.
Although the results of the applied exploratory land eva
luation of the whole MRU-area are based on the data of both men
tioned reports, the following modifications have been made:
- the zonation of the MRU-area according to the length of the
growing season has been changed, particularly in the Liberian
part.
- the soil fertility aspect is a more severely limiting factor
to suitability in Birchell1s report compared to van Mourik;
the former has been applied for the whole MRU-area.
- the suitability for swamp.rice in the Coastal Plain has been
considered only poor under improved traditional management in
contrast to higher suitabilities as was presented in the other
reports. More sophisticated measures than proposed are thought
necessary to cultivate the lowlands.
- the suitability for swamp rice in the alluvial and lacustrine
plains (land system Zuani/Fondoo (Liberia) and Newton and
Torma Bum (Sierra Leone)) has been considered poor to good
without a further specification: for the interior Basement
Complex the suitability is considered fair to good.These ranges
in suitability have been applied as enough data on water con
trol and drainage are not available.
- the suitability for cocoa has been considered either poor to
fair or fair, but never good, as the fertility status of the
better suitable soils is assumed to be too low.
- the suitability for coconut has been considered for the whole
MRU-area and not limited to the Coastal Plain.
- the suitability for cocoa, oil palm, rubber and dryland (up
land) rice has been derived from van Mourik and the suitabi
lity for cashew and coconut was derived from Birchell et al.
and extrapolated to the whole MRU-area.

- 112 -
Methodology
The land evaluation methodology is based on the framework
for land evaluation (FAO, 1976). Each land system is divided
in land facets. Each facet has its own characteristics. The rele-
Tarfc land characteristics (or land factors) are rated according
to four to six classes, depending on the kind of characteristic.
On the other hand, the requirements of crops are determined by
way of minimum ratings of each land characteristic for a certain
suitability class. There are four suitability classes; they are
linked to expected crop yields under an improved traditional
management level (using fertilizers, improved varieties or cul-
tivars, improved husbandry, drainage and in some cases insec
ticides). The suitability is found by determining the most li
miting land characteristic for a crop.
Selected crops
Nine crops have been selected. They are: rice (divided into
upland, rainfed or dryland (upland) rice and swamp or lowland
rice) and cassava as food crops; coffee (robusta, liberica),
cocoa, rubber, oil palm, citrus (orange, grapefruit, lime),
cashew and coconut as cash crops. Apart from cashew, all of
these crops have major importance in the present agriculture of
the area.
Result
The result of the land evaluation is shown in table 18 and
fig. 30* The MRU-area was divided into 19 units with each its
own. percentage of suitable land and its own number of suitable
crops. For each crop the percentage of suitable land within the
unit was specified, together with the suitability class. The
latter was expressed as good, fair or poor (the fourth -unsui
table- was neglected; the poor suitability class was only Used
for citrus and cocoa). Often two classes are given, as crops
may be well or fairly suited within the units or their suita
bility just varies between the two classes.
Cashew and coconut appear in all units. Their requirements
are relatively low. The same applies to cassava, dryland (upland)
The scale of fig. 30 is rather small. If this figure is needed for
practical purposes figs, h and 6 should be combined. Use of the
original 1:500,000 land systems map enables the user to obtain an
even larger scale map.

Fig. 30. Suitability (or nine major crops in the Mano River Unioin area (Sierra Leone / Liberia)
LEGEND (for details see tent)
a. 4 2
•o c 2
•s US S3,
|3«.
ill Suitable crops
w 1 9«
2 9»
3 9«
1 96
5 9S
6 98
7 68
8 84
9 70
10 47
» 47
12 49
11 52
14 29
15 21
16 21
17 6
I t 6
. 19 6
10
9
7
6
5
5
7
5
7
10
9
6
2
10
3
6
10
9
6
Ch.Cn.Ct.ur.Sr.Ct.Co.Op. Cc.Ru
im 1 9«
2 9»
3 9«
1 96
5 9S
6 98
7 68
8 84
9 70
10 47
» 47
12 49
11 52
14 29
15 21
16 21
17 6
I t 6
. 19 6
10
9
7
6
5
5
7
5
7
10
9
6
2
10
3
6
10
9
6
CK Cn.Ct:Ur.S>. Ct, Co.Op.Cc
1 9«
2 9»
3 9«
1 96
5 9S
6 98
7 68
8 84
9 70
10 47
» 47
12 49
11 52
14 29
15 21
16 21
17 6
I t 6
. 19 6
10
9
7
6
5
5
7
5
7
10
9
6
2
10
3
6
10
9
6
Ch.Cn.Ca.Ur. Sf. Co.Op
1 9«
2 9»
3 9«
1 96
5 9S
6 98
7 68
8 84
9 70
10 47
» 47
12 49
11 52
14 29
15 21
16 21
17 6
I t 6
. 19 6
10
9
7
6
5
5
7
5
7
10
9
6
2
10
3
6
10
9
6
Ch.Cn. Ct .Ur .Sr .CI
1 9«
2 9»
3 9«
1 96
5 9S
6 98
7 68
8 84
9 70
10 47
» 47
12 49
11 52
14 29
15 21
16 21
17 6
I t 6
. 19 6
10
9
7
6
5
5
7
5
7
10
9
6
2
10
3
6
10
9
6
5
1 9«
2 9»
3 9«
1 96
5 9S
6 98
7 68
8 84
9 70
10 47
» 47
12 49
11 52
14 29
15 21
16 21
17 6
I t 6
. 19 6
10
9
7
6
5
5
7
5
7
10
9
6
2
10
3
6
10
9
6
Ch.Cn.Ct.Ur.Sr.
6
1 9«
2 9»
3 9«
1 96
5 9S
6 98
7 68
8 84
9 70
10 47
» 47
12 49
11 52
14 29
15 21
16 21
17 6
I t 6
. 19 6
10
9
7
6
5
5
7
5
7
10
9
6
2
10
3
6
10
9
6
Ch. Cn.Cl.Ur. Sr
7
1 9«
2 9»
3 9«
1 96
5 9S
6 98
7 68
8 84
9 70
10 47
» 47
12 49
11 52
14 29
15 21
16 21
17 6
I t 6
. 19 6
10
9
7
6
5
5
7
5
7
10
9
6
2
10
3
6
10
9
6
Ch.Cn. Ca. U'. Sr. Co. Op
üiri
1 9«
2 9»
3 9«
1 96
5 9S
6 98
7 68
8 84
9 70
10 47
» 47
12 49
11 52
14 29
15 21
16 21
17 6
I t 6
. 19 6
10
9
7
6
5
5
7
5
7
10
9
6
2
10
3
6
10
9
6
Ch.Cn.Ct.Ur.Sr
9
1 9«
2 9»
3 9«
1 96
5 9S
6 98
7 68
8 84
9 70
10 47
» 47
12 49
11 52
14 29
15 21
16 21
17 6
I t 6
. 19 6
10
9
7
6
5
5
7
5
7
10
9
6
2
10
3
6
10
9
6
Di .Cn.Ct .Ur . Sr. Co.Op
g l 12
1 9«
2 9»
3 9«
1 96
5 9S
6 98
7 68
8 84
9 70
10 47
» 47
12 49
11 52
14 29
15 21
16 21
17 6
I t 6
. 19 6
10
9
7
6
5
5
7
5
7
10
9
6
2
10
3
6
10
9
6
Ch. Cn. Ca.Ur. Sr. CI. Co.Op.Cc.Ru
Cli.Cn.C<.Ur.Sr.CI.Co.Op.Cc
Ch.Cn.Ct.Ur. ST. CI
^
1 9«
2 9»
3 9«
1 96
5 9S
6 98
7 68
8 84
9 70
10 47
» 47
12 49
11 52
14 29
15 21
16 21
17 6
I t 6
. 19 6
10
9
7
6
5
5
7
5
7
10
9
6
2
10
3
6
10
9
6
Ch.Cn
PH
1 9«
2 9»
3 9«
1 96
5 9S
6 98
7 68
8 84
9 70
10 47
» 47
12 49
11 52
14 29
15 21
16 21
17 6
I t 6
. 19 6
10
9
7
6
5
5
7
5
7
10
9
6
2
10
3
6
10
9
6
Ch. Cn. Ca. Ur.Sr.CI. C O . O P . C C . R U
Ä
1 9«
2 9»
3 9«
1 96
5 9S
6 98
7 68
8 84
9 70
10 47
» 47
12 49
11 52
14 29
15 21
16 21
17 6
I t 6
. 19 6
10
9
7
6
5
5
7
5
7
10
9
6
2
10
3
6
10
9
6
Ch.Cn.Ci.Ur.Sr.Cl.Co.Op.Cc
16
1 9«
2 9»
3 9«
1 96
5 9S
6 98
7 68
8 84
9 70
10 47
» 47
12 49
11 52
14 29
15 21
16 21
17 6
I t 6
. 19 6
10
9
7
6
5
5
7
5
7
10
9
6
2
10
3
6
10
9
6
Ch. Cn.C». Ur.Sr. Cl
17
1 9«
2 9»
3 9«
1 96
5 9S
6 98
7 68
8 84
9 70
10 47
» 47
12 49
11 52
14 29
15 21
16 21
17 6
I t 6
. 19 6
10
9
7
6
5
5
7
5
7
10
9
6
2
10
3
6
10
9
6
Ch. Cn. Ca.Ur. Sr. a. Co.Op. Cc. Ru
Ch.Cn.Ct.Ur.Sr.CI.Co.Op.Cc
19
1 9«
2 9»
3 9«
1 96
5 9S
6 98
7 68
8 84
9 70
10 47
» 47
12 49
11 52
14 29
15 21
16 21
17 6
I t 6
. 19 6
10
9
7
6
5
5
7
5
7
10
9
6
2
10
3
6
10
9
6 Ch.Cn.C1.UT. Sr. CI
Ch.cashtw; Cn»coconut; Ca« cassava; Ur«upland r i e t ;
S r v s w a m p r l c t , C U c l l r u i ; Cos c o H t e ( r o b u s l a ) ;
Op« oil p*im; Cc* coco«; R U E rubber
Map u n i t * 1 10 19 Art in decreasing ordtr of * i . total suitable Und and Iht number ot suitable crop».
I

I
Table 18 D e t a i l s about the s u i t a b i l i t y of nine maj or crops i n t h e MRU-area 1
Map Tota l surface (km^ {% of MRU-area)
% s u i t a b l e land
Number of s u i t a b l e c r o p s , out
of t e n
S u i t a b i l i t y of crop and % of land su i t ed per crop g = good, f = f a i r , p = poor)
un i t To ta l surface (km^
{% of MRU-area) % s u i t a b l e
land
Number of s u i t a b l e c r o p s , out
of t e n cashew coconut cassava upland r i c e swamp r i c e c i t r u s coffee o i lpa lm cocoa rubber
1 7,1+95 •16.UJ 98 10 f ,85 g,85 f ,85 f ,85 f -g ,13 P - f ,85 f -g ,85 f -g ,85 p-f , 6 g,85 2 19,170 M.9) 97 9 g,85 g,85 f -g ,85 f -g ,85 f -g ,12 p - f , 8 5 f -g ,85 f -g ,85 f, 8 3 1+10 0.9) 98 7 g,85 g,85 f -g ,85 f -g ,85 P-g,13 f -g ,85 f -g ,85 1+ 1,325 2 .9 ; 96 6 g,85 g,85 f -g ,85 f -g ,85 f-g,11 P - f , 8 5 5 1+50 k 1.0] 98 5 .. g,85 g,85 f -g ,85 f -g ,85 p -g ,13 6 30 k 0 . 1 ) 98 5 g.^9 g,^9 f -g ,^9 f - g , 1+9 P-g,^9 7 300 k 0 . 7 ) 88 7 g , 8 g , 8 f - g , 8 f -g , 8 P-g,80 f - g , 8 f - g , 8 8 500 , 1 .1 ) 81+ 5 g , 8 g , 8 f - g , 8 f -g , 8 P-g,76 9 11+0 k 0 . 3 ) 70 7 g,62 g,62 f -g ,62 f ,62 f - g , 8 f -g ,62 f -g ,62
10 1 , 7 7 5 ( 3 .9 ) hi 10 f,l+2 sM f,l+2 f,1+2 f -g , 5 p-f,l+2 f - g , 1+2 f - g , 1+2 p-f , 3 g,U2 11 7,050 [15.U) hi 9 g > 2 BM f - g , 1+2 f - g , 1+2 f - g , 5 p-f,l+2 f - g , 1+2 f - g > 2 f, 3 12 150 0 . 3 ) ^9 6 g,M+ &M t-g,kh f - g , 1+1+ f - g , 5 p-f,l+l+ 13 965 k 2.1) 52 2 f ,52 f ,52 ^k 1,360 3.0) 23 10 f ,21 g,21 f ,21 f ,21 f - g , 2 P- f ,21 f -g ,21 f -g ,21 p-f , 2 g,21 15 2,81+5 6.2) 21 9 g.18 g.18 f -g ,18 f -g ,18 f -g , 3 P - f , l 8 f -g ,18 f -g ,18 f, 2 16 200 k 0.1+) 21 6 g.18 g.18 f -g ,18 f -g ,18 f - g , 3 P - f , l 8 17 325 k 0.7) 6 10 f, h g , h f, h f, h f - g , 2 p- f , 1+ f - g , h f - g , 1+ p-f , 1 g , h 18 1,260 2.8) 6 9 g, h g, h f - g , h f - g , h f - g , 2 P-f, h f - g , h f - g , h f, 1 19 50 0.1) 6 6 g , h g , h f - g , h f - g , h f - g , 2 P-f, h
1+5,800

- 115 -
rice and swamp rice, but with the exception of unit 13 represen
ting the Coastal Plain. Citrus can be grown in several units,
but the soil fertility in.these units is rather low for this
crop. Coffee and oil palm are suitable in all units except the
Coastal Plain and the areas with a relatively short growing
period (situated in the most eastern and western parts of the
MRU-area). Cocoa can only be grown satifactory on special fa
cets (terraces) of the land systems and the percentage of sui
table land indicated in the table is low. Rubber is only sui
table in the wettest parts of the area.
Generally, a large part of the MRU-area is suitable for one
or more crops under the improved traditional management level.
Units 1 and 2: 58.3% of the MRU-areaj almost all parts of these
units are suitable for all included crops, although the culti
vation of rubber in unit 2 is not recommended.
Units 3 and 5: 1.9% of the MRU-area or approximate 860 km2;
this land probably has the highest potential for agricultural
development, as most soils are not gravelly and erosion hazard
is only slight or none.
Unit k: 2.9% of the MRU-area; comparable to units 1 and 2, but
with a shorter growing period, making this unit unsuitable for
coffee, oil palm, cocoa and rubber.
Unit 6: 0.1% of the MRU-area; this unit comprises a small area
of boliland on the eastern side of the Sewa river in Sierra
Leone; the main crop for this area is swamp rice, although its
cultivation needs a high level of management.
Units T and 8: 1.8% of the MRU-area or approximate 800 km2; ac
cording to Birchëll et al. théëe ühits are generally considered
to be one of the best suited for agriculture; however, some
feasibility studies revealed severe limitations in terms of
flooding, drainage and soil fertility; rice (floating and swamp
rice) seems the most suitable crop; a high level of management
is needed.
Units 9 to 19: these units are characterized by one of the follo
wing characteristics: shallow soils, relatively steep slopes
and are often poorly accessible; in unit 13, the Coastal Plain,
the soil fertility is very low and from the selected nine crops
only cashew and coconut can be cultivated; generally the units
9 to 19 should not be considered for agricultural development,
as enough suitable land is available elsewhere in the MRU-area;
forestry development would be more appropriate in these units.

- 116 -
Reconnaissance; Kenema-Pendembu area
The area in north-eastern Sierra Leone, as was shown in
fig. 7 will be used again to 'show the land evaluation result
at reconnaissance level. In the original publication (Sivarajasing-
ham, 1968) the scale of the interpreted, map units was approxima
tely 1: 80,000. The land evaluation method resembles the USDA
- capability classification system of Klingebiel and Montgomery
(1961). The capability grouping is a system of land evaluation
used to show the relative suitability of soils (land) for crops
and forestry. Land units and their characteristics are evaluated
according to limitations on:
- erosion hazard (e)
- excessive water (w)
- soil characteristics like gravelfy, shallow soil depth, low
available water-holding capacity (s).
The resulting five map units are shown in fig.31. A recon
naissance land evaluation can only be made on a broad basis.
The map units have their own suitability for broadly described
land use possibilities. Land units had to be combined (especially
due to the extra-reduction to 1:7^0,00), while the actual sui
tability could not be specified for crops. Climatic differences
within the mapped area were not taken into account.
Comparison between the giyen examples (exploratory and recon
naissance) can hardly be made, because both examples differ
extremely. Table 19 summarizes these differences. In both exam
ples a tremendous generalization has taken place; either by
assuming a certain pattern of soils (and therefore a clear
picture of land characteristics) in one land facet or omitting
differences among crops and thus avoiding specifications on
the suitability of crops. At reconnaissance or smaller scale
one cannot expect to find a suitability map showing enough
detail to locate suitable sites for a particular crop. It
either results in a suitability map mainly based on clima-
tological differences affecting crop performance without a
delineation of suitable soils (like Birchell et al., 1979)
or in a map based on broad map units and broad land use pos
sibilities, which only gives the reader a very generalized
idea of differences in suitability (like in Sivarajasingham,
1968).

- 117 -
Fig« 31. Sketched reconnaissance land suitability map of a part
of the Eastern Province, Sierra Leone (after Sivarajasingham,
Stark 1968). Scale 1:7^0,000 (scale of original interpreted
map units 1:80,000).
Legend.
Map unit Potential land use :
Main a
sui tabili b
good
fair
ty classes c
good fair
Inclusive sui a
t. b
2 classes
c
H good fair
sui tabili b
good
fair
ty classes c
good fair
very good good
fair
t. b
fair 111 U M I
good fair
sui tabili b
good
fair
ty classes c
good fair
very good good
fair
t. b
rl Hi Ml
good fair
sui tabili b
good
fair
ty classes c
good fair
very good good
fair
t. b
L.r"~".'",i
good fair
sui tabili b
good
fair
ty classes c
good fair
very good good
fair
t. b
fair t..: . .:J
good fair
sui tabili b
good
fair
ty classes c
good fair
very good good
fair
t. b
lllllll! 1 1
good fair
sui tabili b
good
fair
ty classes c
good fair
very good good
fair
t. b
fair
Notes. Potential ,land use: a. wide range of crops; b. tree crops or forestry ; c. forestry.
2 Inclusive suitability classes are estimated to cover less than 30 % of the total surface of the map units.
3 • The suitability for forestry was not determined, but map units which do not have a good or fair suitability for agriculture are automatically assumed to be suited for forestry; the division between good and fair is based on topography only.

Table 19 Summary of differences in the land evaluation methodology of two studies
Basic data Whole MRU-area Kenema-Pendembu-area Remarks
Level of detail Interpretation unit Land evaluation method
- Land use unit
Result of land evaluation
Exploratory Land facet Quantitative description of land characteristics and determination of suitability according to a comprehensive system Crop under improved traditional management level
Determined suitability class for crop in a land facet
Reconnaissance Combination of soil associations Qualitative (relative) grouping of units on basis of three limitations
Cropping system (annual crops, tree crops, forestry)
Determined most appropriate land use for each map unit
Very different The determination of land characteristics per land facet is dubious, and in fact not more accurate than the grouping based on few limitations.
The specific suitability determination for crops is doubtful without a soil-base; differences in suitability of crops are based on broad land characteristics only. On the other hand suitability of cropping systems generalizes crop differences mainly to length of cultivation, rooting depth and adaptability to high groundwater levels. See above.
00
i

- 119 -
k.3 Semi-detailed scale
Land evaluation is most difficult at semi-detailed scale.
The basic data are intermediate between the generalized re
connaissance-exploratory level and on the other hand the spe
cified detailed level. Two ways can be followed to arrive at
a semi-detailed,land evaluation methodology:
- Division of broad units from reconnaissance scale maps and
further specification of details required to obtain a rele
vant and realistic land evaluation (both in terms of land
delineation as well as description'of land use possibilities).
Such a methodology was actually followed by the reports men
tioned in the former paragraph (Birchell et al., 1979 and
Sivarajasingham, 1968). Both reports were originally meant
to show results at bigger scales than shown in this report.
Still, a clear semi-detailed result has not been reached.
Too much generalization or the lack of soil data does not
suffice for such a level of detail.
- Generalization of results from detailed land evaluation
efforts. This method, as followed in this report, is based
on the determination of the suitability of a certain crop
for a specified soil. Management specifications and their
effect on the suitability are included to some extent, but
were kept of minor importance only (cf. paragraphs U.I and
U.U.1). The detailed land evaluation method tries to iden
tify all possible land characteristics., which are relevant
for land evaluation. Land use is specified according to
crops and management level. The resulting suitabilities can
be generalized in various ways. The most common one, in order
to arrive at a semi-detailed level, is the generalization
of land units and a combination of suitabilities for crops
for the constituent parts of the combined (semi-detailed)
map units.
In the next paragraph the detailed land evaluation metho
dology will be described. Later in this report (chapter 5) a
summarization of details into the semi-detailed level will be
applied to SW-Liberia and further extrapolated to the MRU-area.
An interesting land evaluation methodology was practized
by Agrar- und Hydrotechnik in the study on Nimba county, Li
beria. Reference is made to paragraph 3.^.2, where this study

- 120 -
was mentioned as far as semi-detailed mapping was concerned.
The methodology of land evaluation follows the capability
classification, being the same as applied by Sivarajasingham.
The legend of the suitability map of Nimba is given in Table
20. A limitation, additional to the three ones mentioned in
the former paragraph, is fertility (f). Apparently class I,
very suitable, without limitations, does not occur at the
used scale. Table 20 can be compared with Table 9 (paragraph
3.U.2). Further details of the land evaluation of Nimba county
are presented in Tables 21 and 22.
Table 21 shows the comparison between the extent of the
semi-detailed and reconnaissance map units and the description
of the potential land use, which is more detailed than the one
mentioned in Table 20. At the end of the Nimba report, a pro
posal (given here as Table 22) is given for a more detailed
land evaluation methodology, which was not actually applied
by Agrar- und Hydrotechnik. They suggested to apply the check
list for suitability classification after their semi-detailed
result. The checklist uses soil survey data as slope degree,
depth of gravel, the occurrence of a dark colored, humic sur
face soil ("umbric" epipedon, see Soil Taxonomy, p.'17 ) and
physiography. The land use possibilites based on these charac
teristics are given in broad terms and are based on generalized
criteria, specially with respect to crops. A difference in re
quirements between crops like cocoa and coffee, or oil palm and
rubber are not included in the evaluation.
h.k Detailed and very detailed scale
Land evaluation can be done most accurately at the detailed
level. At such a level relevant characteristics, both of land
and land use, can be incorporated satisfactory. The typical
management level (for the MRU-area the traditional "bush fallow"
system) and improved management levels can be compared.

- 121 -
Ie 20 Legend of the suitability map of Nimba county, Liberia, scale 1:50,000 (Agrar- und Hydrotechnik, 1978)
>ss Subclass
Symbol of Agricultural Physiographic unit semi-detailed Soil families i?lita+iong
soil survey
Potential land use Area in ha
Percer.'.ag-: of
tut.nl ar'-a
Concave footslopes B1 Weledu Low fertility All annual crops and tree crops
1» 7o0
Undulating upland and dissected peneplain
B2 Weledu, Foya. Gravel at Comasadu, varying
B3 Konjo, Dalia depth, low Ngissankonja fertility
All annual crops; moderately deep or deep rooting tree crops; locally only annual crops and shallow rooting tree crops
57 120
Flood pluin
Rolling upland
Footslopes of high hills, rolling and hilly upland
A2 Makona. Bomi, ' Flooding Weledu hazard
Rice; all annual crops
3 750
Bit Foya, Weledu, Konjo, Dalia, Ngissankonja
Gravel and locally bedrock at shallow depth; erodibility; irregular topography;
Annual crops; only locally shallow rooting tree crops; if slopes >16$ forest
16 660
B5 Sheloe, Foya, Bedrock or gravel Weledu, Konjo, at shallow to Dalia, Ngis- moderate depth;
B6 sankonja erodibility; irregular topography; low fertility
Forest; 9 520 only very locally annual crops and shallow or moderately deep rooting tree crops
11»
Swamps A1 Dalia.Ngissan- Waterlogging konja. Weledu
Rice 21 1»20
Moderately steep to very steep eroded slopes
C1+C2 Sheloe. Weledu Stoniness; erodibility; steepness; shallow soils; ironstone gravel; . low fertility
Forest 5 950
underlined, sou. families are dominant ones.

Table 21 Comparison between the extent of map units in the semi-detailed and the reconnaissance survey of Nimba county, Liberia and the land use possibilities (derived from Agrar- und Hydrotechnik, 1978)
Capability Semi-detailed Reconnaissance
class Map symbol Extent (km2) % Map symbol Extent (km 2) %
II f B1 1+760 k III s B2+B3 57 120 kQ B1+B2 379 697 53 IV w A2 3 750 3 A2 32 20k k IV s Bk • 16 660 1U B3 171 900 2k
IV e B5+B6 9 520 8 —
V w A1 21 U20 18 A1 hi 792 6 VI e C1+C2 5 950 5 C+D 95 227 13
Potential Land use description'
**
Total: 119 180
1, 2, 3, k, 5 2, k, 5; only locally 2, 3 1»2 2; only locally 3; if slopes more than 16$ forest forest; only very locally 2 , 3 , ^ 1 forest
Total: 720 900
Note: **
Description of potential land use.
1. Paddy rice
2. Upland-dryland rice and other annual crops, like cassava, sugar cane, various vegetables, groundnuts (all these crops require only shallow rooting depth of about 30 cm or less)
3. Shallow rooting tree crops like cashew (which would grow with a rooting depth of less than 30 cm)
k. Moderately.deep rooting tree crops like coffee, cocoa (shich would grow with a rooting depth of less than 80 cm)
5. Deep rooting trees like rubber, oil. palm (rooting depth should be more than 80 cm)
ro ro

- 123 -
Table 22 Proposed checklist for suitability classification at a more
detailed scale in Nimba county, Liberia (derived from Agrar-
und Hydrotechnik, 1978, Annex I, Table 6)
Concave footslopes: - gravel deeper than 80 cm:
- umbric A-horizon - very suitable for annual crops
and all tree crops
- no umbric A-horizon - suitable for annual crops
and all tree crops
- gravel 30-80 cm - suitable for annual crops and
moderately deep and shallow rooting tree crops.
Upland : _ slope less than 5%:
- gravel deeper than 80 cm
- umbric A-horizon - very suitable for annual
crops and all tree crops
- no umbric A-horizon - suitable for annual
crops and all tree crops
- gravel 30-80 cm - suitable for annual crops
and moderately deep and shallow rooting tree.
crops
- gravel 0-30 cm - suitable for annual crops and
shallow rooting tree crops
- slope 5-8$:
- gravel deeper than 80 cm - suitable for all tree
crops
- gravel 30-80 cm - suitable for moderately deep
and shallow rooting tree crops
- gravel 0-30 cm - suitable for shallow rooting .
tree crops
- slope more than 8% - only suitable for forest
Valley : - swamp - suitable for paddy rice
- floodplain - suitable for rice and all annual crops

- 121+ -
4.1+.1 Agricultural characteristics and management
Agriculture in the MRU-area and in large parts of the rain
forest zone of west-Africa is characterized by its "small-scale",
i.e. farming of plots in a small farming system. A farming system
in those areas usually is a family enterprise in which the land
traditionally belongs to the community and is actually in tempo-
rary use by the farmer's family.
The risk of crop failure plays the most important role in
the agricultural system of the area. Yield must be sufficiently
high to feed the family, visiting relatives and other guests. In
years of low yields, people either suffer or have to go to neigh
boring areas to beg friends for food.
A second characteristic of the rain-forest zone is the lack
of mechanization; draught-animals do not occur, due to the pre
sence of the tse-tse-fly, while machinery has often failed to
work in a manner suitable under local circumstances. The usual
farm management level is low, compared to e.g. western-Europe
standards and the introduction of new farm machinary is not al
ways successful. One factor for such failures is associated with
the fallow period. As long as the fallow period is extremely im
portant in the farming system (especially for annual cropping),
the soil should not be cleared from roots and other remnants of
the former fallow vegetation, waiting to develop again after the
farming period (usually 2-3 years in case of crop systems involving
rice, cassava, vegetables). For the use of ploughs and harrowers
such remnants need to be cleared and the direct consequence is
a decline of the quality of thé following fallow vegetation. Such
a decline means a predominance of grasses which depress any more
woody vegetation types, while the latter is clearly preferred
by the farmer. Attempts to farm crops with a relatively short growing
period permanently, have failed, although a certain degree of (al
most) permanent farming has proven to be possible at some research sta
tions (e.g. UTA). This however, does not mean that farmers should
be encouraged to farm their land longer than what they are used
to do; on the other hand farmers will never do it, because they
know very well the hazards of such practices.
The third characteristic is the relatively low level of technical know
ledge. The way of farming is determined by traditions. Farming
systems in tropical rain-forest areas are vulnerable and experience

- 125 -
over many years has made people survive the generally bad soil,
water and climate conditions. It seems to be the only way to
cultivate the land on a sustained basis. Improvements are not
readily accepted, unless investment costs are low (e.g. by sub
sidized prices and making required items available at nearby
markets) and their effect tremendous (i.e. significant).
A fourth characteristic is the generally low extent of
cultivation of valley bottoms and swamps. Although such culti
vation practices have been implemented in many projects and have
been recommended by many agricultural scientists, acceptance of
such a form of agriculture has not (yet ?) taken place to a large
extent. Several factors contribute to the low grade in which
these relatively wet soils are farmed. Rice., being the most
suitable crop for such soil conditions, is the staple food crop
in the MRU-area and extention of rice cultivation has a very high
priority in agricultural planning. Technology for wetland rice
cultivation does exist, although not comparable to the Asian
level; especially water control (predominantly drainage) forms
the main problem. Wetland rice cultivation seems to be a tradi
tionally marginal form of rice cultivation, practized only when
the "upland" (dryland-rainfed) rice cultivation is thought to be
failing, e.g. due to drought problems during the early rainy sea
son. In such a case wetland paddy rice can still be planted. One
ef the problems encountered here is the quality of the rice pro
duct; wetland rice varieties are not preferred by the rural po
pulation. On the other hand the urban population is
willing to pay a reasonable price for such food (in fact, the ur
ban population is mainly eating imported, but wetland rice).
In view of these characteristics land evaluation is only
feasible when the actual farming circumstances are included in
the procedure; this means that existing limitations are only
partly solvable by introduction of more or better management.
For land evaluation, a standarization of management levels is
• necessary. The difference between these levels is defined in
as clear terms as possible. A relatively high management level
with sophisticated western management practices can only be
defined in relevant terms after the feasibility study of the
effects of practices proposed for such a management level. Still,
such a level should be within the physical and technological

- 126 -
limitations of the present rural population of the MRU-area.
On the other hand the traditional, current level of manage
ment is interesting as reference level. An intermediate ma
nagement level, named the improved traditional level, is in
cluded as. third one. These three management levels form the
basis of the direct involvement of the farmer into the land
evaluation process. Apart from management, land and crops
form the other ingredients.
The key attributes of land utilization types will not be
specified any further (cf. paragraph 1+.1). The land utiliza
tion on the MRU-area, if limited to the smallholder, can bet
ter be described as one utilization type and specified accor
ding to management level.
The three management levels are specified qualitatively
in Table 23. The differences among these levels are described
according to fertilization, water control, crop husbandry (in-
tensing of crop management, crop protection, pruning and the
use of a plant device). All these factors have an impact on
crop performance and thus on crop yield; these factors are
considered tó be implemented on a modest level, forming minor
improvements as defined by FAO (1976). Other factors, which
may have an effect on yield, are either not specified or out
side the scope of land evaluation, when limited to the physical
side of land use only.
Many other factors involved in crop management are not yet
specified. Some of them will be specified in the following sec
tion. Others, such as farm size, plot size, seed quality, plant
density and other ways of crop protection (e.g. chemical weed
control by herbicides), harvesting methods, erosion control
measures, etc. are either unrealistic or supposed to be equal
in all management levels.
The following factors need specifications:
- the kind of crop cultivar or variety: such a characteristic
is treated in the following way. The (eventually specific)
characteristics are not included in the land evaluation pro
cedure as applied in this report. The cultivar, if mentioned,
is seen as being the most suitable one and it is assumed that
a farmer, working at the assumed management level will use
that particular cultivar.

Table 23 Qualitative specification of three management levels according to selected feasible factors
Management level Traditional Improved traditional Western
Fertilization Very low or nil Low-moderate on some crops, none en others
Moderate-high on some crops, none on others
Water control: - floodplain None Planting on ridges during the
rainy season; some bunding and leveling for rice paddies
Planting on ridges during the rainy season; drainage measures; bunding and leveling for rice paddies
- swamp Some drainage Intermediate level of drainage High level of drainage in the rainy season and storage of water for (diversion) irrigation in the dry season.
Crop husbandry: - intensity of crop management
Low Moderate High
- crop pretection by chemical spraying
None or very low Irregularly on some crops only Regularly on some crops only
- pruning of some tree crops
None Some pruning Good pruning
- use of a plant device**, esp. for cocoa
None Yes Yes
Notes: The specification of crops on which fertilizers, c.q. crop protection chemicals are used and the amount and. kind of material are specified in the discussion on crop requirements (paragraph U.V.U)
** The plant device is meant to make a plant hole through gravelly soil layers to be filled with gravelfree surface soil material.
i
re
i

- 128 -
- the planting density; this characteristic will not be described
as such, as it is assumed that farmers will use a traditonally
determined density. In case of some cultivars however, especially
newly introduced ones, the density suggested by the research
station is considered to be the one used by the farmers.
- several crop husbandry aspects, such as weeding, bird control
(with rice), crop protection agaist groundhogs and rodents,
harvesting, threshing, etc. are assumed to be at a constant level
for all management levels, although a slightly better crop hus
bandry in the improved management levels has been assumed.
These assumptions do not influence the determination of the
physical suitability; they may have an effect on yield or on the
quality of the produce and therefore the price and the total gross
benefits of the produce. These factors are of interest for. econo
mic purposes and thus have only importance in the last stage of
the land evaluation procedure fter the determination of the
physical suitability.
Another point is the assumption that crop requirements do
not differ among cultivars or varieties, which is a generaliza
tion which actually needs more consideration..
Factors outside the scope of physical land evaluation are
storage, processing (milling), marketing facilities, price sta
bilization, cooperation measures, land tenure , among others.
Major improvements, being substantial and reasonably perma
nent improvements in the qualities of the land affecting a given
use for which large non-recurrent inputs are required (FAO, 1976)
are not included in the land evaluation procedure followed in this
report. The effect of ouch improvements cannot be overlooked in a
general way. For the implementation of major improvements local-
specific data are necessary, especially due to their usually great
socio-economic consequences. Physical land evaluation in such a
case would involve the prediction of crop yields before and af
ter the implementation in order to determine the feasibility of
the proposed improvement(s). Such predictions cannot be made
accurately without experiments and therefore outside the scope
of this report.

- 129 -
U.U.2 Land evaluation procedure
The procedure involves land, crops and management level.
Land will be discussed in paragraph U.U.3 and crops in U.U.U.
The management level has been discussed in the former para
graph. The procedure followed is comparable to the one used in SW-
Nigeria (Veldkamp,1979). First some definitions will be given.
Land is considered on basis of land qualities. A land qua
lity is a characteristic of land (either compound or single) which
has a direct relation to crop performance. Land qualities should
be mutually independent as much as possible, although a compo
nent (specific land characteristic) used to determine a land
quality may occur in the determination of another land quality
as well. The used land qualities are listed in Table 2U.
Table 2U List of relevant land qualities in the MRU-area for the
determination of the suitability of food and cash crops
- Availability of water
- Availability of soil oxygen
- Availability of nutrients
- Absence of soil salinity
- Absence of occurrence of iron toxicity
- Absence of acid sulphate soil conditions
- Absence of impediment of root development
- Absence of surface stones and rock outcrops
- Absence of very high gravel content in the surface soil
- Absence of flooding
- Absence of discharge stagnation
- Resistence to erosion
- Absence of high air humidity during the rainy season
Crops are considered as being the central issue of land use.
Land use possibilities like forestry, livestock, fisheries, hun
ting, tourism (recreation) are not included in this report.
Each crop has its own set of requirements concerning land qua
lities and management level to reach a certain suitability or
eventually a certain yield/performance level. The crops included
in this report are listed in Table 25.

- 130 -
Tabic 25 List.of food and cash used in the land evaluation pro
cedure
Banana/plantain Musa spp.
Cassava Manihot esculenta
Cashew Anacardium occidentale
Citrus Citrus spp.
Cocoa Theobroma cacao
Coconut Cocos nucifera
Cocoyam Colocasia esculenta
Coffee Coffea canefora (robusta)
Cowpea Vigna unguiculata
Maize Zea mays
Oil palm . Elaeis guineensis
Pineapple Ananas comusus
Pigeon pea Ca janus ca.jan
Rice (dryland and wetland) Oryza sativa
Rubber Hevea braziliensis
Soybean Glycine max
Sugar cane Saccharum spp.
Sweet potato Ipomoea batatas
Vegetables I Raddish Raphanus sativus
Greenbeans .Phaseolus spp.
Vegetables II Tomato Lycopersicon esculentum
Lettuce ....Lactuca sativa
Vegetables III Onion Allium cepa
Carrot .....Daucus carota
Cucumber ...Cucumis sativus
Spinach ....Basella alba
Pepper .....Capsicum frutescens
Management is incorporated in the qualification (or even
tually quantification) of the land qualities and crop require
ments. This is done to facilitate the land evaluation procedure.
If not, the procedure would have to be repeated for each diffe
rent management system. In the way by incorporation, the influence
of management can be observed by increase or decrease of land
quality or crop requirement ratings.
Rating. In order to find the suitability of a unit of land
for a particular crop, both the land qualities and the crop re-

- 131 -
quirements need to be rated. Five ratings (very high, high,
medium, low and very low) were used.
In some other studies more than five are sometimes used to
get more distinction among ratings.
Suitability. Four suitabilty classes are normal (FAO 1976):
highly suitable, moderately suitable, marginally suitable and
unsuitable. For each crop and management level the minimum ra
tings of land qualities to apply for a certain suitability
class are given. The most limiting land quality determines the
final suitability class. The descriptions of the k suitability
class, as given by FAO (1976) are shown in Table 26.
Table 26 Description of the four land-suitability classes accor
ding to FAO (1976) and Birchell et al. (1979).
Suitability class Description
Highly suitable (S1)
Moderately suitable (S2)
Marginally suitable (S3)
Unsuitable (N)
No or moderate to slight limitations for
the sustained cultivation of a given crop;
relatively high yields and a good return
on investment can be expected.
Moderately severe limitations for the
sustained cultivation of- a given crop;
adequate yields and a moderate return on
investment can be expected.
Very severe limitations for the sustained
cultivation of a given crop; very low
yields and only a marginal return on invest
ment can be expected.
Limitations are so severe that any possi
bility of successful sustained use of a
given crop is precluded.
Note: Sustained cultivation is actually not included in the described
management levels. Annual cropping still does included the fallow
period. Specification on yield levels and return on investment is
of relative value only.

- 132 -
U.U.3 Land qualities and crop requirements
In this paragraph all tables will be presented, which
are needed to match the ratings of the land qualities and the re
quired ratings to apply for a certain suitability class. The ra
tings for the latter are determined from 23 different sequences of
ratings. For each suitability class one rating is given and with
four classes four ratings are needed in one sequence. The theore
tically possible total of 70 is reduced to 23 by way of some re
strictions as explained in appendix II. The crop requirements are
based mainly on Veldkamp (1979), Birchell et al. (1979), FAO (1979),
Field Book ILRI (1972).
A list of suitable crops, as extracted from Duke and Terrall
(197*0 is given in appendix III. The crops included in the land
evaluation of this rapport are a selection of this list.
In the following text each of the land qualities will be
discussed concerning their way of determination, the impact of
management and the crop requirements. Application of these data
to the various soil series and phases of the framework is presented
in appendix I.
Availability of water
The availability of water is assumed to be alright for the
rainy season for all included crops. Only droughtstress occurring
during the dry season is supposed to affect the suitability. The
land quality "availability of water" is determined in two ways:
- a. directed to perennial crops; the available water-holding
capacity (AWC) and the agro-ecological zone are the deter
minants.
- b. directed to crops with a short growing periods, which can
be cultivated on hydromorphic soils during the dry season,
involving the available water-holding capacity (AWC) and
the soil drainage.
Determination:
AWC. The AWC is subdivided on the rooting depth of crops: shallow
(AWC ), deep (AWC,) and very deep (AWC , ) . For each kind of crop
different coefficients are used to indicate the importance of
sequential 10 cm soil layers for the "availability of water" (Table
27).

- 133 -
Table 27 Coefficients for the calculation of AWC , AWC., and AWC ,. s d vd
Depth (cm) shallow
0-10 1.0
10- 20 • 1.0
20- 30 1.0
30- kO 0.6
UO- 50 0.3
50- 60 0.1
60- 70 0.0
70- 80 0.0
80- 90 0.0
90-100 0.0
100-110 0.0
110-120 0.0
120-130 0.0
130-1 HO 0.0
lUo-150 0.0
deep very deep
1.0 1.0
1.0 1.0
1.0 1.0
0.8 0.9
0.6 0.75
0.U 0.6
0.2 0.5
0.1 O.H
0.0 0.35
0.0 0.3
0.0 0.2
0.0 0.15
0.0 0.1
0.0 0.05
0.0 0.05
The AWC is determined per soil horizon according to the formula:
AWC = A pP. d .(100-G)/100 s AWC is the available water-holding capacity in vol.%.
A pF is the difference in moisture content at either pF 2.0 or
pF 2.5 and pF U.2; the determination of the field capacity has
been different among soil laboratories.
d is the bulkdensity (g/cnr)
G is the gravelcontent (weight %).
The specific AWC is calculated by the following formula: A w cf A ,\ = a..b..+a_b-+ +a b
(s,d or vd) 1 1 2 2 n n
AWC , AWC, or AWC , is the available water-holding capacity in
mm for shallow, deep or very deep rooting crops respectively.
a is the coefficient of Table 27, applied for each increment with
depth of 10 cm.
b is the AWC per soil horizon
n is 6 (shallow), 8 (deep) or 15 (very deep).
The qualification of the AWC is given in Table 28. In table 29
the rating for the determination of the "availability of water"
is indicated, while table 30 shows the crop requirements, speci-

- 13U -
fied for the perennial and annual (short cycle) crops.
Table 28 The qualification of the available water-holding capacity
(AWC) for three.types of crops, depending on the rooting
depth and for two kinds of determination of the field
capacity (a. based on pF 2.0-pF U.2; b. based on pF 2.5-pF k.2).
Rooting depth Crops AWC (mm)
Qualification
shallow (s) pineapple, annuals (short-cycle crops)
< 56 56-112 >112
<1U 1U- 28
>28
low moderate high
deep (d) banana/plantain, cocoa, cassava, sugar cane
< 72 72--\kk >1UU
<18 18- 36
>36
low moderate high
very deep (vd) rubber, coconut, cashew, oil palm, citrus, coffee pigeon pea
<100 100-200
>200
<25 25- 50
>50
low moderate high
tentatively; figures listed under a. are 3.0 to 5 5 higher than the ones listed under b.; the factor ^.0 has been used as average figure.
Table 29 Rating of the "availability of water"
Management level
AWC s , AWCd or AWC , vd Management
level low moderate high
Perennial crops
Agro-ecological zone: A, D, G, J, M, P B, E, H, K, N, Q C, F, I, L, 0, R
m 1 vl
h m 1
vh h m
Short cycle crops (dry season)
Soil drainage: Well Moderately well Imperfectly Poorly trad,
imp.trad, western
vl vl vl 1 m h
vl yi l m h vh
vl 1 m h vh vh
Very poorly trad, imp.trad, western
m h vh
h vh vh
vh vh vh
Almost continuously waterlogged
trad, imp.trad, western
h vh vh
vh vh vh
vh vh vh

- 135 -
Table 30 Crop requirement for the land quality "availability of water"
_. Suitability class _ . n Annuals (crops with short „ 0 _, ., Perennials . , . . ,N S. S_ S0 N
cycle growing period; 1 2 3
Rubber, cocoa vh h h m
rice vh h m 1
Coffee, oil palm maize, cocoyam, soybean, vegetables I, II, III h m m 1
Banana/plantain, sugar cane h m 1 1
sweet potato, cowpea m m 1 1
Coconut m i l l
Citrus, cashew m 1 vi vl
Pineapple, cassave, pigeon pea ' 1 1 vl vl
Availability of (soil) oxygen;(aeration)
The only parameter available for the determination of the
land quality "availability of (soil) oxygen" is the soil drai
nage class. Actual groundwater level measurements during a year
would be a more useful determinant but they are not available..
The soil permeability was applied by Birchell et al.
(1979) together with the soil drainage and flooding; data about
the permeability, however, are scarce. Flooding is treated in
this report as a separate land quality.
The soil drainage class is to be determined either on a
yearly or a seasonal basis; the latter only when a crop is to
be cultivated in the rainy or the dry season. For most soils
one drainage class can be identified, but there are exceptions
(e.g. in the floodplain area near Zuani) were actually two
drainage classes have to be determined, one for each seasons.
The rating of the "availability of (soil) oxygen" is shown in
Table 31. The crop requirements are given in Table 32.

- 136 -
Table 31 Ratings of the "availability of (soil) oxygen"
Soil drainage class Management level
trad. imp.trad, western
Well drained (no waterlogging and the vh
groundwater table remains below 1.0m
depth throughout the year or season,
except during peak rainy periods)
Moderately well drained (waterlogging h
during not more than 15 days in one
year; groundwater close to 1.0 m depth
in the rainy season and within 1.0m
during peak rainy periods)
Imperfectly drained (waterlogging only m
in peak rainy periods; groundwater
table is within 1.0m depth during at
least the rainy season and can often
be found within 2.0m depth during the
dry season)
Poorly drained (waterlogging is common 1
only in the rainy season; groundwater
table is within 1.0 m depth throughout
the year or season)
Very poorly drained (waterlogging is vl
very common in the rainy season and
also occurs during parts of the dry
season; groundwater table is within
1.0m depth throughout the year or
season)
Almost continuously waterlogged vl
vh
m
vh
vh
m
vl

- 137 -
Table 32 Crop requirements for the land quality "availability
of (soil) oxygen"
Suitability class S1 S S N
Pigeon pea, citrus, vegetables III h h m 1
Rubber, coconut, coffee, pineapple, cashew, maize, sweet potato, cowpea, vegetables I h m m 1
Soybean, vegetables II, sugar cane, oil palm, cassava, cocoa, banana/plantain h m 1 1
Rice, cocoyam vi vi vi vl
Availability of nutrients
This land quality has been treated as one complex land quality
which actually had to be sub-divided into several elements. The
knowledge about the relation between such elements and crop per
formance, however, is hardly existing. More compound characteristics
have been chosen, which give an indication of "availability of
nutrients". They are:
- av. ECEC-50: the sum of bases and exchange acidity, averaged
over the upper 50 cm of the soil, expressed in me/100 g soil.
- Min. Al-ratio: the min.ratio Ca+Mg/Ca+Mg+Al, occurring within 50 cm
depth. The min. Al-ratio is clearly related to the Al-saturation,
which is the percentage of aluminium on the exchange complex.
- ECEC-clay: the effective CEC in the B-horizon, but within 1.0m
depth, expressed in me/100 g clay.
- G-50: the average content of particles bigger than 2 mm over
the upper 50 cm of the soil, by weight. %.
The rating of the "availability of nutrients" with these four
characteristics is shown in Table 33.
The exchangeable K in the surface soil is a characteristic
which is only mentioned as fertility phase for some series (see
appendix I). Iron-toxicity is treated as a single land quality.
Phosphate-fixation by iron and aluminium compounds, especially in
association with a high clay content is only mentioned in appen
dix I in the description of analytical data of some series; a
fertility phase could not be specified with respect to this cha
racteristic. Soil salinity is treated at subphase level if serious
and at fertility phase level if the salinity is only slight.

Table 33 Rating of the "availability of nutrients"
av. ECEC-50: <2 2-k >k
Min. Al-ratio.: <0.05 0.05-0.20 0.20-0.50 >0.50 <0.05 0.05-0.20 0.20-0, .50 >0.50
ECEC-clay: <5 <5
av. G-50: <30 vl vl 1 m h 1 m h vh vh
30-60 vl vl vl 1 m vl 1 m h vh
>60 vl vl vl vl 1 vl vl 1 m h
Note: On the effect of management for unspecified crops the rating should be increased by one rating
at the improved traditional management level and by two ratings at the western level. U) CO

- 139 -
The vegetation, its kind and age, plays an important role
in the fertility status of a soil and the farming system in
the bush fallow system is based more on the vegetation than
on the soil. On the other hand the vegetation is very variable
and cannot be "treated as an inherent characteristic. Still, it
should be kept in mind that a plot with a relatively old vege
tation may result, after clearing and burning, in a "high" fertile
piece of land, which is suitable for crop cultivation during
one or two years. The condition of the vegetation, however,
is too local-specific to be treated as land quality, although
its importance is understood. Therefore a low suitability due
to severe limitation by "availability of nutrients" does not
always mean that a crop cannot be grown with satisfactory re
sults.
Fertilization, as assumed to be applied in the improved
traditional and the western management levels is not specified
by way of kind, amount and time of fertilization and not spe
cified for crops. The general idea about the difference in ma
nagement levels is that the basic rating for "availability of
nutrients" is increased by one rating at the improved tradi
tional management level and by two ratings at the western ma
nagement level. The crop requirements are given in Table 3U.
Table 3^ Crop requirements for the land quality "availability
of nutrients"
Suitability class S1 S2 S3 N
Maize, citrus, soybean, vegetables I, II, III vh h h m
Banana/plantain, cocoa, cowpea, pigeon pea vh m m 1
Sugar cane, cocoyam, coffee h m m 1
Sweet potato, oil palm, rubber, rice, pineapple m m 1 1
Coconut, cassava m 1 1 vl
Cashew m 1 vl vl
Absence of soil salinity
The source of soil salinity in the MRU-area can only be
the ocean and saline soils, probably rare, are to be found
along the coast, e.g. in tidal areas, lagoons and deltaic
deposits. The salinity of a soil is measured by the conductivity

- iUo -
of the saturation extract and expressed in mmho/cm. This value
is abbreviated as EC . The following rating is proposed:
EC :<.1: vh; 1-k: h; 1+-10: m; 10-16: 1;>16: vl.
In the framework for soil classification special phases are
made for this land quality:
- salty, if EC is k or more (subphase)
- slightly salty, if EC is between 1 and h (fertility phase).
The crop requirements (Table 35) are based on the following
literature: FAO (1979), Birchell et al. (1979) and Field Book
ILRI, (1972).
Table 35 Crop requirements for the land quality "absence of
soil salinity"
Suitability class S.. S S N
Cocoa, coffee, rubber, banana/plantain, citrus, cashew, sweet potato, vegetables I, II, III, cowpea, pigeon pea vh h h m
Maize, rice, soybean, sugar cane, oil palm, pineapple, cassava, cocoyam vh h m m
Coconut h m m . .1
Absence of occurrence of iron-toxicity
This land quality is a strange one. Iron-toxicity is found
on the edges of many cultivated swamps and along valleys. It
seems that after clearing of the swamp or valley the groundwater
level rises and that iron-toxicity problems occur. The location
of the iron-toxicity is normally at the base of the lower slope
where groundwater reaches the surface. One theory explains the
iron-toxicity phenomena by the accumulation of solved iron (Fe )
by interflow water, running over a slowly permeable subsoil on
the slopes towards the valley or the swamp. The source of iron
might be the bedrock at the upper slopes or summit, eventually
the soils on the slope itself. The ferrous iron solved in the
interflow water reaches the surface and therefore the rooting
zone of crops (especially rice), where it causes nutrient imba
lances. The complex of these imbalances is called iron-toxicity,
although it is probably more than iron-toxicity alone. Another
term for this phenomena is bronzing.

- 1U1 -
For the rating of this land quality special phases have
been formulated in the hydromorphic soil series of the frame
work. Iron-toxicity is not a consistent characteristic of the
soil; it may be expected at certain places.
Rating:
- series Ml and M2, very gentle sloping phase very low
- series J, unknown, special iron-toxicity phase ... very low
- series Ml, M2, special iron-toxicity phase very low
- all others very high - low
Effect of management:
Only with the western management level (including a high level
of water control and especially drainage) the rating for absence
of occurrence of iron-toxicity is assumed to increase above the
very low.rating.
This land quality is only applied for rice as the problem
of iron-toxicity was only observed in that crop. Upon drainage,
by planting on ridges or mounds or by making ditches, the iron-
toxicity problem does not appear; therefore, other crops like
rice, which are grown with these drainage measures, do not have
the iron-toxicity problems. The requirements for rice are:
Suitability class S^ S S N
Rice 1 vi vi vl
Absence of acid sulphate soil conditions
Acid sulphate soils occur in places where the soil contains
a substantial amount of sulphur, which is often close to the sea
and very rarely at inland places where the parent material of the
soils contain sulphur in large quantities. With sulphur-rich soils,
certain bacteria are able to form sulphuric acid upon oxidation
of the soil (when drained). In soils which contain a considerable
amount of gypsum besides sulphur, the gypsum is able to buffer
the acid and no problems arise. However, when the acid is not
neutralized,a very low pH value,below 3.5 can be reached when
these soils are drained. A special characteristic of these acid
sulphate soils is the occurrence of straw-yellow mottles consisting
of the mineral jarosite. Up so far only the soils near Rokupr in
western Sierra Leone were found to be acid sulphate soils; these
soils are suitable to swamp and deep-water rice cultivation, as
long as they are not drained. In the MRU-area such soils were

- ll+2 -
not yet found. Likely places are the tidal swamp areas along
the coast. In the framework these soils can only be found in
the series 0.
Rating of the land quality.
Only series 0:
- very high: no acid sulphate soil characteristics whatsoever,
high gypsum content, low sulphur content
- high :.reduced para-acid sulphate soil, showing acid
sulphate characteristics only to a limited extent
- medium : reduced soils with a pH of h or higher, which be
comes an acid sulphate soil upon drainage
- low : acid sulphate soil conditions scattered
- very low : oxidized conditions and very low pH
Effect of management:
In the western management level an effect of management is
assumed concerning an increase by two ratings from the original
one. The improved traditional level increases the original
rating by only one.
This land quality is only applied to rice, as this crop
is the only one which is cultivated on undrained flooded soils.
Suitability class S S S N
Rice h m m 1
P.S.: with a medium rating the suitability is still moderate (S2)
because more management i.e. western man. level is actually
needed to keep the soil reduced to avoid crop failure.
Absence of impediment of root development
This land quality is important in case of gravelly or shallow
soils, but has also some links with the soil drainage. The latter
fact is involved in shallow soils with a soil depth between 50
and 100 cm, where a more poorlier drainage is considered bene
ficial for the development of the root system, provided the crop
can stand eventual water logging; if the roots reach water at a
relatively shallow depth, than the soil depth itself is less im
portant .
The ratings determined for the various single or combina
tions of parameter(s) are given in Table 36. The crop require
ments can be found in Table 37.

- 1U3 -
Table 36 Rating of the "absence of impediment of root development"
Rating
Soil depth less than 25 cm : vl
Soil depth 25-50 cm : - >60$ gravel within 30 cm depth..• vl
- others 1
Soil depth 50-100 cm : - moderately well or better drained:
- >60$ gravel within 30 cm depth, vl
- >30$ gravel within 60 cm depth. 1
- others 1 m
- imperfectly or poorlier drained:
- >60$ gravel within 30 cm depth. 1
- >30$ gravel within 60 cm depth, m
- others h
Soil depth more than 100 cm: - <30$ gravel within 1.2 m depth:
- more than 30$ weatherable coarse
fragments within 1.2 m depth... h
- soil depth between 1.0 and 1.5 A h
- others vh
- >30$ gravel within 1.2 m depth:
- >60$ gravel within 30 cm depth, vl
- >6o$ gravel between 30 and 60
cm depth .1
- >60$ gravel between 60 and 120
cm depth m
- 30-60$ gravel within 30 cm depth:
- thickness gravelly layer >25 cm 1
- thickness gravelly layer <25 cm m
- 30-60$ gravel between 30 and
60 cm m
- 30-60$ gravel between 60 and
120 cm h
Percentage gravel in vol.$. Gravel is any kind of particle with a
diametre of more than 2 mm, which obstructs root development.

- ^kk -
s 1 S 2 S 3 N
vh h m m
h m m 1
Table 37 Crop requirements for the land quality "absence of im
pediment of root development"
Suitability class
Cocoa
Citrus, coffee, rubber
Oil palm, coconut, sugar cane, maize,
pigeon pea h m 1 1
Cassava, vegetables I, II, II, cashew m m 1 1
Sweet potato, cocoyam, rice, cowpea, soybean, banana/plantain, pineapple m 1 1 vl
Absence of surface stones and rock outcrops
. The land quality is expressed by way of the percentage of
land occupied by either surface stones or boulders with a mini
mum diameter of 7«5.cm or rock outcrops. Such a specification
is treated in the framework for soil classification at the sub-
phase level. The rating of the land quality follows:
<k%: h; U-15*? m; 15-30$: 1; >30#: vl.
The crop requirements (Table 38) depend on the management
level especially. For the traditional and improved traditional
management level the requirements are the same for all crops.
For the western management level, although not specified in
Table 23, and only applicable for specific farming systems inclu
ding some mechanization in land preparation, the requirements
of Table 38 are proposed. A difference is made between a system
in which commercial (cash) crops are grown in a plantation system
and a system in which arable crops are cultivated at a large
scale. Mechanization, however, has not been specified for the
western management level, but may be included if necessary.

- 1U5 -
Table 38 Crop requirements for the land quality "absence of sur
face stones and rock outcrops"
Management level Crop(s) Suitability class
s2 s3 N
Traditional and all
improved tradi
tional
Western-plantation - rubber
- sugar cane
Western-large
scale arable
crop farming
- oil palm, citrus, coffee,
pineapple
- banana/plantain, cocoa
- cashew, coconut
- vegetables I, II and III
- maize, legumes
- rice
- cassava
m
h h m 1
h m 1 1
m m 1 1
m 1 1 v l
m 1 v l v l
h h m 1
h m 1 1
m m 1 1
m 1 v l v l
Absence of very high gravel contents in the surface soil
Very high gravel contents in the surface soil are quite common
in upland soils on the Basement Complex. The contents not only
hamper root growth, but obstruct the workability of the soils.
Especially with mechanized ploughing or rotary-tilling seedbeds
are more difficult to make. With hand labor the same problem occurs,
although its obstruction is less severe. Another problem of a very
high gravel content in the surface soil is the occurrence of some
cementation, making mechanized tillage more diffi
cult. The occurrence of surface stones and rock outcrops has simi
lar problems, but is kept as a separate land quality with a diffe
rent impact on "the ratings and on the crop requirements. The rating
of the absence of a very high gravel content in the surface soil is
only meant to exclude these soils from the high suitability class.
However, on basis of other land qualities, these soils will pro
bably already fall in a lower suitability class; for situations
where this is not the case, the land quality has been devised to
safeguard this possibility.
Rating of the land quality:
Very high - low : soils which do not contain more than

- ili6 -
% (by volume) within 30 cm depth.
Very low : soils which have more than 60% (by
volume) within 30 cm depth.
Effect of management : the use of a plant device in planting
cocoa.under the improved traditional
and western management levels increases
the rating for the absence of very high
gravel contents in the surface soil to
"low or higher" automatically.
In the framework the very low rating will be found in the series
B, D, H, I, Y and Z where a separate phase - "shallow-gravelly" -
was devised for this characteristic.
These is no difference in requirements among crops with respect
to this land quality. All crops are supposed to be hampered by a
gravel content of more than 60% (by volume) within 30 cm depth.
Suitability class S.. S S N
All crops 1 vi vi vl
Absence of flooding
This land quality identifies the occurrence of surface water
on the land. In the framework this characteristic is implied at
the phase level in the wettest series. In imperfectly drained
soils, especially those situated on terraces along creeks may
be flooded for one day during one or more periods during the
year. This characteristic is implied in the definition of the
series, and is not further specified at phase level.
The rating of the land quality:
Very high : soil is never flooded.
High : soil is flooded very occasionally;
only once or twice during the rainy
season; each inundation has a dura
tion of one day or less.
Medium : soil is flooded occasionally; more
than twice during the rainy season;
each inundation has a duration of
2 days or less.
Low : soil is flooded commonly; the dura
tion of inundation varies from 1 week

- 11+7 -
to 1 month.
Very low : soil is flooded regularly; the
duration of the inundation period
is more than 1 month.
Effect of management : with the improved traditional ma
nagement level the low or very low
rating is assumed to increase by one,
while with the western level an in
crease of two is expected for these
two ratings.
P.S.: Floods are supposed to be gradual, not flash floods. In cases
where flash floods occur, e.g. in river basins with quickly rising
water levels, due to stagnation of the river discharge, a separate
land quality has to created. There may be cases where a swamp rice
crop is damaged by flash .floods. Management of extreme discharges is
possible by big main ditches in the centre of valleys. Such ditches,
however, are costly and have to be maintained carefully. Therefore
such management practices are assumed to be outside the scope of
the defined management levels and valleys with a regular occurrence
of flash floods are considered unsuitable for any crop. Others with
only very occasional flash floods have to be rated separately for
each valley; generalization at this point is irrelevant. More de
tailed data are necessary for the determination of the suitability
for a crop like rice.
The crop requirements are shown in Table 39« These requirements are
to be applied in the rainy season only. During the dry season
flooding is unlikely to occur except in swamps with regular water
supply; these swamps will receive a very low rating for the "ab
sence of flooding" which may have impact on the suitability, by
way of the land qualities availability of oxygen and the absence
of discharge.
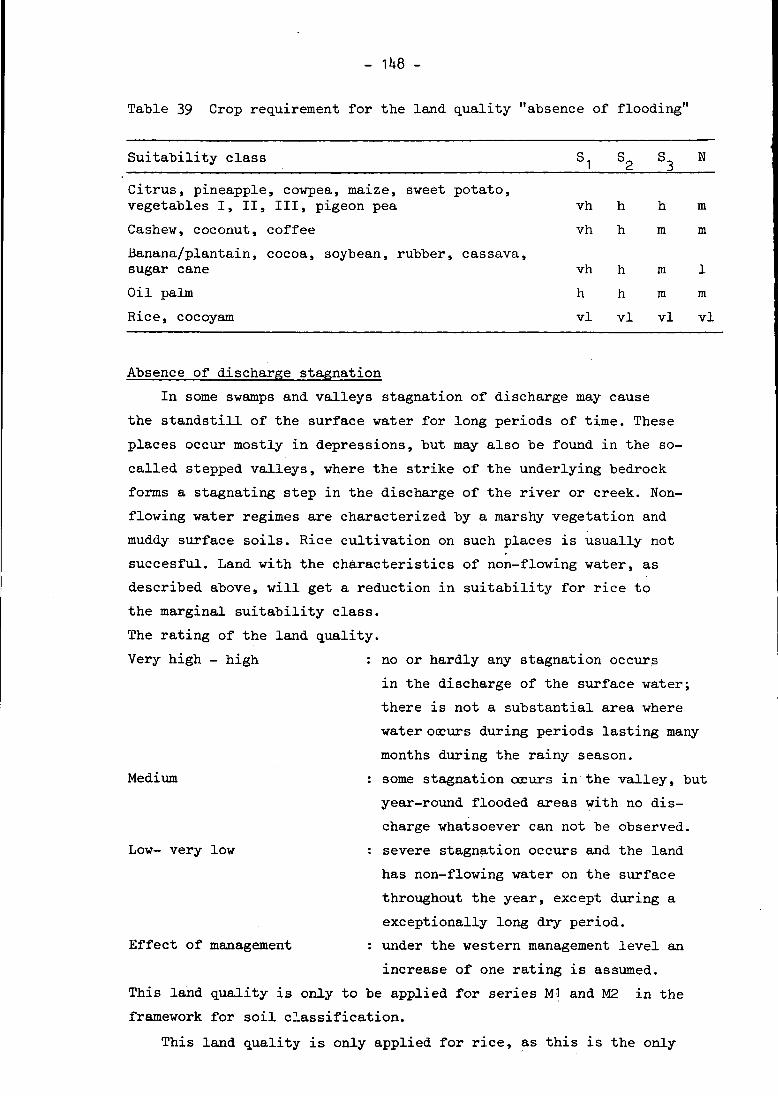
- 1U8 -
vh h h m
vh h m m
vh h m 1
h h m m
Table 39 Crop requirement for the land quality "absence of flooding"
Suitability class S S S N
Citrus, pineapple, cowpea, maize, sweet potato, vegetables I, II, III, pigeon pea
Cashew, coconut, coffee
Banana/plantain, cocoa, soybean, rubber, cassava, sugar cane
Oil palm
Rice, cocoyam vi vi vi vl
Absence of discharge stagnation
In some swamps and valleys stagnation of discharge may cause
the standstill of the surface water for long periods of time. These
places occur mostly in depressions, but may also be found in the so-
called stepped valleys, where the strike of the underlying bedrock
forms a stagnating step in the discharge of the river or creek. Non-
flowing water regimes are characterized by a marshy vegetation and
muddy surface soils. Rice cultivation on such places is usually not
succesful. Land with the characteristics of non-flowing water, as
described above, will get a reduction in suitability for rice to
the marginal suitability class.
The rating of the land quality.
Very high - high : no or hardly any stagnation occurs
in the discharge of the surface water;
there is not a substantial area where
water occurs during periods lasting many
months during the rainy season.
Medium : some stagnation occurs in the valley, but
year-round flooded areas with no dis
charge whatsoever can not be observed.
Low- very low : severe stagnation occurs and the land
has non-flowing water on the surface
throughout the year, except during a
exceptionally long dry period.
Effect of management : under the western management level an
increase of one rating is assumed.
This land quality is only to be applied for series M1 and M2 in the
framework for soil classification.
This land quality is only applied for rice, as this is the only

- 1U9 -
crop which might be considered to be cultivated in places where
the discharge of surface water is severely hampered and water
remains on the land for long periods in its growing period without
a regular (at least yearly) drying out of the surface soil.
Suitability class S1 S2 S3 N
Rice h m 1 1
Resistance to erosion
For the resistance to erosion two parameters are used: the
slope and the soil erodibility. Other parameters are relevant
as well, but are too detailed (too local- and time-specific) to
be applied (e.g. length of slope, stage in crop cultivation).
An index for the resistance to erosion is obtained by giving
sub-ratings to each slope class and to 2 groups of soil series,
depending on occurrence on the steeper slopes (of more than 6%)
and a distinction on the soil erodibility.
Slope class: <2%: 1; 2-6%: 3; 6-13$: 6; 13-25%: 10; 25-55%: 15;
and >55%: 20.
Occurrence on nearly level and very gentle slopes only: series
A, J, M1, M2, N, 0, P, R,S : rate 1.
Occurrence on all kinds of slopes: these soils are distinguished
on their erodibility:
Soils with slight erodibility; series K, L,
Q, T: rate 3.
Soils with severe erodibility; series B, D,
G, H, I, U, V, X1, X2, Y, Z: rate 6.
Soils with very severe erodibility; series
W, X3: rate 10.
The index for the resistance to erosion is the product of both
.rates. -
The rating for the land quality is made according the following
list:
<1: vh; 2-15:h; 15-^0: m; UO-100: 1; >100: vl.

- 150 -
This has the following result:
Occurrence on nearly S 1 level or very gently class slopes only
A,J,M1,M2,N,0,P,R,S
Occurrence on several kinds of slopes; grouping according to soil erodibility
Soil erodibility according to soil series: K,L,Q,T B,D,G,H,I,U,V,X1,X2,Y,Z W,X3
<2
2- 6
6-13
13-25
25-55
>55
vh
h
h
h
m
m
1
1
h
h
m
1 '
1
vl
h
m
1
1
vl
vl
The crop requirements are given in Table Uo.
Table 1+0 Crop requirements for the land quality "resistance to
erosion"
Suitability class N
Cowpea, maize, pineapple, rice, soybean, sugar cane, vegetables I, II, III
Cocoa, coconut, sweet potato
Cassava, cocoyam
Banana/plantain, pigeon pea
Rubber, coffee, cashew, citrus, oil palm
h h m 1
h m 1 1
m m 1 1
m 1 1 v l
m 1 v l v l
Absence of high air humidity during the rainy season
The humidity of the air is relatively high for most of the
MRU-area, but it is extreme in the high rainfall zones. In those
zones plant diseases occur more often which hampers the growth of
some crops, e.g. cocoa, citrus. The land quality is directly linked
to the agro-ecological zones:
Very low : zones, A, D, P with an annual rain
fall over more than 3000 mm and a
length of the growing period of more
than 315 days.
Low : zones B, C, E,. F, G, H, I, J, M, Q, R.
Medium : zones K, L, N, 0 with an annual rain
fall of less than 2500 mm and a length
of the growing period of 315 or less.

151 -
This land quality is only limiting crop growth when the crop
is grown during the rainy season. Rice is split into two cate
gories: lowland (swamp) rice and dryland (upland) rice. The crop
requirements can be found in Table U1.
Table U1 Crop requirements for the land quality "absence of high
air humidity during the rainy season"
Suitability class S.. S S N
Maize, cowpea, soybean, pigeon pea, vegetables I, II, III m 1 vl vl
Citrus, cashew, sugar cane, pineapple, cassava, cocoa, sweet potato, dryland rice 1 vl vl vl
Rubber, coffee, oil palm, banana/plantain, coconut, cocoyam, lowland rice vl vl vl vl

- 152 -
4.1*.1+ Ecological suitability
In appendix I the suitable crops have been determined for
each series and phases, together with specifications on mana
gement levels and agro-ecological zones. For most series spe
cial fertility phases have been included to show the distinction
among more or less fertile phases. The determination of the sui
tability was reduced to the highly and moderately suited crops only.
Some marginally.suited crops may be of interest, especially if a low
availability of nutrients is the most limiting land quality'); these
crops, however, could not be included, due to the lack of local-spe
cific details.
An example will be given of some common soils:
upper slope : series B - shallow-gravelly, B-typic and
B-thick topsoil
lower slope : series L-typic
terrace : series A-typic
In Table h2 the highly and moderately suited crops are presen
ted. Remarkable is the difference in number of suitable crops
under management level a.; this number is very low compared to
the other levels. Especially fertilization is the reason behind
this difference, however, as stated before, a good fallow vege
tation might increase the fertility up to the level of manage
ment level b. Management level c. includes more suitable crops
than b. but also shifts from the S2 to the S1-class can be ob
served.
Crops with low requirements appear in all three management
levels: cassava, cashew and coconut. A crop like maize is only
suited under special circumstances.
The upland soils, especially B-typic hardly show any sui
table crops; only under management level c. crops like banana,
cocoyam and sweet potato are moderately suitable. For the B-
shallow-gravelly phase not a single crop was found suited. On
the less gravelly soils many more crops can be culti-
') Cf. paragraph k.k.3 "availability of nutrients": much de
pends on the local-specific situation concerning the vege
tation. Some plots might have soils with a low fertility,
but may produce satisfactory yields in the bush fallow
system if the vegetation produces enough nutrients after burning.

Table U2 Highly and moderately suited crops on some common soils under three management levels
S u i -t a -b i -l i -
t y
••Ian. l e v e l
a b c
Crops
S u i -t a -b i -l i -
t y
S o i l T h i c k B - t o p -s o i l
t y p i c A-
t y p i c
Thick fl-
t o p s o i l
L -t y p i c
A-t y p i c
B -t y p i c
T h i c k B -
t o p s o i l
L -t y p i c
A-t y p i c
S u i -t a -b i -l i -
t y
zones a l l a l l a l l 1 2 3 / 5 U/6 1 2 3 / 5 U/6 1 2 3 / 5 U/6 1.2 3 / 5 U/6 1 2 3 / 5 U/6 1 2 3 / 5 U/6 1 2 3 / 5 U/Ó
Food c r o p s
b a n a n a / p l a n t a i n SI S2 X X X X X X X X X X X X X X X
c a s s a v a SI S2 X X X X X X X
X X X X
X X X X X X X X
X X X X
X X X
X
cocoyam SI S2 X X X X X X X X X X X X X X X X X X X X
X X X X X X X
X X_ X
X
X
cowpea S1 S2 X X X X X X X X X X X X
ma ize SI S2 X X X X X X X X X
p i g e o n p e a SI S2 X X X X X X X X X X X X X X X X X X
r i c e SI S2
X X X X
X X X X
X X X X
X X X X
X X X X
X X X
X
s o y b e a n SI S2 X X X x x X
s w e e t p o t a t o SI S2
X X X X
X X X X
X X X X X X X X
X X X X
X X X X
X X X
X
v e g e t a b l e s I , I I , I I I
S1 52 X X X X X X X X X
Cash c r o p s
cashew SI 32 X X X X X X X
X X X X
X X X X X X X X
X X X X
X X X X
c i t r u s SI X X X X X X X X X X X X
cocoa SI S2 X X X X X X . X X
c o c o n u t SI S2 X X X X X X X
X X X X
X X X X X X X X
X X X X
X X X X
c o f f e e 51 52 X X X X X X X X X X X X
X X X
X X X
o i l palm :1 X X X
X X X
X X X X X X
X X X
X X X
p i n e a p p l e 51 X X X X
X X X X
X X X X
X X X X
X X X X
X X X
X
r u b b e r 51 X X X X X X X X X X X X
:;U(/ar c ane SI 32 X X X X X X X X X X X X
X X X
X X X
N i CD S O O 3 o 1 c t
re i re i n re W
c - w • • lx ru 0\ \n ro — I H
rr re w W
H rr re
n w o > C < * " • * fre t "' cr
•n K u o rt O
O n B: K •n • H O
o re et•1 il»
I T pi •1 I H -
o a É t - i W ct
c t w H ' H ' M O
ai iO < P ct
** w < P ct P I o H -O 1 s re
e* rr p n
c t
c t I r 3 n e* re M
M rf H -
re O
(ft » H»*
a to 9 1 H ' c t a •a tn
O
o iv >-« c t c* O ET n re
O p. H '
i t -<< P M 3 HI p. P W t-0 1 3 ct •<
•a

- 15U -
vated. At the lower places on the slope (series L and A) the
number of suitable crops is highest; actually the only diffe
rence is due to the suitability of some crops for cultivation
in' the beginning of the dry season.
The difference between management levels needs some more
discussion. Apart from the differences as mentioned in Table
23, more differences have been explained in the descriptions
and ratings of the land qualities. The respective land quali
ties in which the rating was assumed to increase by management
are:
- availability of water in the dry season on poorly and poorlier
drained hydromorphic soils
- availability of oxygen
- availability of nutrients
- absence of occurrence of iron-toxicity
- absence of acid sulphate conditions
- absence of flooding.
In the rating process and the subsequent suitability determi
nation the increases of ratings have been implemented for all
crops. However, in reality such measures are normal for only some
crops and may be very unusual for others. For example, ferti
lization and protection against flooding is a practice never
carried out for a crop like cassava in the MRU-area and thus
the increasing effect of management by these factors on the
suitability of cassava is unreal. From Table k2 it can be ob
served that pigeon pea on A-typic is not mentioned under ma
nagement level a., but has a moderate suitability under levels
b. and c ; it is assumed that with the higher management levels
flooding is absent, which is a unreal practice for pigeon pea,
which is very sensible to flooding (i.e. pigeon pea should not
be grown on occasionally flooded soils, even if management
takes care to avoid flooding). In such a situation other, more
well drained sites should be found for the cultivation of
pigeon pea. The assumption of increased ratings by management
is therefore ridiculous in case of a crop like pigeon pea.
The specifity of crops with respect to management is to be
incorporated in the land evaluation yet. The final suitability
of a crop, without inclusion of socio-economic factors, can
only be determined when exact specifications are established for
each crop.

- 155 -
Not only management levels have a clear influence on the
suitability but also the agro-ecological zones. Either a low
availability of water or a high air humidity may decrease the
suitability.
A clear picture of the suitable crops for a given tract of
land can be obtained when a detailed soil map is available on
which series and phases of the framework can be recognized.
Furthermore analytical data should be present to find the
fertility status of the soils and thus, the appropriate fer
tility phases. Only in such a case a complete land evaluation
can be applied. This means that the result of land evaluation
will be really detailed.
On the other hand, a more generalized picture can be ob
tained by generalizing series and/or phases beforehand and
by generalizing the land evaluation results; the consequence
is a summarized and generalized map of what crops should be
cultivated. The value of such a map is doubtful however, when
on one hand land evaluation is carried out for single crops,
while on the other hand soils of different nature are com
bined. Then also a generalization of crops should be made.
No proposal in this direction can be made here.
Crop rotations can be composed when all suitable
crops are known. With this knowledge an agronomist is able
to combine crops in a mixed stand or in any other from of
cultivation up to the rotation with the highest agronomic
potential. In case more than one rotation seems feasible,
economic and social considerations are to be involved to find
the best suited one.

- 157 -
5. SOCIO-ECONOMIC CONSIDERATIONS AND REFLECTIONS ON FURTHER STUDIES
Up so far the land evaluation has been theoretical and limited
to the physical side only. In practice, the results of land eva
luation are empirical and the real differences in suitability
among crops, management level and agro-ecological zone are to
be compared to the more theoretical ones as resulted from the
land evaluation results of chapter k. In the land evaluation pro
cedure these differences are emphasized on one point and genera
lized in another; this means that only the highest differences
are expected to be implemented at the suitability level. Of
course, the mentioned differences, e.g. among agro-ecological
zones, are gradual in the field and moreover, are influenced
by local-specific circumstances, e.g. the age of the vegetation,
the farmer himself etc. In fact, implementation of the land eva
luation results is meant to be a first step in appropriate land
use planning. Due to the common landscape and the way of farming,
land evaluation is supposed to be effective only at the detailed
level, but this does not mean that all aspects of the detailed
level can be overlooked at once. Therefore firstly the physical
side was evaluated. In this chapter, some socio-economic consi
derations will be made, mainly directed to a further evaluation
into non-physical aspects of the common farming systems and their
suitability in the MRU-area.
The following reports give numerical data about yield levels,
input levels and labor requirements:
Agrar- und Hydrotechnik (1978), Mc.Courtie (1973), van Santen
(197*0» Birchell et al. (1979) and several World Bank reports.
A clear difference in yields between the management levels is
hard to find, as data differ among author and region; furthermore
only average values are given. A real comparison can actually
only be made by local research. The same applies for labor re
quirements and the level of input applied for each crop. The
calculation of net income from each crop is an even more hazardous
effort and is more variable than the former parameters, due to
variability in prices either by period in'the year, among years
as well as by region. Altogether a clear picture cannot be
extracted from the mentioned literature.

- 158 -
Besides prices, laborproductivity and input levels,other fac
tors have an influence on land use and the crop choice; pre
ference for a particular crop variety, due to taste, color
etc.; the need of the family for a particular (food) crop; the
traditional way of farming involving specific crops; the avail
ability of land and soforth.
All the mentioned factors need to be studied in detail at
the local level. In such studies the actual yield and all other
factors can be included, while on one hand the efficiency of
farming can be determined, while in the other hand the (physical)
land evaluation can be tested and eventually revised.
Application in economic terms of the land evaluation results of
chapter k is not possible at this stage. Translation of suita
bility classes into expected yield levels cannot be carried
out, whereas the effect of changement from one management level
to a higher one cannot be calculated. Broad estimation might
be given, but such figures would give the impression of a cer
tain accuracy which is not the case. Therefore, this report will
not deal with any of the few available data; only research in
local circumstances is thought to enable a clear understanding
of what the best crop choice is on the available land of a
farmer or a town.
Based on the above mentioned data it is proposed to select
representative sites in the MRU-area where studies on land,
present and potential land use can be carried out. These studies
should have an interdisciplinary character, involving all socio
economic aspects, including market facilities, people's prefe
rences, and in fact, all aspects of farmer's live. The intent
of these studies would be to compose a complete picture of what
is going on in everyday farming in the rural areas and what
might reasonably done to improve the living conditions in the
area itself and the increase of crop production in order to
supply the need of the people in the cities.

- 159 -
BIBLIOGRAPHY
Agrar- und Hydrotechnik, 197^. Feasibility study of Upper Lofa
Rural Development Project, Government of Liberia, Ministry
of Agriculture. Agrar- und Hydrotechnik, Essen, West Germany.
Agrar- und Hydrotechnik, 1978. Nimba county.
Alvim, P. de T. and T.T.Kozlowski, 1977. Ecophysiology of tropical
crops. Acad.Press., New York, London.
Beek, K.J., 1978. Land evaluation for agricultural development.
Pub.no. 23, ILRI, Wageningen, the Netherlands.
Beek, K.J. and J.Bennema, 1972. Land evaluation for agricultural
land use planning. An ecological methodology. Dept.Soil Sei.
and Geol., Agric. Univ., Wageningen, the Netherlands.
Birchell, C.J. et al., 1979- Land in Sierra Leone: a reconnaissance
survey and appraisal for agriculture. Techn.Rep.no. 1, LRSP,
Freetown, Sierra Leone.
Bleeker, P., 1976. A framework for land suitability classification
with particular reference to Sierra Leone. Tech.note no. 2,
LRSP, Freetown, Sierra Leone.
Blokhuis, W. et al., 1978. Toyama-Laseru-area; Njala Univ., Sierra
Leone.
Bouyoucos, G.H., 1951. A recalibration of the hydrometer method
for making mechanical analysis of soils. Agron. J.U3: U3^-38.
Boyer, J., 1972. Potassium in: Soils of the humic tropics, National
Academy of Science, Washington D.C., U.S.A.
Carpenter, A.J., 1975. Draft terminal report on rice farming in
Liberia, LIR/73/013, Monrovia, Liberia.
Conto, W., 1977. Fertility capability classification. Mimeo.
Summary report, N.C.State Univ., U.S.A.
Cusani-Visconti, C , 1979. Proposals for future development and
improvement of management level and farming system. Nat. seminar
on land and water resources survey: its role in agricultural
development, Freetown, Sierra Leone.
Duke, J.A. and E.E.Terrell, 197^. Crop diversification matrix:
introduction. Taxon 23 (5/6): 759-99.
Dijkerman, J.C., 1969. Soil resources of Sierra Leone, African
Soils, vol. 1U, 185-206.
Dijkerman, J.C. and D.H.Westerveld, 1969. Reconnaissance soil survey
of the lower Sewa river floodplain near Torma Bum, Sierra Leone,
Njala Univ.College, Sierra Leone.

- 160 -
Eschweiler, J.A. and M.F.Sessäy, 1980. Feasibility study for
Turner's peninsula coconut project: a semi-detailed survey
of soils, vegetation and land use for land suitability eva
luation. Misc. Rep. no.20, LRSP, Freetown, Sierra Leone.
Eschweiler, J.A. et al., 1980. Semi-detailed land evaluation
study for the proposed Tigbema coffee plantation scheme.
Misc. Rep. no.25, LRSP, Freetown, Sierra Leone.
Fanfant, R., 1972. Soil survey; development of rice cultivation
in Liberia, Mimeo. SF/FAO/l+itl/LIR-5, Monrovia, Liberia.
FAO, 1976. A framework for land evaluation, Soils Bulletin, no.
32, FAO, Rome, Italy.
FAO, 1978. Report on the agro-ecological zones project Vol. I.
Methodology and results for Africa. World Soils Resources
Rep. no. 48, FAO, Rome, Italy.
FAO, 1979. Yield response to water. FAO Irrigation and drainage
paper, no. 33. FAO, Rome, Italy.
Gallez, A. et al., 1976. Surface and charge characteristics of
selected soils in the tropics. Soils Sc. Soc. Am. J. Vol. k03
no. k, 601-8.
Geus, J.G. de, 1973. Fertilizer guide for the tropics and subtro-
pics. Centre d'etude de l'azote, Zürich, Switzerland.
Hasselmann,K.H., 1979- Liberia; geographical mosaics of the land
and the people. Min. of Information, Cultural affairs and
Tourism, Monrovia, Liberia.
Juo, A.S.R. et al., 1976. An evaluation of cation exchange capa
city measurements for soils in the tropics. Comm. soil science
plant analysis, 7 (8), 751-61.
Juo, A.S.R. and R.L. Fox, 1977. Phosphate sorption capacity of
some benchmark soils of west Africa, Soil Sei., 12k (6), 370-6.
Juo, A.S.R. and B.T.Kang, 1979- Capability and constraints in
utilization of ultisols and oxisols for crop production in
West Africa, UTA, Ibadan, Nigeria.
Klingebiel, A.A. and P.H.Montgomery, 1961. Land capability classi-
fication, U.S. Dept.Agric. Handbook 210.
Mc.Courtie, W.D., 1973. Traditional farming in Liberia. Univ. of
Liberia, Monrovia, Liberia.
Melitz, P.J. and R.Brinkman, 1975. Some land utilization types
in Surinam: criteria for land suitability classification (in

- 161 -
dutch). Dept.Opbouw, D.B.K. report, no. 52, Paramaribo,
Surinam.
Moormann, F.R. et al., 1977. The growth of rice on a topose-
quence - a methodology. Plant and Soil, U8, 565-80.
Moormann, F.R. and W.J.Veldkamp, 1979« Land and rice in Africa:
constraints and potentials in: Rice in Africa, Acad.Press.
London.
Moormann, F.R. and N.van Breemen, 1978. Rice: soil, water, land.
IRRI, Los Banos, Laguna, Philippines.
Mourik, D.van, 1979. Land in western Liberia. A reconnaissance
agricultural land evaluation of the Mano River Union project
area in Liberia. Mano River Union, Freetown, Sierra Leone,
Monrovia, Liberia.
Odell, R.T. et al., 197*+. Characteristics, classification and
adaptation of soils in selected areas in Sierra Leone, Univ.
Illinois, Njala Univ. College, Bull. no. h.
Purseglove, J.W., 1968. Tropical crops; dicotyledons, 2 volumes,
Longmans, London.
Purseglove, J.W., 1972. Tropical crops; monocotyledons, 2 volumes,
Longmans, London.
Roberts, J.H., 1973. An appraisal of the inland valley swamps of
north eastern Sierra Leone, unpublished report MANR, Freetown,
Sierra Leone.
Sanchez, P., 1976. Properties and management of soils in the tro
pics. John Wiley and sons, New York.
Santen, C.E. van, 197*+. Selected economic aspects of expanding
rice production in Liberia, project working paper ASG: SF/
LIR-5, Rome, Italy.
Schulze, W., 1973. A new geography of Liberia, London.
Sivarajasingham, S., 1968. Soil and land use survey in the Eastern
Province of Sierra Leone, FAO report TA 258U, Rome, Italy.
Soils Division, 1977a. Soil survey of the Central Agricultural
Experimental Station, Suakoko, Liberia. Min.Agriculture,
Monrovia, Liberia.
Soils Division, 1977b. Soil series descriptions and classification
of the soils of Liberia, Mimeo, Suakoko, Liberia.
Soil Survey Staff, 1975- Soil Taxonomy, Agric. Handbook U36,
Washington D.C., U.S.A.
Stark, S., 1968. Soil and land use survey of part of the Eastern

- 162 -
Province of Sierra Leone, FAO report TA 257U, Rome, Italy.
U.S. Geological Survey, 1977. Geological maps of Liberia. Dept.
Interior, U.S. Geol. Survey, Restin, Va., U.S.A.
Veldkamp, W.J., 1979- Land evaluation of valleys in a tropical
rain-forest area - a case study, Agric.Univ., Wageningen,
the Netherlands.
Vuure, W.van and R.Miedema, 1973. Soil survey of the Makeni area,
Northern Province, Sierra Leone, Njala Univ. College, Sierra
Leone.
Wambeke, A.van, 197**. Management properties of ferralsols. FAO
Soils Bull., no. 23, FAO, Rome, Italy.
Williams, C.N. and K.T.Joseph, 1976. Climate, soil and crop pro
duction in the humid tropics. Oxford Univ.Press., Kuala Lumpur.
Williams, J.B., 1979. Soil water investigations in The Gambia,
Techn.Bull. no. 3, Land Resources Development Centre, Min.
Overseas Dev., UK.
Young, A., 1976. Tropical soils and soil survey. Cambridge Univ.
Press., Cambridge, U.K.