soil surface evaporation and water table depths
TRANSCRIPT

SOIL SURFACE EVAPORATION AND WATER TABLE DEPTHS
By Sun F. Shih,1 M. ASCE
ABSTRACT; The experiment was conducted in lysimeters for studying the evaporation from soil surface in relation to water table depth and standard pan evaporation. Dummy variables 1 and 0 were used as an alternative to analyze the variance and covariance to compare the soil surface evaporation difference between water table depths. The dummy variable regression analysis can simultaneously test the difference between two regression lines whether due to slope coefficients or intercept terms. The water table depth was significantly affected on the soil surface evaporation. The soil surface evaporation for 38 cm water table was significantly smaller value than that for the 8 cm water table. The soil surface evaporation in wet season had a smaller deviation from the standard pan evaporation and had a more homogeneous distribution within the wet season than that in the dry season.
INTRODUCTION
Evapotranspiration (ET) is the amount of water transpired by the plant and evaporated from the soil or from the precipitation intercepted by the plant foliage. The knowledge of the amount and rate of ET is useful not only for irrigation studies but also for the development of hydrolog-ical models. In many cases, the water use for some time after crop emergence and after harvest is dominated by the evaporation from the soil surface. As the transpiration becomes more dominant, the role of evaporation from the soil surface is reduced. Evapotranspiration is difficult to directly measure.
According to the statement given by Tanner (14), there is a general belief that evaporation from water bodies, wetted soils, and vegetation should be well correlated, since evaporation from both is governed by micrometerological conditions. In other words, when adequate records of ET for a crop are not available, an empirical formula, such as pan evaporation, can be used to estimate the ET. In the meantime, Chang (1) also emphasized two advantages of using pan evaporation to study the sugarcane ET rather than a soil water sensing device. First, estimates of both probabilities could be determined from evaporation and rainfall data; and second, pan evaporation offers a more economical and convenient procedure upon which to base irrigation schedules. However, Haise and Hagan (7) mentioned that use of the evaporation pan to predict crop water use is not realized under conditions influenced by the stage of growth and development. In other words, the pan coefficient is difficult to determine, mainly because the coefficient not only varies with the stage of growth and the time of year, but also differs from site to site due to wind, fetch, humidity and surrounding environment. Generally, the United State Weather Bureau Class A pan is installed in some
'Prof., Agr. Engrg. Dept., Univ. of Florida, Gainesville, Fla. 32611. Note.—Discussion open until May 1,1984. To extend the closing date one month,
a written request must be filed with the ASCE Manager of Technical and Professional Publications. The manuscript for this paper was submitted for review and possible publication on January 13, 1983. This paper is part of the Journal of Irrigation and Drainage Engineering, Vol. 109, No. 4, December, 1983. ©ASCE, ISSN 0733-9437/83/0004-0366/$01.00. Paper No. 18459.
366
J. Irrig. Drain Eng. 1983.109:366-376.
Dow
nloa
ded
from
asc
elib
rary
.org
by
UN
IVE
RSI
TE
LA
VA
L o
n 07
/06/
14. C
opyr
ight
ASC
E. F
or p
erso
nal u
se o
nly;
all
righ
ts r
eser
ved.

weather stations. Evaporation from the pan, which is inexpensive and easy to operate, is considered to be an important index for quantifying water on the earth returning to the atmosphere. In the meantime, Shih et al., (11) found that the pan evaporation method can give a quite satisfactory result for estimating the basinwide monthly ET in the Everglades of Florida. However, the study of the relationship between the soil surface evaporation (SSE) and the standard pan evaporation (SPE) has not been emphasized by previous researchers. Thus, the SSE value cannot be estimated based on the available SPE data. Furthermore, the soil moisture content which is related to the water table depth could be an important factor affecting the SSE value.
However, the question remains of how to use a proper technique to analyze the different relationships between the SSE and SPE caused by the water table depths. The relationship between analysis of variance and dummy variable regression analysis has been widely investigated by economists (8,5,6,9,4). Unfortunately, testing the difference between two regressions, which is very important in some water resource problems, has not been emphasized by the water resources workers. Therefore, the purpose of this study was twofold: (1) To establish the relationships among the SSE, SPE, and water table depth; and (2) to show how the dummy variable 1 and 0 can be used as an alternative to the standard analysis of variance and covariance method to compare relationships among groups of observations.
MATERIALS AND METHODS
Experimental Description.—The experiments were conducted in lysimeters at the Agricultural Research and Education Center (AREC), Belle Glade, studying the evaporation from soil surface in relation to water depth standard pan evaporation. The system consisted of four concrete lysimeters. Each lysimeter was 108 cm long, 76 cm wide, and 64 cm deep. The concrete tanks were tested for leaks and a corrugated plastic drainage tile of 10.2 cm inside diameter with fiberglass was installed at the bottom of the tank. The tanks were fitted with about 30 cm long and 3.2 cm ID PVC pipe, which was connected to the water control system designed for each tank separately. A typical arrangement for water supply and drainage is given in Fig. 1. A 3.8 cm ID PVC pipe was also installed at the corner for observing the water table depth. The lysimeters were designed to maintain a constant water table at a given depth. The water table depths studied were 8 cm and 38 cm with one replication. Lysimeters were packed with Pahokee muck (Lithic Medisaprist) in layers. The soil was subjected to three wetting-drying cycles to permit any settling of the material. The bulk density of the top layer (30 cm), which was determined from four core samples in each lysimeter, was about 0.3 g/cm3, whereas the lower layer of soil had a bulk density of about 0.25 g/cm3. The lower layer of soil had a relatively less decomposed organic matter. This was done to simulate the soil profile condition in the field. The study period was from August 29, 1980-October 29, 1981 with a total of 61 weeks.
The Standard Class A National Weather Service Evaporation Pan located at the AREC was used to measure the standard pan evaporation.
367
J. Irrig. Drain Eng. 1983.109:366-376.
Dow
nloa
ded
from
asc
elib
rary
.org
by
UN
IVE
RSI
TE
LA
VA
L o
n 07
/06/
14. C
opyr
ight
ASC
E. F
or p
erso
nal u
se o
nly;
all
righ
ts r
eser
ved.
STAND PIPE
...WARiS.TW.f,.,,., -,
WATER LEVEL CONTROL TANK-
CHECK VALVE
DRAINAGE TANK
STANDPIPE
WATER CONTROL TANK
— OUTLET FOR EXCESS WATER
LrSIMETER1 CIRCULATORY PUMP
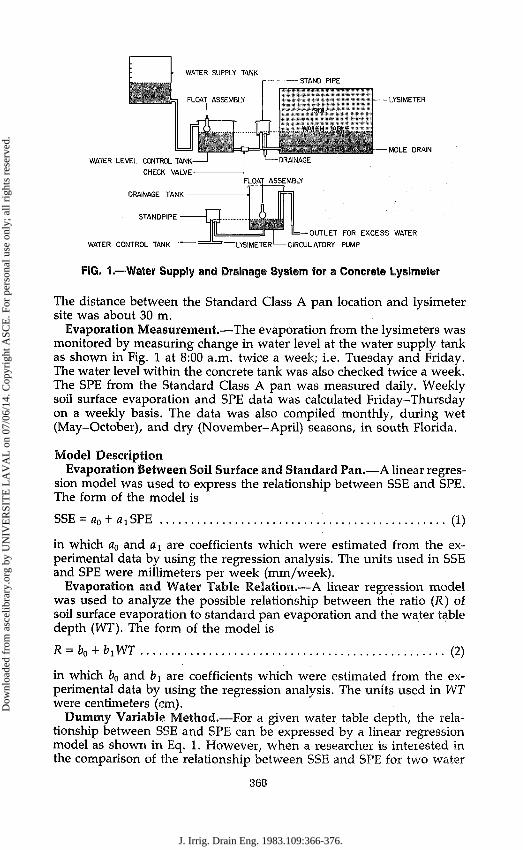
FIG. 1.—Water Supply and Drainage System for a Concrete Lysimeter
The distance between the Standard Class A pan location and lysimeter site was about 30 m.
Evaporation Measurement.—The evaporation from the lysimeters was monitored by measuring change in water level at the water supply tank as shown in Fig. 1 at 8:00 a.m. twice a week; i.e. Tuesday and Friday. The water level within the concrete tank was also checked twice a week. The SPE from the Standard Class A pan was measured daily. Weekly soil surface evaporation and SPE data was calculated Friday-Thursday on a weekly basis. The data was also compiled monthly, during wet (May-October), and dry (November-April) seasons, in south Florida.
Model Description Evaporation Between Soil Surface and Standard Pan.—A linear regres
sion model was used to express the relationship between SSE and SPE. The form of the model is
SSE = a0 + «iSPE (1)
in which a0 and a^ are coefficients which were estimated from the experimental data by using the regression analysis. The units used in SSE and SPE were millimeters per week (mm/week).
Evaporation and Water Table Relation.—A linear regression model was used to analyze the possible relationship between the ratio (R) of soil surface evaporation to standard pan evaporation and the water table depth (WT). The form of the model is
R = b0 + b1WT (2)
in which b0 and b\ are coefficients which were estimated from the experimental data by using the regression analysis. The units used in WT were centimeters (cm).
Dummy Variable Method.—For a given water table depth, the relationship between SSE and SPE can be expressed by a linear regression model as shown in Eq. 1. However, when a researcher is interested in the comparison of the relationship between SSE and SPE for two water
368
J. Irrig. Drain Eng. 1983.109:366-376.
Dow
nloa
ded
from
asc
elib
rary
.org
by
UN
IVE
RSI
TE
LA
VA
L o
n 07
/06/
14. C
opyr
ight
ASC
E. F
or p
erso
nal u
se o
nly;
all
righ
ts r
eser
ved.

table depths, an important procedure is to compare the difference between two linear regressions. While the Chow-test (2) can be applied to test the difference between two linear regressions, it is not able to identify the sources of variation whether due to intercept terms or slope coefficients. A multiple regression can also be applied to test the difference between two slope coefficients by adding an additional independent variable of water table depth. However, the interpretation of the results will be complicated and unreliable if interaction effects exist among independent variables. To overcome this type of problem, recently Gu-jarati (5,6) developed the dummy variable technique as an alternative method of analysis of variance and Chow-test to test the difference between two linear regressions.
To present the dummy variable technique, assume that the relationship between SSE (i.e. dependent variable, Y) and the SPE (i.e. independent variable, X) in groups 1 and 2 can be written as a linear model. Thus
Yu = a0 + a1Xll + eu; i = l,...,Nl (3)
Y2i = b0 + b1X2i + e2i; i = l,...,N2 (4)
in which the subscripts 1 and 2 refer to the groups 1 and 2 observations; «o/ « i , £u, Ni, and b0, blt e2i, N2 are the intercepts, slopes, stochastic error terms, and total number of observations in group 1 and group 2, respectively. Assume that ei; and e2i are both normally distributed with variance CT2 and mean zero, i.e.
E(eji) = 0
Var {fift) = a2, for ; = 1, 2 i = 1, . . . , N,
Cov (e;-,-, ejV) = 0, for i¥=i'
The Chow test (2) can be applied to compare the difference between regression Eq. 3 and regression Eq. 4 without specifying whether the difference is due to slopes or intercept terms. The dummy variable approach can be applied to test specifically whether a0 equals to b0 or a\ equals to bx . The testing technique is performed by introducing dummy variable D in the regression Eqs. 3 and 4. Thus
Yi = c0 + C l D + c2X, + c3(DXi) +e, i = 1, . . . , (Nj + N2) (5)
in which D = 1, if the observation lies in the first group, D = 0, if the observation lies in the second group, c0 = the intercept for the second group, Ci = the difference between intercept for the second group (c0) and the intercept for the first group, c2 = the slope for the second group, and c3 = the difference between the second group (c2) and the slope for the first group.
The relationship between dummy variable regression Eq. 5 and simple linear regressions, Eqs. 3 and 4, are shown in Fig. 2. The following relationships can be drawn:
fl0 = c0 + c1; a1 = c2 + c3; b0 = c0; b^ = c2 (6)
The matrix representation for Eq. 5 is expressed as
369
J. Irrig. Drain Eng. 1983.109:366-376.
Dow
nloa
ded
from
asc
elib
rary
.org
by
UN
IVE
RSI
TE
LA
VA
L o
n 07
/06/
14. C
opyr
ight
ASC
E. F
or p
erso
nal u
se o
nly;
all
righ
ts r
eser
ved.

CO
< tr
Q Z
CL
C3=a,-b1
Y1.C0*C1D*CzX1+C,(DX,)+el
.0)
-»X INDEPENDENT VARIABLE
FIG. 2.—Relationship between Dummy Variable Regression and Simple Regression
Y = XC + e (7)
in which Y is a (Nx + N2) x 1 vector, X is a (N1 + N2) x 4 design matrix, C is a 4 X 1 parameter vector, e ~ N(0,<r2/) and 7 is an (Nx + N2) x (IV i + N2) identity matrix.
The least square estimator c of parameter C in Eq. 7 is 6 = (X'X)~1X'Y, with Var (c) = (X'X)"1 a2. The unbiased estimator of a2 is s2, since (X 'X) -V, i.e. Var (6) = ( X ' X ) - V in which s2 = (Y'Y - 6'X'Y)/(N1 + N2 - 4).
The Student f-test or F-test can be applied to test the null hypothesis H:C: = 0. Thus
t = -VdW2
with (Nx + N2 - 4) degrees-of-freedom
F = ~—: with (l ,Ni + N2 - 4) degrees-of-freedom ..
in which dl7 = ith diagonal element of (X'X) - 1 matrix.
(8)
(9)
RESULTS
Soil Surface Evaporation and Standard Pan Evaporation Relation.— The weekly data for soil surface evaporation with water table depths maintained at 8 cm (SSE8) and 38 cm (SSE38), and standard pan evaporation for the 61-week period were analyzed as follows:
Statistical Information.—The mean, standard deviation, and mini-
370
J. Irrig. Drain Eng. 1983.109:366-376.
Dow
nloa
ded
from
asc
elib
rary
.org
by
UN
IVE
RSI
TE
LA
VA
L o
n 07
/06/
14. C
opyr
ight
ASC
E. F
or p
erso
nal u
se o
nly;
all
righ
ts r
eser
ved.
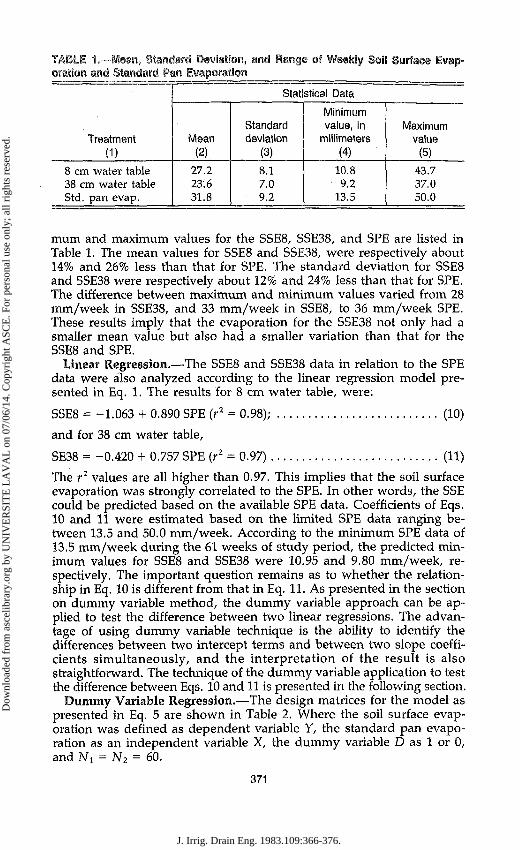
TABLE 1.—Mean, Standard Deviation, and Range of Weekly Soil Surface Evaporation and Standard Pan Evaporation
Treatment (D
8 cm water table 38 cm water table Std. pan evap.
Mean (2)
27.2 23.6 31.8
Statistical Data
Standard deviation
(3)
8.1 7.0 9.2
Minimum value, in
millimeters (4)
10.8 9.2
13.5
Maximum value
(5)
43.7 37.0 50.0
mum and maximum values for the SSE8, SSE38, and SPE are listed in Table 1. The mean values for SSE8 and SSE38, were respectively about 14% and 26% less than that for SPE. The standard deviation for SSE8 and SSE38 were respectively about 12% and 24% less than that for SPE. The difference between maximum and minimum values varied from 28 mm/week in SSE38, and 33 mm/week in SSE8, to 36 mm/week SPE. These results imply that the evaporation for the SSE38 not only had a smaller mean value but also had a smaller variation than that for the SSE8 and SPE.
Linear Regression.—The SSE8 and SSE38 data in relation to the SPE data were also analyzed according to the linear regression model presented in Eq. 1. The results for 8 cm water table, were:
SSE8 = -1.063 + 0.890 SPE (r2 = 0.98); (10)
and for 38 cm water table,
SE38 = -0.420 + 0.757 SPE (r2 = 0.97) (11)
The r2 values are all higher than 0.97. This implies that the soil surface evaporation was strongly correlated to the SPE. In other words, the SSE could be predicted based on the available SPE data. Coefficients of Eqs. 10 and 11 were estimated based on the limited SPE data ranging between 13.5 and 50.0 mm/week. According to the minimum SPE data of 13.5 mm/week during the 61 weeks of study period, the predicted minimum values for SSE8 and SSE38 were 10.95 and 9.80 mm/week, respectively. The important question remains as to whether the relationship in Eq. 10 is different from that in Eq. 11. As presented in the section on dummy variable method, the dummy variable approach can be applied to test the difference between two linear regressions. The advantage of using dummy variable technique is the ability to identify the differences between two intercept terms and between two slope coefficients simultaneously, and the interpretation of the result is also straightforward. The technique of the dummy variable application to test the difference between Eqs. 10 and 11 is presented in the following section.
Dummy Variable Regression.—The design matrices for the model as presented in Eq. 5 are shown in Table 2. Where the soil surface evaporation was defined as dependent variable Y, the standard pan evaporation as an independent variable X, the dummy variable D as 1 or 0, and Ni= N2 = 60.
371
J. Irrig. Drain Eng. 1983.109:366-376.
Dow
nloa
ded
from
asc
elib
rary
.org
by
UN
IVE
RSI
TE
LA
VA
L o
n 07
/06/
14. C
opyr
ight
ASC
E. F
or p
erso
nal u
se o
nly;
all
righ
ts r
eser
ved.

TABLE 2.—Design Matrix Comparison between Soil Surface Evaporation at Different Water Table Depths Related to the Standard Pan Evaporation
Weeks of observation
(1)
Soil surface evaporation
Y, in millimeters per week
(2)
Constant Co (3)
Dummy variable
D (4)
Standard pan evaporation
X, in millimeters per week
(5)
DX, in millimeters per week
(6)
(a) 8 cm water table depth 1 2 3
59 60 61
16 32 27
30 25 20
1 1 1
1 1 1
1 1 1
1 1 1
19 35 31
33 29 24
19 35 31
33 29 24
(b) 38 cm water table depth 1 2 3
59 60 61
14 27 23
25 22 17
1 1 1
1 1 1
0 0 0
0 0 0
19 35 31
33 29 24
0 0 0
0 0 0
The result of dummy variable regression of soil surface evaporation with 8 and 38 cm water table depth, Y, yield as
Y = -0.420 - 0.643"SD + 0.757** X + 0.133**DX (r2 = 0.98) (12)
in which D is a dummy variable, X is the SPE, -0.420 is the intercept term for SSE38, -0.643 is the differential intercept between SSE8 and SSE38, 0.757 is the slope coefficient for SSE38, 0.133 is the differential slope coefficient between SSE38 and SSE8, "ns" denotes the nonsignificant at 0.05 level by using the f-test, and "**" denotes the highly significant at 0.01 level by using the f-test. As Eq. 12 shows, the intercept for SSE8 and SSE38 are statistically equivalent because the difference -0.643 is nonsignificant at 0.05 level by using the t-test. The highly significant slope of 0.757 for SSE38 and the highly significant "slope difference of 0.133" imply that not only the SSE for both 8 and 38 cm water table depths were directly proportional to the SPE, but also the SSE for 38 cm water table was significantly less proportional to the SPE than the SSE for the 8 cm water table depth. In other words, the SSE for 38 cm water table was significantly smaller in value than that for the 8 cm water table depth.
Soil Surface Evaporation Related to Water Table Monthly Evaporation.—The weekly SSE8, SSE38, and SPE as shown
in Table 1 were compiled on a monthly basis and the results are plotted in Fig. 3. When the SPE value was low, such as in the months of No-
372
J. Irrig. Drain Eng. 1983.109:366-376.
Dow
nloa
ded
from
asc
elib
rary
.org
by
UN
IVE
RSI
TE
LA
VA
L o
n 07
/06/
14. C
opyr
ight
ASC
E. F
or p
erso
nal u
se o
nly;
all
righ
ts r
eser
ved.

STANDARD PAN EVAPORATION
' « SOIL SURFACE EVAPORATION WITH Bern WATER TABLE
a a SOIL SURFACE EVAPORATION WITH 38cm WATER TABLE
_ 1 _ J _ J _ J i _ J _ J > I I I _l L_J SEP OCT NOV DEC. JAN. FEB. MAR. APR. MAY JUN. JUL. AUG. SER OCT.
TIME PERIOD, MONTH
FIGS. 3.—Monthly Standard Pan Evaporation and Surface Evaporation from Pa-hokee Muck Soil Varying with Time
vember, December, January, and February, the deviation among the SSE8, SSE38, and SPE were very low as compared with the other months which had a high SPE value. In other words, increasing the water table depth at the end of dry season such as March, April, and May, which mark the critical water demand period in Florida during the dry year, could considerably reduce the evaporation from the soil surface. However, the subsidence rate of organic soil is proportional to the water table depth (13). Thus, the optimum water table depth maintained for organic soil should be a well justified compromise between the water saving and the subsidence rate increasing. In other types of soil, increasing the water table depth seems to be a feasible way to reduce the evaporation loss from the soil surface, particularly during the period which has a high SPE value.
Ratio Between Soil Surface Evaporation and Standard Pan Evaporation.—The ratios of SSE8/SPE, and SSE38/SPE were summarized for the
TABLE 3.—Mean and Standard Deviation of the Ratio Between Soil Surface Evaporation (SSE) and Standard Pan Evaporation (SPE)
Water table
depth, In centimeters
(D 8
38
RATIO BETWEEN SOIL SURFACE EVAPORATION AND STANDARD PAN EVAPORATION
Dry Season
Mean (2)
0.840 0.725
Standard deviation
(3)
0.024 0.035
Wet Season
Mean (4)
0.858 0.746
Standard deviation
(5)
0.010 0.011
Total Period
Mean (6)
0.851 0.738
Standard deviation
(7)
0.019 0.026
220
20C
ISO
I 160
i 140
6 § 100
% 80 S . 60 3
1 ̂ 2 20
n
373
J. Irrig. Drain Eng. 1983.109:366-376.
Dow
nloa
ded
from
asc
elib
rary
.org
by
UN
IVE
RSI
TE
LA
VA
L o
n 07
/06/
14. C
opyr
ight
ASC
E. F
or p
erso
nal u
se o
nly;
all
righ
ts r
eser
ved.
dry and wet seasons, and total study period. The results of mean and standard deviation for those ratios are listed in Table 3. The wet season had a higher mean ratio than the dry season but had less of a standard deviation. This means that the soil surface evaporation in wet season had a smaller deviation from the standard pan evaporation and had a more homogeneous distribution within the wet season than that in the dry season.
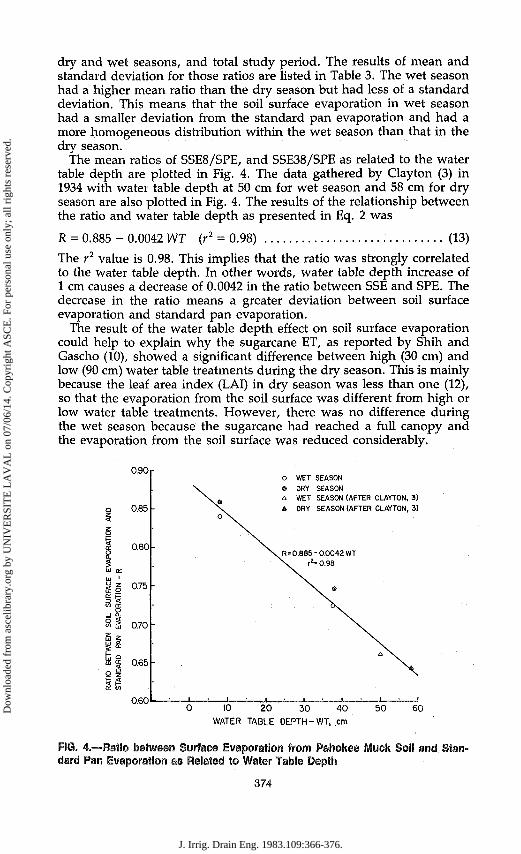
The mean ratios of SSE8/SPE, and SSE38/SPE as related to the water table depth are plotted in Fig. 4. The data gathered by Clayton (3) in 1934 with water table depth at 50 cm for wet season and 58 cm for dry season are also plotted in Fig. 4. The results of the relationship between the ratio and water table depth as presented in Eq. 2 was
R = 0.885 - 0.0042 WT (r2 = 0.98) ; (13)
The r2 value is 0.98. This implies that the ratio was strongly correlated to the water table depth. In other words, water table depth increase of 1 cm causes a decrease of 0.0042 in the ratio between SSE and SPE. The decrease in the ratio means a greater deviation between soil surface evaporation and standard pan evaporation.
The result of the water table depth effect on soil surface evaporation could help to explain why the sugarcane ET, as reported by Shih and Gascho (10), showed a significant difference between high (30 cm) and low (90 cm) water table treatments during the dry season. This is mainly because the leaf area index (LAI) in dry season was less than one (12), so that the evaporation from the soil surface was different from high or low water table treatments. However, there was no difference during the wet season because the sugarcane had reached a full canopy and the evaporation from the soil surface was reduced considerably.
0.90r
0.85
0.80
0.75
0.70
0.65
0.60
O WET SEASON
© DRY SEASON a WET SEASON (AFTER CLAYTON, 3)
A DRY SEASON (AFTER CLAYTON, 3)
. R= 0.885 - 0 . 0 0 4 E W T
rz= 0.98
10 20 30 WATER TABLE DEPTH-WT,
40 cm
50 60
FIG. 4.—Ratio between Surface Evaporation from Pahokee , dard Pan Evaporation as Related to Water Tabla Depth
luck Soil and Stan-
374
J. Irrig. Drain Eng. 1983.109:366-376.
Dow
nloa
ded
from
asc
elib
rary
.org
by
UN
IVE
RSI
TE
LA
VA
L o
n 07
/06/
14. C
opyr
ight
ASC
E. F
or p
erso
nal u
se o
nly;
all
righ
ts r
eser
ved.

CONCLUSIONS
The experiments were conducted in lysimeters for studying the evaporation from soil surface in relation to water table depth and standard pan evaporation (SPE). Dummy variables 1 and 0 were used as an alternative to analyze the variance and covariance to compare the soil surface evaporation (SSE) difference between high (8 cm) and low (38 cm) water table treatments. Several conclusions may be drawn.
The dummy variable regression not only performs as well as the standard linear regression, but also can simultaneously test the difference between two regression lines whether due to slope coefficients or intercept terms.
The SSE for both 8 and 38 cm water depths were directly proportional to the SPE. The SSE for 38 cm water table was significantly less proportional to the SPE than the SSE for the 8 cm water table depth.
The optimum water table depth maintained for organic soil should be a well justified compromise between the water saving and the subsidence rate increase. In other types of soil, increasing water table depth seems to be a feasible way to reduce the evaporation loss from the soil surface.
The SSE in wet season had a smaller deviation from the SPE and had a more homogeneous distribution within the wet season than that in the dry season.
ACKNOWLEDGMENTS
This study was partially supported by grant contract No. 4-FCD-22 from the South Florida Water Management District. The author also thanks Messrs. W. L. Cheng, G. C. Wachter, N. L. Harrison and G. S. Rahi for their assistance in this study.
APPENDIX.—REFERENCES
1. Chang, J. H., "Microclimate of Sugarcane," Hawaiian Planters' Record, Vol. 56, 1961, pp. 195-225.
2. Chow, C., "Test of Equality Between Sites of Coefficients in Two Linear Regressions," Econometrica, Vol. 38, No. 3, 1960, pp. 591-605.
3. Clayton, B. C, "Water Control Investigation," Report of Progress, Project 89, University of Florida, Agricultural Research and Education Center, Belle Glade, Florida 33430, Dec, 1934, p. 10.
4. Green, R. D., and Doll, J. P., "Dummy Variables and Seasonality—A Curio," American Statistics, Vol. 28, No. 1, 1974, pp. 60-62.
5. Gujarati, D., "Use of Dummy Variables in Testing for Equality Between Sets of Coefficients in Two Linear Regressions—A Note," American Statistics, Vol. 24, No. 1, 1970, pp. 50-52.
6. Gujarati, D., "Use of Dummy Variables in Testing for Equality Between Sets of Coefficients in Linear Regression—A Generalization," American Statistics, Vol. 24, No. 5, 1970, pp. 18-22.
7. Haise, H. R., and Hagan, R. M., "Soil, Plant and Evaporative Measurements as Criteria for Scheduling Irrigation," Irrigation of Agricultural Land, R. M. Hagan, H. R. Haise, and T. W. Edminster, ed., Agronomy Monograph No. 11, American Society of Agronomy, 1967, p. 597.
8. Johnston, J., Econometric Methods, McGraw-Hill, New York, N.Y., 1966. 9. Kmenta, J., Elements of Econometrics, Macmillan, New York, N.Y., 1971.
375
J. Irrig. Drain Eng. 1983.109:366-376.
Dow
nloa
ded
from
asc
elib
rary
.org
by
UN
IVE
RSI
TE
LA
VA
L o
n 07
/06/
14. C
opyr
ight
ASC
E. F
or p
erso
nal u
se o
nly;
all
righ
ts r
eser
ved.
10. Shih, S. F., and Gascho, G. J., "Water Requirement for Sugarcane Production," Transactions, American Society of Agricultural Engineers, Vol. 23, No. 4, 1980, pp. 934-937.
11. Shih, S. F., Allen, L. H. Jr., Hammond, L. C., Jones, J. W., Rogers, J. S., and Smajstrla, A. G., "Basinwide Water Requirement Estimation in Southern Florida," Transactions, American Society of Agricultural Engineers, Vol. 26, No. 3, 1983, pp. 760-766.
12. Shih, S. F., and Rahi, G. S., "Pan Evaporation as Related to Sugarcane Leaf Area Index," Proceedings, Soil and Crop Science of Florida, Vol. 42, 1983, pp. 80-85.
13. Stephens, J. C , "Subsidence of Organic Soils in the Florida Everglades," Proceedings, Soil Science of America, Vol. 20, No. 1, 1956, pp. 77-80.
14. Tanner, C. B., "Measurement of Evapotranspiration," Irrigation of Agricultural Lands, R. M. Hagan, H. R. Haise, and T. W. Edminister, ed., Agronomy Monograph No. 11, American Society of Agronomy, 1967, p. 567.
376
J. Irrig. Drain Eng. 1983.109:366-376.
Dow
nloa
ded
from
asc
elib
rary
.org
by
UN
IVE
RSI
TE
LA
VA
L o
n 07
/06/
14. C
opyr
ight
ASC
E. F
or p
erso
nal u
se o
nly;
all
righ
ts r
eser
ved.