soil respiration contributes substantially to urban …€¦ · soil respiration contributes...
TRANSCRIPT
lable at ScienceDirect
Environmental Pollution 212 (2016) 433e439
Contents lists avai
Environmental Pollution
journal homepage: www.elsevier .com/locate/envpol
Soil respiration contributes substantially to urban carbon fluxes in thegreater Boston area*
Stephen M. Decina a, *, Lucy R. Hutyra b, Conor K. Gately b, Jackie M. Getson b,Andrew B. Reinmann b, Anne G. Short Gianotti b, Pamela H. Templer a
a Department of Biology, Boston University, Boston, MA, 02215, USAb Department of Earth and Environment, Boston University, Boston, MA, 02215, USA
a r t i c l e i n f o
Article history:Received 21 November 2015Received in revised form5 January 2016Accepted 5 January 2016Available online xxx
Keywords:Urban ecologyBiogeochemistryFossil fuelsCO2 flux
* This paper has been recommended for acceptanc* Corresponding author.
E-mail addresses: [email protected] (S.M. Decina), [email protected] (C.K. Gately), [email protected] (J.M.(A.B. Reinmann), [email protected] (A.G. Short(P.H. Templer).
http://dx.doi.org/10.1016/j.envpol.2016.01.0120269-7491/© 2016 Elsevier Ltd. All rights reserved.
a b s t r a c t
Urban areas are the dominant source of U.S. fossil fuel carbon dioxide (FFCO2) emissions. In the absenceof binding international treaties or decisive U.S. federal policy for greenhouse gas regulation, cities havealso become leaders in greenhouse gas reduction efforts through climate action plans. These plans focuson anthropogenic carbon flows only, however, ignoring a potentially substantial contribution to atmo-spheric carbon dioxide (CO2) concentrations from biological respiration. Our aim was to measure thecontribution of CO2 efflux from soil respiration to atmospheric CO2 fluxes using an automated CO2 effluxsystem and to use these measurements to model urban soil CO2 efflux across an urban area. We find thatgrowing season soil respiration is dramatically enhanced in urban areas and represents levels of CO2
efflux of up to 72% of FFCO2 within greater Boston's residential areas, and that soils in urban forests,lawns, and landscaped cover types emit 2.62 ± 0.15, 4.49 ± 0.14, and 6.73 ± 0.26 mmolCO2 m�2 s�1,respectively, during the growing season. These rates represent up to 2.2 times greater soil respirationthan rates found in nearby rural ecosystems in central Massachusetts (MA), a potential consequence ofimported carbon amendments, such as mulch, within a general regime of landowner management. Asthe scientific community moves rapidly towards monitoring, reporting, and verification of CO2 emissionsusing ground based approaches and remotely-sensed observations to measure CO2 concentrations, ourresults show that measurement and modeling of biogenic urban CO2 fluxes will be a critical componentfor verification of urban climate action plans.
© 2016 Elsevier Ltd. All rights reserved.
1. Introduction
The global urban population is forecast to grow by 2.5 billionpeople by the year 2050, with seven of every ten people projectedto reside in an urban area by mid-century (United Nations, 2014).The spatial extent of urban areas is also projected to triple,increasing by over 1 million km2 between 2000 and 2030 (Setoet al., 2012). Though fossil fuel carbon dioxide (FFCO2) emissionsfrom cities produce the preponderance of global FFCO2 emissions(Energy Information Administration, 2013), a growing urban pop-ulation also has the potential to engender per-capita emissions
e by B. Nowack.
[email protected] (L.R. Hutyra),Getson), [email protected]
Gianotti), [email protected]
reductions, as cities, particularly in the United States, form thevanguard of the civic response to climate change through localclimate action plans (Rosenzweig et al., 2010; Wang, 2012). Forclimate action plans to be effective, they must be evaluated rigor-ously and regularly, which requires accurate reporting of green-house gas fluxes (e.g. the 2010 CalNex campaign; Ryerson et al.,2013), combined with monitoring and verification of atmosphericcarbon dioxide (CO2) concentrations from ground based measure-ments and satellite remote sensing (Duren and Miller, 2012;McKain et al., 2012; Rella et al., 2015). However, both of these ap-proaches currently ignore the biogenic contribution to urban at-mospheric CO2 concentrations; bottom-up emissions data treat theurban carbon cycle as entirely driven by fossil fuel emissions(Kennedy et al., 2010; Hutyra et al., 2014) and measurements ofcolumn-averaged atmospheric CO2 concentrations, such as thosemade by NASA's Orbiting Carbon Observatory (OCO-2) satellite(Boesch et al., 2011), are made without specific attribution betweenanthropogenic and biogenic sources.
S.M. Decina et al. / Environmental Pollution 212 (2016) 433e439434
As early as 1979, researchers suggested that separatinganthropogenic and biogenic CO2 fluxes would be critical for theunderstanding of urban carbon cycling (McRae and Graedel, 1979).Photosynthesis has been shown to periodically reduce urban at-mospheric CO2 concentrations in diverse locations (McRae andGraedel, 1979; Day et al., 2002; Clark-Thorne and Yapp, 2003;Moriwaki and Kanda, 2004; Coutts et al., 2007; Kordowski andKuttler, 2010; Pawlak et al., 2011), while ecosystem respiration isknown to produce measureable amounts of CO2 in urban areas(Pataki et al., 2003; Zimnoch et al., 2010; G�orka and Lewicka-Szczebak, 2013). Using radioactive isotope tracers, Miller et al.(2012) detected the constant presence of biogenic CO2 in thelower troposphere near cities and suggested that CO2 attribution toanthropogenic sources requires measurement and exclusion ofbiological sources. Despite the evidence that biogenic urban CO2fluxes can be important, we still know little about the magnitude ofthe urban biogenic CO2 flux relative to FFCO2 emissions on alandscape scale. Rates of CO2 efflux from soil respiration, a criticalcomponent of the biogenic CO2 flux, have only been measured in ahandful of urban studies inmesic systems, and themajority of thesestudies were either spatially or temporally limited (Kaye et al.,2005; Groffman et al., 2006; Vesala et al., 2008; Groffman et al.,2009; Chen et al., 2014; Chun et al., 2014; Smorkalov andVorobeichik, 2015; Ng et al., 2015) precluding extrapolation andhindering comparisons with FFCO2 emissions. As total CO2 effluxfrom soil respiration dwarfs anthropogenic CO2 emissions world-wide, urban soil respiration merits a closer look.
The objectives of this study were to quantify rates of growingseason CO2 efflux from soil respiration at high temporal and spatialresolution across the greater Boston, Massachusetts (MA) area andto use these rates to create a spatially explicit model of soil CO2
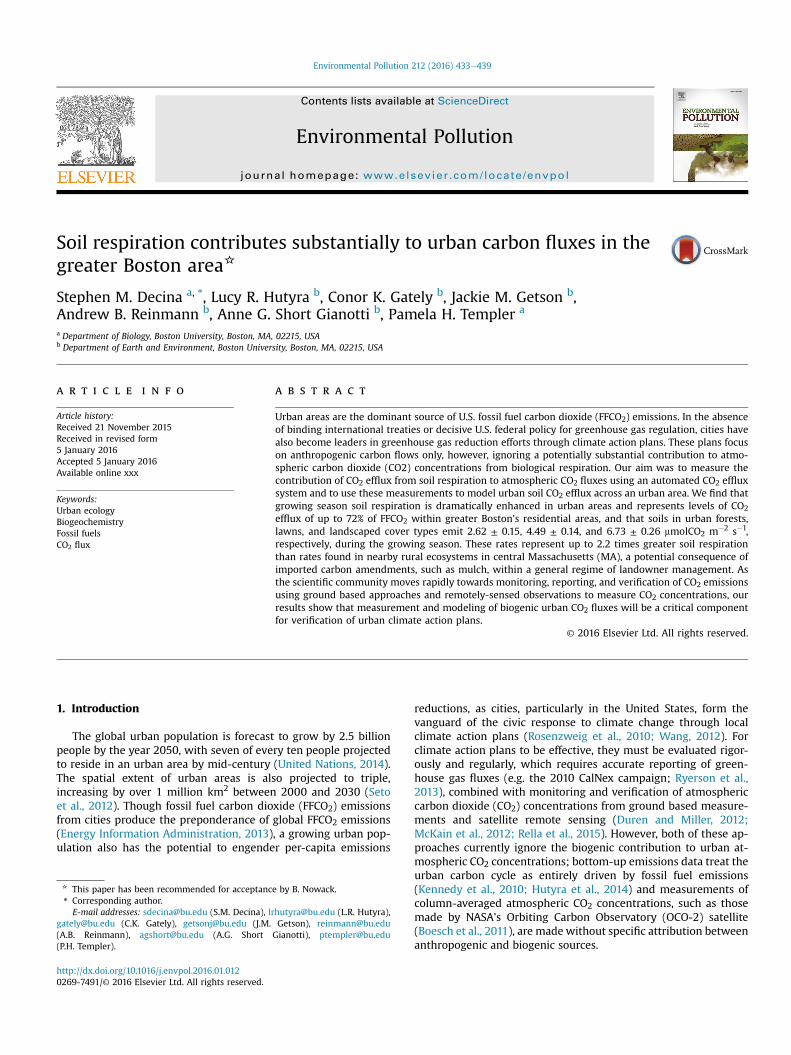
Fig. 1. Study area. Blue points represent soil respiration measurement sites. Orange box ouInterstate Highway 95 (I-95) is highlighted in red. In the inset, current OCO-2 summer nadirlegend, the reader is referred to the web version of this article.)
efflux along an urbanization gradient. We expected to find higherrates of soil respiration in areas with more intensive landownermanagement, such as residential areas with pervious surfaces likelawns and flowerbeds. To address our objectives and test our hy-pothesis, we took direct field measurements of soil respirationusing an automated soil CO2 efflux system and used geographicinformation systems (GIS) and data from a landowner survey tomodel these fluxes along a transect originating in downtown Bos-ton and extending 25 km west into suburban Concord, MA.
2. Methods
2.1. Site selection and measurements
The greater Boston area is the 10th largest metropolitan area inthe United States (US Census Bureau, 2013) and has a temperateclimate, with mean summer and winter temperatures of 21.7 �Cand�0.1 �C, respectively, and approximately 110 cm of precipitationper year (National Climatic Data Center). To characterize variationsin soil CO2 efflux across this area, we sampled at 15 sites (Fig. 1) andwithin three potential cover types at each site: forest, lawn, andlandscaped. Sites were chosenwith varying amounts of surroundingdevelopment (Supplementary Fig. 1). All sites had hardwood treecanopies, no pets, and were in secured locations.
In early May 2014, 20.2 cm-diameter PVC collars were mountedinto the soil at each site. After installation, collars were left toequilibrate in the soil for 2e3 weeks to avoid the pulse of CO2 effluxassociated with severed roots caused by installation. Sites thatincluded lawn (n ¼ 13), defined as an area whose dominant vege-tationwas grass at some point during the growing season, receivedfour sample collars, with two collars in the lawn and two collars in
tlines 25 km transect from downtown urban Boston to suburban Concord, MA (Fig. 3).tracks are shown in green. (For interpretation of the references to colour in this figure
Table 2Multivariate model formulations.
Parameters Coefficient p-value
Intercept �8.440 0.020Cover type 3.813 0.041Management 0.952 0.366Litter depth 0.269 0.042Soil C:N 0.521 0.001
S.M. Decina et al. / Environmental Pollution 212 (2016) 433e439 435
the other dominant cover type at the site, either forest or land-scaped. Sites without lawn (n ¼ 2) received two collars in the onedominant cover type at the site, either forest or landscaped. Forestcover type was defined as an unmanaged area at least 100 m indiameter whose dominant vegetation was trees. Landscaped covertype was defined as areas not covered by grass at any point duringthe growing season and generally contained shrubs, flowers, andtrees that were confined to a small area of the property. Landscapedcover type had variable management regimes across sites, thoughall received some intervention from homeowners. The total num-ber of soil respiration collars installed across all three cover typesfor this study was n ¼ 56.
Soil CO2 efflux was measured every two weeks from 27 May2014 to 5 November 2014 using an automated CO2 soil efflux sys-tem with a 20 cm diameter survey chamber (LiCor-8100A infraredgas analyzer, LiCor Inc., Lincoln, NE). Soil CO2 efflux was calculatedfor each measurement as given in Davidson et al. (1998). At thetime of measurement, volumetric water content (#88311E, OmegaEngineering Inc., Stamford, CT) was recorded at a depth of 10 cm.LiCor chamber air temperature was also recorded for eachobservation.
Measurements of air temperature, soil moisture, soil organicmatter (OM) concentration, soil carbon to nitrogen (C:N) ratio, soilpH, soil bulk density, litter depth, and litter mass were collected ineach cover type at each site. Soil samples beneath the litter layer(0e10 cm depth) were collected once during the growing seasonusing a slide hammer and 10 cm PVC liner placed inside the soilcorer. Three replicate soil cores adjacent to the respiration collarswere collected for each cover type at each site. Soils were sievedthrough a 2 mm sieve and homogenized, a subsample wasremoved, and the subsample oven-dried at 60 �C for one week toobtain percent soil moisture for each sample. Soil pH was deter-mined by hydrating 5 g of soil with 10 mL of DDI H2O, shaking for30 min on a shaker table, and then pH measured with a pH meter.For soil organic matter, 10 g subsamples were oven-dried at 60 �Cfor oneweek, reweighed, and then placed inside a muffle furnace at400 �C for 4 h and reweighed again. Soil C:N ratio was measured bygrinding oven-dried soils into a fine powder and combusting in aC:N analyzer (NC2500 Elemental Analyzer, CE Elantech, Lakewood,NJ). Bulk density was calculated dividing mass of an oven-dried soilby its volume (excluding the mass and volume of rocks in thesample). In June and November 2014, soil litter depth wasmeasured at four points next to each PVC collar and averaged. InAugust 2014, leaf litter within a 900 cm2 square adjacent to thecollar was collected, dried for two weeks, and weighed. Summarydata are listed in Table 1. Model formulations using these data arelisted in Table 2.
2.2. Survey data
The Community and Conservation Survey of Massachusetts(CCS) was used to generate estimates of cover type fractions forresidential properties, as well as to determine homeowner usage of
Table 1Litter and soil characteristics, along with soil respiration (Rs) CO2 efflux, by cover type.
Cover type Sites (n) Obs. (n) Littera S
Depth (cm) Mass (g) O
Jun Nov
Forest 3 83 0.92 5.09 76.72 1Lawn 13 292 0.63 3.88 1.64Landscaped 12 309 3.00 5.86 63.67 1
a Leaf litter within a 900 cm2 square adjacent to the collar.
soil amendments (e.g. fertilizer and mulch). The CCS is a largemultipart survey instrument that was distributed to private land-owners in 33 towns in eastern and central MA as part of a com-plementary study as well as to the 14 homeowners in this study(n ¼ 428). The survey instrument included questions regardingproperty characteristics, use, management, and demographics. Thesurvey questionnaire was developed and pre-tested through a se-ries of six focus groups that included urban, suburban, and rurallandowners. The towns included in this study fall along two tran-sects originating in the City of Boston and extending ~100 kmwestward. Development patterns, land uses, vegetation, and com-munity characteristics vary along the study transects.
Survey recipients were selected using a stratified randomsampling. The sample was drawn from assessor tax records con-taining information on the location, size, and use of parcels as wellas landowner names andmailing addresses. The survey was mailedto 1758 landowners in spring 2013, following a modified TailoredDesign Method (Dillman, 2007). The survey included questionsabout property characteristics and demographics. Homeownerswere asked to indicate the size of their property and to estimate thefraction of their property with different surface types (e.g., build-ings, driveway, lawn that is mowed, other yard not mowed,woodlands), as well as to describe land management practices. Ofthe mailed surveys, 114 were undeliverable or disqualified becausethe respondent was deceased or no longer owned land in MA. Atotal of 414 surveys were returned and usable, giving an effectiveresponse rate of 25.2%. While the response rate varied significantlybetween the 33 towns included in the study, we found no signifi-cant differences in response rate of urban, suburban, and ruralareas. Upon return, the landowner surveys were geocoded usingthe Massachusetts Land Parcel Database, v. 1.0 (Metropolitan AreaPlanning Council, 2013). To determine the amount of each landcover type in residential parcels, the landowner parcels werecompared to the Massachusetts Office of Geographic Information(MassGIS) land use layer (MassGIS, 2009); only parcels that werecompletely within the exclusively residential land use classes(n ¼ 61) were included in this study. The mean land cover typefractions (lawn, landscaped, forest) were calculated and used toestimate residential soil respiration efflux.
2.3. Scaling soil CO2 efflux
To extrapolate rates of soil respiration across the 25 km transect,
oil
M(%) pH C:N Bulk r(g cm�3) Seasonal mean Rs
(mmolCO2 m�2 s�1 ± SE)
4 5.13 18.53 0.61 2.62 ± 0.158 6.28 16.06 0.88 4.49 ± 0.145 5.88 18.68 0.64 6.73 ± 0.26
S.M. Decina et al. / Environmental Pollution 212 (2016) 433e439436
modeled rates were estimated based on a combination of soilrespiration observations from this study for urban areas, literaturesoil respiration values for non-urban land covers (Raich andSchlesinger, 1992; Raich and Tufekcioglu, 2000), and high-resolution GIS land use and impervious surface areas (ISA) layersfrom MassGIS (MassGIS, 2009). All areas covered with impervioussurfaces (roads, buildings, driveways, etc.), based on a 1 m-reso-lution GIS map, were assumed to have no soil CO2 efflux. Allpervious (permeable) surfaces were assigned a soil respirationvalue based on land use (Table 3). Efflux values for nonzero, non-residential land use descriptions (Table 3) were primarily (78%)derived frommeasured fluxes from this study; the remainder werederived from published values (Raich and Schlesinger, 1992; Raichand Tufekcioglu, 2000). The lawn, forest, and landscape fractionalarea within residential land covers was estimated based the CCS.The survey showed that the pervious area of exclusively residentialparcels (n¼ 61) was 53% lawn, 42% landscaped, 4% forested, and 1%open field. The pervious portions of residential areas were allassumed to have the above composition with a mean growingseason soil efflux of 5.33 mmolCO2 m�2 s�1, primarily (98%) derivedfrom measured fluxes from this study; the remainder was derivedfrom published values (Raich and Tufekcioglu, 2000).
2.4. Fossil fuel carbon dioxide emissions
FFCO2 emission estimates were based on a newly developed,high-resolution regional inventory of FFCO2 emissions that assim-ilates multiple data sources at a 1 km gridded resolution and hourlytime-steps for circa 2011. Data from the United States Environ-mental Protection Agency (EPA; EPA, 2014a) National Emissions
Table 3Scaling soil respiration (Rs) CO2 efflux by land cover. The MassGIS land use layer (MassGISphotos that classifies the State's land use in 33 distinct descriptions. The table below sumarea), and fraction paved (ISA) within each land use description across the 25 km transeeither from measurements made in this study, from values found in the literature, or fro
Land cover Land use description Reference
Developed Commercial This study (lawn)Urban public/institutional This study (lawn)Transportation This study (lawn)Industrial This study (lawn)Participation recreation This study (lawn)Cemetery This study (lawn)Golf course This study (lawn)Waste disposal This study (lawn)Transitional This study (lawn)Spectator recreation NAJunkyard NAPowerline/utility This study (lawn)Water-based recreation NAMarina NA
Residential Multi-family residential This study (residential)a
High density residential This study (residential)a
Medium density residential This study (residential)a
Low density residential This study (residential)a
Very low density residential This study (residential)a
Forest Forest This study (forest)Forested wetland This study (forest)
Non-forest Cropland Raich and Tufekcioglu 2000Non-forested wetland Raich and Schlesinger 1992Pasture Raich and Tufekcioglu 2000Open land NAOrchard This study (forest)Nursery This study (forest)Saltwater sandy beach NABrushland/successional Raich and Tufekcioglu 2000
a Residential Rs ¼ lawn fraction x this study (lawn) þ forest fraction x this study (foresand Tufekcioglu, 2000).
Inventory and the EPA Greenhouse Gas Reporting Program (EPA,2014b) was used to calculate FFCO2 emissions for the followingsectors: residential, commercial, industrial, railroads, marine ves-sels, non-road vehicles, airport taxiing, takeoff and landing opera-tions, and electric power generation. On-road emissions wereobtained from the Database of Road Transportation Emissions(DARTE; Gately et al., 2015). Full details of FFCO2 emissions calcu-lations are reported in the Supplementary Information.
2.5. Error
All error values in the text, as well as in Figs. 2 and 4 and Tables 1and 3 are reported as standard error (SE), unless otherwise noted.Wewere not able to showerror bars or bands directly on Fig. 3E dueto the difficulty of representing visually accurate error on the log-arithmic scale of the y-axis; consequently, error for Fig. 3E is rep-resented in Supplementary Fig. 2 as weighted standard deviationfor the spatial error in soil respiration and FFCO2 emissions on alinear scale for the y-axis.
3. Results & discussion
Rates of soil respiration differed significantly (one-way ANOVA,F ¼ 4.69, p ¼ 0.019) between urban forest, lawn, and landscapedcover types, with growing season mean soil CO2 efflux rates of2.62 ± 0.15, 4.49 ± 0.14, and 6.73 ± 0.26 mmolCO2 m�2 s�1,respectively (Fig. 2, Table 1). Growing season soil respiration ratesin urban forest soils were similar to soil respiration rates in a nearbyrural forest (3.08 ± 0.07 mmolCO2m2 s�1; Giasson et al., 2013); lawnand landscaped soil respiration rates were 1.5 and 2.2 times higher,
, 2009) is a high-resolution polygon map based on assessor records and orthographicmarizes the modeled soil CO2 efflux values, seasonal patterns, overall abundance (%ct. The Reference column provides the source of the efflux value used, which camem a combination of the two.
Seasonal Rs efflux(mmolCO2 m�2 s�1)
Seasonal Variation Area (%) ISA (% ± SE)
4.49 Monthly means 10.49 86.93 ± 0.584.49 Monthly means 9.25 70.03 ± 1.004.49 Monthly means 4.99 85.14 ± 1.824.49 Monthly means 4.27 87.18 ± 1.024.49 Monthly means 2.78 46.30 ± 2.144.49 Monthly means 1.12 19.66 ± 1.824.49 Monthly means 0.99 13.65 ± 3.104.49 Monthly means 0.16 34.81 ± 13.884.49 Monthly means 0.16 82.00 ± 5.370 Seasonally constant 0.10 48.49 ± 12.820 Seasonally constant 0.06 88.15 ± 9.814.49 Monthly means 0.05 6.36 ± 1.580 Seasonally constant 0.04 50.94 ± 9.960 Seasonally constant 0.03 87.77 ± 7.585.33 Monthly means 14.34 64.78 ± 0.785.33 Monthly means 11.83 69.46 ± 0.715.33 Monthly means 4.40 35.62 ± 1.345.33 Monthly means 3.88 26.04 ± 0.465.33 Monthly means 1.01 24.35 ± 0.702.62 Monthly means 23.08 7.86 ± 0.662.62 Monthly means 2.94 2.61 ± 0.540.96 Seasonally constant 1.86 7.51 ± 2.301.09 Seasonally constant 0.89 3.35 ± 1.401.99 Seasonally constant 0.61 7.65 ± 1.300 Seasonally constant 0.58 25.56 ± 3.662.62 Monthly means 0.05 6.43 ± 2.692.62 Monthly means 0.04 77.48 ± 11.920 Seasonally constant 0.01 25.47 ± 4.721.99 Seasonally constant 0.01 25.11 ± 11.34
t) þ landscaped fraction x this study (landscaped) þ open field fraction x 1.99 (Raich
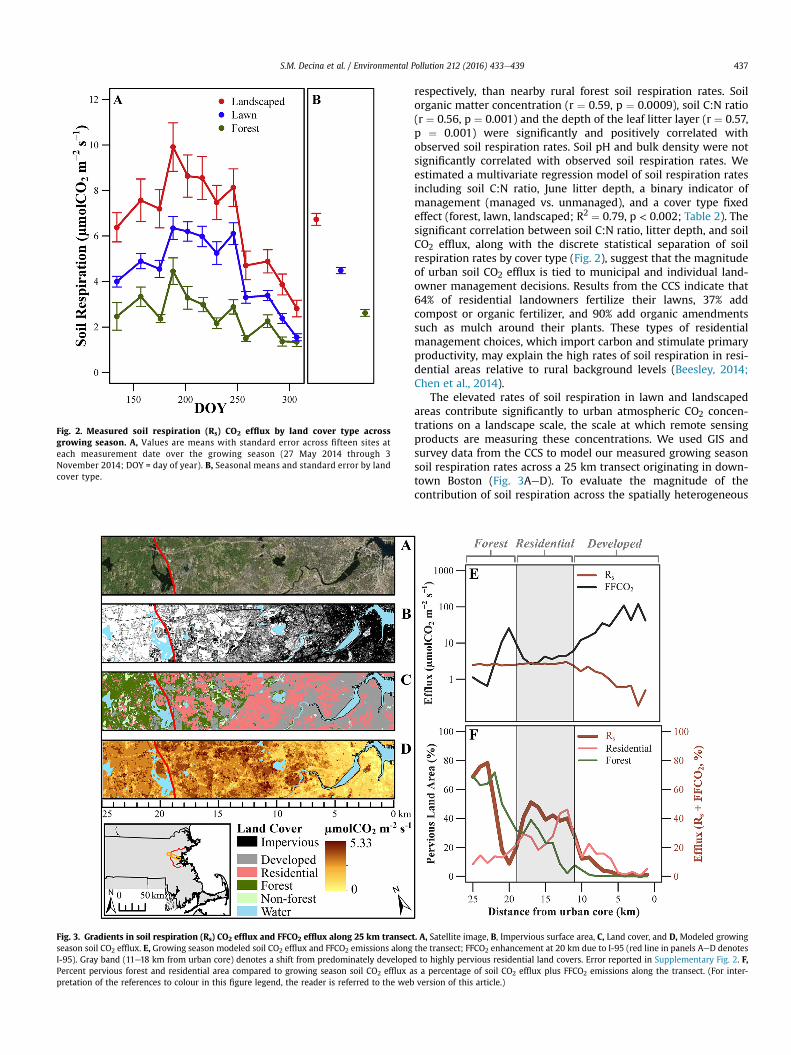
Fig. 3. Gradients in soil respiration (Rs) CO2 efflux and FFCO2 efflux along 25 km transecseason soil CO2 efflux. E, Growing season modeled soil CO2 efflux and FFCO2 emissions alongI-95). Gray band (11e18 km from urban core) denotes a shift from predominately developePercent pervious forest and residential area compared to growing season soil CO2 efflux apretation of the references to colour in this figure legend, the reader is referred to the web
Fig. 2. Measured soil respiration (Rs) CO2 efflux by land cover type acrossgrowing season. A, Values are means with standard error across fifteen sites ateach measurement date over the growing season (27 May 2014 through 3November 2014; DOY = day of year). B, Seasonal means and standard error by landcover type.
S.M. Decina et al. / Environmental Pollution 212 (2016) 433e439 437
respectively, than nearby rural forest soil respiration rates. Soilorganic matter concentration (r ¼ 0.59, p ¼ 0.0009), soil C:N ratio(r ¼ 0.56, p ¼ 0.001) and the depth of the leaf litter layer (r ¼ 0.57,p ¼ 0.001) were significantly and positively correlated withobserved soil respiration rates. Soil pH and bulk density were notsignificantly correlated with observed soil respiration rates. Weestimated a multivariate regression model of soil respiration ratesincluding soil C:N ratio, June litter depth, a binary indicator ofmanagement (managed vs. unmanaged), and a cover type fixedeffect (forest, lawn, landscaped; R2 ¼ 0.79, p < 0.002; Table 2). Thesignificant correlation between soil C:N ratio, litter depth, and soilCO2 efflux, along with the discrete statistical separation of soilrespiration rates by cover type (Fig. 2), suggest that the magnitudeof urban soil CO2 efflux is tied to municipal and individual land-owner management decisions. Results from the CCS indicate that64% of residential landowners fertilize their lawns, 37% addcompost or organic fertilizer, and 90% add organic amendmentssuch as mulch around their plants. These types of residentialmanagement choices, which import carbon and stimulate primaryproductivity, may explain the high rates of soil respiration in resi-dential areas relative to rural background levels (Beesley, 2014;Chen et al., 2014).
The elevated rates of soil respiration in lawn and landscapedareas contribute significantly to urban atmospheric CO2 concen-trations on a landscape scale, the scale at which remote sensingproducts are measuring these concentrations. We used GIS andsurvey data from the CCS to model our measured growing seasonsoil respiration rates across a 25 km transect originating in down-town Boston (Fig. 3AeD). To evaluate the magnitude of thecontribution of soil respiration across the spatially heterogeneous
t. A, Satellite image, B, Impervious surface area, C, Land cover, and D, Modeled growingthe transect; FFCO2 enhancement at 20 km due to I-95 (red line in panels AeD denotesd to highly pervious residential land covers. Error reported in Supplementary Fig. 2. F,s a percentage of soil CO2 efflux plus FFCO2 emissions along the transect. (For inter-version of this article.)
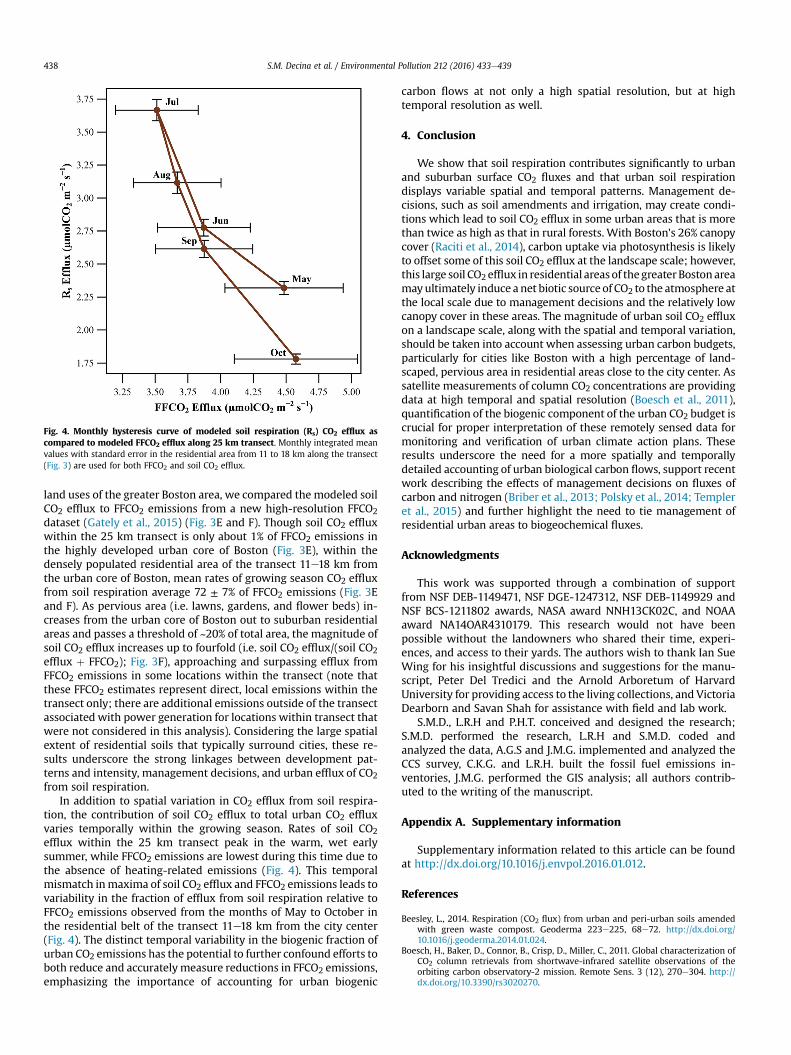
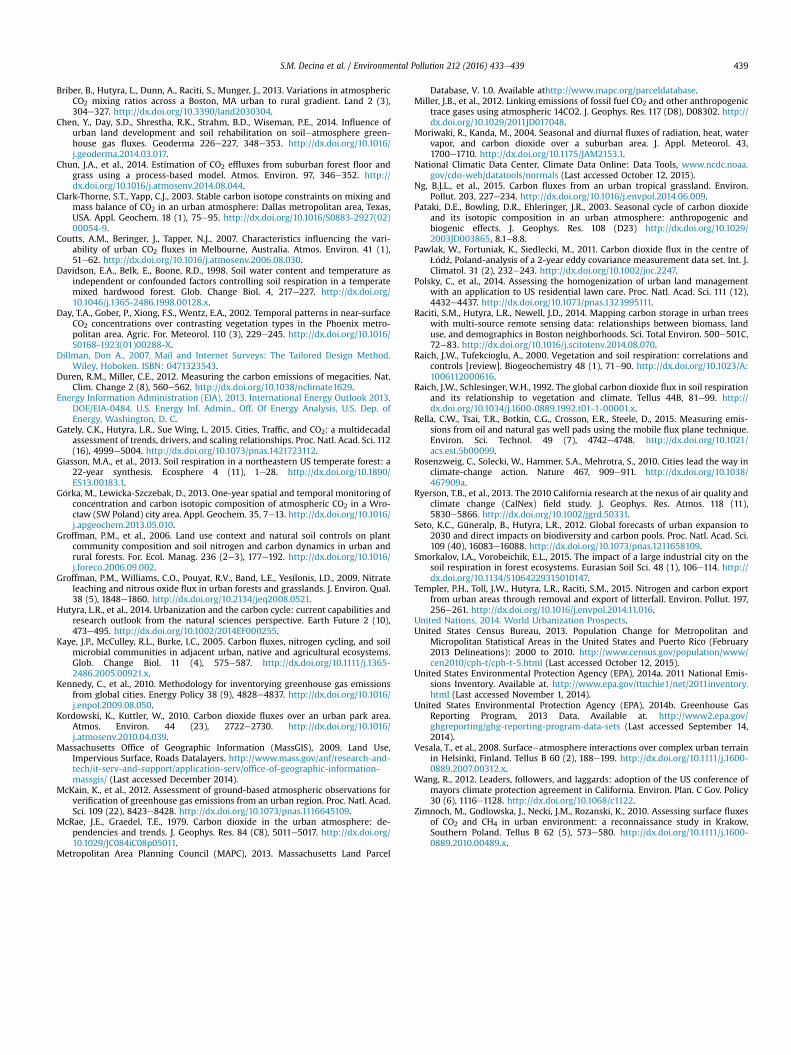
Fig. 4. Monthly hysteresis curve of modeled soil respiration (Rs) CO2 efflux ascompared to modeled FFCO2 efflux along 25 km transect. Monthly integrated meanvalues with standard error in the residential area from 11 to 18 km along the transect(Fig. 3) are used for both FFCO2 and soil CO2 efflux.
S.M. Decina et al. / Environmental Pollution 212 (2016) 433e439438
land uses of the greater Boston area, we compared the modeled soilCO2 efflux to FFCO2 emissions from a new high-resolution FFCO2dataset (Gately et al., 2015) (Fig. 3E and F). Though soil CO2 effluxwithin the 25 km transect is only about 1% of FFCO2 emissions inthe highly developed urban core of Boston (Fig. 3E), within thedensely populated residential area of the transect 11e18 km fromthe urban core of Boston, mean rates of growing season CO2 effluxfrom soil respiration average 72 ± 7% of FFCO2 emissions (Fig. 3Eand F). As pervious area (i.e. lawns, gardens, and flower beds) in-creases from the urban core of Boston out to suburban residentialareas and passes a threshold of ~20% of total area, the magnitude ofsoil CO2 efflux increases up to fourfold (i.e. soil CO2 efflux/(soil CO2efflux þ FFCO2); Fig. 3F), approaching and surpassing efflux fromFFCO2 emissions in some locations within the transect (note thatthese FFCO2 estimates represent direct, local emissions within thetransect only; there are additional emissions outside of the transectassociated with power generation for locations within transect thatwere not considered in this analysis). Considering the large spatialextent of residential soils that typically surround cities, these re-sults underscore the strong linkages between development pat-terns and intensity, management decisions, and urban efflux of CO2from soil respiration.
In addition to spatial variation in CO2 efflux from soil respira-tion, the contribution of soil CO2 efflux to total urban CO2 effluxvaries temporally within the growing season. Rates of soil CO2efflux within the 25 km transect peak in the warm, wet earlysummer, while FFCO2 emissions are lowest during this time due tothe absence of heating-related emissions (Fig. 4). This temporalmismatch inmaxima of soil CO2 efflux and FFCO2 emissions leads tovariability in the fraction of efflux from soil respiration relative toFFCO2 emissions observed from the months of May to October inthe residential belt of the transect 11e18 km from the city center(Fig. 4). The distinct temporal variability in the biogenic fraction ofurban CO2 emissions has the potential to further confound efforts toboth reduce and accuratelymeasure reductions in FFCO2 emissions,emphasizing the importance of accounting for urban biogenic
carbon flows at not only a high spatial resolution, but at hightemporal resolution as well.
4. Conclusion
We show that soil respiration contributes significantly to urbanand suburban surface CO2 fluxes and that urban soil respirationdisplays variable spatial and temporal patterns. Management de-cisions, such as soil amendments and irrigation, may create condi-tions which lead to soil CO2 efflux in some urban areas that is morethan twice as high as that in rural forests. With Boston's 26% canopycover (Raciti et al., 2014), carbon uptake via photosynthesis is likelyto offset some of this soil CO2 efflux at the landscape scale; however,this large soil CO2 efflux in residential areas of thegreaterBoston areamayultimately induce a net biotic source of CO2 to the atmosphere atthe local scale due to management decisions and the relatively lowcanopy cover in these areas. The magnitude of urban soil CO2 effluxon a landscape scale, along with the spatial and temporal variation,should be taken into account when assessing urban carbon budgets,particularly for cities like Boston with a high percentage of land-scaped, pervious area in residential areas close to the city center. Assatellite measurements of column CO2 concentrations are providingdata at high temporal and spatial resolution (Boesch et al., 2011),quantification of the biogenic component of the urban CO2 budget iscrucial for proper interpretation of these remotely sensed data formonitoring and verification of urban climate action plans. Theseresults underscore the need for a more spatially and temporallydetailed accounting of urban biological carbon flows, support recentwork describing the effects of management decisions on fluxes ofcarbon and nitrogen (Briber et al., 2013; Polsky et al., 2014; Templeret al., 2015) and further highlight the need to tie management ofresidential urban areas to biogeochemical fluxes.
Acknowledgments
This work was supported through a combination of supportfrom NSF DEB-1149471, NSF DGE-1247312, NSF DEB-1149929 andNSF BCS-1211802 awards, NASA award NNH13CK02C, and NOAAaward NA14OAR4310179. This research would not have beenpossible without the landowners who shared their time, experi-ences, and access to their yards. The authors wish to thank Ian SueWing for his insightful discussions and suggestions for the manu-script, Peter Del Tredici and the Arnold Arboretum of HarvardUniversity for providing access to the living collections, and VictoriaDearborn and Savan Shah for assistance with field and lab work.
S.M.D., L.R.H and P.H.T. conceived and designed the research;S.M.D. performed the research, L.R.H and S.M.D. coded andanalyzed the data, A.G.S and J.M.G. implemented and analyzed theCCS survey, C.K.G. and L.R.H. built the fossil fuel emissions in-ventories, J.M.G. performed the GIS analysis; all authors contrib-uted to the writing of the manuscript.
Appendix A. Supplementary information
Supplementary information related to this article can be foundat http://dx.doi.org/10.1016/j.envpol.2016.01.012.
References
Beesley, L., 2014. Respiration (CO2 flux) from urban and peri-urban soils amendedwith green waste compost. Geoderma 223e225, 68e72. http://dx.doi.org/10.1016/j.geoderma.2014.01.024.
Boesch, H., Baker, D., Connor, B., Crisp, D., Miller, C., 2011. Global characterization ofCO2 column retrievals from shortwave-infrared satellite observations of theorbiting carbon observatory-2 mission. Remote Sens. 3 (12), 270e304. http://dx.doi.org/10.3390/rs3020270.
S.M. Decina et al. / Environmental Pollution 212 (2016) 433e439 439
Briber, B., Hutyra, L., Dunn, A., Raciti, S., Munger, J., 2013. Variations in atmosphericCO2 mixing ratios across a Boston, MA urban to rural gradient. Land 2 (3),304e327. http://dx.doi.org/10.3390/land2030304.
Chen, Y., Day, S.D., Shrestha, R.K., Strahm, B.D., Wiseman, P.E., 2014. Influence ofurban land development and soil rehabilitation on soileatmosphere green-house gas fluxes. Geoderma 226e227, 348e353. http://dx.doi.org/10.1016/j.geoderma.2014.03.017.
Chun, J.A., et al., 2014. Estimation of CO2 effluxes from suburban forest floor andgrass using a process-based model. Atmos. Environ. 97, 346e352. http://dx.doi.org/10.1016/j.atmosenv.2014.08.044.
Clark-Thorne, S.T., Yapp, C.J., 2003. Stable carbon isotope constraints on mixing andmass balance of CO2 in an urban atmosphere: Dallas metropolitan area, Texas,USA. Appl. Geochem. 18 (1), 75e95. http://dx.doi.org/10.1016/S0883-2927(02)00054-9.
Coutts, A.M., Beringer, J., Tapper, N.J., 2007. Characteristics influencing the vari-ability of urban CO2 fluxes in Melbourne, Australia. Atmos. Environ. 41 (1),51e62. http://dx.doi.org/10.1016/j.atmosenv.2006.08.030.
Davidson, E.A., Belk, E., Boone, R.D., 1998. Soil water content and temperature asindependent or confounded factors controlling soil respiration in a temperatemixed hardwood forest. Glob. Change Biol. 4, 217e227. http://dx.doi.org/10.1046/j.1365-2486.1998.00128.x.
Day, T.A., Gober, P., Xiong, F.S., Wentz, E.A., 2002. Temporal patterns in near-surfaceCO2 concentrations over contrasting vegetation types in the Phoenix metro-politan area. Agric. For. Meteorol. 110 (3), 229e245. http://dx.doi.org/10.1016/S0168-1923(01)00288-X.
Dillman, Don A., 2007. Mail and Internet Surveys: The Tailored Design Method.Wiley, Hoboken. ISBN: 0471323543.
Duren, R.M., Miller, C.E., 2012. Measuring the carbon emissions of megacities. Nat.Clim. Change 2 (8), 560e562. http://dx.doi.org/10.1038/nclimate1629.
Energy Information Administration (EIA), 2013. International Energy Outlook 2013,DOE/EIA-0484. U.S. Energy Inf. Admin., Off. Of Energy Analysis, U.S. Dep. ofEnergy, Washington, D. C.
Gately, C.K., Hutyra, L.R., Sue Wing, I., 2015. Cities, Traffic, and CO2: a multidecadalassessment of trends, drivers, and scaling relationships. Proc. Natl. Acad. Sci. 112(16), 4999e5004. http://dx.doi.org/10.1073/pnas.1421723112.
Giasson, M.A., et al., 2013. Soil respiration in a northeastern US temperate forest: a22-year synthesis. Ecosphere 4 (11), 1e28. http://dx.doi.org/10.1890/ES13.00183.1.
G�orka, M., Lewicka-Szczebak, D., 2013. One-year spatial and temporal monitoring ofconcentration and carbon isotopic composition of atmospheric CO2 in a Wro-cław (SW Poland) city area. Appl. Geochem. 35, 7e13. http://dx.doi.org/10.1016/j.apgeochem.2013.05.010.
Groffman, P.M., et al., 2006. Land use context and natural soil controls on plantcommunity composition and soil nitrogen and carbon dynamics in urban andrural forests. For. Ecol. Manag. 236 (2e3), 177e192. http://dx.doi.org/10.1016/j.foreco.2006.09.002.
Groffman, P.M., Williams, C.O., Pouyat, R.V., Band, L.E., Yesilonis, I.D., 2009. Nitrateleaching and nitrous oxide flux in urban forests and grasslands. J. Environ. Qual.38 (5), 1848e1860. http://dx.doi.org/10.2134/jeq2008.0521.
Hutyra, L.R., et al., 2014. Urbanization and the carbon cycle: current capabilities andresearch outlook from the natural sciences perspective. Earth Future 2 (10),473e495. http://dx.doi.org/10.1002/2014EF000255.
Kaye, J.P., McCulley, R.L., Burke, I.C., 2005. Carbon fluxes, nitrogen cycling, and soilmicrobial communities in adjacent urban, native and agricultural ecosystems.Glob. Change Biol. 11 (4), 575e587. http://dx.doi.org/10.1111/j.1365-2486.2005.00921.x.
Kennedy, C., et al., 2010. Methodology for inventorying greenhouse gas emissionsfrom global cities. Energy Policy 38 (9), 4828e4837. http://dx.doi.org/10.1016/j.enpol.2009.08.050.
Kordowski, K., Kuttler, W., 2010. Carbon dioxide fluxes over an urban park area.Atmos. Environ. 44 (23), 2722e2730. http://dx.doi.org/10.1016/j.atmosenv.2010.04.039.
Massachusetts Office of Geographic Information (MassGIS), 2009. Land Use,Impervious Surface, Roads Datalayers. http://www.mass.gov/anf/research-and-tech/it-serv-and-support/application-serv/office-of-geographic-information-massgis/ (Last accessed December 2014).
McKain, K., et al., 2012. Assessment of ground-based atmospheric observations forverification of greenhouse gas emissions from an urban region. Proc. Natl. Acad.Sci. 109 (22), 8423e8428. http://dx.doi.org/10.1073/pnas.1116645109.
McRae, J.E., Graedel, T.E., 1979. Carbon dioxide in the urban atmosphere: de-pendencies and trends. J. Geophys. Res. 84 (C8), 5011e5017. http://dx.doi.org/10.1029/JC084iC08p05011.
Metropolitan Area Planning Council (MAPC), 2013. Massachusetts Land Parcel
Database, V. 1.0. Available athttp://www.mapc.org/parceldatabase.Miller, J.B., et al., 2012. Linking emissions of fossil fuel CO2 and other anthropogenic
trace gases using atmospheric 14CO2. J. Geophys. Res. 117 (D8), D08302. http://dx.doi.org/10.1029/2011JD017048.
Moriwaki, R., Kanda, M., 2004. Seasonal and diurnal fluxes of radiation, heat, watervapor, and carbon dioxide over a suburban area. J. Appl. Meteorol. 43,1700e1710. http://dx.doi.org/10.1175/JAM2153.1.
National Climatic Data Center, Climate Data Online: Data Tools, www.ncdc.noaa.gov/cdo-web/datatools/normals (Last accessed October 12, 2015).
Ng, B.J.L., et al., 2015. Carbon fluxes from an urban tropical grassland. Environ.Pollut. 203, 227e234. http://dx.doi.org/10.1016/j.envpol.2014.06.009.
Pataki, D.E., Bowling, D.R., Ehleringer, J.R., 2003. Seasonal cycle of carbon dioxideand its isotopic composition in an urban atmosphere: anthropogenic andbiogenic effects. J. Geophys. Res. 108 (D23) http://dx.doi.org/10.1029/2003JD003865, 8.1e8.8.
Pawlak, W., Fortuniak, K., Siedlecki, M., 2011. Carbon dioxide flux in the centre ofŁ�od�z, Poland-analysis of a 2-year eddy covariance measurement data set. Int. J.Climatol. 31 (2), 232e243. http://dx.doi.org/10.1002/joc.2247.
Polsky, C., et al., 2014. Assessing the homogenization of urban land managementwith an application to US residential lawn care. Proc. Natl. Acad. Sci. 111 (12),4432e4437. http://dx.doi.org/10.1073/pnas.1323995111.
Raciti, S.M., Hutyra, L.R., Newell, J.D., 2014. Mapping carbon storage in urban treeswith multi-source remote sensing data: relationships between biomass, landuse, and demographics in Boston neighborhoods. Sci. Total Environ. 500e501C,72e83. http://dx.doi.org/10.1016/j.scitotenv.2014.08.070.
Raich, J.W., Tufekcioglu, A., 2000. Vegetation and soil respiration: correlations andcontrols [review]. Biogeochemistry 48 (1), 71e90. http://dx.doi.org/10.1023/A:1006112000616.
Raich, J.W., Schlesinger, W.H., 1992. The global carbon dioxide flux in soil respirationand its relationship to vegetation and climate. Tellus 44B, 81e99. http://dx.doi.org/10.1034/j.1600-0889.1992.t01-1-00001.x.
Rella, C.W., Tsai, T.R., Botkin, C.G., Crosson, E.R., Steele, D., 2015. Measuring emis-sions from oil and natural gas well pads using the mobile flux plane technique.Environ. Sci. Technol. 49 (7), 4742e4748. http://dx.doi.org/10.1021/acs.est.5b00099.
Rosenzweig, C., Solecki, W., Hammer, S.A., Mehrotra, S., 2010. Cities lead the way inclimate-change action. Nature 467, 909e911. http://dx.doi.org/10.1038/467909a.
Ryerson, T.B., et al., 2013. The 2010 California research at the nexus of air quality andclimate change (CalNex) field study. J. Geophys. Res. Atmos. 118 (11),5830e5866. http://dx.doi.org/10.1002/jgrd.50331.
Seto, K.C., Güneralp, B., Hutyra, L.R., 2012. Global forecasts of urban expansion to2030 and direct impacts on biodiversity and carbon pools. Proc. Natl. Acad. Sci.109 (40), 16083e16088. http://dx.doi.org/10.1073/pnas.1211658109.
Smorkalov, I.A., Vorobeichik, E.L., 2015. The impact of a large industrial city on thesoil respiration in forest ecosystems. Eurasian Soil Sci. 48 (1), 106e114. http://dx.doi.org/10.1134/S1064229315010147.
Templer, P.H., Toll, J.W., Hutyra, L.R., Raciti, S.M., 2015. Nitrogen and carbon exportfrom urban areas through removal and export of litterfall. Environ. Pollut. 197,256e261. http://dx.doi.org/10.1016/j.envpol.2014.11.016.
United Nations, 2014. World Urbanization Prospects.United States Census Bureau, 2013. Population Change for Metropolitan and
Micropolitan Statistical Areas in the United States and Puerto Rico (February2013 Delineations): 2000 to 2010. http://www.census.gov/population/www/cen2010/cph-t/cph-t-5.html (Last accessed October 12, 2015).
United States Environmental Protection Agency (EPA), 2014a. 2011 National Emis-sions Inventory. Available at. http://www.epa.gov/ttnchie1/net/2011inventory.html (Last accessed November 1, 2014).
United States Environmental Protection Agency (EPA), 2014b. Greenhouse GasReporting Program, 2013 Data. Available at. http://www2.epa.gov/ghgreporting/ghg-reporting-program-data-sets (Last accessed September 14,2014).
Vesala, T., et al., 2008. Surfaceeatmosphere interactions over complex urban terrainin Helsinki, Finland. Tellus B 60 (2), 188e199. http://dx.doi.org/10.1111/j.1600-0889.2007.00312.x.
Wang, R., 2012. Leaders, followers, and laggards: adoption of the US conference ofmayors climate protection agreement in California. Environ. Plan. C Gov. Policy30 (6), 1116e1128. http://dx.doi.org/10.1068/c1122.
Zimnoch, M., Godlowska, J., Necki, J.M., Rozanski, K., 2010. Assessing surface fluxesof CO2 and CH4 in urban environment: a reconnaissance study in Krakow,Southern Poland. Tellus B 62 (5), 573e580. http://dx.doi.org/10.1111/j.1600-0889.2010.00489.x.