soil resistivity: a non-invasive tool to map soil structure horizonation
TRANSCRIPT

Ž .Geoderma 97 2000 393–404www.elsevier.nlrlocatergeoderma
Soil resistivity: a non-invasive tool to map soilstructure horizonation
Alain Tabbagh), Michel Dabas, Albert Hesse, Cedric Panissod´GEOFCAN, UMR 7619, «Sisyphe» UniÕersite Pierre et Marie Curie, et CNRS, Centre de´
Recherches Geophysiques, Garchy 58150, France´
Received 5 October 1998; received in revised form 11 October 1999; received in revised form 8December 1999; accepted 13 January 2000
Abstract
Since geophysical methods are non-invasive, they can be of great help in soil studies becausethey disturb neither the structure nor the dynamics of the soil. Moreover, data are acquired withreliable spatial sampling. The usual ways of investigation, like augering and excavation, disturbthe soil and are totally incompatible with a spatially dense sampling strategy, which would destroythe object of the study. Both approaches are complementary when excavations have a limitedextent and are distributed according to the information conveyed by the geophysical investigation.A basic principle of applied geophysics is to measure different physical parameters without direct
Ž .access to the studied volume. Horizontal andror vertical variations of the parameter s can berecorded. Possible soil parameters should be restricted to measurements which do not alter the
Ž . Ž .medium reversible effect . To be significant, the variations of the parameter s should exhibit awide dynamic range over different soil types and should be correlated in some way to soilparameters such as particle size or hydraulic conductivity. After summarising the soil properties,two examples are shown whereby electrical resistivity was used. The first example is a specific
Ž .soil so-called hardpan sandy soil in arid area in Lagadge, North Cameroon. Using resistivity´surveys the three dimensional extension of a very coherent horizon was mapped. This horizon is
Ž .delineated by low resistivities -100 V m conductivities )10 mSrm because of thedisposition of clay particles around the quartz grains. In a second example, a ‘‘homogeneous’’area ought to be found delimit the extent of a surface where a pesticide transfer experiment is totake place. Accurate mapping of soil horizons was not feasible by augering. Resistivity data haveclearly shown the three-dimensional extension of clayey horizons in the complex delta context.q 2000 Elsevier Science B.V. All rights reserved.
Keywords: geophysical survey; mapping; electrical resistivity; soil physical properties
) Corresponding author.
0016-7061r00r$ - see front matter q2000 Elsevier Science B.V. All rights reserved.Ž .PII: S0016-7061 00 00047-1

( )A. Tabbagh et al.rGeoderma 97 2000 393–404394
1. Physical properties usable for soil surveying
Exploration geophysics originates from a simple fact that it is useful forinvestigating soil without digging. This is a major requirement in the field of
Ž .soil science for two main reasons: 1 direct observation over the whole volumeof a soil is not possible as it would imply the total destruction of the soil; onlynon-invasive methods allow the investigation of the whole volume with a good
Ž .sampling strategy. 2 digging disturbs the dynamics of the soil, particularly bychanging the ground water flow path. After an excavation, structure anddynamics are different from what they were previously.
This exploration, obviously, does not exclude other observations and analy-ses. Since a number of observations such as chemical and biological, cannot beperformed in situ and must be undertaken in the laboratory; so, excavations forsampling remain necessary. Even if one expects significant improvements for insitu non-invasive methods, similar progress would also probably take place withlaboratory methods, and their use need to be combined to optimise the under-standing of a site.
The general principle behind geophysical exploration is to collect data outsidethe medium under investigation, which are a function of the internal properties
Ž .of this medium Telford et al., 1976; Scollar et al., 1990 . At first sight, thenumber of methods which can be applied is large, but constraints limiting thesetypes of survey must be considered. First, in order to maintain the mainadvantage of non-invasive methods one must only choose the methods, whichcorrespond to a strictly reversible effect, i.e. the medium must be identical
Ž .before and after the measurement. Second, the chosen physical property iesmust span over a wide range for different soil types; the higher this variability,the better the chance to detect small variations of soil structure; the better the
Ž . Ž .correlation between this these property ies and the commonly used parametersŽ .porosity, water content, clay content, . . . , the easier the interpretation and theinformation transfer to a non-physicist. Third, the cost of the measurements isnot negligible; one must use light and robust instruments and reduce as much aspossible the duration of a measurement and the delay between two successiveones.
Geophysical methods have been used for eighty years in mining, oil, civilengineering, . . . prospecting. Four groups of properties have proven to be veryuseful: density, seismic velocity, electrical conductivity and permittivity, and the
Ž .magnetic parameters mainly susceptibility .Density is correlated to porosity and water content, but its range of variation
Ž .in soils remains limited 1.2 to 2 typically . Seismic velocity exhibits a widerrange in soil, from 500 to about 2000 mrs, it is also related to porosity alongwith a fair sensitivity to water content. Magnetic properties play a veryimportant part in archaeological prospecting, but their use in soil sciences is stilllimited. They are determined by the amount and grain size of ferrimagnetic iron
( )A. Tabbagh et al.rGeoderma 97 2000 393–404 395
oxides and sulfides. These minerals are generated by several authigenic, bio-genic and anthropogenic processes that occurred during and after pedogenesisŽ .Verosub and Roberts, 1995 . Magnetic properties can thus probably play animportant role in soil sciences and their application will probably increase in thefuture.
Ž .Electrical resistivity or its inverse, conductivity exhibits a large range ofvariation, from 1 for saline soil to several thousand ohms per metre for dry soiloverlying crystalline rocks. Electrical conduction involves two different pro-
Ž .cesses of ion displacement: 1 through the volume of the water in the pores, andŽ . Ž .2 at the surface of particles cations . Consequently, two parameters control its
Ž . Ž .magnitude: i the saturation and salinity of the water, ii the value of thespecific surface which is related to the clay and fine-particle content. In salineareas, the first parameter plays the major part, whereas the clay contentdominates in the second case. Several methods such as d.c. electrical, electro-static and low-frequency electromagnetic, can be used in order to measure theresistivity. They are mostly used in soil science and related domains including
Žhydrogeology, civil engineering and archaeological prospecting Halvorson andRhoades 1976; Bottraud et al., 1984; Dabas et al., 1989; Gras et al., 1997; Lesch
.et al., 1992; Benson et al., 1997 and more recent papers were presented inŽ .precision farming Dabas et al., 1999; Lund et al., 1999 .
Electrical permittivity is the parameter that determines the velocity andreflection coefficients of higher-frequency electromagnetic waves used with
Ž .ground penetrating radar GPR . This parameter depends on the liquid waterŽ .content of the soil material Topp et al., 1980 . The application of GPR to soil
sciences is an active domain of research.Two field examples will be presented here: the first one on a Sahel-type arid
climate area, the second one in temperate climate area. In both cases, theresistivity measurements by d.c. electrical method was most relevant.
(2. Distribution of hardpan in soil cover at the Lagadge site Northern´)Cameroon
The area investigated is located in the flat plain of southern Chad basin; thetop of the granite gneiss basement is several metres deep. The soil comprises
Žfrom bottom to top: a clay layer and sandy layers with either low cohesion ‘‘sol. Žpeu coherent’’ SPC layer or high cohesion ‘‘sol tres coherent’’ STC layer or´ ` ´
.hardpan . The presence of a hardpan is an obstacle to excavation and augerdrilling. The type of vegetation cover has proven to be correlated with thelocation and depth of the hardpan layer. When hardpan is at very shallow depth,the ground surface is barren. An electrical resistivity survey was undertaken inorder to describe the distribution of the hardpan. Several soil profiles allowed

( )A. Tabbagh et al.rGeoderma 97 2000 393–404396
sample collection for analyses and explanation of its mechanical and electricalŽ .properties Lamotte 1993; Lamotte et al., 1994 .
Ž .Using a Septa RMCA3 resistivity meter, the surveyed area 50=300 m wascovered by a 4=4 m2 measurement grid, Wenner arrays with as1, 2 and 4 mspacing; a 8=8 m grid was used for the as8 m spacing. Four different depthsof investigation were thus obtained, they correspond roughly to a soil thickness
Fig. 1. Resistivity maps obtained with four different Wenner arrays and electrode spacings, as1Ž . Ž . Ž . Ž . Ž .m a , as2 m b , as4 m c and as8 m d at the Lagadge site Northern Cameroon .´
X Y Ž .Location of anomalies A, A, A , and B are shown in a .

( )A. Tabbagh et al.rGeoderma 97 2000 393–404 397
Žbetween a and ar2 the depth of investigation corresponds to the thickness ofthe soil taken into account by measurements; a 2-m depth of investigation
.corresponds, for instance, to the soil between 0 and an extreme limit of 2 m .Ž .The resistivity range is very large 7 to 10,000 V m , i.e. conductivities
Ž .ranging from 140 to 0.01 mSrm Fig. 1 . The largest resistivity variations werefound with 1- and 2-m electrode spacing. In the highest resistivity zones, notedA, AX and AY in Fig. 1, the resistivity, D , is higher than 1000 V m. Themagnitude of these variations decreases as the electrode spacing increases. Thepresence of SPC is associated with high resistivity while the presence of STCwith low resistivity and this suggests the presence of clay in the hardpan. Tworesitivity pseudo-sections corresponding to A and B anomalies are presented inFig. 2, together with the soil sequence and vegetation observations. Thepseudo-sections show that A anomaly corresponds to an extension at depth of alimited volume of SPC. Such an extension does not exist at B. A 3D inversionŽ . Ž .Dabas et al., 1994; Panissod, 1997 of a part the data over 0.5 ha confirms
Fig. 2. Electrical resistivity pseudo-section profiles of anomalies A and B and the correspondingŽ . Ž . Ž . Ž .organisation of soil horizons at Lagadge site: 1 isoresistivity curves V m , 2 bare zone ZN ,´
Ž . Ž . Ž . Ž . Ž .herbaceous zone ZH , arboreous zone ZA , 3 homogeneous upper material fine sand , 4Ž . Ž .heterogeneous lower material A coarse sand, B fine sand, C clay , 5 sandy horizon with low
Ž . Ž .cohesion, 6 sandy horizon with high cohesion hardpan .

( )A. Tabbagh et al.rGeoderma 97 2000 393–404398
Ž .these results Fig. 3 . Contrasts are reinforced and contours of the bodies moreprecise. We can observe some detailed resistive features in the middle layerŽ . Ž .Fig. 3b . Electron microscope observations Lamotte, 1993 explain the lowresistivity of STC sand by the presence of clay particles in electrical contact atthe inner surface of the pores. The clay particles also play a mechanical role bylimiting possible strains on the pores.
This experimental survey has shown that resistivity is a very relevant tool tocharacterise STC soils. The electrical survey allows the description of this 3Ddistribution and the explanation for the surface repartition of vegetation.
Ž .Fig. 3. Electrical 3D inversion aver a part of the data acquired at Lagadge site: a apparent´Ž .resistivity data b 3D inversion showing the extension of the main body and smaller features in an
Ž .intermediate layer between 1.7 and 3.7 m .

()
A.T
abbaghet
al.rG
eoderma
972000
393–
404399
Ž . Ž . Ž .Fig. 4. a Picture of the ‘‘Vol de canards’’ V-MUCEP electrical multipole system, b position of the poles in the V-MUCEP array.

( )A. Tabbagh et al.rGeoderma 97 2000 393–404400
(3. Location of clay layers in a deltaic sandy environment, Fleury Loiret,)France
The parcel studied is located just beside Orleans where a pesticide migration´experiment is planned. The geological setting consists of Miocene deltaicformations whereby the presence of clay may drastically change the soilpermeability. It is thus necessary to describe the structure of the soil and to
Ž .Fig. 5. Resistivity maps obtained with the V-MUCEP at the Fleury site Loiret, France .

( )A. Tabbagh et al.rGeoderma 97 2000 393–404 401
delineate clay volumes in order to define the locations for injections and waterŽ .sampling Dabas et al., 1995 .
ŽTwo different electrical surveys were performed. The first one December.1994 was carried out with a simple square array continuously moved along
Ž .profiles with automatic data recording; the second one December 1995 with aŽmultipole system, the V-MUCEP Multipole Continuous Electrical Profiling
.with a ‘‘Vol de Canards’’ configuration , corresponding to three different depthsof investigation: 0.5, 1 and 2 m. This system is presented in Fig. 4a and b. Thesurveyed parcel has a 0.75 ha area; the profiles are measured 1 m apart, with aspacing of 0.1 m down each profile. The survey took 3 h. The resistivity ranges
Ž .between 30 and 600 V m. The comparison between the maps Fig. 5 for thethree spacings suggests the existence of a resistive deep layer at a depth of 1 mor more. The clayey zone is clearly located in the south-western part of the area.If one considers a three-layer model made of a superficial cultivated layer of
Ž . Ž .Fig. 6. Comparison between electrical 1D inversion a and auger data b for the thickness of theclay layer at the Fleury site.
( )A. Tabbagh et al.rGeoderma 97 2000 393–404402
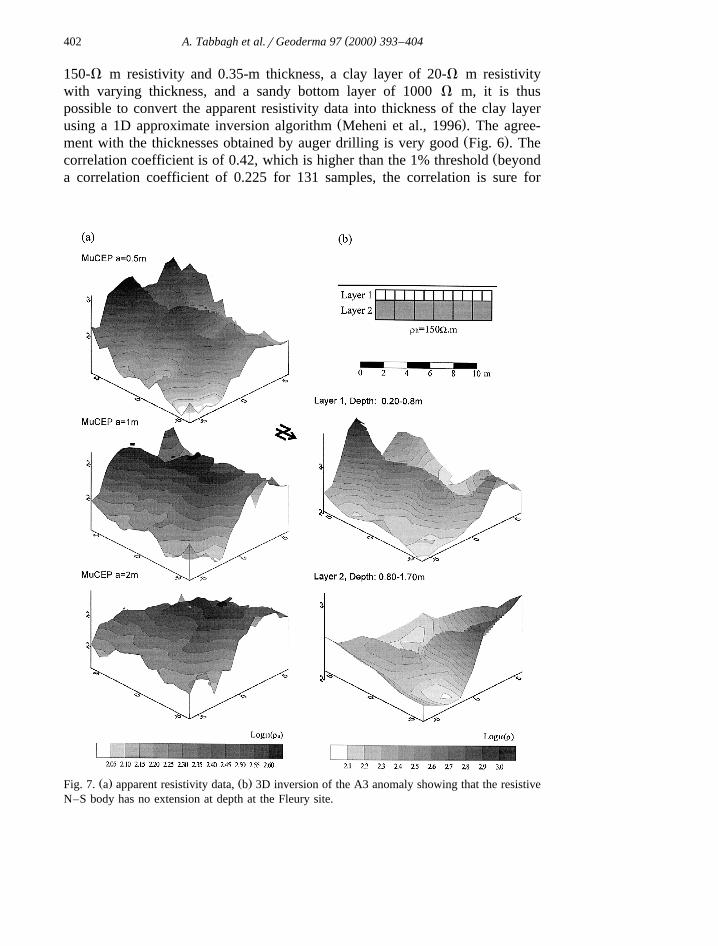
150-V m resistivity and 0.35-m thickness, a clay layer of 20-V m resistivitywith varying thickness, and a sandy bottom layer of 1000 V m, it is thuspossible to convert the apparent resistivity data into thickness of the clay layer
Ž .using a 1D approximate inversion algorithm Meheni et al., 1996 . The agree-Ž .ment with the thicknesses obtained by auger drilling is very good Fig. 6 . The
Žcorrelation coefficient is of 0.42, which is higher than the 1% threshold beyonda correlation coefficient of 0.225 for 131 samples, the correlation is sure for
Ž . Ž .Fig. 7. a apparent resistivity data, b 3D inversion of the A3 anomaly showing that the resistiveN–S body has no extension at depth at the Fleury site.

( )A. Tabbagh et al.rGeoderma 97 2000 393–404 403
.more than 99% . This simplified inversion is sufficient for a global descriptionof the soil structure. A more precise 3D inversion can be applied over limited
Ž .areas where more details are needed. For the anomaly A3 Fig. 5 , whichstructure corresponds to a major flow direction from North to South, thisprocedure allows to establish that the resistive sandy body 2 m wide is limited in
Ž .depth to about 1m Fig. 7 .
4. Conclusion
Resistivity mapping using several array sizes allows a good description of the3D soil structure, without any damage. Measurements are easy to undertake andinterpretation can be performed to a sufficient level of significance. In the twocase studies presented above, resistivity delivered a precise delineation of thechanges in clay content which determines the mechanical and hydrologicalcharacteristics of the soil.
Ž .Resistivity or conductivity which exhibits a very wide range of values andallows easy measurements, remains the most suitable geophysical parameter forroutine soil surveys, but interesting new avenues exist in magnetic measure-ments and, when more detail is needed about feature geometry, in GroundPenetrating Radars.
References
Benson, A.K., Payne, K.L., Stubben, M.A., 1997. Mapping ground water contamination using d.c.resistivity and V.L.F. geophysical methods — a case study. Geophysics 62, 80–86.
Bottraud, J.C., Bornand, M., Servat, E., 1984. Mesures de resistivite appliquees a la cartographie´ ´ ´ `en pedologie. Sci. Sol 4, 279–294.´
Dabas, M., Hesse, A., Jolivet, A., Tabbagh, A., 1989. Interet de la cartographie de la resistivite´ ˆ ´ ´Ž .electrique pour la connaissance du sol a grande echelle. Sci. Sol 27 1 , 67–68.´ ` ´
Dabas, M., Tabbagh, A., Tabbagh, J., 1994. 3-D inversion in subsurface electrical surveying: I.Theory. Geophys. J. Int. 119, 975–990.
Dabas, M., Duval, O., Bruand, A., Verbeque, B., 1995. Cartographie electrique en continu: apport` ´a la connaissance d’une couverture de sol developpee sur materiaux deltaıques. Etude Gest.` ´ ´ ´ ¨Sols 2–4, 257–268.
Dabas, M., Aubry, L., Rouiller, D., Larcher, J.M., 1999. Caracterisation de la variabilite spatiale´ ´Ž .intraparcellaire des sols agricoles Methode MUCEP : une gestion predictive des rendements´ ´
dans le cadre de l’agriculture de precision. Actes du 2eme Colloque de Geophysique des Sols´ ` ´et des Formations Superficielles, Orleans 21–22 Septembre 1999. pp. 125–129, Editions´BRGM.
Gras, F., Hesse, A., Tillier, C., Tessier, D., Zimmer, D., 1997. La prospection electrique: une´methode adaptee a la cartographie et a la connaissance de l’etat hydrique des sols, cas des sols´ ´ ` ` ´
Ž .de Lorraine. Etude Gest. Sols 4 3 , 161–173.
( )A. Tabbagh et al.rGeoderma 97 2000 393–404404
Halvorson, A.D., Rhoades, J.D., 1976. Field mapping soil conductivity to delineate dryland salineseeps with four-electrode technique. Soil Sci. Soc. Am. J. 40, 571–575.
Lamotte, M., 1993. Les sols sableux a forte cohesion des zones tropicales arides. Etude du harde` ´ ´de Lagadge au Nord Cameroun. These de doctorat, Universite Paris 6, 315 pp.´ ` ´
Lamotte, M., Bruand, A., Dabas, M., Donfack, P., Gabalda, G., Hesse, A., Humbel, F.X., Robain,H., 1994. Distribution d’un horizon a forte cohesion au sein d’une couverture de sol aride du` ´
Ž .Nord–Cameroun: apport d’une prospection electrique. Geosci. CR Acad. Sci. Paris 318 II ,´961–968.
Lesch, S.M., Rhoades, J.D., Lund, L.J., Corwin, D.L., 1992. Mapping soil salinity using calibratedelectromagnetic measurements. Soil Sci. Soc. Am. J. 56, 540–548.
Lund, E.D., Christy, C.D., Drummond, P.E., 1999. Practical applications of soil electricalŽ .conductivity mapping. In: Stafford, J.V. Ed. , 2nd European Conference on Precision Agricul-
ture. Sheffield University Press, pp. 771–779, Part II.Meheni, Y., Guerin, R., Benderitter, Y., Tabbagh, A., 1996. Subsurface DC resistivity mapping:´
approximate 1-D interpretation. J. Appl. Geophys. 34, 255–270.Panissod, C., 1997. Prospection electrique et electrostatique a faible profondeur a l’aide de´ ´ ` `
systeme multipole permettant la description directe des structures en 3D. These de doctorat,` ˆ `Universite Paris 6, 238 pp.´
Scollar, I., Tabbagh, A., Hesse, A., Herzog, I., 1990. Archaeological Prospecting and RemonteSensing. Cambridge Univ. Press, 674 pp.
Telford, W.M., Geldart, L.P., Sheriff, R.E., Keys, D.A., 1976. Applied Geophysics. CambridgeUniv. Press, 860 pp.
Topp, G.C., Davis, J.L., Annan, P., 1980. Electromagnetic determination of soil water content:Ž .measurement in coaxial transmission lines. Water Resources Research 16 3 , 574–582.
Verosub, K.L., Roberts, A.P., 1995. Environmental magnetism: past, present and future. J.Ž .Geophys. Res. 100 B2 , 2175–2192.