soil quality and soil health: a review. - assam
TRANSCRIPT

Seediscussions,stats,andauthorprofilesforthispublicationat:http://www.researchgate.net/publication/232237296
Soilqualityandsoilhealth:Areview.
ARTICLEinINTERNATIONALJOURNALOFECOLOGYANDENVIRONMENTALSCIENCES·JANUARY2012
CITATION
1
4AUTHORS,INCLUDING:
RakeshKMaikhuri
GBPantInstituteofHimalayanEnvironme…
123PUBLICATIONS1,356CITATIONS
SEEPROFILE
KottapalliSRao
UniversityofDelhi
106PUBLICATIONS1,326CITATIONS
SEEPROFILE
Allin-textreferencesunderlinedinbluearelinkedtopublicationsonResearchGate,
lettingyouaccessandreadthemimmediately.
Availablefrom:KottapalliSRao
Retrievedon:26October2015
International Journal of Ecology and Environmental Sciences 38 (1): 19-37, 2012© NATIONAL INSTITUTE OF ECOLOGY, NEW DELHI
Soil Quality and Soil Health: A Review
JOYLATA LAISHRAM , K.G. SAXENA *, R.K. MAIKHURI AND K.S. RAO 1 1 2 3
School of Environmental Sciences, Jawaharlal Nehru University, New Delhi 110067, India1
G.B. Pant Institute of Himalayan Environment and Development, Upper Bhaktiyana, P.O. Box 92, Srinagar2
(Garhwal) 246174, Uttarakhand, India Department of Botany, University of Delhi, Delhi 110007, India.3
* Corresponding author; Email: [email protected]
ABSTRACT
Soil health and soil quality are defined as the capacity of soil to function as a vital living system within land use boundaries. This
function which sustains biological productivity of soil also maintains the quality of surrounding environment and human health.
Thus the two terms are used interchangeably although it is important to distinguish that, soil quality is related to soil function,
whereas soil health presents the soil as a finite non-renewable and dynamic living resource. In this review, we deal with soil health
concept which includes interactions between plant inputs and soil in creating a healthy environment. Adverse effects on soil health
and soil quality arise from nutrient imbalance in soil, excessive fertilization, soil pollution and soil loss processes that are
increasingly becoming common in developing countries. This review will examine the development of soil health approaches as
well as the content of soil health and soil quality information and its application to reduce negative impacts on agricultural
productivity and long term sustainability.
Key Words: Soil Functions, Soil Indicators, Soil Quality Indices, Soil Organic Carbon, Carbon Management Index
INTRODUCTION
Soil, like air and water, is a fundamental natural resourcesupporting a variety of ecosystem goods and services tothe benefit of the mankind. While production function ofsoil was recognized long back, importance ofconservation and enhancement of ecosystem servicesrendered by soil (e.g., carbon sequestration, waterpurification, recharge of ground water, control ofpopulations of pathogens, biological nitrogen fixationand biodiversity conservation) has been realized only inthe recent past. A concern for maintaing/improving soilquality arose long after that for water and soil. Soilprocesses are such that soil has been considered as anecosystem by itself rather than a component ofecosystem. While criteria, indicators and standards ofwater and air quality are unambiguous and universallyaccepted, the concept of soil quality, further elaboratedas soil health is still evolving, with soil qualitylegislations framed so far only in a few countries (Filip2002, Nortcliff 2002)
MEANING OF SOIL QUALITY AND SOIL HEALTH
Soil quality can be defined as the fitness of a specifickind of soil, to function within its capacity and withinnatural or managed ecosystem boundaries, to sustainplant and animal productivity, maintain or enhance waterand air quality, and support human health and habitation(Karlen et al. 1997, Arshad and Martin 2002). Consi-deration of soil as a finite and living resource, led to theconcept of soil health defined as the continued capacityof soil to function as a vital living system, within eco-system and land-use boundaries, to sustain biologicalproductivity, maintain or enhance the quality of air andwater, and promote plant, animal and human health(Doran et al. 1996, 1998, Doran and Zeiss 2000).Though the use of soil health has emerged in recentyears, variation in ability of soils to suppress plantdiseases is known since many decades (Janvier et al.2007). Baker and Cook (1974) described the suppressivesoils in which disease severity or incidence remains low,in spite of the presence of a pathogen, a susceptible host
Laishram et al.: Soil Quality and Health Int. J. Ecol. Environ. Sci.20
plant and climatic conditions favourable for diseasedevelopment. Another concept linked to soil suppres-siveness is the concept of soil receptivity to diseasesaddressing the role of soil factors in determining theexpression of inoculum density and pathogenic capacityof the inoculum or intrinsic aggressivity of the inoculumin terms of appearance or severity of the disease(Linderman et al. 1983). Arbuscular mycorrhizal funginot only improve crop nutrition but also protect cropsfrom pathogens and toxic substances (Jeffries et al.2003). Further, a soil rich in organic carbon andnutrients (considered commonly as high quality soils)may not be considered to be a healthy soil if it causesinjury to crops or supports large parasite populations(Abawi and Widmer 2000). van Bruggen and Semenov(2000) viewed soil health as a dimension of ecosystemhealth and explained soil health as the resistance andresilience of soil in response to various stresses and dis-turbances. Thus, there is a considerable degree of over-lap in the meaning of soil quality and soil health (Doran2002), though soil health perceptions tend to focus moreon biotic components of soil (Anderson 2003). Soil
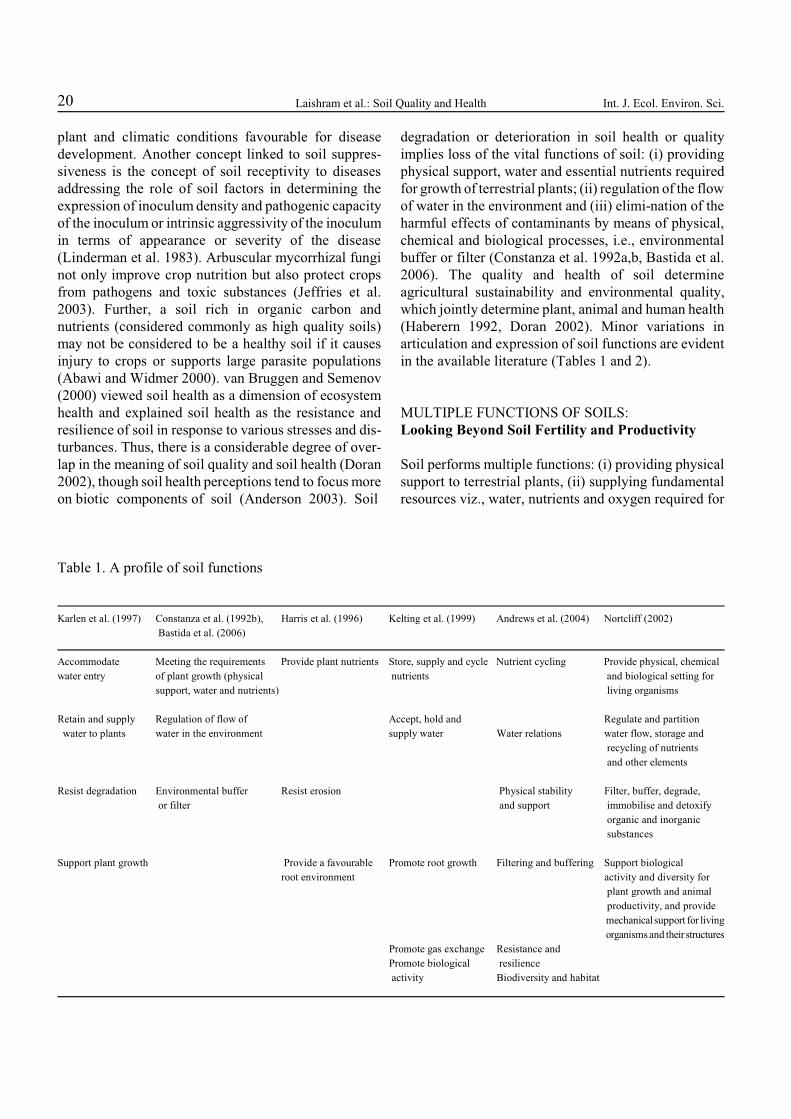
degradation or deterioration in soil health or qualityimplies loss of the vital functions of soil: (i) providingphysical support, water and essential nutrients requiredfor growth of terrestrial plants; (ii) regulation of the flowof water in the environment and (iii) elimi-nation of theharmful effects of contaminants by means of physical,chemical and biological processes, i.e., environmentalbuffer or filter (Constanza et al. 1992a,b, Bastida et al.2006). The quality and health of soil determineagricultural sustainability and environmental quality,which jointly determine plant, animal and human health(Haberern 1992, Doran 2002). Minor variations inarticulation and expression of soil functions are evidentin the available literature (Tables 1 and 2).
MULTIPLE FUNCTIONS OF SOILS:Looking Beyond Soil Fertility and Productivity
Soil performs multiple functions: (i) providing physicalsupport to terrestrial plants, (ii) supplying fundamentalresources viz., water, nutrients and oxygen required for
Table 1. A profile of soil functions
Karlen et al. (1997) Constanza et al. (1992b), Harris et al. (1996) Kelting et al. (1999) Andrews et al. (2004) Nortcliff (2002)
Bastida et al. (2006)
Accommodate Meeting the requirements Provide plant nutrients Store, supply and cycle Nutrient cycling Provide physical, chemical
water entry of plant growth (physical nutrients and biological setting for
support, water and nutrients) living organisms
Retain and supply Regulation of flow of Accept, hold and Regulate and partition
water to plants water in the environment supply water Water relations water flow, storage and
recycling of nutrients
and other elements
Resist degradation Environmental buffer Resist erosion Physical stability Filter, buffer, degrade,
or filter and support immobilise and detoxify
organic and inorganic
substances
Support plant growth Provide a favourable Promote root growth Filtering and buffering Support biological
root environment activity and diversity for
plant growth and animal
productivity, and provide
mechanical support for living
organisms and their structures
Promote gas exchange Resistance and
Promote biological resilience
activity Biodiversity and habitat

38: 19-37 Laishram et al.: Soil Quality and Health 21
Table 2. Ecological functions of soil (FAO 1995) and their indicators
Ecological Functions of Soil Indicators of Proper Functioning
Production function High levels of crop yields and incomes
Biotic environmental function/living space function High levels of species richness and functional dominance of beneficial organisms –
High levels of crop yields and incomes and high quality food and habitation
Climate-regulative function/storage function High levels of carbon stocks and slow rates of greenhouse gas emissions
Hydrologic function Adequate availability of water/reduced risks floods
Waste and pollution control function High levels of crop yields and incomes and high quality food and habitation
Archive or heritage function
Connective space function
terrestrial primary production, (iii) providing habitat toa variety of soil organisms, with taxonomic identity andfunctions of several organisms still unknown/lesserknown to the scientific and wider community, (iii)regulating hydrological and mineral/nutrient cycling,with significant impacts on global climate, (iv) detoxi-fication of organic and inorganic substances, leading topurification of water resource and (v) resisting erosion.A given soil function is achieved through severalmechanisms/processes and a given mechanism/processmay contribute to several functions. Thus, litter decom-position and mineralization contribute to detoxificationas well as nutrient supply/agricultural production func-tions of soil. The overall assessment about whether a soilis good or bad depends on the objective of assessmentand the net outcome of different soil processes andfunctions in given conditions. Thus, a soil may supplyhuge quantities of nutrients supporting high primaryproduction but may not provide suitable habitats to manysoil organisms, e.g., cropping soon after deforestationusing agrochemicals. One may get high crop produc-tivity but with contamination of water and infected foodproducts, a situation of high production but low detoxi-fication function. In situations where low agriculturalproductivity is the one and the only problem faced by themankind, one may ignore functions of soil other thanproduction function (i.e., capacity of soil to supplywater, nutrients and oxygen and to reduce crop yieldlosses due to pests and diseases). However, in thepresent widespread scenario of multiple problems(including increased levels of greenhouse gases in theatmosphere, soil erosion and land degradation,production of infected crop products, depletion andpollution of water resources, and depletion of bio-diversity), there is a need of addressing multiple
functions of soil in an objective manner. The concept ofsoil quality/health is essentially an elaboration of theconcept of soil productivity/fertility to deal with themultiple and complex problems faced by the worldtoday. This perspective of optimizing multiple functionsmakes soil health an integral dimension of agroeco-system health and sustainable development.
The soil functions can be weighted according to therelative importance of each function in fulfilling themanagement goals based on expert opinions (Masto etal. 2007). Regulation of each function is determined bya large number of soil attributes and a single attribute ora statistical/mathematical derivative of several attributes(in the form of an index) can be viewed as an indicatorof one or more soil functions if a systematic relationshipexists between the attribute(s) or its derivative with thesoil functions. As a single measurable soil attribute isunlikely to be correlated with soil function(s) andmeasurement of ‘all’ soil attributes is not practical, oneneeds to draw a minimum number of indicators (mini-mum data set). Many soil indicators in the minimumdata set interact with each other, and thus, values of oneis affected by one or more of these selected parameters(Tables 3 and 4).
Scientific relevance of an indicator of soil quality/health depends on (i) its sensitivity to variations in soilmanagement, (ii) good correlation with the beneficialsoil functions and other variables which are difficult toaccess or measure, (iii) helpfulness in revealing eco-system processes (iv) comprehensibility and utility forland managers, i.e., utility of the indicator as a bench-mark in land use decision making (v) cheap and easy tomeasure (Parisi et al. 2005). Karlen et al. (1997) listedthe desired features of indices or indicators as (i) easy tomeasure parameters, (ii) rapid/less time consuming
Laishram et al.: Soil Quality and Health Int. J. Ecol. Environ. Sci.22
Table 3. Key soil indicators for soil quality assessment (after Arshad and Coen 1992, Doran and Parkin 1994,Gregorich et al. 1994, Larson and Pierce 1991, Carter et al. 1997, Karlen et al. 1997, Martin et al. 1998)
Selected indicator Rationale for selection
Organic matter Defines soil fertility and soil structure, pesticide and water retention, and use in process models
Topsoil-depth Estimate rooting volume for crop production and erosion
Aggregation Soil structure, erosion resistance, crop emergence an early indicator of soil management effect
Texture Retention and transport of water and chemicals, modeling use
Bulk density Plant root penetration, porosity, adjust analysis to volumetric basis
Infiltration Runoff, leaching and erosion potential
pH Nutrient availability, pesticide absorption and mobility, process models
Electrical conductivity Defines crop growth, soil structure, water infiltration; presently lacking in most process models
Suspected pollutants Plant quality, and human and animal health
Soil respiration Biological activity, process modeling; estimate of biomass activity, early warning of management effect on
organic matter
Forms of N Availability of crops, leaching potential, mineralization/ immobilization rates, process modeling
Extractable N, P and K Capacity to support plant growth, environmental quality indicator
Table 4. Interrelationship of soil indicators (based on Arshad and Martin 2002)
Selected indicator Other soil quality indicators in the MIDS affecting the selected indicator
Aggregation Organic matter, microbial (especially, fungal) activity, texture
Infiltration Organic matter, aggregation, electrical conductivity, ex-changeable sodium percentage (ESP)
Bulk density Organic matter, aggregation, topsoil-depth, ESP, biological activity
Microbial biomass Organic matter, aggregation, bulk density, pH, texture, ESP and/or respiration
Available nutrients Organic matter, pH, topsoil-depth, texture, microbial parameters (mineralization and immobilization rates)
methods, and (iii) high sensitivity of parameters to detectdifferences on a temporal and spatial scales. Soil qualityindicators would be useful to farmers and planners onlyif we know their critical limits, i.e., the desirable rangeof values of a given indicator that must be maintainedfor normal functioning of the soil. The critical limitswould vary depending on the goal of management withinan ecoregion. Most crops grow over a pH range of 6.5 to7.0. Reduction in yields of alfalfa and blueberries occurwhen pH drops below 6.5 in case of the former and 4.0in case of the latter crop (Doll 1964). Generalizationabout critical limits are difficult as critical limit of a soilindicator can be ameliorated or exacerbated by limits ofother soil properties and the interactions among soilquality indicators (Arshad and Martin 2002). Based onfarm level studies in Phillipines, Gomez et al. (1996)considered an indicator to be at a sustainable level if it
exceeds a designated trigger or threshold level; thresh-olds are tentatively set based on the average localconditions.
SOIL QUALITY INDICES
Soil quality indices are decision tools that effectivelycombine a variety of information for multi-objectivedecision making (Karlen and Stott 1994). A number ofsoil quality and fertility indices have been proposed(Stefanic et al. 1984, Beck 1984, Karlen et al. 1998,Trasar-Cepeda et al. 1998, Andrews et al. 2002), noneidentifies state of soil degradation that affects itsfunctionality. Bastida et al. (2006), building on theapproach of Andrews et al. (2002), suggested micro-biological degradation index. While many workers

38: 19-37 Laishram et al.: Soil Quality and Health 23
appreciated and recommended the use of soil qualityindices, reservations about their utility also expressed.Many a times the concepts associated with soil qualityare used in close association with the concepts ofsustainability, leading to a degree of confusion andinappropriate use of the term soil quality (Sojka andUpchurch 1999). Even though the importance ofevaluation of soil quality is being increasingly realized,there is yet no global consensus on how this should bedefined. While the notion of soil quality includes soilfertility, soil productivity, resource sustainability andenvironmental quality in the USA, soil contamination isthe focus in Canada and much of western Europe (Singerand Ewing 1998). Sojka and Upchurch (1999) suggestthat the search for a single, affordable, workable soilquality index is unattainable
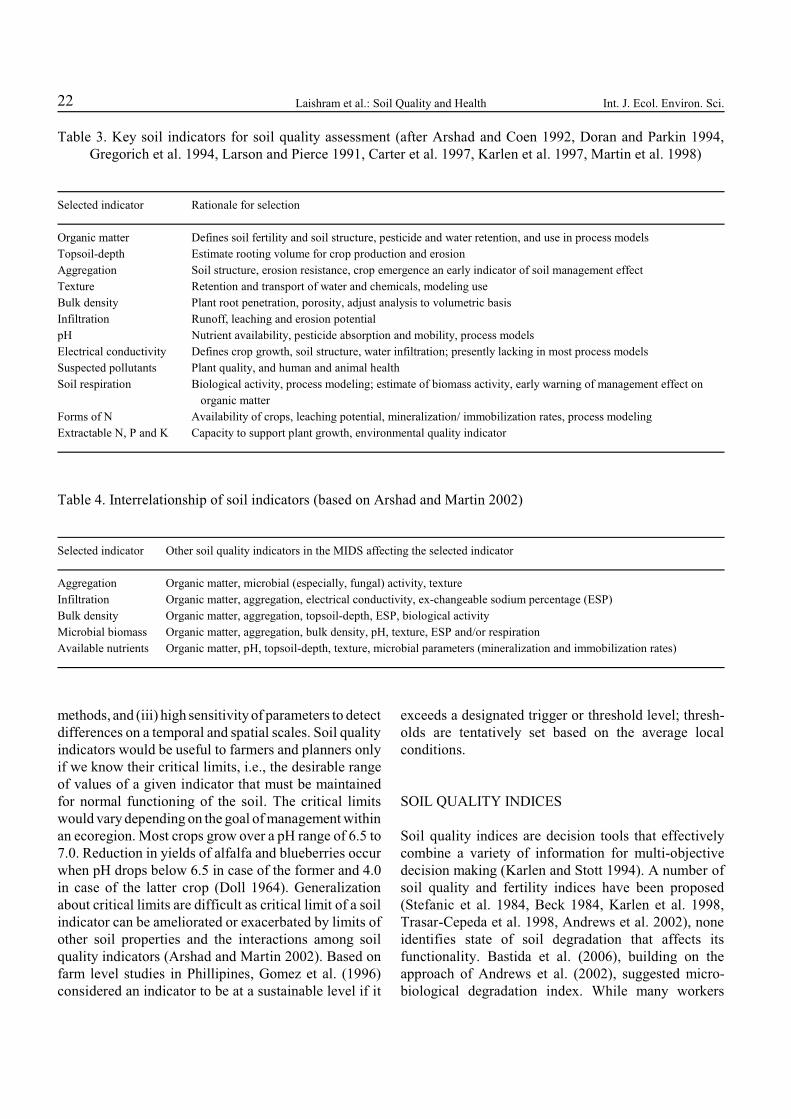
Selection of soil quality indicators or syntheticindices is guided by the goal of ecosystem management.If achieving sustainability is the goal of agroecosystemmanagement, a soil quality index will constitute onecomponent within a nested agroecosystem sustainabilityhierarchy (Figure 1). Management goals may also differby the interests and visions of different sections ofpeople concerned with agriculture (Table 5).
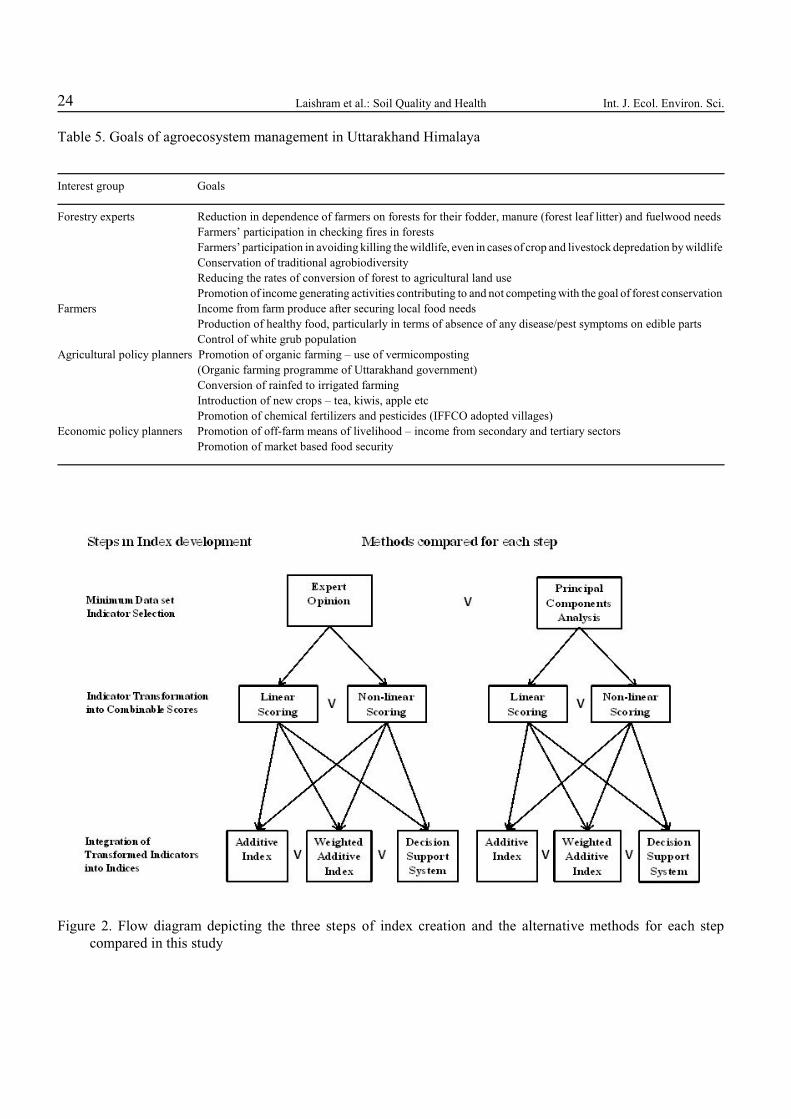
Once the management goals are identified, soilquality indexing involves three steps: (i) selection of soilproperties/indicators constituting the minimum data set
(ii) transformation of indicator scores enablingquantification of all indicators to a commonmeasurement scale and (iii) combining the indicatorscores into the index (Figures 2 and 3). Selection of soilproperties/indicators of soil quality and theirstatistical/mathematical treatment to derive a compositeindex vary a lot (Tables 6 and 7).
Velasquez et al. (2007) stressed the importance ofidentifying sub indicators (e.g., macrofauna, organicmatter, physical quality, chemical quality and soilmorphology) reflecting different aspects of soil quality.Statistical tools such as principal component analysis,multiple correlation, factor analysis, cluster analysis andstar plots may be used to select the variables for inclu-sion in index, avoiding the possibilities of disciplinarybiases in expert opinion based approaches (Bachmannand Kinzel 1992, Doran and Parkin 1996). A carefulconsideration of sampling intensity and inherentvariability of different soil attributes is required whilecombining several soil attributes as one synthetic index.Warrick and Nielsen (1980) report that 2,110 and 1,300samples were required to achieve the same level ofprecision in estimation of bulk density, percent clay andhydraulic conductivity. A huge degree of spatio-temporal variation within a given land use/ecosystem isobserved in soil microbial properties and micronutrientsby many workers (Parkin 1993, Khan and Nortcliff1982).
Figure 1. Nested hierarchy of agroecosystem sustainability showing the relationship of soil quality to the larger agroecosystem.
Laishram et al.: Soil Quality and Health Int. J. Ecol. Environ. Sci.24
Table 5. Goals of agroecosystem management in Uttarakhand Himalaya
Interest group Goals
Forestry experts Reduction in dependence of farmers on forests for their fodder, manure (forest leaf litter) and fuelwood needs
Farmers’ participation in checking fires in forests
Farmers’ participation in avoiding killing the wildlife, even in cases of crop and livestock depredation by wildlife
Conservation of traditional agrobiodiversity
Reducing the rates of conversion of forest to agricultural land use
Promotion of income generating activities contributing to and not competing with the goal of forest conservation
Farmers Income from farm produce after securing local food needs
Production of healthy food, particularly in terms of absence of any disease/pest symptoms on edible parts
Control of white grub population
Agricultural policy planners Promotion of organic farming – use of vermicomposting
(Organic farming programme of Uttarakhand government)
Conversion of rainfed to irrigated farming
Introduction of new crops – tea, kiwis, apple etc
Promotion of chemical fertilizers and pesticides (IFFCO adopted villages)
Economic policy planners Promotion of off-farm means of livelihood – income from secondary and tertiary sectors
Promotion of market based food security
Figure 2. Flow diagram depicting the three steps of index creation and the alternative methods for each stepcompared in this study
38: 19-37 Laishram et al.: Soil Quality and Health 25
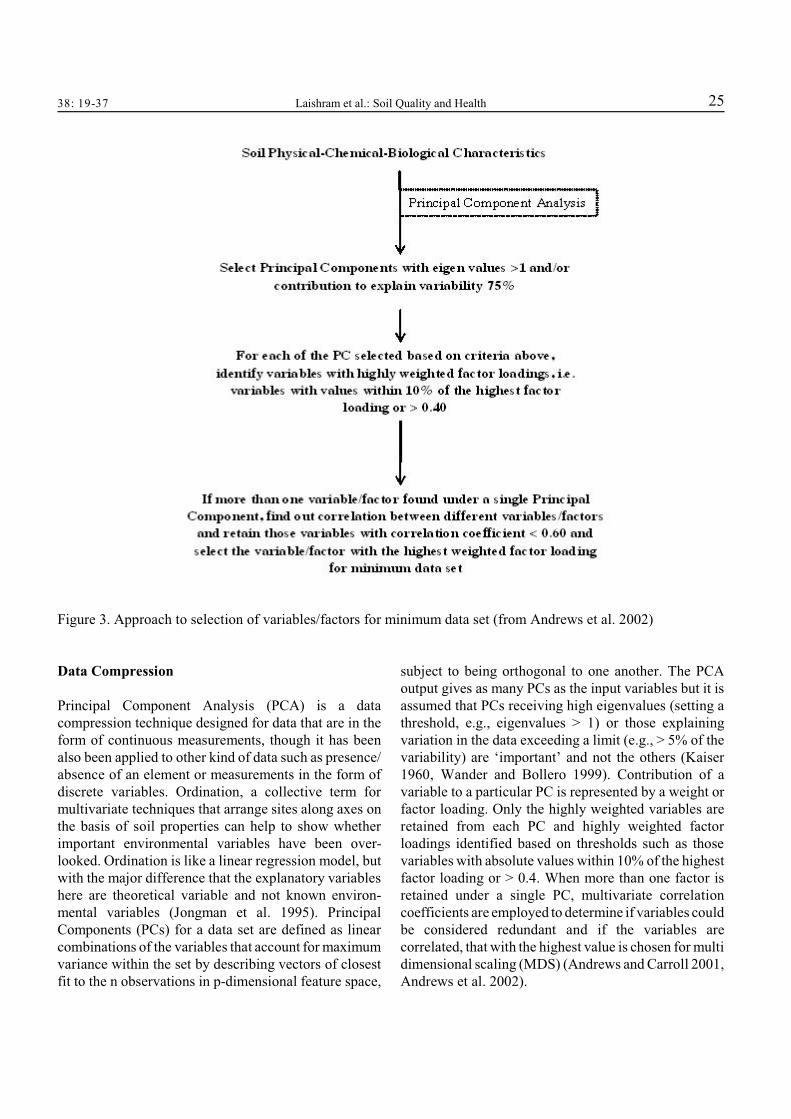
Figure 3. Approach to selection of variables/factors for minimum data set (from Andrews et al. 2002)
Data Compression
Principal Component Analysis (PCA) is a datacompression technique designed for data that are in theform of continuous measurements, though it has beenalso been applied to other kind of data such as presence/absence of an element or measurements in the form ofdiscrete variables. Ordination, a collective term formultivariate techniques that arrange sites along axes onthe basis of soil properties can help to show whetherimportant environmental variables have been over-looked. Ordination is like a linear regression model, butwith the major difference that the explanatory variableshere are theoretical variable and not known environ-mental variables (Jongman et al. 1995). PrincipalComponents (PCs) for a data set are defined as linearcombinations of the variables that account for maximumvariance within the set by describing vectors of closestfit to the n observations in p-dimensional feature space,
subject to being orthogonal to one another. The PCAoutput gives as many PCs as the input variables but it isassumed that PCs receiving high eigenvalues (setting athreshold, e.g., eigenvalues > 1) or those explainingvariation in the data exceeding a limit (e.g., > 5% of thevariability) are ‘important’ and not the others (Kaiser1960, Wander and Bollero 1999). Contribution of avariable to a particular PC is represented by a weight orfactor loading. Only the highly weighted variables areretained from each PC and highly weighted factorloadings identified based on thresholds such as thosevariables with absolute values within 10% of the highestfactor loading or > 0.4. When more than one factor isretained under a single PC, multivariate correlationcoefficients are employed to determine if variables couldbe considered redundant and if the variables arecorrelated, that with the highest value is chosen for multidimensional scaling (MDS) (Andrews and Carroll 2001,Andrews et al. 2002).

Laishram et al.: Soil Quality and Health Int. J. Ecol. Environ. Sci.26
Table 6. Selection of soil properties in a cross section of studies
Reference Soil Properties
Andrews et al. (2002) Comparison of conventional, low input and organic agroecosystems
4 3EC*, ExCa, ExK, ExMg, Moisture, NH -N, NO -N, pH, PLFA, Pot min N, SAR, Soluble P, SOM, TN,
TOC, TS, Zn
Masto et al. (2007) Long term fertilizer experiments
4 3Porosity, Bulk density, WHC, CEC, pH, EC, SOC, TN, NH -N, NO -N, AvP, ExK, AvS, AvZn, AvCu,
AvMn, AvFe, MBC, P fixing capacity, K fixing capacity, Dehydrogenase, Phosphatase
Valasquez et al. (2007) 17 groups of macro fauna, ExP, Total P, ExK, ExCa, ExMg, ExNa, pH, Bulk density, Real density, Moisture,
4 Shear strength, Penetration resistance, Aggregation (small, medium and large aggregates), TC, TN, NH -N,
3 NO -N, Mineralization, Density factions of SOC
Bastida et al. (2006) Microbiological degradation index
EC, pH, TN, AvP, ExK, TOC, Water soluble C, Water soluble carbohydrates, MBC, Respiration, ATP,
Dehydrogenase, Urease, Protease, Phosphatase, Glocosidase
Sparling et al. (2004) Soil quality indicators
Total C, Total N, PH, ExCa, ExMg, ExK, ExNa, Base saturation, Soil respiration, Microbial biomass C,
Mineralizable N, Bulk density, Particle density, Saturated and non-saturated hydraulic conductivity,
Readily available water, Macro porosity, Total porosity, Olsen P, Aggregate stability
Sparling and Schipper (2002) Key soil properties
Total C, Total N, Mineralizable N, pH, Olsen P, Bulk density, Macroporosity
Sangha et al. (2005) Soil health attributes in pastures
C, pH, Nitrate, Microbial biomass C, Microbial biomass N
* EC - Electrical conductivity; PLFA - Phospholipid fatty acids; SOM - Soil organic matter; TN - Total nitrogen; TOC - Total organic carbon; WHC - Water
holding capacity; CEC - Cation exchange capacity; MBC - Microbial biomass carbon; SAR - Sodium absorption ratio; SOC - Soil organic carbon; TS - Total
solids. Prefix Ex - Exchangeable and Av - Available.
Data Transformation
The selected indicators can be transformed following alinear or a non-linear scoring rule. For ‘more is better’indicators, each observation is divided by the highestobserved value such that the highest observed valuereceived a score of 1. For ‘less is better’ indicators, thelowest observed value (in the numerator) is divided byeach observation (in the denominator) such that thelowest observed value receives a score of 1. For someindicators, observations are scored as ‘higher is better’up to a threshold value and as ‘lower is better’ above thethreshold (Leibig et al. 2001). The values of differentvariables can be transformed to a common range,between 0.1 to 1.0 with homothetic transformation(Velasquez et al. 2007):
y = 0.1 + (x-b)/(a-b) * 0.9
where, y = value of the variable after transformation, x
= the variable to transform, a = the maximum value ofthe variable, and b = the minimum value of the variable
Non-linear scoring functions are constructed based onliterature review and consensus of the collaboratingresearchers. Masto et al. (2007) used the followingequation for deriving non-linear scores:
Non-linear score (y) = 1/1+e –b (x-a)
where, x = soil property value, a = the baseline or valueof the soil property (the scoring function equals 0.5 andequals the midpoint between the upper threshold valueand the lower threshold value), and b = slope. The upper threshold value is the soil property value forwhich the score equals 1 and which corresponds to themost favourable level. The lower threshold value is thesoil property value where the score equals 0 and whichcorresponds to an unacceptable level. Baselines aregenerally regarded as the minimum target values.
38: 19-37 Laishram et al.: Soil Quality and Health 27
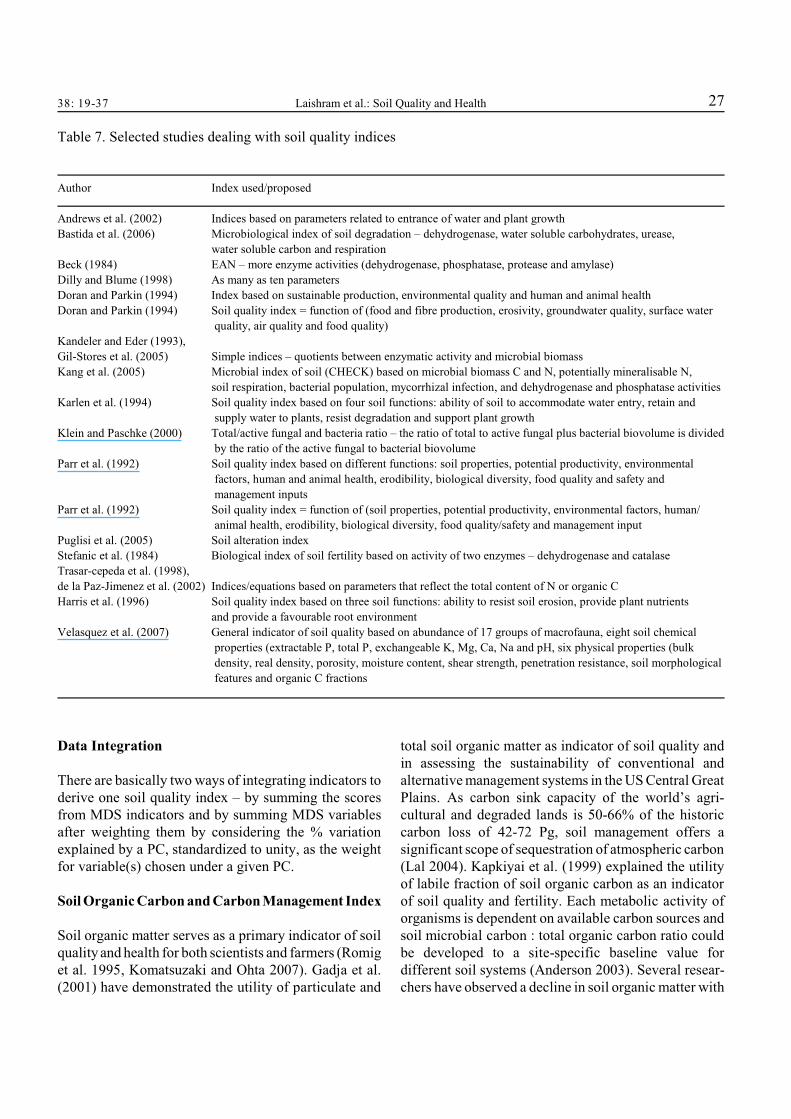
Table 7. Selected studies dealing with soil quality indices
Author Index used/proposed
Andrews et al. (2002) Indices based on parameters related to entrance of water and plant growth
Bastida et al. (2006) Microbiological index of soil degradation – dehydrogenase, water soluble carbohydrates, urease,
water soluble carbon and respiration
Beck (1984) EAN – more enzyme activities (dehydrogenase, phosphatase, protease and amylase)
Dilly and Blume (1998) As many as ten parameters
Doran and Parkin (1994) Index based on sustainable production, environmental quality and human and animal health
Doran and Parkin (1994) Soil quality index = function of (food and fibre production, erosivity, groundwater quality, surface water
quality, air quality and food quality)
Kandeler and Eder (1993),
Gil-Stores et al. (2005) Simple indices – quotients between enzymatic activity and microbial biomass
Kang et al. (2005) Microbial index of soil (CHECK) based on microbial biomass C and N, potentially mineralisable N,
soil respiration, bacterial population, mycorrhizal infection, and dehydrogenase and phosphatase activities
Karlen et al. (1994) Soil quality index based on four soil functions: ability of soil to accommodate water entry, retain and
supply water to plants, resist degradation and support plant growth
Klein and Paschke (2000) Total/active fungal and bacteria ratio – the ratio of total to active fungal plus bacterial biovolume is divided
by the ratio of the active fungal to bacterial biovolume
Parr et al. (1992) Soil quality index based on different functions: soil properties, potential productivity, environmental
factors, human and animal health, erodibility, biological diversity, food quality and safety and
management inputs
Parr et al. (1992) Soil quality index = function of (soil properties, potential productivity, environmental factors, human/
animal health, erodibility, biological diversity, food quality/safety and management input
Puglisi et al. (2005) Soil alteration index
Stefanic et al. (1984) Biological index of soil fertility based on activity of two enzymes – dehydrogenase and catalase
Trasar-cepeda et al. (1998),
de la Paz-Jimenez et al. (2002) Indices/equations based on parameters that reflect the total content of N or organic C
Harris et al. (1996) Soil quality index based on three soil functions: ability to resist soil erosion, provide plant nutrients
and provide a favourable root environment
Velasquez et al. (2007) General indicator of soil quality based on abundance of 17 groups of macrofauna, eight soil chemical
properties (extractable P, total P, exchangeable K, Mg, Ca, Na and pH, six physical properties (bulk
density, real density, porosity, moisture content, shear strength, penetration resistance, soil morphological
features and organic C fractions
Data Integration
There are basically two ways of integrating indicators toderive one soil quality index – by summing the scoresfrom MDS indicators and by summing MDS variablesafter weighting them by considering the % variationexplained by a PC, standardized to unity, as the weightfor variable(s) chosen under a given PC.
Soil Organic Carbon and Carbon Management Index
Soil organic matter serves as a primary indicator of soilquality and health for both scientists and farmers (Romiget al. 1995, Komatsuzaki and Ohta 2007). Gadja et al.(2001) have demonstrated the utility of particulate and
total soil organic matter as indicator of soil quality andin assessing the sustainability of conventional andalternative management systems in the US Central GreatPlains. As carbon sink capacity of the world’s agri-cultural and degraded lands is 50-66% of the historiccarbon loss of 42-72 Pg, soil management offers asignificant scope of sequestration of atmospheric carbon(Lal 2004). Kapkiyai et al. (1999) explained the utilityof labile fraction of soil organic carbon as an indicatorof soil quality and fertility. Each metabolic activity oforganisms is dependent on available carbon sources andsoil microbial carbon : total organic carbon ratio couldbe developed to a site-specific baseline value fordifferent soil systems (Anderson 2003). Several resear-chers have observed a decline in soil organic matter with

Laishram et al.: Soil Quality and Health Int. J. Ecol. Environ. Sci.28
increasing agricultural land use intensity and duration(Dalal and Mayer 1986, Golchin et al. 1995, Spaccini etal. 2001, Lemenih et al. 2005) due to changes in soilstructure caused by tillage, removal of biomass andincreased mineralization and decomposition of exposedsoils (Oldeman et al. 1990). Mann (1986) found soil Cin cultivated soil on average 20% less than uncultivatedsoils and the greatest rate of change during the first 20years after land use change based on analysis of soil datafrom 50 different sources. The magnitude of decline insoil carbon depends on the soil depth used for carbonestimations and time scale of land use change. Davidsonand Ackerman (1993) found mean carbon loss of 30% ifboth A and B horizons were considered as compared to40% if only A horizon was considered. However, sucha decline is more prominent in labile carbon fractions,which are highly correlated with soil microbial biomassand the availability of labile nutrients such as nitrogen,phosphorus and sulfur, than in total soil organic matter.Impacts of altered land management may be reflected interms of loss of the labile fractions or soil microbialbiomass but not in terms of that of the total SOC(Powlson et al. 1987, Blair et al. 1995, Sangha et al.2005, Collard and Zammit 2006). Based on a 6-year trialof soil quality monitoring in New Zealand, Sparling etal. (2004) did not find utility of microbial biomass andsoil respiration as measures of soil quality because ofdifficulty in ephemeral nature of such biologicalmeasurements and the difficulty in justifying their targetranges. However, microbial biomass has been shown tobe correlated with anaerobically mineralized C and thusthe latter may be a surrogate for the former (Hart et al.1986, Stockdale and Rees 1994). While soil organic Cand N have been measured in virtually all soil qualitymeasurement methods, there is little evidence to showthat organic matter contributes to yield on irrigated andfertilized croplands (Sojka and Upchurch 1999).
The loss of SOC following conversion of naturalecosystems to agroecosystems occurs at rates muchfaster than the rates of recovery following abandonmentof agricultural land use. Knops and Tilman (2000)estimated a period of about 250 years for total recoveryof carbon to pre-agricultural levels after abandonment ina continental climate. Though some estimates on criticallevels of SOC are available (e.g., Greenland et al. (1975)considered 2% of SOC as the minimum requirement formaintenance of satisfactory soil aggregate stability andabove which no further increases in productivity areachieved (Janzen et al. 1992), the quantitative basis forsuch thresholds is limited (Loveland and Webb 2003).
Janssen and de Willigen (2006) considered 6 g kg of-1
soil organic carbon as the minimum limit to preventcollapse of soil structure of sandy loams and showed thatthis level cannot be maintained by roots and stubblealone if maize yield is below 7-8 Mg ha . Prasad et al.-1
(2003), with particular reference to the Indian agri-culture, considered soils with organic carbon (%) values< 0.5 as low fertility soils, 0.5 to 0.75 as medium fertilitysoils and > 0.75 as high fertility soils. Magdoff (1998)reported potential crop yield increases by 12% for every1% of soil organic matter based on his studies in USA.There has been no consensus on what the critical level ofsoil organic matter should be in an agricultural soil andhow this level will vary between soils of differenttextural classes under different environmental conditions(Nortcliff 2002). While increase in organic matter isdesirable from the point of view of its contribution interms of improvement in soil aggregation, it may beundesirable if such an increase coupled with an increasein application requirement of soil incorporated pesticidesand in more rapid flow through soils with consequentrapid transport of applied nutrients and other soilamendments (Stevenson 1972, Ross and Lembi 1985,Sojka and Upchurch 1999). Further, as high levels ofsoil organic matter and manure may enhance P solubilityin the water and result in nutrient loss if soil is easilyeroded (Robinson and Sharpley 1995, Sharpley andSmith 1995).
Chemically labile carbon fractions include avariety of organic substances, e.g., water soluble carbon(carbon extracted in distilled water, 1:5 solid : liquid,shaken for 2 hrs), water soluble carbohydrates (carbo-hydrates in above solution) (Brink et al. 1960, Bastida etal. 2006). Labile fractions, microbial biomass, dehydro-genase activity and ATP levels may be highly correlated(Nannipieri et al. 1990, Garcia et al. 1994). In general,bacteria contribute more in terms of decomposition oflabile/soluble components of residues and fungi of theresistant (lignocellulose) component. Microbial biomassconsists of both dormant and metabolically activeorganisms and has been considered as an integrativeindicator of microbial significance of soils (Powlson1994). However, variation in soil microbial biomass maynot be necessarily correlated to soil quality (Martens1995, Dilly and Munch 1998).
Soil organic matter, the primary source and tempo-rary sink for plant nutrients and soil organic carbon inagroecosystems has been considered as the best surro-gate for soil health (Dumanski and Pieri 2000). Theimpacts of land management practices are marked in
38: 19-37 Laishram et al.: Soil Quality and Health 29
terms of variation in labile fraction of organic carbon ormicrobial quotients than in total soil organic carbon(Breland and Eltun 1999). Thus, an index derived fromboth labile and non-labile carbon fractions is likely to bea more sensitive indicator of land use intensification orland management practices compared with a singlemeasure of soil carbon content.
As a change in land use is coupled with change inbulk density, the method of calculation of soil carbon isalso likely to influence the conclusion on land usechange-carbon stock relationship. The most commonmethod is to sample soil from similar depths in differentland uses and express soil carbon stocks in terms of MgC ha using bulk density values. An alternative method-1
is to measure bulk density first and then to calculate thesampling depths to obtain the same mass (dry soil) ofsoil in different land uses (Ellert and Gregorisch 1996).Similarly three distinct types of approaches could beadopted to quantify the change: (i) repeated measure-ments on a single site (ii) paired sites and (iii) chrono-sequences where neighbouring sites experienced landuse change at different times in the past, each having itsown limitations and advantages (Murty et al. 2002). Aslabile fractions respond to seasonal variations more thantotal soil organic carbon (Bastida et al. 2006), samplingseason need to be carefully considered while using labileorganic carbon as an indicator of soil quality.
Adoption of United Nations Framework forConvention on Climate Change was followed bydevelopment of procedures to quantify the flux ofgreenhouse gas inventories (IPCC 1997). The proceduresuggested for calculating soil carbon amounts followinga land use change was:
Cm = Cn * B * T * I
where,Cm = the amount of soil carbon some time after land usechange; Cn = the amount of soil carbon under the original nativevegetation; B = base factor, with values varying from 0.5 to 1.1depending on environmental factors and the type ofagricultural activities following the transition and thelowest values referring to long-term cultivated aquicsoils or degraded land in the tropics and the highestvalues to improved pasture and rice paddies; T = tillage factor which takes on higher values (1.1) forno tillage and lower values for full tillage (0.9-1.0); I = input factor accounting for different levels of input
from different residue management systems varyingbetween 0.8 for shortened fallow under shiftingcultivation to 1.2 for high input systems, such as thosereceiving regular fertilizer additions.
Assumptions are made in inventorying nationalgreenhouse gas emissions. Australian National Green-house Gas Inventory assumes that 30% of soil C is lostin conversion to unimproved pasture and 10% is gainedin conversion to improved pasture (Kirschbaum et al.2000).
Blair et al. (1995) proposed Carbon ManagementIndex (CMI), a multiplicative function of Carbon PoolIndex (CPI) and Lability Index (LI) as an indicator of therate of change of soil organic matter in response to landmanagement changes, relative to a more stable referencesoil:
Carbon Pool Index (CPI) = Total C of a given land use/ Total C of the reference land use
Lability Index (LI) = [Labile carbon content of a given land use/Non-labilecarbon content of a given land use] * [Labile carboncontent of the reference land use/Non-labile carboncontent of the reference land use]
Carbon Management Index (CMI) = CPI * LI * 100
Collard and Zammit (2006) extended this conceptand initially applied at ecosystem/land use type scale tolandscape scale. They calculated ‘landscape CMI’ assum of the products of multiplication of the CMI valuesof different land uses differentiated in a landscape by therelative areas (%) of different land uses.
Enzymes As Indicators of Organic Matter Qualityand Microbial Activity
Soil enzyme assays generally provide a measure of thepotential activity, i.e., that encoded in the genotype, butthis will rarely be ever expressed. Further, there are atleast 500 enzymes and one has to decide as to whichenzymes would be the best indicators of soil quality(Schloter et al. 2003). Three enzymes viz., phospho-monoesterase, chitinase and phenol oxidase, as a groupreflect relative importance of bacteria and fungi, as wellas the nature of organic matter complex (Giai andBoerner 2007). Phosphomonoesterase (acid phospha-

Laishram et al.: Soil Quality and Health Int. J. Ecol. Environ. Sci.30
tase) activity is often correlated with microbial biomass(Clarholm 1993, Kandeler and Eder 1993), fungalhyphal length (Haussling and Marschner 1989) andnitrogen mineralization (Decker et al. 1999). Chitinaseis a bacterial enzyme which converts chitin, a substanceintermediate in its resistance to microbial metabolismproduced by fungi and arthropods, into carbohydratesand inorganic nitrogen (Hanzlikova and Jandera 1993).Phenol oxidase is produced primarily by white rot fungi,and is specific for highly recalcitrant organic matter,such as lignin (Carlisle and Watkinson 1994).
Soil Microbiological Degradation Index (MDI)
Computation of this index involves : (i) selection ofappropriate parameters, e.g., total organic carbon, watersoluble carbon, water soluble carbohydrates, microbialbiomass carbon, respiration, ATP, dehydrogenase,urease, protease, phosphatase and beta-glucosidaseacitivity estimated by methods given in Brink et al.(1960), Vance et al. (1987), Garcia et al. (1997),Kandeler and Gerber (1988), Nannipieri et al. (1980)and Tabatabai and Bremmer (1969) as detailed inBastida et al. (2006), (ii) transformation and weightingof values and (iii) combining the scores into an index.Factor analysis can be used to identify the mostimportant parameters. As absolute values of someparameters are bigger than those of others, the values ofthe selected parameters are normalized (Glover et al.2000). The MDI is the sum of the normalized andweighted values of the most important parameters.
General Indicator of Soil Quality (GISQ)
Soil organisms and biotic parameters (e.g., abundance,diversity, food web structure, or community stability)meet most of the desired criteria of soil qualityindicators (Doran and Zeiss 2000). According toSchloter et al. (2003), the use of faunal groups asindicators for soil quality needs a choice of organisms,that (a) form a dominant group and occur in all soiltypes, (b) have high abundance and high biodiversity and(c) play an important role in soil functioning, e.g., foodwebs. Velasquez et al. (2007) developed a generalindicator of soil quality (GISQ) based on estimation ofaround 50 soil properties related to macrofauna,chemical fertility, physical state, organic matter fractionsand soil morphology. The computational procedureinvolved four steps: (i) PCA analysis of the variablesallowing testing of the significance of their variation
among land use types; (ii) identification of the variablesthat best differentiate the sites according to the soilquality; (iii) creation of sub-indicators of soil physicalquality, chemical fertility, organic matter, morphologyand soil macrofauna, with values ranging from 0.1 to1.0; (iv) combination of all five subindicators into ageneral one. This indicator allows the evaluation of soilquality and facilitates identification of problem areasthrough the individual values of each subindicator(Velasquez et al. 2007).
A faunal group, such as nematodes, is likely to beeffective indicator of soil quality if it is dominant andoccurs in all soil types, has high abundance and highbiodiversity and plays an important role in soilfunctioning, e.g., in food webs. Some indicators providelimited interpretations of soil quality, e.g., soil enzymeassays generally provide a measure of the potentialactivity which is rarely expressed. Based on a 6-yeartrial of soil quality monitoring in New Zealand, Sparlinget al. (2004) did not find utility of earthworms as ameasure of soil quality because of difficulty inephemeral nature of such biological measurements andthe difficulty in justifying their target ranges.
QBS (Qualita Biologica del Suolo) Index
The methods of characterizing soil quality based onmicrofauna fall in two groups: those based on generalevaluations of microarthropods (Parisi 2001) and thosebased on the evaluation of a single taxon (Bernini et al.1995, Paoletti and Hassal 1999, Parisi 2001). Difficultiesin classification of organisms at species level has amajor constraint delimiting use of indicators based onsoil organisms, more so the microfauna. A collembolaexpert is expected to analyse 5 samples a day and anematode expert two samples a day (Ekscmitt et al.2003). As a means of overcoming this constraint, Parisiet al. (2005) proposed the QBS (Qualita Biologica delSuolo, meaning biological quality of soil) index valuesbased on evaluation of microarthropods’ level ofadaptation to the soil environment life rather than thespecies richness/diversity. Reduction or loss of pigmen-tation and visual apparatus, streamlined body form, withreduced and more compact appendages, reduction or lossof flying, jumping or running adaptations and reducedwater retention capacity (e.g., by having thinner cuticleand lack of hydrophobic compounds) are some of theadaptations of microarthropods to soil environment(Parisi 1974). Thus, instead of identifying organisms byspecies, distinguishes the morphotypes varying in terms

38: 19-37 Laishram et al.: Soil Quality and Health 31
of their degree of adaptation to soil quantified as eco-morphological score. As a general rule, eu-edaphic (i.e.,deep soil-living) forms get a score of 20, epi-edaphicforms (surface living forms) of 1. Groups like Proturaand Diplura have a single value of 20, because allspecies belonging to these groups show a similar level ofadaptation to soil (Parisi et al. 2005).
Vegetation Attributes as a Surrogate to the Soil Quality
Another alternative to reduce the cost and time involvedin sampling and classifying soil organisms is to find out(i) environmental parameters which are expected toregulate soil fauna composition, e.g., climate, soil andvegetation characteristics and (ii) measures inherent tosoil fauna community itself, such as higher taxon rich-ness, indicator taxa and maximum dominance. Ekschmittet al. (2003) found that environmental variables couldexplain only 34-60% of the variance in soil animalrichness, while the remaining variation remainedunexplained. Coefficient of variation of soil animalrichness between replicate samples was as high as 60%in many cases indicating a high degree of independenceof richness from environmental condi-tions. The poorcorrelation between soil animal community and environ-mental factors could be explained as due to significantinfluence of autogeneous dynamics of the populationunder consideration, interaction of this population withpredators, parasites and competitors and by presentlyindiscernible past conditions (Salt and Hollick 1946).Ekschmitt et al. (2003) concluded that a rough guess ofsoil faunal diversity can be cost-effectively derived fromenviron-mental data while an estimate of moderatequality can be obtained with reduced taxonomic efforts.Gillison et al. (2003) found highly significant positivecorrelations between species richness of all termites andmean canopy height, woody plant basal area, ratio ofplant richness to plant functional types, while there wasno significant correlation between individual plant andtermite species.
Soil Fertility, Land Quality and Farm LevelEnvironmental Indicators
Land quality indicators represent generic directives forthe functional role of land, indicating condition andcapacity of land, including its soil, weather and biolo-gical properties, for purposes of production, conser-vation and environmental management (Parisi et al.
2005). Land quality indices integrate factors andprocesses that determine land quality (Bindraban et al.2000). A soil test is a chemical method for estimatingthe nutrient-supplying capacity of a soil and has an edgefor biological methods of evaluating soil fertility in thatit can be done rapidly and before the crop is planted(Tisdale et al. 1985). Soil quality thus could be viewedas a component of land quality and the most useful soilor land quality index is the one that is able to provideearly warning of adverse trends and to identify problemareas. Dumanski and Pieri (2000) have listed four keycharacteristics of land quality indicators: (i) measurablein space, i.e., over the landscape and in all countries (ii)reflect change over recognizable time periods (5-10years) (iii) showing relationships with independentvariables (iv) quantifiable and usually dimensionless.Further, practical utility of an indicator derives from costeffectiveness and precision of its measurement andavailability of an interpretative framework to translate itin terms of identifying sustainable management practices(Carter et al. 1999, Sparling and Schipper 2002, Sparlinget al. 2004). Bindraban et al. (2000) elaborated twokinds of land quality indicators: (i) the yield gapindicator which is a measure of the difference betweenyields under optimum management conditions, i.e.,potential yields determined by absorbed photosyntheticradiation under adequate supply of water and nutrientsand crop protection, and actual yields of the ‘mostsuitable crop’ (Monteith 1990) (ii) soil nutrient balanceindicator which measures the rate with which soilfertility changes which are estimated as net differencesbetween nutrient inputs (mineral fertilizer, organicfertilizer, wet and dry deposition, nitrogen fixation andsedimentation) and outputs (crop products, cropresidues, leaching, gaseous losses and soil erosionintegrated over a certain area and time (Stoorvogel andSmaling 1990).
Classical soil fertility rating is a function of thecrop response to added nutrients and fertilizersrecommendations are primarily based on expectedfinancial returns from the crop from applied nutrientsrather than an integrated consideration of the costs andbenefits of the outcomes of fertilizer addition, e.g., ofenvironmental cost associated with leaching andvolatilization of added fertilizers (Smaling et al. 1999,Oenema et al. 2003). Janssen (1999) gave the conceptsof target soil fertility (also referred as ideal soil fertilityby Janssen and de Willigen (2006) and target soilfertility (Table 8).

Laishram et al.: Soil Quality and Health Int. J. Ecol. Environ. Sci.32
Table 8. Concepts related to soil fertility of agricultural systems
Target soil fertility
(also referred as ideal soil fertility) Fertility at which the soil is characterized by neutral nutrient balances
Saturated soil fertility Fertility at which the soil by itself does exactly satisfy the nutrient demand of a crop
producing the target yield, provided no nutrients get lost.
Equilibrium fertilization or replacement input Nutrients in the harvested component of the crop producing target yield, which is the
maximum possible yield or potential yield, as determined by the genetic properties of
the crop cultivar, irradiance and temperature (van Ittersum and Rabbinge 1997).
Uptake efficiency of added nutrients/
Recovery Fraction (Nutrient in stover + grains derived from the input) / (Input)
Physiological efficeincy Yield of grains/uptake in grain and stover
Agronomic efficiency Recovery Fraction x Physiological Efficiency,
i.e., the yield increment per unit of added nutrients
Janssen and de Willigen (2006) presented IdealSoil Fertility-Saturated Soil Fertility framework integ-rating the concepts of plant physiology, agronomy andsoil chemistry, that explicitly takes sustainable soilfertility, environmental protection and balanced plantnutrition as starting points unlike most existing fertilizerrecommen-dations based on the economics of fertilizeruse. While we have accumulated significant knowledgeabout soil fertility targets required for obtaining highcrop yields (Roberts and Morton 1999, Clarke et al.1986), there is scant knowledge on target rangesrequired for avoiding off-site environmental impactssuch as eutrophication of water bodies. Soil macro-porosity below 10% (v/v) is reported to decrease pastureproduction but if this threshold is true for other land usesis not known in New Zealand (Sparling et al. 2004).
Green accounts or input-output accounts are basedon a set of indicators to express the degree of environ-mental impact from a farm based on the use externalinputs in relation to the production and/or use of specificmanagement practices (Goodlass et al. 2001). Increasinginterest in such accounts as farm level environmentalindicators seem to derive from a hypothesis that suchvoluntary systems for environmental improvement offarms may supplement mandatory regulation and thosefarmers by benchmarking against each other using theindicators will increase their awareness of possibleenvironmental improvements. Halberg (1998) distin-guished control indicators (those based on farmers’management practices) and state indicators (those basedon recordings of consequences for the farming system).van der Werf and Petit (2002) distinguished means-based versus effect-based farm level environmental
indicators and argued that means-based indicators werenot likely to be effective in promoting positive changesin farming practices like organic farming or integratedfarming that have been defined a priori as sustainable.
CONCLUSIONS
Although many indicators and indices of soil quality andsoil health have been proposed (Table 9), a globallyacceptable and applicable definition and methodology ofassessment of soil quality or soil health are still not inplace. Further, the existing knowledge provides a betterunderstanding of the current capacity of a soil to func-tion than of making predictions about capacity of the soilto continue to function under a range of stresses anddisturbances. Another limitation of most of the availablestudies is that efforts have been made to measure soilcharacteristics in surface soil and not in the wholeprofile (Sparling et al. 2004). While simultaneousanalysis of physical, chemical and biological charac-teristics of soil is required to evaluate sustainability/unsustainability of different management practices, moststudies in developing countries have looked at physicaland chemical characteristics only.
REFERENCES
Abawi, G.S. and Widmer, T.L. 2000. Impact of soil health
management practices on soil borne pathogens, nematodes
and root diseases of vegetable crops. Applied Soil Ecology 15:
37-47.
38: 19-37 Laishram et al.: Soil Quality and Health 33
Anderson, T. 2003. Microbial eco-physiological indicators to assess
soil quality. Agriculture Ecosystems and Environment 98:
285-293.
Andrews, S.S. and Caroll, C.R. 2001. Designing a decision tool for
sustainable agroecosystem management: soil quality assess-
ment of a poultry litter management case study. Ecological
Applications 11: 1573-1585.
Andrews, S.S.; Karlen, D.L. and Mitchell, J.P. 2002. A comparison
of soil quality indexing methods for vegetable production
systems in Northern California. Agriculture, Ecosystems and
Environment 90: 25-45.
Andrews, S.S.; Karlen, D.L. and Cambardella, C.A. 2004. The soil
management assement framework: A quantitative soil quality
evaluation method. Soil Science Society of America Journal
68: 1945-1962.
Arshad, M.A. and Coen, G.M. 1992. Characterization of soil quality:
Physical and chemical criteria. American Journal of
Alternative Agriculture 7: 25-32.
Arshad, M.A. and Martin, S. 2002. Identifying critical limits for soil
quality indicators in agroecosystems. Agriculture, Ecosystems
and Environment 88: 153-160.
Bachmann, G. and Kinzel, H. 1992. Physioloigcal and ecological
aspects of the interactions between palnt roots and rhizopshere
soil. Soil Biology and Biochemistry 24: 543-552.
Baker, K.F. and Cook, R.J. 1974. Biological Control of Plant
Pathogens. American Phytopathology Society, San Franscico,
433 pages.
Bastida, F.; Moreno, J.L.; Hernandez, T. and Garcia, C. 2006.
Microbiological degradation index of soils in a smiarid
climate. Soil Biology and Biochemistry 38: 3463-3473.
Beck, T. 1984. Methods and application of soil microbiological
analysis at the Landesanstalt fur Bodenkultur and Pfanzenbau
(LBB) in Munich for the determination of some aspects of soil
fertility. Pages 13-20, In: Nemes, M.P.; Kiss, S.; Papacostea,
P.; Stefanic, C. and Rusan, M. (Editors) Fifth Symposium on
Soil Biology, Romanian National Society of Soil Science,
Bucharest.
Bernini, F.; Avanzati, A.M.; Baratti, M. and Migliorini, M. 1995.
Oribatid mites (Acari Oribatida) of the Farma Valley
(Southern Tuscany). Notulae Oribatologicae LXV. Redia
LXXVII(1): 45-129.
Bindraban, P.S.; Stoorvogel, J.J;, Jansen, D.M.; Vlaming, J. and
Groot, J.J.R. 2000. Land quality indicators for sustainable land
management: proposed method for yield gap and soil nutrient
balance. Agriculture, Ecosystems and Environment 81: 103-
112.
Blair, G.J.; Lefroy, R.D.B. and Lisle, L. 1995. Soil carbon fractions
based on their degree of oxidation and the development of a
carbon management index for agricultural systems. Australian
Journal of Agricultural Research 46: 1459-1466.
Breland, T.A. and Eltun, R. 1999. Soil microbial biomass and
mineralization of carbon and nitrogen in ecological, integrated
and conventional forage and arable cropping systems. Biology
and Fertility of Soils 30: 193-201.
Brink, R.H., Dubar, P. and Linch, D.L. 1960. Measurement of
carbohydrates in soil hydrolysates with anthrone. Soil Science
89: 157-166.
Carlisle, M.J. and Watkinson, S.C. 1994. The Fungi. Academic Press,
New York. 482pages.
Carter, M.R.; Gregorich, E.G.; Anderson, J.W.; Doran, J.W.; Janzen,
H.H. and Pierce, F.J. 1997. Concepts of soil quality and their
significance. Pages 1-19, In: Gregorich, E.G. and Carter, M.R.
(Editors), Soil Quality for Crop Production and Ecosystem
Health. Elsevier, Amsterdam, Netherlands.
Carter, M.R.; Gregorich, E.G.; Angers, D.A.; Beare, M.H.; Sparling
G.P.; Wardle, D.A. and Voroney, R.P. 1999. Interpretation of
microbial biomass measurements for soil quality assessment in
humid temperate regions. Canadian Journal of Soil Science 79:
507-520.
Clarholm, M. 1993. Microbial biomass P, Labile P, and acid
phosphatase activity in the humus layer of a spruce forest, after
repeated additions of fertilizer. Biology and Fertility of Soils
8: 1281-1233.
Clarke, C.J.; Smith, G.S.; Prasad, M. and Cornforth, I.S. 1986.
Fertliser Recommendations for Horticultural Crops. Ministry
of Agriculture and Fisheries, Wellington, New Zealand. 70
pages.
Collard, S.J. and Zammit, C. 2006. Effects of land-use intensification
on soil carbon and ecosystem services in Brigalow (Acacia
harpophylla) landscapes of southeast Queensland, Australia.
Agriculture, Ecosystems and Environment 117: 185-194.
Costanza, R.; Norton, B.G. and Haskell, B.D. 1992a. Ecosystem
Health: New Goals for Environmental Management. Island
Press, Washington, DC., USA.
Costanza, R.; Funtowicz, S.O. and Ravetz, J.R. 1992b. Assessing and
communicating data quality in policy relevant research.
Environmental Management 16: 121-131.
Dalal, R.C. and Mayer, D.G. 1986. Long-term trends in fertility of
soils under continuous cultivation and cereal cropping in
southern Queensland. I. Overall changes in soil properties and
treands in winter cereal yields. Australian Journal of Soil
Research 24: 265-279.
Davidson, E.A. and Ackerman, L.L. 1993. Changes in soil carbon
inventories following cultivation of previously untilled soils.
Biogeochemistry 20: 161-193.
Decker, K.L.M.; Boener, R.E.J. and Morris, S.J. 1999. Scale-
dependent patterns of soil enzyme activity in a forested
landscape. Canadian Journal of Forest Research 29: 232-241.
de la Paz-Jimenez, M.; de al Horra, A.M.; Pruzzo, L. and Palma,
R.M. 2002. Soil quality: a new index based on microbiological
and biochemical parameters. Biology and Fertility of Soils 35:
302-306.
Dilly, O. and Blume, H.P. 1998. indicators to assess sustainable land
use with reference to soil microbiology. Advances in Geo-
Ecology 31: 29-39.
Dilly, O. and Munch, J.C. 1998. Ratios between estimates of
microbial biomass content and microbial activity in soils.
Biology and Fertility of Soils 27: 374-379.
Doll, E.C. 1964. Lime for Michigan Soils. Michigan Agriculture
Experimental Station Extension Bulletin 471. 6 pages.
Doran, J.W. 2002. Soil health and global sustainability: translating
science into practice. Agriculture, Ecosystems and
Environment 88: 119-127.
Laishram et al.: Soil Quality and Health Int. J. Ecol. Environ. Sci.34
Doran, J.W.; Liebig, M.A. and Santana, D.P. 1998. Soil health and
global sustainability: In: Proceedings of the 16th World
Congress of Soil Science, Montepellier, France. Paper 1923.
Doran, J.W. and Parkin, T.B. 1994. Defining and assessing soil
quality. Pages 3-21, In: Doran, J.W.; Coleman, D.C;,
Bezdieck, D.F; and Stewart, B.A. (Editors), Defining Soil
Quality for a Sustainable Environment, SSSA Special
Publication No. 35. Soil Science Society of America,
Madison, WI, USA.
Doran, J.W. and Parkin, T.B. 1996. Quantative indicators of soil
quality: a minimum data set. Pages 25-37, In: Doran, J.W. and
Jones, A.J. (Editors), Methods for Assessing Soil Quality.
SSSA Special Publication No. 49, Soil Science Society of
America, Madison, WI, USA.
Doran, J.W.; Sarantonio, M. and Leibig, M. 1996. Soil health and
sustainability. Advances in Agronomy 56: 1-54.
Doran, J.W. and Zeiss, M.R. 2000. Soil health and sustainability;
managing the biotic component of soil quality. Applied Soil
Ecology 15: 2-11.
Dumanski, J. and Pieri, C. 2000. Land quality indicators: Research
plan. Agriculture, Ecosystems and Environment 81: 93-102.
Ekschmitt, E.; Stierhof, T.; Dauber, J.; Kreimes, K. and Wolters, V.
2003. On the quality of soil biodiversity indicators: abiotic
parameters as predictor of soil faunal richness at different
spatial scales. Agriculture, Ecosystems and Environment 98:
273-283.
Ellert, B.H. and Gregorich, E.G. 1996. Storage of Carbon, nitrogen
and phosphorus in cultivated and adjacent forested soils of
Ontario. Soil Science 161: 587-603.
Filip, Z. 2002. International approach to assessing soil quality by
ecologically-related biological parameters. Agriculture,
Ecosystems and Environment 88: 169-174.
Gajda, A.M.; Doran, J.W.; Wienhold, B.J,; Kettler, T.A.; Pikul, J.L.
and Cambardella, C.A. 2001. Soil quality evaluations of
alternative and conventional management systems in the Great
Plains. Pages 361-400, In: Lal, R.; Kimble, J.F.; Follett, R.F.
and Stewart, B.A. (Editors), Methods of Assessment of Soil
Carbon. CRC Press. Boca Raton, FL.
Garcia, C.; Hernandez, T. and Costa, F. 1994. Microbial activity in
soils under Mediterranean environmental conditions. Soil
Biology and Biochemistry 26: 1185-1191.
Garcia, C.; Rodan, A. and Hernandez., T. 1997. Changes in microbial
activity alter abandonment of cultivation in a semiarid Medi-
terranean environment. Journal of Environmental Quality 26:
285-291.
Gardner, R.H.; Cale, W.G. and O’Neill, R.V. 1982. Robust analysis
of aggregation error. Ecology 63: 771-779.
Giai, C. and Boerner, R.E.J. 2007. Effects of ecological restoration
on microbial activity, microbial functional diversity, and soil
organic matter in mixed-oak forests of southern Ohio, USA.
Applied Soil Ecology 35: 281-290.
Gillison, A.N.; Jones, D.T.; Susilo, F. and Bignell, D.E. 2003.
Vegetation indicates diversity of soil macroinvertebrates: a
case study with termites along a land-use intensification
gradient. Organisms, Diversity and Evolution 3: 111-126.
Gil-Sotres, F.; Trasar-Cepeda, C.; Leiros, M.C. and Seoane, S. 2005.
Different approaches to evaluating soil quality using bio-
chemical properties. Soil Biology and Biochemistry 37: 877-
887.
Glover, J.D.; Reganold, J.P. and Andrews, P.K. 2000. systematic
method for rating soil quality of conventional, organic and
integrated apple orchards in Washington State. Agriculture,
Ecosystems and Environment 80: 29-45.
Golchin, A.; Clarke, P.; Oades, J.M. and Skjemstad, J.O. 1995. The
effects of cultivation on the composition of organic matter and
structural stability of soils. Australian Journal of Soil Research
33: 975-993.
Goodlass, G.; Halberg, N.; Versschuur, G. and Hanegraff, M.N.C.
2001. Study on Input/Output Accounting Systems on EU
Agricutlural Holdings. Centre for Agriculture and Envi-
ronment, February 2003. http://europa.eu.int/environment/
agriculture/pdf/input.output.pdf. (Accessed on 23 Februaryrd
2012).
Greenland, D.J.; Rimmer, D. and Quirk, J.P. 1975. Determination of
structural stability class of English and Welsh soils, using a
water coherence test. Journal of Soil Science 26: 294-303.
Gregorich, E.G.; Carter, M.R.; Angers, D.A.; Monreal, C.M. and
Ellert, B.H. 1994. Towards a minimum dataset to assess soil
organic matter quality in agricultural soils. Canadian Journal
of Soil Science 74: 367-385.
Haberern, J. 1992. Viewpoint: a soil health index. Journal of Soil
Water Conservation 47: 6.
Halberg, N. 1998. Characterizing high intensity livestock systems-
identifying indicators of resource use, environmental impact
and landscape quality. In: Willams, S. and Wright, I.A.
(editors), ELPEN: Proceedings from Two International Work-
shops. Macaulay Land Use Research Institute, Scotland, 119
pages. http://www.macaulay.ac.uk/elpen/index1.htm.
Hanzlikova, A. and Jandera, A. 1993. Chitinase and changes of
microbial community in soil. Folia Microbiologica 38: 159-
160.
Harris, R.F.; Karlen, D.L. and Mulla, D.J. 1996. A conceptual frame-
work for assessment and management of soil quality and
health. Pages 61-82, In: Doran, J.W. and Jones, A.L. (Editors),
Methods for Assessing Soil Quality. SSSA Special Publication
no.49, American Society of Agronomy and Soil Science
Society of America, Madison, WI, USA.
Hart, P.B.S.; Sparling, G.P. and Kings, J.A. 1986. Relationship
between mineralisable nitrogen and microbial biomass in a
range of plant litters, peats, and soils of moderate to low pH.
New Zealand Journal of Agriculture Research 29: 681-686.
Haussling, M. and Marschner, H. 1989. Organic and inorganic soil
phosphates and acid phosphatase activity in the rhizosphere of
80-year-old Norway spruce (Picea abies (L.) Karst.) trees.
Biology and Fertility of Soils 8: 128-133.
IPCC. 1997. Intergovernmental panel on climate change guidelines
for national greenhouse gas inventories. In: Agriculture:
Nitrous Oxide from Agricultural Soils and Manure
Management. OECD, Paris.
Janssen, B.H. and de Willigen, P. 2006. Ideal and saturated soil
fertility as bench marks in nutrient management. II.
Interpretation of chemical soil tests in relation to ideal and
saturated soil fertility. Agriculture, Ecosystems and
Environment 116: 147-155.

38: 19-37 Laishram et al.: Soil Quality and Health 35
Janssen, B.H. and de Willigen, P. 2006. Ideal and saturated soil
fertility as bench marks in nutrient management. 1. Outline of
the framework. Agriculture, Ecosystems and Environment
116: 132-146.
Janvier, C.; Villeneuve, F.; Alabouvette, C.; Edel-Hermann, V.;
Mateille, T. and Steinberg, C. 2007. Soil health through soil
disease suppression: which strategy from descriptors to
indicators. Soil Biology and Biochemistry 39: 1-23.
Janzen, H.H.; Campbell, C.A.; Brandt, S.A.; Lafond, G.P. and
Townley-Smith, L. 1992. Light-fraction organic matter in soils
from lang-term crop rotations. Soil Science Society of
America Journal 56: 1799-1806.
Jeffries, P.; Gianinazzi, S. and Perotto, S. 2003. The contribution of
arbuscular mycorrhizal fungi in sustainable maintenance of
plant health and soil fertility. Biology and Fertility of Soils 37:
1-16.
Jongman, R.H.G.; ter Braak, C.J.F. and van Tongeren, O.F.R. 1995.
Data Analysis in Community and Landscape Ecology.
Cambridge University Press, Cambridge, UK. 324 pages.
Kaiser, H.F. 1960. The application of electronic computers to factor
analysis. Educational and Psychological Measurement 29:
141-151.
Kandeler, E. and Eder, G. 1993. Effect of cattle slurry in grassland on
microbial biomass and on activities of various enzymes.
Biology and Fertility of Soils 16: 249-254.
Kandeler, E. and Gerber, H. 1988. Short-term assay of soil urease
activity using colorimetric determination of ammonium.
Biology and Fertility of Soils 6: 68-72.
Kang, G.S.; Beri, V.; Sidhu, B.S. and Rupela, O.P. 2005. A new
index to assess soil quality and sustainalibty of wheat based
cropping systems. Biology and Fertility of Soils 41: 389-398.
Kapkiyai, J.J.; Karanja, N.K.; Qureshi, J.N.; Smithson, P.C. and
Woomer, P.L. 1999. Soil organic matter and nutrient dynamics
in a Kenyan nitisol under long-term fertilizer and organic input
management. Soil Biology and Biochemistry 31(13): 1773-
1782.
Karlen, D.L.; Gardner, J.C. and Rosek, M.J. 1998. A soil quality
framework for evaluating the impact of CRP. Journal of
Production Agriculture 11: 56-60.
Karlen, D.L.; Mausbach, M.J.; Doran, J.W.; Cline, R.G.; Harris, R.F.
and Schuman, G.E. 1997. Soil quality: A concept, definition
and framework for evaluation. Soil Science Society of
America Journal 61: 4-10.
Karlen, D.L. and Stott, D.E. 1994. A framework for evaluating
physical and chemical indicators of soil quality. Pages 53-72,
In: Doran, J.W.; Coleman, D.C.; Bezdicek, D.F. and Stewart,
B.A. (Editors) Defining Soil Quality for a Sustainable
Environment. SSSA Special Publication no.35, Soil Science
Society of America, Madison, WI.
Karlen, D.L.; Wollenhaupt, N.C.; Erbach, D.C.; Berry, E.C.; Swan,
J.B.; Eash, N.S. and Jordahl, J.L. 1994. Crop residue effects
on soil quality following 10-years of no-till corn. Soil and
Tillage Research 31: 149-167.
Kelting, D.L.; Burger, J.A.; Patternson, S.C.; Aust, W.M.; Miwa, M.
and Trettin, C.C. 1999. Soil Quality management in
domesticated forest- a southern pine example. Forest Ecology
and Management 122: 167-185.
Khan, M.A. and Nortclif, S. 1982. Variability of selected micro-
nutrients in a single soil series in Berkshire, England. Journal
of Soil Science 33: 763-777.
Kirschbaum, M.U.F.; Murty, D.; McGilvray, H. and McMurtrie, R.E.
2000. How does soil organic carbon change after conversion
from forests to agricultural land uses? Climate Change
Newsletter, Bureau of Resource Science 12: 5-7.
Klein, D.A. and Paschke, M.W. 2000. A soil microbial community
structural – funcitonal index: the microscopy-based total
/active/active fungal/bacterial (TA/AFB) biovolumes ratio.
Applied Soil Ecology 14: 257-268.
Knops, J.M.H. and Tilman, D. 2000. Dynamics of soil nitrogen and
carbon accumulation for 61 years after agricultural
abandonment. Ecology 81: 88-98.
Komatsuzaki, M. and Ohta, H. 2007. Soil management practices for
sustainable agro-ecosystems. Sustainability Science 2: 103-
120.
Lal, R. 2004. Soil carbon sequestration impacts on global climate
change and food security. Science 304: 1623-1627.
Larson, W.E. and Pierce, F.J. 1991. Conservation and enhancement
of soil quality. Evalution of sustainable land management in
the developing world. International Board for Soil Research
and Management, Bangkok, Thailand. Xxx Pages.
Lemenih, M.; Kaltun, E. and Olsson, M. 2005. Assessing soil
chemical and physical property responses to deforestation and
subsequent cultivation in smallholders farming system in
Ethiopia. Agriculture, Ecosystems and Environment 105: 373-
386.
Loveland, P. and Webb, J. 2003. Is there a critical level of organic
matter in the agricultural soils of temperate regions: a review.
Soil and Tillage Research 70: 1-18.
Magdoff, F. 1998. Building Soils for Better Crops. University of
Nebraska Press, Lincoln, Nebraska. 128 pages.
Mann, L.K. 1986. Changes in soil carbon storage after cultivation.
Soil Science 142: 279-288.
Martens, R. 1995. Current methods for measuring microbial biomass
C in soil: potentials ad limitations. Biology and Fertility of
Soils 19: 87-99.
Martin, S.; Baize, D.; Bonneau, M.; Chaussod, R.; Gaultier, J.P.;
Lavelle, P.; Legros, J.P.; Lepretre, A. and Sterckeman, T.
1998. The French national soil quality observatory. Page 1010,
In: Proceedings of the 16 World Congress on Soil Science,th
Symposium 25, Montpellier, France.
Masto, R.E.; Chhonkar, P.K.; Singh, D. and Patra, A.K. 2007. Soil
quality response to long-term nutrient and crop management
on a semi-arid inceptisol. Agriculture, Ecosystems and
Environment 118: 130-142.
Monteith, J.L. 1990. Conservative behaviour in the response of crops
to water and light. Pages 3-16, In: Rabbinge, R.; Goudrian, J.;
Van Keulen, H.; Penning de Vries, F.W.T. and van Laar, H.H.
(Editors), Theoretical Production Ecology. Reflections and
Prospects. Simulation Monograph 34, Pudoc, Wageningen.
Murty, D.; Kirschbaum, U.F.; McMurtie, R.E. and McGilvray, H.
2002. Does conversion of forest to agricultural land change
soil carbon and nitrogen? A review of the literature. Global
Change Biology 8: 105-123.
Laishram et al.: Soil Quality and Health Int. J. Ecol. Environ. Sci.36
Nannipieri, P.; Cecanti, B.; Ceverli, S. and Matarese, E. 1980.
Extraction of phosphate, urease, protease organic carbon and
nitrogen from sool. Soil Science Society of America Journal
44: 1011-1016.
Nannipieri, P.; Grego, S. and Cecanti, B. 1990. Ecological
significance of the biological activity in soils. Pages 293-355,
In: Bollag, J.M. and Stotzky, G. (Editors), Soil Biochemistry.
Marcel Dekker, New York.
Nortcliff, S. 2002. Standardisation of soil quality attributes.
Agriculture, Ecosystems and Environment 88: 161-168.
Oenema, O.; Kros, H. and de Vries, W. 2003. Approaches and
uncertainties in nutrient budgets. Implications for nutrient
management and environmental policies. European Journal of
Agronomy 20: 3-16.
Oldeman, L.; van Engelen, V. and Pulles, J. (Editors). 1990. The
Extent of Human-Induced Soil Degradation. International Soil
Reference and Information Center, Wageningen, Netherlands,
21 pages.
Paoletti, M.G. and Hassal, M. 1999 Woodlice (Isopoda: Oniscidea):
their potential for assessing sustainbilty and use as bio-
indicators. Agriculture, Ecosystems and Environment 74: 157-
165.
Parisi, V. 2001. The biological soil quality, a method based on
microarthropods. Acta Naturalia de L’Ateneo Parmense 37:
97-106 (in Italian).
Parisi, V. 1974. Soil Biology and Ecology, Techniques of
Researches. Boringhieri, Torino (in Italian).
Parisi, V.; Menta, C.; Gardi, C.; Jacomini, C. and Mozzanica, E.
2005. Microarthropod communities as a tool to assess soil
quality and biodiversity: a new approach in Italy. Agriculture,
Ecosystems and Environment 105: 323-333.
Parkin, T.B. 1993. Spatial variability of microbial processes in soil.
Journal of Environmental Quality 22: 409-417.
Parr, J.F.; Papendick, R.I.; Hornick, S.B. and Meyer, R.E. 1992. Soil
quality: attributes and relationship to alternative and
sustainable agriculture. American Journal of Alternative
Agriculture 7: 5-11.
Powlson, D.S. 1994. The soil microbial biomass: Before, beyond and
back. Pages 3-20, In: Ritz, K.; Dighton, J. and Giller, K.E.
(Editors). Beyond the Biomass: Composition and Functional
Analysis of Soil Microbial Communities. John Wiley,
Chichester, UK.
Powlson, D.S.; Brookes, P.C. and Christensen, B.T. 1987. Measure-
ment of soil microbial biomass provides an early indication of
changes in total soil organic matter due to straw incorporation.
Soil Biology and Biochemistry 19: 159-164.
Prasad, R.; Tiwari, K.N. and Biswas, B.C. 2003. Students Guide to
Fertilizers and their Efficient Use in India. Potash &
Phosphate Institute of Candad-India Programme, Gurgaon,
India. 133 pages.
Puglisi, E.; Nicelli, M.; Capri, E.; Trevisan, M. and Attilo, A.M.
2005. A soil alteration index based on phospholipids fatty
acids. Chemosphere 61: 1548-1577.
Roberts, A.H.C. and Morton, J.D. 1999. Fertilizer Use on New
Zealand Dairy Farms. New Zealand Fertiliser Manufacturers
Association, Auckland, New Zealand, 37pages.
Robinson J.S. and Sharpley A.N. 1995. Release of nitrogen and
phosphorus form poultry litter. Journal of Environmental
Quality 24(1): 62-67.
Romig, D.E.; Garlynd, M.J.; Harris, R.F. and McSweeney, K. 1995.
How farmers assess soil health and quality. Journal of Soil
Water Conservation 50: 229-236.
Ross, M.A. and Lembi, C.A. 1985. Applied Weed Science,
Macmillan, New York, USA.
Salt, G. and Hollick, F.S.J. 1946. Studies of wireworm populations,
II. Spatial distribution. The Journal of Experimental Biology
23: 1-46.
Sangha, K.K.; Midmore, D.J.; Rolfe, J. and Jalota, R.K. 2005. 2005.
Tradeoffs between pasture production and plant diversity and
soil health attributes of pasture systems of central Queensland.
Agriculture, Ecosystems and Environment 111: 93-103.
Schloter, M.; Dilly, O. and Munch, J.C. 2003. Indicators for
evaluating soil quality. Agriculture, Ecosystems and
Environment 98: 255-262.
Sharpley A.N. and Smith S.J. 1995. Nitrogen and phosphorus forms
in soils receiving manure. Soil Science 159: 253-258.
Singer, M.J. and Ewing, S.A. 1998. Soil quality. Pages G271-G278,
In: Summer, M.E. (Editor) Handbook of Soil Science. CRC
Press, Boca Raton, FL.
Smaling, E.M.A.; Oenema, O. and Fresco, L.O. 1999. Nutrient
Disequilibria in Agroecosystems: Concepts and Case Studies.
CABI, Cambridge, UK. 336 pages.
Sojka, R.E. and Upchurch, D.R. 1999. Reservations regarding the
soil quality concept. Soil Science Society of America Journal
63(5): 1039-1054.
Spaccini, R.; Zena, A.; Igwe, C.A.; Mbagwu, J.S.C. and Piccolo, A.
2001. Carbohydrates in water-stable aggregates and particle
size fractions of forested and cultivated soils in two
contrasting tropical ecosystems. Biogeochemistry 53: 1-22.
Sparling, G.P. and Schipper, L.A. 2002. Soil quality at a national
scale in New Zealand, Journal of Environmental Quality 31:
1848-1857.
Sparling, G.P.; Schipper, L.A.; Bettjeman, W. and Hill, R. 2004. Soil
quality monitoring in New Zealand: practical lessons from a 6-
year trial. Agriculture, Ecosystems and Environment 104: 523-
534.
Stefanic, F.; Ellade, G. and Chirnageanu, J. 1984. Researches
concerning a biological index of soil fertility. Pages 33-45, In:
Nemes, M.P.; Kiss, S.; Papacostea, P.; Stefanic, C. and Rusan,
M. (Editors) Fifth Symposium on Soil Biology. Romanian
National Society of Soil Science, Bucharest.
Stevenson, F.J. 1972. Organic matter reactions involving herbicides
in soil. Journal of Environmental Quality 1(4): 333-343.
Stockdale, E.A. and Rees, R.M. 1994. Relationship between biomass
nitrogen and nitrogen extracted by other nitrogen availability
methods. Soil Biology and Biochemistry 26: 1213-1220.
Stoorvogel, J.J. and Smaling, E.M.A. 1990. Assessment of Soil
Nutrient Depletion in Sub-Sahara Africa: 1983-2000. 4
volumes. Report 28, The Winand Starring Centre for
Integrated Land, Soil and Water Research, Wageningen, The
Netherlands.
Tabatabai, M.A. and Bremmner, J.M. 1969. Use of p-nitorphenyl
phosphate for assy of soil phosphatase activity. Soil Biology
and Biochemistry 1: 301-307.
38: 19-37 Laishram et al.: Soil Quality and Health 37
Tisdale, S.L.; Nelson, W.L. and Beaton, J.D. 1985. Soil Fertility and
Fertilizers. Macmillan Publising Company, New York, USA.
Trasar-Cepeda, C.; Leiros, C.; Gil-Stotres, F. and Seoane, S. 1998.
Towards a biochemical quality index for soils: an expression
relating several biological and biochemical properties. Biology
and Fertility of Soils 26: 100-106.
Vance, E.D.; Brookes, P.C. and Jenkinson, D. 1987. An extraction
method for measuring microbial biomass carbon. Soil Biology
and Biochemistry 19: 703-707.
van Burggen, A.H.C. and Semenov, A.M. 2000. In search of
biological indicators for soil health and disease suppression.
Applied Soil Ecology 15: 13-24.
van der Werf, H.M.G. and Petit, J. 2002. Evaluation of the environ-
mental impact of agriculture at the farm level: a comparison
and analysis of 12 indicator-based methods. Agriculture
Ecosystems and Environment 93: 131-145.
van Ittersum, M.K. and Rabbinge, R. 1997. Concepts in production
ecology for analysis and quantification of agricultural input-
output combinations. Field Crops Research 52: 197-208.
Velasquez, E.; Lavelle, P. and Andrade, M. 2007. GISQ, a
multifunctional indicator of soil quality. Soil Biology and
Biochemistry 39: 3066-3080.
Wander, M.M. and Bollero, G.A. 1999. Soil quality assessment of
tillage impacts in Illinois. Soil Science Society of America
Journal 63: 961-971.
Warrick, A.W. and Nielsen, D.R. 1980. Spatial variasbility of soil
physical properties. Pages 319-344, In: Hillel, D. (Editor),
Applications of Soil Physics. Academic Press, London, UK.
Received 3 February 2012;Accepted after Revision 6 March 2012