soil organic matter in restored rangelands following cessation of rainfed cropping in a mountainous...
TRANSCRIPT
ORIGINAL ARTICLE
Soil organic matter in restored rangelands followingcessation of rainfed cropping in a mountainous semi-aridlandscape
Soroosh Salek-Gilani • Fayez Raiesi •
Pejman Tahmasebi • Najmeh Ghorbani
Received: 5 August 2012 / Accepted: 28 September 2013 / Published online: 11 October 2013
� Springer Science+Business Media Dordrecht 2013
Abstract Agricultural abandonment is known to
influence plant cover composition and C inputs into
the soil with a consequence for changes in soil organic
matter (SOM) storage and dynamics in rangeland
ecosystems. This study was conducted on a chrono-
sequence of high altitude rangelands (1) cultivated
with rainfed wheat (CR0), (2) abandoned for 4 (AR4),
12 (AR12) and 45 (AR45) years and (3) uncultivated
(reference) rangelands (UR) with three replicates in
Zagros Mountains, Central Iran. We studied the
changes in the concentrations and stocks of bulk soil
organic carbon (OC), total N, particulate organic C
(POC) and N (PON), dissolved organic C (DOC),
microbial biomass C (MBC), and potentially miner-
alizable C (Min-C) at 0–0.15 and 0.15–0.3 m soil
depths. Results showed that the concentrations and
stocks of OC, N, and labile fractions increased with
the abandonment of agriculture at both soil sampling
depths. After 4–45 years of agricultural abandonment,
soil OC and N stocks increased logarithmically by
3.8–46 % and 2.8–32 % in the whole 0–0.3 m,
respectively. Although, the stocks of labile fractions
decreased slightly 4 years after agricultural abandon-
ment, there were considerable increases (logarithmic)
in these fractions after 12–45 years of abandonment
(POC, 65–148 %; PON, 68–147 %; DOC, 76–139 %;
MBC, 24–62 %). The study shows that rangelands
abandoned for 45 years contained lower soil OC and
N concentrations and stocks compared to uncultivated
rangelands, reflecting 45 years of abandonment would
not be sufficient for SOM to attain the level of
uncultivated rangelands. The present study provided
evidence that the rate of increases in POC and DOC
stocks was greater than that of OC and MBC stocks,
demonstrating POC and DOC fractions of total SOM
pool may be suitable and sensitive indicators for
detecting the effects of agricultural abandonment on
soil OC changes and storage in these restored semi-
arid rangelands. Soil bulk density decreased, while the
mean weight diameter (MWD) and aggregate ratio as
measures of aggregate stability increased consider-
ably within the abandoned rangelands with increasing
time of abandonment. Results from a multivariate
analysis suggested that soil variables such as bulk
density, OC, TN, DOC, POC, PON, MBC, MWD and
metabolic quotient (qCO2) were successful in sepa-
rating land uses. In brief, the abandonment of
agricultural activities in previously cultivated high
altitude rangelands can potentially lead to an increase
of total and labile SOM and also sequestration of C in
these semi-arid rangelands.
S. Salek-Gilani (&) � F. Raiesi � N. Ghorbani
Soil Science Department, Faculty of Agriculture,
Shahrekord University, P.O. Box 115, Shahrekord, Iran
e-mail: [email protected]
P. Tahmasebi
Range and Watershed Department, Faculty of Natural
Resources and Earth Science, Shahrekord University,
P.O. Box 115, Shahrekord, Iran
123
Nutr Cycl Agroecosyst (2013) 96:215–232
DOI 10.1007/s10705-013-9587-4
Keywords SOM storage � Labile C fractions �C sequestration � Rainfed cropping � High
altitude rangelands
Introduction
Understanding the storage and dynamics of soil
organic matter, especially in relation to changing land
use, is fundamental to evaluate the role of soil as a
carbon (C) source or sink (Bruce et al. 1999; Lal
2004). Agricultural practices following rangeland
conversion to cropland would lead to a decrease in C
stored in soils and a net release of C into the
atmosphere, which has strongly influenced the atmo-
spheric CO2 levels and global C balances over the last
centuries (Jinbo et al. 2007; Raiesi 2007; Lal 2008;
Qiu et al. 2012). Nevertheless, agricultural abandon-
ment and re-conversion of croplands to rangelands
might be an alternative practice and management for
restoring rangeland soil conditions and SOM (Post and
Kwon 2000; Templer et al. 2005; Hoshino et al. 2009;
Raiesi 2012a, b).
Land abandonment and subsequent cessation of
agricultural practices occurs worldwide, largely due to
the low soil productivity, the development of indus-
trialization and tourism, and the shortage of water as a
result of drought, particularly in arid and semi-arid
climates (Zhao et al. 2005; Raiesi 2012a, b). There is
evidence that the abandonment of agriculture in the
long-run and the subsequent recovery of natural
vegetation may return soil organic carbon (OC) and
nitrogen (N) storage to the pre-agricultural levels (Post
and Kwon 2000; Templer et al. 2005). Increases of
SOM following the abandonment of cultivation could
be attributed to increased plant productivity and
subsequently higher organic inputs into soil, and to
the formation of macro aggregates, resulting in lower
mineralization of labile SOM (Lopez-Bermudez et al.
1996; Rey Benayas et al. 2007; Hoshino et al. 2009;
Preger et al. 2010; Zhang et al. 2010; Raiesi 2012a, b).
Changes that occur in vegetation cover and environ-
mental conditions after land abandonment may have
an important effect on soil OC and N stocks, microbial
activity, biomass and diversity (Zhao et al. 2005; Rey
Benayas et al. 2007; Preger et al. 2010; Zhang et al.
2010; Raiesi 2012a, b).
Bulk soil OC is heterogeneous and contains labile
fractions with a rapid turnover rate as well as non-
labile fractions with a slower turnover rate (Cambard-
ella and Elliott 1993; Jastrow 1996; Leifeld and
Kogel-Knabner 2005; Zhang et al. 2007). The labile
fractions of soil OC consists of microbial biomass C
(MBC), dissolved organic C (DOC), particulate
organic C (POC) and mineralizable C (Min-C) that
respond rapidly to changes in C supply and to land use
changes, cultivation and abandonment (Jastrow 1996;
Lundquist et al. 1999; Zhang et al. 2006; 2007; Li et al.
2009a, b). These fractions have therefore been
suggested as early indicators of the effects of land
use changes and agricultural practices on SOM pool
and dynamics (Cambardella and Elliott 1993; Leifeld
and Kogel-Knabner 2005; Jinbo et al. 2007), and in
general on soil quality (Gregorich et al. 1994). There
has been an increasing interest in the importance of
labile C fractions as the indicator of changes in soil OC
storage and soil quality (Saggar et al. 2001).
Abandonment of agricultural fields in native range-
lands during the past five decades has been the main
interest for the restoration of rangeland soils in some
arid and semi-arid regions of the world. Agricultural
abandonment, especially rainfed cropping, in these
rangeland ecosystems occurs mainly due to low
rainfall and water shortage and subsequent low
income from rainfed cropping (Rey Benayas et al.
2007; Raiesi 2012a, b). Compared to the study of
effects on vegetation restoration and C storage and
dynamics caused by agricultural abandonment at low
to medium altitude rangelands in arid and semi-arid
regions, few studies have focused on the abandonment
of agriculture in high altitude rangelands of arid and
semi-arid regions of the world (i.e., Raiesi 2012a, b).
This work was designed to test how the agricultural
abandonment in mountainous semi-arid rangelands
affects soil properties and vegetation establishment.
Such information may be useful to assess the resil-
ience of soils and to determine the appropriate time for
soil recovery. The objectives of the present study were
to investigate (1) the effects of different times of
rainfed cropping abandonment on the living plant
above-ground biomass and vegetation restoration, (2)
the effect of natural vegetation recovery on OC, N and
labile C fractions (i.e., DOC, POC, MBC, mineraliz-
able C) along a secondary plant succession, (3) the
most sensitive labile C fractions for detecting changes
in soil total OC following the abandonment of
cultivation and (4) the consequence of changes in
SOM for C sequestration in high altitude rangeland
216 Nutr Cycl Agroecosyst (2013) 96:215–232
123
soils along a chronosequence of cultivation abandon-
ment. To achieve these objectives, we measured bulk
soil OC, N, DOC, POC, MBC and Min-C levels in a
chronosequence of abandoned rangelands in a moun-
tainous semi-arid area of Central Iran.
Materials and methods
Research area
The research area is located in semi-steppe rangelands
of Karsanak region in Chaharmahal and Bakhtiari
Province, Central Iran. The study area (580 ha) is
located about 60 km northwest of Shahrekord city, at
approximately 32� 310 N and 50� 280 E at an altitude of
around 2,574 m above sea level. The climate of the
region is semi-arid with annual mean precipitation of
420 mm, most of which falls during winter and spring.
The annual average temperature is 12 �C with the
average minimum of 1.8 �C and the average maxi-
mum of 21 �C. In general, the soil of the study area is a
silty loam Typic Haploxerept. In the area, landscapes
are mosaic of native grazing (uncultivated) rangelands
(consist of three major vegetation types including
Astragalus adscendense, Agropyron repense and
Bromus tomentelus–A. repense), cultivated and aban-
doned rangelands. Rainfed cropping systems, espe-
cially wheat (Triticum aestivum L.) in grazing
rangelands over the past were common and wheat
cultivation still is continuing at the present time. Over
the last five decades, land abandonment and subse-
quent cessation of agricultural activities occurred in
these rangeland ecosystems largely due to the low
productivity of wheat, the gradual immigration of
local farmers and most likely the shortage of water as a
result of recent droughts and low rainfall. We found
that, during 40 years, many lands of the research area
have been gradually converted to national lands by the
government and the government does not allow
farmers to cultivate and only part of the region was
allocated to agricultural lands. In the area, agricultural
abandonment has promoted woody plant encroach-
ment and expansion during the secondary succession
and thus dense perennial woody and non-woody
species (including shrubs, sub-shrubs, forbs and
legumes) are abundant. We selected those abandoned
and cultivated rangelands with well-known land use
history to assure similar soil conditions and properties
before abandonment and comparable cultivation prac-
tices after land abandonment. Based on data and
information on land use history and current manage-
ment practices obtained from local farmers and sheep
owners, historical records and aerial photos, we made
sure that all abandoned and cultivated rangelands
experienced similar tillage and cultivation practices
(conventional tillage) in the years prior to abandon-
ment time, and they were used for many decades
([100 years) as croplands. Five different land uses
were selected in a long-term chronosequence of
cultivated (CR), abandoned (AR) and uncultivated
(UR) rangelands. They consisted of (1) permanently
cultivated rangelands (CR0) with rainfed wheat crop-
ping with 1 year in cultivation followed by 1–2 years
in fallow, (2) rangelands abandoned for 3–4 years
(AR4), (3) rangelands abandoned for 10–12 years
(AR12), (4) rangeland abandoned for 30–45 years
(AR45) and (5) permanent rangelands uncultivated for
more than 100 years (UR100) as a reference site. The
maximum time of abandonment was considered for
each land use and data analysis. In selecting these land
uses, care was made for the consistency in topograph-
ical features. Soil texture in cultivated rangelands was
silt loam, while abandoned and uncultivated range-
lands had a silt loam or loam soil texture.
Plant biomass, soil sampling and analysis
The experiment was a completely randomized design
with five land uses (i.e., CR0, AR4, AR12, AR45 and
UR100), each replicated three times (n = 3). Each
replicated land use covered a 50 m 9 50 m plot.
Spatially separated rangelands were located within a
distance of 1–3 km that helped avoiding pseudo-
replication. Total above-ground plant biomass
(TAGB) was measured as the sum of above-ground
plant tissues (leaves?stems) harvested for most plant
functional groups. However, large shrubs such as
Astragalus sp. were not sampled due to the difficulty
with harvesting. In brief, a total of five 1 m 9 1 m
sampling quadrates were randomly installed in each
replicated land use (plot) and living above-ground
tissues were harvested by clipping at soil surface at
peak standing biomass in May, oven-dried at 60 �C for
24 h and weighed. The harvested plant tissues (i.e.,
TAGB) were separated into three functional groups
including annual grasses and forbs (AGF), perennial
grasses and forbs (PGF) and small shrubs; and
Nutr Cycl Agroecosyst (2013) 96:215–232 217
123
weighed again for above-ground biomass. For each
plot, plant biomass was estimated based on the
average value of the five quadrates sampled. We used
these values for plant productivity, a fraction of which
annually enters soil as detritus. Dead litter left on the
soil surface from previous growing seasons was
removed before soil sampling and not considered as
organic input. A total of six individual soil samples
were randomly taken at two soil depths of 0–0.15 and
0.15–0.3 m layers in each replicated plot, and mixed
thoroughly to obtain a composite soil sample. In total,
30 composite samples were collected, including 5 land
uses, 2 soil depths and 3 replicates (plots). One portion
of soil samples was air-dried and passed through a 2-
mm sieve and stored before laboratory analysis. Plant
fragments and visible rock fragments larger than
2 mm were removed by hand. The second portion of
soil samples was air-dried and passed through a 4-mm
sieve for aggregate stability analysis. Any visible
stone and plant debris in soil samples sieved to 4 mm
were separated manually and discarded. Soil pH (1:2.5
soil-to-water ratio), carbonate calcium equivalent
(CCE) or CaCO3 content (the titration method), bulk
density (the clod method), total organic C (OC) (the
Walkley & Black method) and total N (N) (the
Kjeldahl method) were all determined following
procedures described in Carter and Gregorich
(2008). Total porosity was calculated assuming a
particle density of 2.65 g cm-3 (Beylich et al. 2010).
All reported values are expressed on oven-dry soil
weight basis (105 �C). Furthermore, OC, N and labile
C fractions stocks (Mg ha-1) for each soil layer were
calculated considering the minimum equivalent soil
mass (ESM) approach instead of simple bulk density
method (Lee et al. 2009; Raiesi 2012b). The lowest
soil mass was considered the amount present in
uncultivated rangelands (2,130 and 2,160 Mg ha-1
at 0–0.15 and 0.15–0.30 m depths, respectively). The
OC, N and labile C fractions concentrations (g kg-1)
were multiplied by the corresponding equivalent soil
mass to obtain the stocks (Mg ha-1). The stocks of
total OC, N and labile C fractions were also calculated
for the whole 0.3 m depth by the sum of stocks at each
sampling depth within the soil profile. Soil aggregate
stability was determined by the mean weight diameter
(MWD) and the aggregate ratio (AR) using the wet
sieving method described in Kemper and Rosenau
(1986). In brief, 100 g of air-dried soil (4 mm) were
wetted using a spraying bottle and soaked in distilled
water for 5 min to allow slaking. The soil samples
were submerged in water and separated by manually
moving (0.03 m up and down) a nest of sieves with
openings 2, 0.25 and 0.053 mm for 2 min at a
frequency of 50 times (Six et al. 2000). After sieving
the soils remained in the basin left undisturbed for
5 min to allow fine particles to settle. Sieves were
slowly removed from the basin and paced onto a catch
pan to collect any remaining water. All the fractions of
aggregates were collected and transferred to pre-
weighed aluminum thins, oven-dried at 50 �C and
weighed. Additionally, sand content ([53 lm) of the
aggregates was determined by soaking of stable
aggregates ([53 lm) in distilled water and crushing
using a forefinger in a bowl, followed by sieving to
obtain the sand particles for correcting the weight of
water stable aggregates in each fraction (Six et al.
2000). Each aggregate analysis was done in two
replicates. The mean weight diameter (MWD), was
calculated as
MWD mmð Þ ¼Xn
i¼1
XiWi
Where Xi is the mean diameter of the soil aggregate
size (mm) fractions i and Wi is the proportion of each
size fraction over the total sample weight (Kemper and
Rosenau 1986). Macro-aggregates were defined as
[250 lm size fractions and micro-aggregates were
defined as\250 lm size fractions. The aggregate ratio
(AR), was calculated as
AR ¼ Macro� aggregates ð%ÞMicro� aggregates ð%Þ
Where percentage of macro-aggregates is the sum
of soil aggregate-size fractions larger than 250 lm and
percentage of micro-aggregates is the sum of soil
aggregate-size fractions smaller than 250 lm (Baker
et al. 2004).
For dissolved organic carbon (DOC) measurement,
soil sub-samples (equivalent to 10 g oven-dried
weight) were weighed into 50-ml polypropylene
centrifuge tubes. The samples were extracted with
30 ml of distilled water for 30 min on an end-over-end
shaker at approximately 230 rpm and centrifuged for
20 min at 8,000 rpm. The supernatant was filtered
through a 0.45-lm filter into separate vials for C
analysis (Ghani et al. 2003; Zhang et al. 2007).
Organic C in the extracts was determined by dichro-
mate digestion method (Vance et al. 1987). The
218 Nutr Cycl Agroecosyst (2013) 96:215–232
123

amount of DOC was expressed based on mg C per kg
soil and as the DOC/OC ratio. The measurement of
particulate organic C (POC) by Loss-on-Ignition
(LOI) was done following the procedure described in
Cambardella et al. (2001). In brief, 25 g of air-dried
and sieved (2 mm) soil was dispersed in 75 ml sodium
hexametaphosphate (5 %) for 16 h on a reciprocal
shaker at 120 strokes per minute. After dispersion, the
suspension was sieved through 0.053 mm sieve to
separate sand particles ? floatable macro-organic
matter or POM (particulate organic matter). The
collected sand particles ? POM fractions were dried
at 55 �C and weighed. A subsample was subjected to
450 �C for 4 h to measure POC, using the LOI
method. The amount of POC was expressed based on g
C per kg soil. Particulate organic N (PON) was
determined in another subsample by the Kjeldahl
method and expressed based on g N per kg soil. Soil
microbial biomass C (MBC) was determined by the
fumigation-extraction method (Vance et al. 1987).
The fumigated and non-fumigated soils were extracted
with 0.5 M K2SO4 by shaking at 30 rpm for 30 min
(soil:extractant ratio of 1:4), and organic C in the
extracts was determined by the dichromate digestion
method described in Vance et al. (1987). The MBC
was calculated using the following equation:
MBC mg kg�1� �
¼ ½ðOC fumigated soilÞ � ðOC unfumigated soilÞ�0:38
The amount of MBC was also expressed as the MBC/
OC ratio (qmic) for the reflection of the organic C
variability among the land uses and as an indicator of
the relative C availability for soil biota (Sparling
1992).
Readily mineralizable organic C (Min-C) or soil
microbial respiration as CO2-C evolution was mea-
sured as described in Zibilske (1994). In brief, 100 g
air-dried soil samples (2-mm sieve) were placed in
plastic jars (1,000 ml). The soil moisture content was
adjusted at 60 % water holding capacity (WHC).
Three jars without soil were considered as blanks. All
jars were kept at 25 �C and pre-incubated for 72 h. A
plastic vial containing 10 ml of 0.5 M NaOH for
trapping the respired CO2 was placed in the jars, and
replaced with a freshly prepared NaOH 1, 2, 3, 4, 5, 6,
7, 8, 9, 10 and 11 weeks after the beginning of the
incubation. The CO2 trapped was measured by
titrating the aliquot with 0.25 M HCl following
precipitation of carbonates by BaCl2 solution
(15 %). At each sampling date, the water content
was controlled and jars were randomly distributed in
the incubator. The cumulative CO2-C evolved at the
end of incubation was considered as potential miner-
alizable C. The C mineralization quotient (qM) or C
mineralization coefficient was calculated from Min-C
values divided by the soil initial OC concentration
(Min-C/OC) following Schimel (1986). The C miner-
alization coefficient is a rough estimate of turnover
rate of labile C fraction over the entire incubation
period (11 weeks).
The microbial metabolic quotient (qCO2) was
calculated by dividing soil basal respiration (the
average CO2-C respired during 14 days expressed as
mg CO2-C kg-1 soil day-1) by MBC (g MBC kg-1
soil) as indicated by Anderson and Domsch (1990).
The qCO2 values were expressed as mg CO2-C g-1
MBC per day. The qCO2 reflects the efficiency of soil
microbial populations in consuming organic C
resources during biosynthesis (Anderson 2003).
Statistical analysis
Prior to analysis of variance (ANOVA), plant biomass
and soil data were analyzed for normality and
homogeneity of the variance. Variables without nor-
mal distribution and equal variance (OC, AR, DOC/
OC ratio and PGF) were subjected to a Box–Cox
power transformation to obtain approximately normal
distributions and to stabilize the variances. Differ-
ences in soil characteristics were analyzed using a
two-way ANOVA with land use, depth and their
interaction as the independent variables. Differences
among the mean values were calculated by the
Fisher’s LSD test, when main and interaction effects
were significant. Differences were considered signif-
icant only when p values were lower than 0.05
(p \ 0.05), unless indicated otherwise. However,
untransformed mean values were presented through-
out the paper for simplicity of interpretation. Linear
and nonlinear regression functions were used to
describe the relationships (1) between soil parameters
and the length of abandonment and (2) between soil
parameters and total above-ground biomass. To work
with nonlinear functions, we considered the time of
abandonment 1 year instead of 0 year for cultivated
rangelands (CR0). The functions which accounted for
Nutr Cycl Agroecosyst (2013) 96:215–232 219
123
the greater variability within the data were selected as
the best ones. All statistical calculations were carried
out using the software programs SAS 8.02 (SAS
Institute 2005) and Minitab 16.1. Besides, soil data set
from 0 to 0.3 m depth was subjected to principal
component analysis (PCA) to identify major patterns
of variation. PCA technique is commonly used as an
ordination and data reduction technique to discrimi-
nate land uses and to determine the most important soil
parameters to characterize the influence of agricultural
abandonment on soil conditions (Jiang et al. 2009).
Results and discussion
Biomass production, total soil OC and N
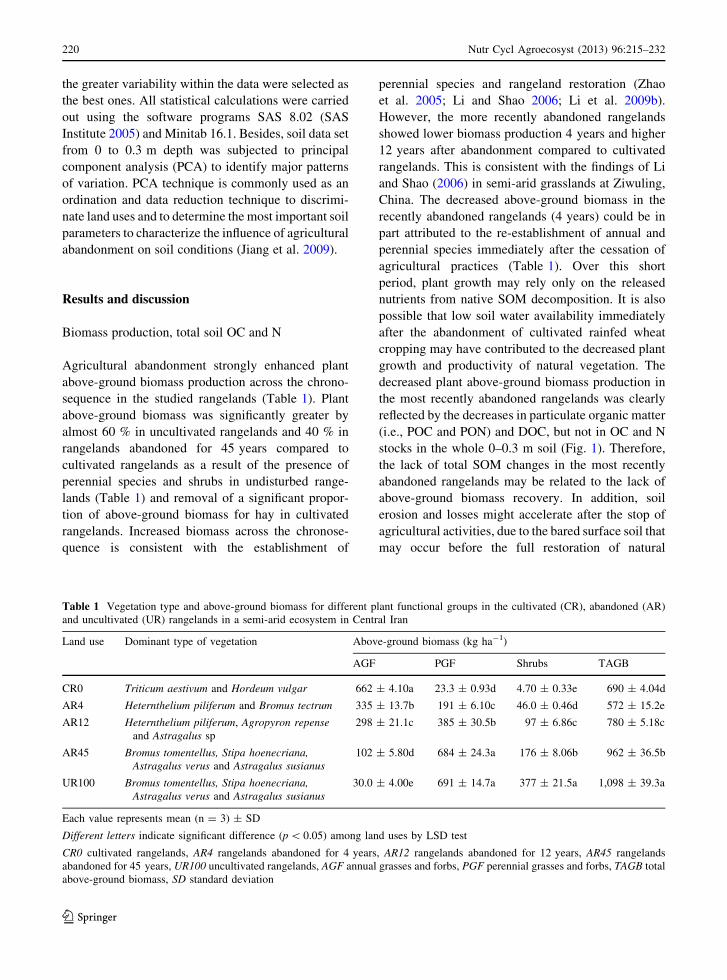
Agricultural abandonment strongly enhanced plant
above-ground biomass production across the chrono-
sequence in the studied rangelands (Table 1). Plant
above-ground biomass was significantly greater by
almost 60 % in uncultivated rangelands and 40 % in
rangelands abandoned for 45 years compared to
cultivated rangelands as a result of the presence of
perennial species and shrubs in undisturbed range-
lands (Table 1) and removal of a significant propor-
tion of above-ground biomass for hay in cultivated
rangelands. Increased biomass across the chronose-
quence is consistent with the establishment of
perennial species and rangeland restoration (Zhao
et al. 2005; Li and Shao 2006; Li et al. 2009b).
However, the more recently abandoned rangelands
showed lower biomass production 4 years and higher
12 years after abandonment compared to cultivated
rangelands. This is consistent with the findings of Li
and Shao (2006) in semi-arid grasslands at Ziwuling,
China. The decreased above-ground biomass in the
recently abandoned rangelands (4 years) could be in
part attributed to the re-establishment of annual and
perennial species immediately after the cessation of
agricultural practices (Table 1). Over this short
period, plant growth may rely only on the released
nutrients from native SOM decomposition. It is also
possible that low soil water availability immediately
after the abandonment of cultivated rainfed wheat
cropping may have contributed to the decreased plant
growth and productivity of natural vegetation. The
decreased plant above-ground biomass production in
the most recently abandoned rangelands was clearly
reflected by the decreases in particulate organic matter
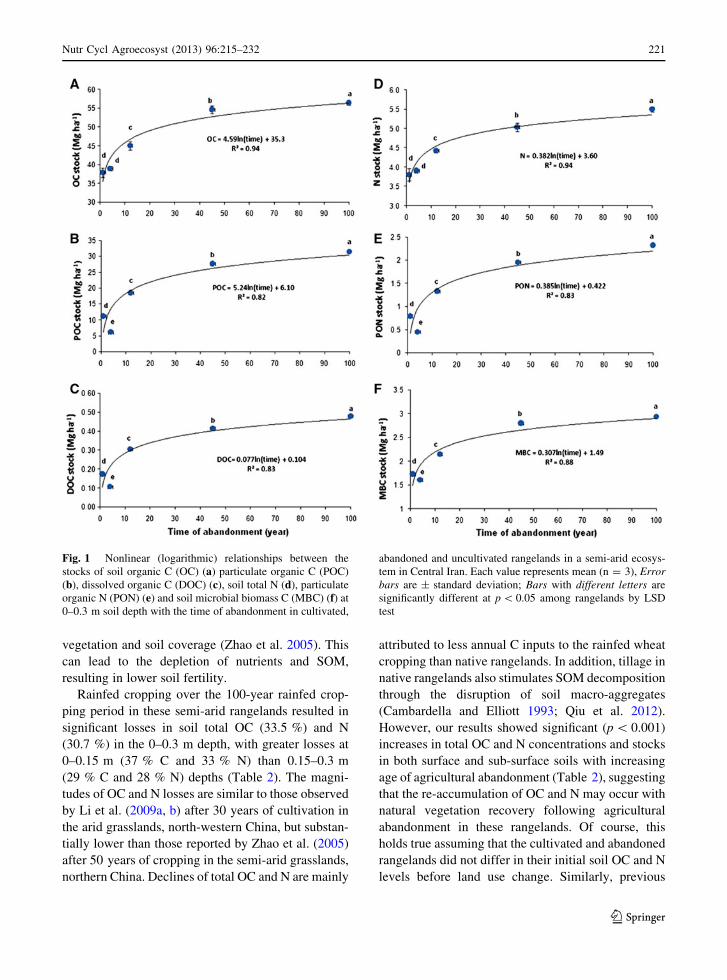
(i.e., POC and PON) and DOC, but not in OC and N
stocks in the whole 0–0.3 m soil (Fig. 1). Therefore,
the lack of total SOM changes in the most recently
abandoned rangelands may be related to the lack of
above-ground biomass recovery. In addition, soil
erosion and losses might accelerate after the stop of
agricultural activities, due to the bared surface soil that
may occur before the full restoration of natural
Table 1 Vegetation type and above-ground biomass for different plant functional groups in the cultivated (CR), abandoned (AR)
and uncultivated (UR) rangelands in a semi-arid ecosystem in Central Iran
Land use Dominant type of vegetation Above-ground biomass (kg ha-1)
AGF PGF Shrubs TAGB
CR0 Triticum aestivum and Hordeum vulgar 662 ± 4.10a 23.3 ± 0.93d 4.70 ± 0.33e 690 ± 4.04d
AR4 Heternthelium piliferum and Bromus tectrum 335 ± 13.7b 191 ± 6.10c 46.0 ± 0.46d 572 ± 15.2e
AR12 Heternthelium piliferum, Agropyron repense
and Astragalus sp
298 ± 21.1c 385 ± 30.5b 97 ± 6.86c 780 ± 5.18c
AR45 Bromus tomentellus, Stipa hoenecriana,
Astragalus verus and Astragalus susianus
102 ± 5.80d 684 ± 24.3a 176 ± 8.06b 962 ± 36.5b
UR100 Bromus tomentellus, Stipa hoenecriana,
Astragalus verus and Astragalus susianus
30.0 ± 4.00e 691 ± 14.7a 377 ± 21.5a 1,098 ± 39.3a
Each value represents mean (n = 3) ± SD
Different letters indicate significant difference (p \ 0.05) among land uses by LSD test
CR0 cultivated rangelands, AR4 rangelands abandoned for 4 years, AR12 rangelands abandoned for 12 years, AR45 rangelands
abandoned for 45 years, UR100 uncultivated rangelands, AGF annual grasses and forbs, PGF perennial grasses and forbs, TAGB total
above-ground biomass, SD standard deviation
220 Nutr Cycl Agroecosyst (2013) 96:215–232
123
vegetation and soil coverage (Zhao et al. 2005). This
can lead to the depletion of nutrients and SOM,
resulting in lower soil fertility.
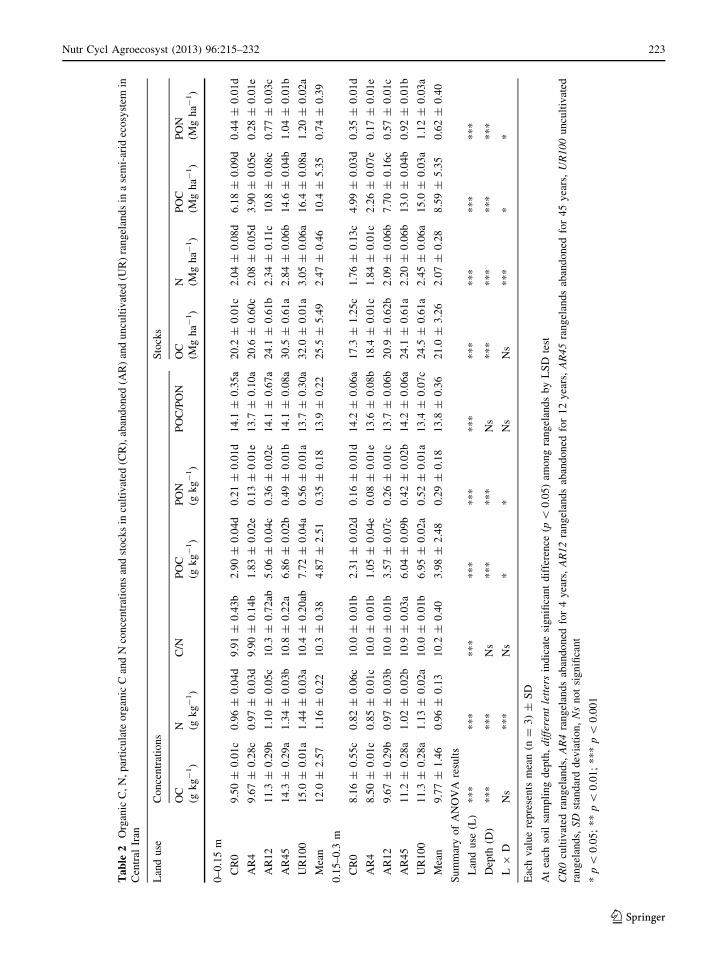
Rainfed cropping over the 100-year rainfed crop-
ping period in these semi-arid rangelands resulted in
significant losses in soil total OC (33.5 %) and N
(30.7 %) in the 0–0.3 m depth, with greater losses at
0–0.15 m (37 % C and 33 % N) than 0.15–0.3 m
(29 % C and 28 % N) depths (Table 2). The magni-
tudes of OC and N losses are similar to those observed
by Li et al. (2009a, b) after 30 years of cultivation in
the arid grasslands, north-western China, but substan-
tially lower than those reported by Zhao et al. (2005)
after 50 years of cropping in the semi-arid grasslands,
northern China. Declines of total OC and N are mainly
attributed to less annual C inputs to the rainfed wheat
cropping than native rangelands. In addition, tillage in
native rangelands also stimulates SOM decomposition
through the disruption of soil macro-aggregates
(Cambardella and Elliott 1993; Qiu et al. 2012).
However, our results showed significant (p \ 0.001)
increases in total OC and N concentrations and stocks
in both surface and sub-surface soils with increasing
age of agricultural abandonment (Table 2), suggesting
that the re-accumulation of OC and N may occur with
natural vegetation recovery following agricultural
abandonment in these rangelands. Of course, this
holds true assuming that the cultivated and abandoned
rangelands did not differ in their initial soil OC and N
levels before land use change. Similarly, previous
Fig. 1 Nonlinear (logarithmic) relationships between the
stocks of soil organic C (OC) (a) particulate organic C (POC)
(b), dissolved organic C (DOC) (c), soil total N (d), particulate
organic N (PON) (e) and soil microbial biomass C (MBC) (f) at
0–0.3 m soil depth with the time of abandonment in cultivated,
abandoned and uncultivated rangelands in a semi-arid ecosys-
tem in Central Iran. Each value represents mean (n = 3), Error
bars are ± standard deviation; Bars with different letters are
significantly different at p \ 0.05 among rangelands by LSD
test
Nutr Cycl Agroecosyst (2013) 96:215–232 221
123
studies reported higher OC and N contents in aban-
doned than cultivated soils (Zhao et al. 2005; Zhang
et al. 2007; Li et al. 2009b; Raiesi 2012a, b). In
contrast with our results, Raiesi (2012a, b) reported
that the re-accumulation of OC and N may occur only
in the surface soil layers of abandoned lands. The OC
and N contents in a given soil largely depends on the
balance between the C inputs rates through plant
residues and C outputs rates through microbial
decomposition (Post and Kwon 2000). These two
factors are essentially altered by type of land use and
agricultural abandonment (Li et al. 2009a, b). In this
study, the greater soil OC and N contents in abandoned
rangelands are largely attributed to enhanced C inputs
to the soil because a large proportion of above- (plant
residues and dead litters) and below-ground biomass
from natural plant community is annually added to the
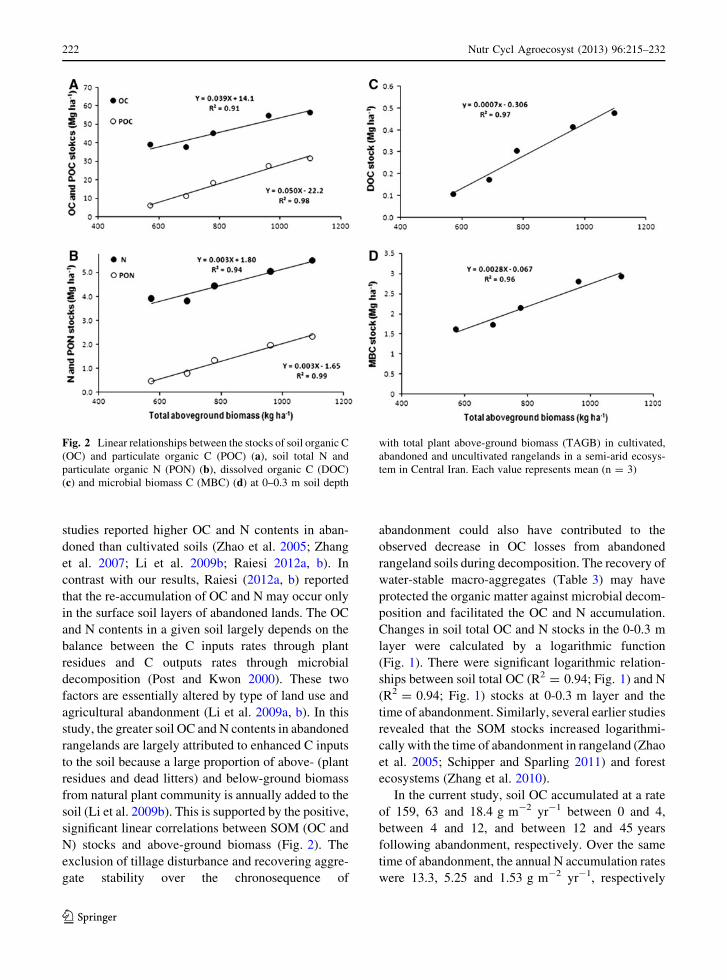
soil (Li et al. 2009b). This is supported by the positive,
significant linear correlations between SOM (OC and
N) stocks and above-ground biomass (Fig. 2). The
exclusion of tillage disturbance and recovering aggre-
gate stability over the chronosequence of
abandonment could also have contributed to the
observed decrease in OC losses from abandoned
rangeland soils during decomposition. The recovery of
water-stable macro-aggregates (Table 3) may have
protected the organic matter against microbial decom-
position and facilitated the OC and N accumulation.
Changes in soil total OC and N stocks in the 0-0.3 m
layer were calculated by a logarithmic function
(Fig. 1). There were significant logarithmic relation-
ships between soil total OC (R2 = 0.94; Fig. 1) and N
(R2 = 0.94; Fig. 1) stocks at 0-0.3 m layer and the
time of abandonment. Similarly, several earlier studies
revealed that the SOM stocks increased logarithmi-
cally with the time of abandonment in rangeland (Zhao
et al. 2005; Schipper and Sparling 2011) and forest
ecosystems (Zhang et al. 2010).
In the current study, soil OC accumulated at a rate
of 159, 63 and 18.4 g m-2 yr-1 between 0 and 4,
between 4 and 12, and between 12 and 45 years
following abandonment, respectively. Over the same
time of abandonment, the annual N accumulation rates
were 13.3, 5.25 and 1.53 g m-2 yr-1, respectively
Fig. 2 Linear relationships between the stocks of soil organic C
(OC) and particulate organic C (POC) (a), soil total N and
particulate organic N (PON) (b), dissolved organic C (DOC)
(c) and microbial biomass C (MBC) (d) at 0–0.3 m soil depth
with total plant above-ground biomass (TAGB) in cultivated,
abandoned and uncultivated rangelands in a semi-arid ecosys-
tem in Central Iran. Each value represents mean (n = 3)
222 Nutr Cycl Agroecosyst (2013) 96:215–232
123
Ta
ble
2O
rgan
icC
,N
,p
arti
cula
teo
rgan
icC
and
Nco
nce
ntr
atio
ns
and
sto
cks
incu
ltiv
ated
(CR
),ab
and
on
ed(A
R)
and
un
cult
ivat
ed(U
R)
ran
gel
and
sin
ase
mi-
arid
eco
syst
emin
Cen
tral
Iran
Lan
du
seC
on
cen
trat
ion
sS
tock
s
OC
(gk
g-
1)
N (gk
g-
1)
C/N
PO
C
(gk
g-
1)
PO
N
(gk
g-
1)
PO
C/P
ON
OC
(Mg
ha-
1)
N (Mg
ha-
1)
PO
C
(Mg
ha-
1)
PO
N
(Mg
ha-
1)
0–
0.1
5m
CR
09
.50
±0
.01
c0
.96
±0
.04
d9
.91
±0
.43
b2
.90
±0
.04
d0
.21
±0
.01
d1
4.1
±0
.35
a2
0.2
±0
.01
c2
.04
±0
.08
d6
.18
±0
.09
d0
.44
±0
.01
d
AR
49
.67
±0
.28
c0
.97
±0
.03
d9
.90
±0
.14
b1
.83
±0
.02
e0
.13
±0
.01
e1
3.7
±0
.10
a2
0.6
±0
.60
c2
.08
±0
.05
d3
.90
±0
.05
e0
.28
±0
.01
e
AR
12
11
.3±
0.2
9b
1.1
0±
0.0
5c
10
.3±
0.7
2ab
5.0
6±
0.0
4c
0.3
6±
0.0
2c
14
.1±
0.6
7a
24
.1±
0.6
1b
2.3
4±
0.1
1c
10
.8±
0.0
8c
0.7
7±
0.0
3c
AR
45
14
.3±
0.2
9a
1.3
4±
0.0
3b
10
.8±
0.2
2a
6.8
6±
0.0
2b
0.4
9±
0.0
1b
14
.1±
0.0
8a
30
.5±
0.6
1a
2.8
4±
0.0
6b
14
.6±
0.0
4b
1.0
4±
0.0
1b
UR
10
01
5.0
±0
.01
a1
.44
±0
.03
a1
0.4
±0
.20
ab7
.72
±0
.04
a0
.56
±0
.01
a1
3.7
±0
.30
a3
2.0
±0
.01
a3
.05
±0
.06
a1
6.4
±0
.08
a1
.20
±0
.02
a
Mea
n1
2.0
±2
.57
1.1
6±
0.2
21
0.3
±0
.38
4.8
7±
2.5
10
.35
±0
.18
13
.9±
0.2
22
5.5
±5
.49
2.4
7±
0.4
61
0.4
±5
.35
0.7
4±
0.3
9
0.1
5–
0.3
m
CR
08
.16
±0
.55
c0
.82
±0
.06
c1
0.0
±0
.01
b2
.31
±0
.02
d0
.16
±0
.01
d1
4.2
±0
.06
a1
7.3
±1
.25
c1
.76
±0
.13
c4
.99
±0
.03
d0
.35
±0
.01
d
AR
48
.50
±0
.01
c0
.85
±0
.01
c1
0.0
±0
.01
b1
.05
±0
.04
e0
.08
±0
.01
e1
3.6
±0
.08
b1
8.4
±0
.01
c1
.84
±0
.01
c2
.26
±0
.07
e0
.17
±0
.01
e
AR
12
9.6
7±
0.2
9b
0.9
7±
0.0
3b
10
.0±
0.0
1b
3.5
7±
0.0
7c
0.2
6±
0.0
1c
13
.7±
0.0
6b
20
.9±
0.6
2b
2.0
9±
0.0
6b
7.7
0±
0.1
6c
0.5
7±
0.0
1c
AR
45
11
.2±
0.2
8a
1.0
2±
0.0
2b
10
.9±
0.0
3a
6.0
4±
0.0
9b
0.4
2±
0.0
2b
14
.2±
0.0
6a
24
.1±
0.6
1a
2.2
0±
0.0
6b
13
.0±
0.0
4b
0.9
2±
0.0
1b
UR
10
01
1.3
±0
.28
a1
.13
±0
.02
a1
0.0
±0
.01
b6
.95
±0
.02
a0
.52
±0
.01
a1
3.4
±0
.07
c2
4.5
±0
.61
a2
.45
±0
.06
a1
5.0
±0
.03
a1
.12
±0
.03
a
Mea
n9
.77
±1
.46
0.9
6±
0.1
31
0.2
±0
.40
3.9
8±
2.4
80
.29
±0
.18
13
.8±
0.3
62
1.0
±3
.26
2.0
7±
0.2
88
.59
±5
.35
0.6
2±
0.4
0
Su
mm
ary
of
AN
OV
Are
sult
s
Lan
du
se(L
)*
**
**
**
**
**
**
**
**
**
**
**
**
**
**
*
Dep
th(D
)*
**
**
*N
s*
**
**
*N
s*
**
**
**
**
**
*
L9
DN
s*
**
Ns
**
Ns
Ns
**
**
*
Eac
hv
alu
ere
pre
sen
tsm
ean
(n=
3)
±S
D
At
each
soil
sam
pli
ng
dep
th,
dif
fere
nt
lett
ers
ind
icat
esi
gn
ifica
nt
dif
fere
nce
(p\
0.0
5)
amo
ng
ran
gel
and
sb
yL
SD
test
CR
0cu
ltiv
ated
ran
gel
and
s,A
R4
ran
gel
and
sab
and
on
edfo
r4
yea
rs,
AR
12
ran
gel
and
sab
and
on
edfo
r1
2y
ears
,A
R4
5ra
ng
elan
ds
aban
do
ned
for
45
yea
rs,
UR
10
0u
ncu
ltiv
ated
ran
gel
and
s,S
Dst
and
ard
dev
iati
on
,N
sn
ot
sig
nifi
can
t
*p\
0.0
5;
**
p\
0.0
1;
**
*p\
0.0
01
Nutr Cycl Agroecosyst (2013) 96:215–232 223
123
(Fig. 1). Rates of OC and N sequestration over the
chronosequence decrease partly due to the limitation
for the amount of OC and N that can accumulate per
unit of area. Generally, the rate of soil OC accumu-
lation was almost 1.2 times greater than that of soil N
accumulation along the chronosequence, showing a
faster rate of OC than N accumulation. Schipper and
Sparling (2011) showed that the mean rates of OC
accumulation were not constant but decreased along a
pasture chronosequence and ranged from 107 to
9 g m-2 yr-1 after establishment of native pastures
on reverted scrublands in New Zealand. Our study
showed soil OC and N stocks increased with increas-
ing time of abandonment, but this effect could be
largely attributed to the increase in plant production
that occurred along the natural vegetation succession.
This means that the time after cultivation abandon-
ment is the only determining factor for changes in
SOM and soil evolution, leading to the hypothesis that
the abandonment of cultivation and soil properties
might be dependent factors.
Our findings showed lower C/N ratios in cultivated
than abandoned and uncultivated soils, indicating
proportionally more depletion of OC than N in
cultivated rangeland soils, and higher rates of OC
sequestration than N in abandoned and uncultivated
rangeland soils. These changes were seen particularly
in rangelands abandoned for 45 years. It is also
possible that greater C/N ratios in long-term aban-
doned than cultivated or short-term abandoned range-
lands might have resulted from perennial woody
species (such as shrubs and semi-shrub) that were the
dominant plant cover in rangelands abandoned for a
longer period of 30–45 years (Table 1). The increase
in C/N ratio of abandoned rangeland soils may also
suggest net N immobilization into SOM and microbial
biomass, although there are no further increases in soil
OC content.
Our results also indicated that stratification ratios of
OC and N (the value of each parameter in the 0–0.15 m
soil layer divided by that in the 0.15–0.3 m layer) were
lower in cultivated rangelands than in abandoned and
uncultivated rangelands, again suggesting greater
organic inputs from natural vegetation with agricul-
tural abandonment. High stratification ratios of soil OC
and N may also display a relatively undisturbed soil
with a higher quality (Franzluebbers 2002). This would
mean that SOM stratification occurs in non-disturbed
abandoned soils and when the mixing of the upper
0.3 m by ploughing is entirely stopped (Raiesi 2012a,
b). Greater OC stratification ratios could be related to
the fact that during land abandonment, soil was
remained undisturbed, which reduces oxidation and
promotes soil OC stratification. In general, high
stratification ratios ([2) would indicate high soil
quality, as ratios \2 are commonly observed in
degraded soils (Franzluebbers 2002).
Agricultural abandonment effect on soil physical
properties
The abandonment of cultivation on these rangeland
soils had a strong influence on soil physical properties.
Results show significantly lower bulk density and
higher total porosity at both soil depths in abandoned
than cultivated rangelands (Table 3). This indicates
that soil compaction was lowered as a result of
cessation of tillage and agricultural practices, and
natural vegetation recovery. Soil bulk density might
increase and consequently total porosity would
decrease as a result of the disruption of soil macro-
aggregates by ploughing and subsequent compaction
in cultivated rangelands (Walker and Desanker 2004;
Raiesi 2012a, b). A lower bulk density and higher total
porosity in the abandoned soils than cultivated ones
could be attributed to the increase of OC after land
abandonment (Zhu et al. 2010; Zhang et al. 2010).
This is supported by the linear regressions showing
that soil bulk density was negatively correlated with
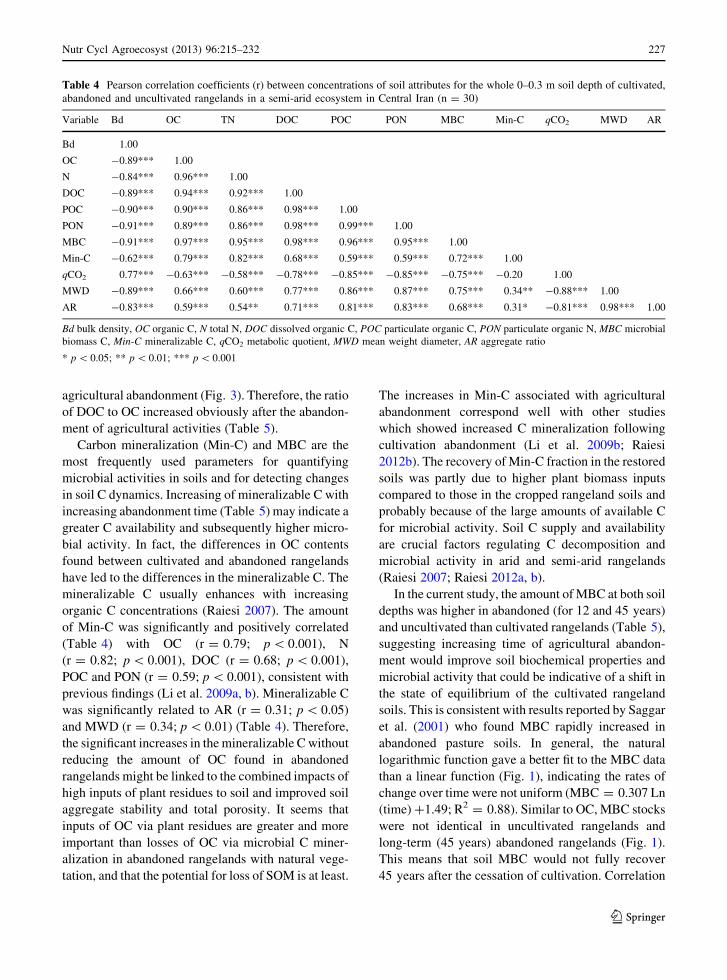
total OC (r = –0.89; p \ 0.001; n = 30) and POC
(r = –0.90; p \ 0.001; n = 30) contents (Table 4).
At both soil depths, aggregate stability measured as
MWD and aggregate ratio (AR) in abandoned and
uncultivated rangelands were higher than that in
cultivated rangelands (Table 3). Ploughing may
weaken soil aggregation and structure (McLauchlan
et al. 2006). Jinbo et al. (2007) and Li and Shao (2006)
also showed that the abandonment of cultivation
increased water-stable macro-aggregates. In the pres-
ent study, both MWD and AR values tended to be
linearly and positively related to total OC
(r = 0.66–0.59; p \ 0.001; n = 30) and POC
(r = 0.86–0.81; p \ 0.001; n = 30) contents
(Table 4). This indicates that soil OC plays an
important role in improving soil aggregate stability,
and that the influence of the POC fraction is more
pronounced than that of total OC. These findings
would suggest that total and labile OC could be the
224 Nutr Cycl Agroecosyst (2013) 96:215–232
123
major binding agent for the formation of aggregates
with cultivation abandonment. McLauchlan et al.
(2006) reported that aggregate size (as GMD index)
increased over a chronosequence of abandoned agri-
cultural fields. They suggested that this increase in
aggregate size could be driving the increase in the size
of the labile C pool over time, as aggregates physically
protect labile organic matter from microbial decom-
position. The amount of soil POC is a valuable
indicator of soil structure degradation with cultivation,
and significant losses in this OC fraction could
contribute to the breakdown of large macro-aggre-
gates. It is also possible that the growth of plant roots
(Qiu et al. 2012) and probably the development of
fungal hyphae (Zornoza et al. 2009) may have
contributed to the increased aggregate stability in
abandoned rangelands. These binding agents together
with POM are basically involved in the formation of
larger aggregates (Jastrow 1996).
Agricultural abandonment effect on labile OC
and N fractions
The results of this study demonstrate that 12–45 years
of agricultural abandonment in these rangelands
consistently increased soil POM (i.e., POC and
PON) pools calculated for the whole sampling depth
(Table 2), and that changes in POC and PON stocks
were much higher than that of OC and N stocks
(Table 2; Fig. 3). This observation is in agreement
with those of previous results (McLauchlan et al.
2006; Jinbo et al. 2007), showing an increase in labile
C factions with time of cultivation abandonment.
Changes in POM pools are usually related to the type
of land uses, management and agricultural practices
that all affect the balance between organic matter
inputs from plant biomass (above- and below-ground)
and organic matter losses during microbial activity
and decomposition (Cambardella and Elliott 1993; Li
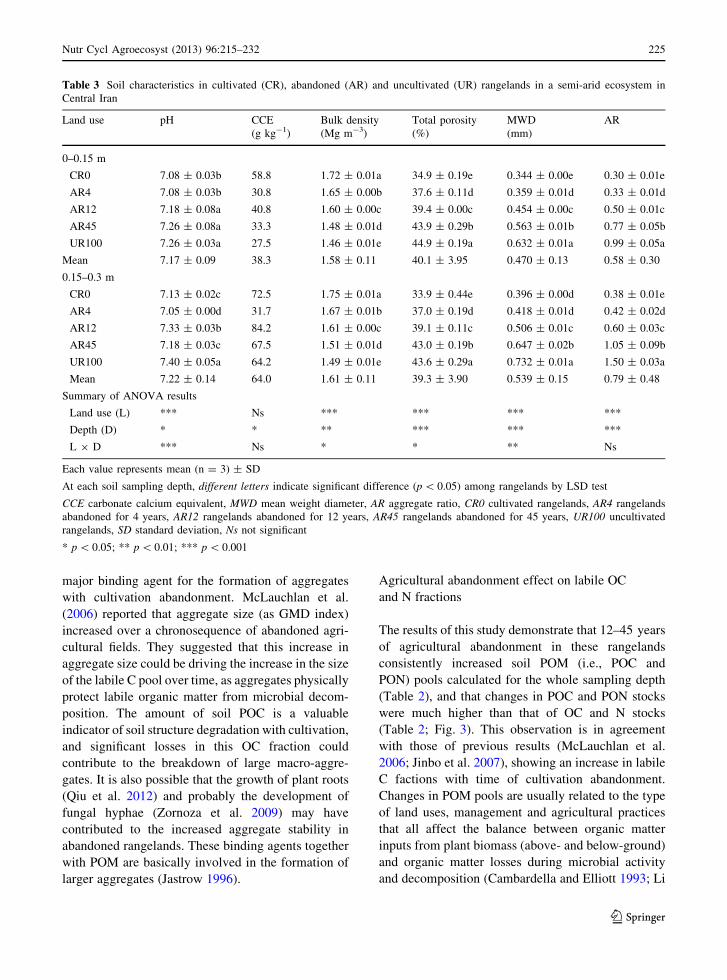
Table 3 Soil characteristics in cultivated (CR), abandoned (AR) and uncultivated (UR) rangelands in a semi-arid ecosystem in
Central Iran
Land use pH CCE Bulk density Total porosity MWD AR
(g kg-1) (Mg m-3) (%) (mm)
0–0.15 m
CR0 7.08 ± 0.03b 58.8 1.72 ± 0.01a 34.9 ± 0.19e 0.344 ± 0.00e 0.30 ± 0.01e
AR4 7.08 ± 0.03b 30.8 1.65 ± 0.00b 37.6 ± 0.11d 0.359 ± 0.01d 0.33 ± 0.01d
AR12 7.18 ± 0.08a 40.8 1.60 ± 0.00c 39.4 ± 0.00c 0.454 ± 0.00c 0.50 ± 0.01c
AR45 7.26 ± 0.08a 33.3 1.48 ± 0.01d 43.9 ± 0.29b 0.563 ± 0.01b 0.77 ± 0.05b
UR100 7.26 ± 0.03a 27.5 1.46 ± 0.01e 44.9 ± 0.19a 0.632 ± 0.01a 0.99 ± 0.05a
Mean 7.17 ± 0.09 38.3 1.58 ± 0.11 40.1 ± 3.95 0.470 ± 0.13 0.58 ± 0.30
0.15–0.3 m
CR0 7.13 ± 0.02c 72.5 1.75 ± 0.01a 33.9 ± 0.44e 0.396 ± 0.00d 0.38 ± 0.01e
AR4 7.05 ± 0.00d 31.7 1.67 ± 0.01b 37.0 ± 0.19d 0.418 ± 0.01d 0.42 ± 0.02d
AR12 7.33 ± 0.03b 84.2 1.61 ± 0.00c 39.1 ± 0.11c 0.506 ± 0.01c 0.60 ± 0.03c
AR45 7.18 ± 0.03c 67.5 1.51 ± 0.01d 43.0 ± 0.19b 0.647 ± 0.02b 1.05 ± 0.09b
UR100 7.40 ± 0.05a 64.2 1.49 ± 0.01e 43.6 ± 0.29a 0.732 ± 0.01a 1.50 ± 0.03a
Mean 7.22 ± 0.14 64.0 1.61 ± 0.11 39.3 ± 3.90 0.539 ± 0.15 0.79 ± 0.48
Summary of ANOVA results
Land use (L) *** Ns *** *** *** ***
Depth (D) * * ** *** *** ***
L 9 D *** Ns * * ** Ns
Each value represents mean (n = 3) ± SD
At each soil sampling depth, different letters indicate significant difference (p \ 0.05) among rangelands by LSD test
CCE carbonate calcium equivalent, MWD mean weight diameter, AR aggregate ratio, CR0 cultivated rangelands, AR4 rangelands
abandoned for 4 years, AR12 rangelands abandoned for 12 years, AR45 rangelands abandoned for 45 years, UR100 uncultivated
rangelands, SD standard deviation, Ns not significant
* p \ 0.05; ** p \ 0.01; *** p \ 0.001
Nutr Cycl Agroecosyst (2013) 96:215–232 225
123
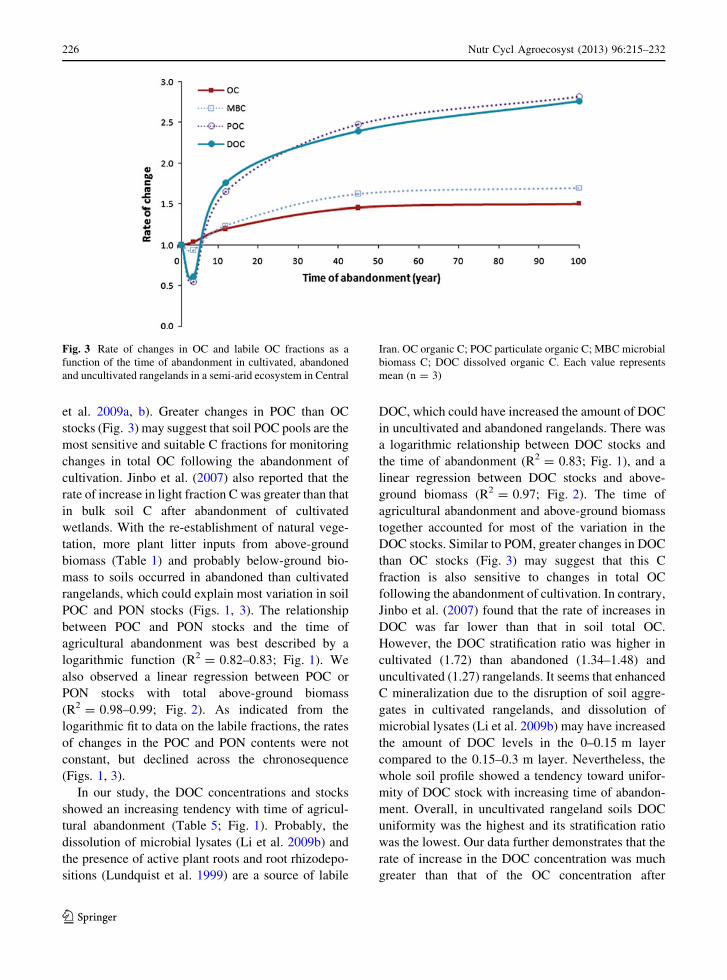
et al. 2009a, b). Greater changes in POC than OC
stocks (Fig. 3) may suggest that soil POC pools are the
most sensitive and suitable C fractions for monitoring
changes in total OC following the abandonment of
cultivation. Jinbo et al. (2007) also reported that the
rate of increase in light fraction C was greater than that
in bulk soil C after abandonment of cultivated
wetlands. With the re-establishment of natural vege-
tation, more plant litter inputs from above-ground
biomass (Table 1) and probably below-ground bio-
mass to soils occurred in abandoned than cultivated
rangelands, which could explain most variation in soil
POC and PON stocks (Figs. 1, 3). The relationship
between POC and PON stocks and the time of
agricultural abandonment was best described by a
logarithmic function (R2 = 0.82–0.83; Fig. 1). We
also observed a linear regression between POC or
PON stocks with total above-ground biomass
(R2 = 0.98–0.99; Fig. 2). As indicated from the
logarithmic fit to data on the labile fractions, the rates
of changes in the POC and PON contents were not
constant, but declined across the chronosequence
(Figs. 1, 3).
In our study, the DOC concentrations and stocks
showed an increasing tendency with time of agricul-
tural abandonment (Table 5; Fig. 1). Probably, the
dissolution of microbial lysates (Li et al. 2009b) and
the presence of active plant roots and root rhizodepo-
sitions (Lundquist et al. 1999) are a source of labile
DOC, which could have increased the amount of DOC
in uncultivated and abandoned rangelands. There was
a logarithmic relationship between DOC stocks and
the time of abandonment (R2 = 0.83; Fig. 1), and a
linear regression between DOC stocks and above-
ground biomass (R2 = 0.97; Fig. 2). The time of
agricultural abandonment and above-ground biomass
together accounted for most of the variation in the
DOC stocks. Similar to POM, greater changes in DOC
than OC stocks (Fig. 3) may suggest that this C
fraction is also sensitive to changes in total OC
following the abandonment of cultivation. In contrary,
Jinbo et al. (2007) found that the rate of increases in
DOC was far lower than that in soil total OC.
However, the DOC stratification ratio was higher in
cultivated (1.72) than abandoned (1.34–1.48) and
uncultivated (1.27) rangelands. It seems that enhanced
C mineralization due to the disruption of soil aggre-
gates in cultivated rangelands, and dissolution of
microbial lysates (Li et al. 2009b) may have increased
the amount of DOC levels in the 0–0.15 m layer
compared to the 0.15–0.3 m layer. Nevertheless, the
whole soil profile showed a tendency toward unifor-
mity of DOC stock with increasing time of abandon-
ment. Overall, in uncultivated rangeland soils DOC
uniformity was the highest and its stratification ratio
was the lowest. Our data further demonstrates that the
rate of increase in the DOC concentration was much
greater than that of the OC concentration after
Fig. 3 Rate of changes in OC and labile OC fractions as a
function of the time of abandonment in cultivated, abandoned
and uncultivated rangelands in a semi-arid ecosystem in Central
Iran. OC organic C; POC particulate organic C; MBC microbial
biomass C; DOC dissolved organic C. Each value represents
mean (n = 3)
226 Nutr Cycl Agroecosyst (2013) 96:215–232
123
agricultural abandonment (Fig. 3). Therefore, the ratio
of DOC to OC increased obviously after the abandon-
ment of agricultural activities (Table 5).
Carbon mineralization (Min-C) and MBC are the
most frequently used parameters for quantifying
microbial activities in soils and for detecting changes
in soil C dynamics. Increasing of mineralizable C with
increasing abandonment time (Table 5) may indicate a
greater C availability and subsequently higher micro-
bial activity. In fact, the differences in OC contents
found between cultivated and abandoned rangelands
have led to the differences in the mineralizable C. The
mineralizable C usually enhances with increasing
organic C concentrations (Raiesi 2007). The amount
of Min-C was significantly and positively correlated
(Table 4) with OC (r = 0.79; p \ 0.001), N
(r = 0.82; p \ 0.001), DOC (r = 0.68; p \ 0.001),
POC and PON (r = 0.59; p \ 0.001), consistent with
previous findings (Li et al. 2009a, b). Mineralizable C
was significantly related to AR (r = 0.31; p \ 0.05)
and MWD (r = 0.34; p \ 0.01) (Table 4). Therefore,
the significant increases in the mineralizable C without
reducing the amount of OC found in abandoned
rangelands might be linked to the combined impacts of
high inputs of plant residues to soil and improved soil
aggregate stability and total porosity. It seems that
inputs of OC via plant residues are greater and more
important than losses of OC via microbial C miner-
alization in abandoned rangelands with natural vege-
tation, and that the potential for loss of SOM is at least.
The increases in Min-C associated with agricultural
abandonment correspond well with other studies
which showed increased C mineralization following
cultivation abandonment (Li et al. 2009b; Raiesi
2012b). The recovery of Min-C fraction in the restored
soils was partly due to higher plant biomass inputs
compared to those in the cropped rangeland soils and
probably because of the large amounts of available C
for microbial activity. Soil C supply and availability
are crucial factors regulating C decomposition and
microbial activity in arid and semi-arid rangelands
(Raiesi 2007; Raiesi 2012a, b).
In the current study, the amount of MBC at both soil
depths was higher in abandoned (for 12 and 45 years)
and uncultivated than cultivated rangelands (Table 5),
suggesting increasing time of agricultural abandon-
ment would improve soil biochemical properties and
microbial activity that could be indicative of a shift in
the state of equilibrium of the cultivated rangeland
soils. This is consistent with results reported by Saggar
et al. (2001) who found MBC rapidly increased in
abandoned pasture soils. In general, the natural
logarithmic function gave a better fit to the MBC data
than a linear function (Fig. 1), indicating the rates of
change over time were not uniform (MBC = 0.307 Ln
(time) ?1.49; R2 = 0.88). Similar to OC, MBC stocks
were not identical in uncultivated rangelands and
long-term (45 years) abandoned rangelands (Fig. 1).
This means that soil MBC would not fully recover
45 years after the cessation of cultivation. Correlation
Table 4 Pearson correlation coefficients (r) between concentrations of soil attributes for the whole 0–0.3 m soil depth of cultivated,
abandoned and uncultivated rangelands in a semi-arid ecosystem in Central Iran (n = 30)
Variable Bd OC TN DOC POC PON MBC Min-C qCO2 MWD AR
Bd 1.00
OC -0.89*** 1.00
N -0.84*** 0.96*** 1.00
DOC -0.89*** 0.94*** 0.92*** 1.00
POC -0.90*** 0.90*** 0.86*** 0.98*** 1.00
PON -0.91*** 0.89*** 0.86*** 0.98*** 0.99*** 1.00
MBC -0.91*** 0.97*** 0.95*** 0.98*** 0.96*** 0.95*** 1.00
Min-C -0.62*** 0.79*** 0.82*** 0.68*** 0.59*** 0.59*** 0.72*** 1.00
qCO2 0.77*** -0.63*** -0.58*** -0.78*** -0.85*** -0.85*** -0.75*** -0.20 1.00
MWD -0.89*** 0.66*** 0.60*** 0.77*** 0.86*** 0.87*** 0.75*** 0.34** -0.88*** 1.00
AR -0.83*** 0.59*** 0.54** 0.71*** 0.81*** 0.83*** 0.68*** 0.31* -0.81*** 0.98*** 1.00
Bd bulk density, OC organic C, N total N, DOC dissolved organic C, POC particulate organic C, PON particulate organic N, MBC microbial
biomass C, Min-C mineralizable C, qCO2 metabolic quotient, MWD mean weight diameter, AR aggregate ratio
* p \ 0.05; ** p \ 0.01; *** p \ 0.001
Nutr Cycl Agroecosyst (2013) 96:215–232 227
123

analysis (Table 4) showed that MBC was closely
(p \ 0.001) related to OC (r = 0.97), N (r = 0.95),
DOC (r = 0.98), POC (r = 0.96) and PON (r = 0.95)
in the 0–0.3 m layer, and negatively correlated with
soil bulk density (r = -0.91). This means increased
DOC contents measured in uncultivated and aban-
doned rangelands appear to indicate C availability to
soil microflora. Changes in MBC often indicate the
effect of agricultural management practices and
abandonment on soil micro biological and biochem-
ical properties (Nannipieri et al. 1990; Saggar et al.
2001). Similarly, the abandonment of cultivation
resulted in a significant increase of soil MBC in arid
and semi-arid areas (Saggar et al. 2001; Li et al.
2009b; Raiesi 2012b). The effect of agricultural
abandonment on the MBC/OC ratio (qmic) was
consistent in both soil layers and greater MBC/OC
ratios were found in rangelands abandoned for
45 years (Table 5). With agricultural abandonment
in rangelands, the increase in MBC was higher than
that in OC in the 0–0.3 m layer (Fig. 3), resulting in an
increase in the microbial quotient (qmic) (Table 5).
Similarly, Zhang et al. (2007) reported an increase in
the microbial quotient with increasing abandonment
time in freshwater march ecosystems. Saggar et al.
(2001) reported that both soil MBC and MBC/OC
ratios increased with the cessation of agriculture in
pasture ecosystems. The MBC/OC ratio can be a good
measure of the efficiency of OC conversion into
microbial C, the losses of soil OC during decompo-
sition, and is a soil quality indicator allowing the
comparison of microbial biomass across soils with
different organic matter contents (Sparling 1992). If a
soil is degrading, the MBC/OC ratio generally
declines at faster rates than soil total OC (Sparling
1992). Therefore, high MBC/OC ratios in abandoned
Table 5 Dissolved organic C (DOC), soil mineralizable C (Min-C), microbial biomass C (MBC), and microbial metabolic quotient
(qCO2) in cultivated (CR), abandoned (AR) and uncultivated (UR) rangelands in a semi-arid ecosystem in Central Iran
Land use DOC Min-C MBC qCO2
(mg C kg-1
soil)
(g C kg-1 C) (mg CO2-C
kg-1 soil)
(g C kg-1 C) (mg C kg-1
soil)
(g C kg-1 C) (mg CO2-C g-1
MBC day-1)
0–0.15 m
CR0 51.1 ± 0.93d 5.38 ± 0.13c 256 ± 19.7c 27.4 ± 1.86c 451 ± 1.21d 47.6 ± 0.36b 16.4 ± 0.60b
AR4 31.7 ± 0.85e 3.26 ± 0.01d 355 ± 17.8b 36.4 ± 3.12a 407 ± 0.70e 42.1 ± 1.08c 18.2 ± 0.51a
AR12 85.2 ± 0.78c 7.52 ± 0.27b 361 ± 31.8b 32.1 ± 3.37ab 535 ± 1.81c 47.2 ± 1.17b 12.8 ± 1.67c
AR45 111 ± 1.95b 7.77 ± 0.08b 372 ± 6.84b 26.1 ± 1.19c 721 ± 1.69b 50.9 ± 1.23a 5.62 ± 0.31d
UR100 125 ± 2.11a 8.39 ± 0.15a 435 ± 27.4a 28.8 ± 1.71bc 767 ± 0.99a 51.7 ± 0.61a 4.22 ± 0.19d
Mean 80.8 ± 39 6.46 ± 2.11 356 ± 64 30.2 ± 4.1 576 ± 160 47.9 ± 3.8 11.4 ± 6.28
0.15–0.3 m
CR0 29.7 ± 0.51d 3.61 ± 0.19d 191 ± 22c 23.4 ± 3.86a 355 ± 3.03d 43.5 ± 3.06c 10.7 ± 0.52b
AR4 17.8 ± 0.76e 2.08 ± 0.09e 221 ± 37bc 25.8 ± 4.29a 343 ± 4.04e 40.2 ± 0.47d 18.9 ± 0.87a
AR12 57.3 ± 1.38c 5.92 ± 0.30c 229 ± 40bc 23.7 ± 4.42a 466 ± 2.47c 48.2 ± 1.38b 6.11 ± 0.76c
AR45 82.4 ± 2.17b 7.38 ± 0.35b 266 ± 9.7ab 23.9 ± 0.43a 584 ± 2.65b 52.4 ± 1.17a 4.51 ± 0.15d
UR100 97.9 ± 1.03a 8.64 ± 0.19a 285 ± 21a 25.0 ± 2.34a 603 ± 2.31a 53.3 ± 1.66a 3.44 ± 0.17e
Mean 57.0 ± 33 5.52 ± 2.68 238 ± 37 24.4 ± 0.98 470 ± 122 47.5 ± 5.6 8.73 ± 6.32
Summary of ANOVA results
Land use (L) *** *** *** * *** *** ***
Depth (D) *** *** *** *** *** Ns ***
L 9 D *** *** Ns Ns *** ** ***
Each value represents mean (n = 3) ± SD
At each soil sampling depth, different letters indicate significant difference (p \ 0.05) among rangelands by LSD test
CR0 cultivated rangelands, AR4 rangelands abandoned for 4 years, AR12 rangelands abandoned for 12 years, AR45 rangelands
abandoned for 45 years, UR100 uncultivated rangelands, SD standard deviation, Ns not significant
* p \ 0.05; ** p \ 0.01; *** p \ 0.001
228 Nutr Cycl Agroecosyst (2013) 96:215–232
123
rangelands may imply the rapid recovery of soil
microbiological properties in the studied ecosystem.
For the soils with low OC contents, however, high
MBC/OC ratio may means that SOM decomposes
rapidly, which would be unfavorable to soil quality
and fertility (Li et al. 2004; Jiang et al. 2006). Besides,
our results indicate that the rates of increase in soil
MBC were less than those in POC and DOC pools
(Fig. 3), suggesting that both soil POC and DOC
fractions might be more responsive to the sequence of
rangeland abandonment than MBC fraction and thus
are more sensitive indicators than MBC in the study
area.
Our results showed that with increasing abandon-
ment time, qCO2 at both soil depths decreased
(Table 5). Over the past three decades, the microbial
qCO2 has been used as an indicator of ecosystem
disturbance and development (Insam and Domsch
1988). The metabolic quotient is also considered as an
index of microbial efficiency in utilizing the available
resources (high efficiency for low values of qCO2)
(Anderson 2003). A decrease in qCO2 value was in
fact related to a larger quantity of MBC with
abandonment period. Similarly, previous studies
reported that the qCO2 decreased with time of
succession stages of restored soil systems (Insam
and Domsch 1988; Insam and Haselwandter 1989).
Furthermore, the lower qCO2 values in uncultivated
and abandoned than cultivated rangelands may be due
to higher C availability and quality, in particular labile
C fractions such as POC and DOC due to the presence
of active plant roots and greater C inputs from plant
biomass. Other factors could also contribute to the low
qCO2. For example, fungi may dominate in abandoned
rangelands (Zornoza et al. 2009) and these soil
microorganisms are more efficient at converting
substrate C into biomass C than bacteria (Anderson
2003). Therefore, improved metabolic efficiency with
abandonment time reflects a tendency toward a rather
stable condition after disturbance by agricultural
practices and the slow recovery of natural vegetation.
Principal component analysis
The results of principal component analysis (PCA) for
12 soil parameters are summarized in Table 6. Prin-
cipal component analysis of the soil properties
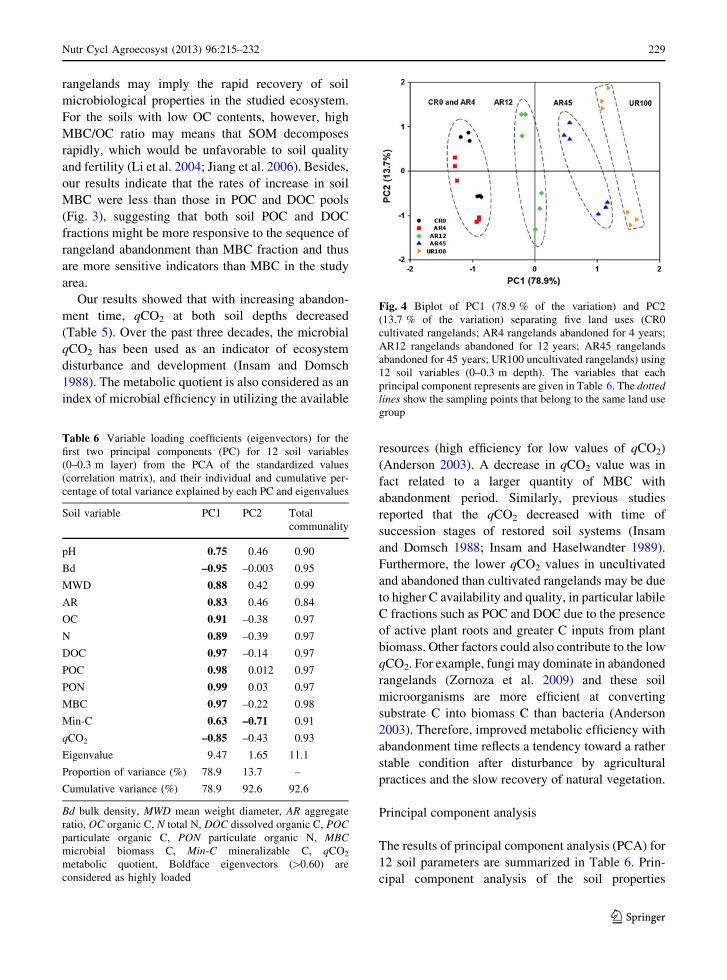
Fig. 4 Biplot of PC1 (78.9 % of the variation) and PC2
(13.7 % of the variation) separating five land uses (CR0
cultivated rangelands; AR4 rangelands abandoned for 4 years;
AR12 rangelands abandoned for 12 years; AR45 rangelands
abandoned for 45 years; UR100 uncultivated rangelands) using
12 soil variables (0–0.3 m depth). The variables that each
principal component represents are given in Table 6. The dotted
lines show the sampling points that belong to the same land use
group
Table 6 Variable loading coefficients (eigenvectors) for the
first two principal components (PC) for 12 soil variables
(0–0.3 m layer) from the PCA of the standardized values
(correlation matrix), and their individual and cumulative per-
centage of total variance explained by each PC and eigenvalues
Soil variable PC1 PC2 Total
communality
pH 0.75 0.46 0.90
Bd –0.95 –0.003 0.95
MWD 0.88 0.42 0.99
AR 0.83 0.46 0.84
OC 0.91 –0.38 0.97
N 0.89 –0.39 0.97
DOC 0.97 –0.14 0.97
POC 0.98 0.012 0.97
PON 0.99 0.03 0.97
MBC 0.97 –0.22 0.98
Min-C 0.63 –0.71 0.91
qCO2 –0.85 –0.43 0.93
Eigenvalue 9.47 1.65 11.1
Proportion of variance (%) 78.9 13.7 –
Cumulative variance (%) 78.9 92.6 92.6
Bd bulk density, MWD mean weight diameter, AR aggregate
ratio, OC organic C, N total N, DOC dissolved organic C, POC
particulate organic C, PON particulate organic N, MBC
microbial biomass C, Min-C mineralizable C, qCO2
metabolic quotient, Boldface eigenvectors ([0.60) are
considered as highly loaded
Nutr Cycl Agroecosyst (2013) 96:215–232 229
123

resulted in two principal components (PC) with
eigenvalues greater than 1, and these two components
explained 92.6 % of the total variance in the data set
(Table 6). The first component (PC1) explaining
78.9 % of the data variance showed high loadings
for soil pH, bulk density, OC, N, DOC, POC, PON,
Min-C, MBC, qCO2, MWD and AR variables. Soil
OC correlated positively with all parameters except
with bulk density and qCO2. The second component
(PC2) accounting for 13.7 % of the total variation
loaded heavily on Min-C. Soil Min-C was negatively
correlated with qCO2 on PC1. The different locations
of land uses in the plane of the first two principal
components indicate that there were large differences
in soil attributes among land uses (Fig. 4). The
exceptions were cultivated rangelands (CR0) and
short-term abandoned rangelands (AR4), since these
land uses were not separated successfully and clearly.
Results from the PC analysis indicated that the first PC
was successful in separating land uses through soil pH,
bulk density, OC, N, DOC, POC, PON, MBC, qCO2,
MWD and AR parameters (Table 6; Fig. 4). This
means that the eleven soil properties may be used for
assessment of soil response to agricultural abandon-
ment in these semi-arid rangelands in the future
studies.
Conclusions
The current study showed that after cultivated range-
lands were abandoned and converted to grazing
rangelands, soil conditions improve with increasing
time of abandonment. The results showed that (1) soil
OC and N stocks, and structure increased, whereas soil
bulk density decreased with increasing abandonment
time, (2) 45 years of abandonment would not be
sufficient to reach the level of uncultivated rangelands
and (3) rangelands that had once been cultivated but
abandoned for 45 years still showed increasing levels
of labile SOM fractions, particularly POC, PON and
DOC pools. The recovery of POM and DOC fractions
in the restored rangeland soils were mainly due to
higher plant biomass inputs and lower organic matter
decomposition rates compared to those in the culti-
vated rangeland soils. We found evidence that soil
POC and DOC pools are the most sensitive and
appropriate OC fractions for detecting changes in soil
total OC following the abandonment of cultivation.
The positive influence of cultivation abandonment
was particularly evident during the early vegetation
and soil recovery stage (12 years abandoned range-
lands). Furthermore, agricultural abandonment in high
altitude rangelands with semi-arid climate would be a
potential practice for C sequestration in the soil, and
thus lowering CO2 concentration in the atmosphere.
Nevertheless, these rangelands are under heavy to
light grazing pressure by livestock and it is not well-
known whether the cessation of both cultivation and
concomitantly grazing could result in a further capac-
ity for SOM accumulation and C sequestration in soil.
This aspect of rangeland management merits further
research.
Acknowledgments The authors are grateful to Shahrekord
University for providing the financial support. We thank the
anonymous reviewers who provided critical and valuable
suggestions to improve the manuscript.
References
Anderson TH (2003) Microbial eco-physiological indicators to
asses soil quality. Agric Ecosyst Environ 98:285–293
Anderson TH, Domsch KH (1990) Application of ecophysio-
logical quotients (qCO2 and qD) on microbial biomasses
from soils of different cropping histories. Soil Biol Bio-
chem 22:251–255
Baker BJ, Fausey NR, Islam KR (2004) Comparison of soil
physical properties under two different water table man-
agement regimes. Soil Sci Soc Am J 68:1973–1981
Beylich A, Oberholzer HR, Schrader S, Hoper H, Wilke BM
(2010) Evaluation of soil compaction effects on soil biota
and soil biological processes in soils. Soil Till Res
109:133–143
Bruce JP, Frome M, Haites E, Janzen H, Lal R, Paustian K
(1999) Carbon sequestration in soils. J Soil Water Conserv
54:382–389
Cambardella CA, Elliott ET (1993) Carbon and nitrogen dis-
tribution in aggregates from cultivated and native grassland
soil. Soil Sci Soc Am J 57:1071–1076
Cambardella CA, Gajda AM, Doran JW, Wienhold BJ, Kettler
TA (2001) Estimation of particulate and total organic
matter by weight loss-on-ignition. In: Lal R, Kimble JM,
Follett RF, Stewart BA (eds) Assessment methods for soil
carbon. Lewis Publishers, London, pp 349–359
Carter MR, Gregorich EG (2008) Soil sampling and methods of
analysis. Canadian Society of Soil Science, CRC Press,
Taylor and Francis Group, Boca Raton, FL
Franzluebbers AJ (2002) Soil organic matter stratification ratio
as an indicator of soil quality. Soil Till Res 66:95–106
Ghani A, Dexter M, Perrott KW (2003) Hot-water extractable
carbon in soils: a sensitive measurement for determining
impacts of fertilization, grazing and cultivation. Soil Biol
Biochem 35:1231–1243
230 Nutr Cycl Agroecosyst (2013) 96:215–232
123

Gregorich EG, Carter MR, Angers DA, Monreal CM, Ellert BH
(1994) Towards a minimum data set to assess soil organic
matter quality in agricultural soils. Can J Soil Sci 74:367–385
Hoshino A, Tamura K, Fujimaki H, Asano M, Ose K, Higashi T
(2009) Effects of crop abandonment and grazing exclusion
on available soil water and other soil properties in a semi-
arid Mongolian grassland. Soil Till Res 105:228–235
Insam H, Domsch KH (1988) Relationship between soil organic
carbon and microbial biomass on chronosequences of
reclamation sites. Microb Ecol 15:177–188
Insam H, Haselwandter K (1989) Metabolic quotient of the soil
microflora in relation to plant succession. Oecologia
79:174–178
Jastrow JD (1996) Soil aggregate formation and the accrual of
particulate and mineral-associated organic matter. Soil
Biol Biochem 28:665–676
Jiang HM, Jiang JP, Jia Y, Li FM, Xu JZ (2006) Soil carbon pool
and effects of soil fertility in seeded alfalfa fields on the
semi-arid Loess Plateau in China. Soil Biol Biochem
38:2350–2358
Jiang JP, Xiong YC, Jiang HM, Ye DY, Song YJ, Li FM (2009)
Soil microbial activity during secondary vegetation suc-
cession in semiarid abandoned lands of Loess Plateau.
Pedosphere 19:735–747
Jinbo Z, Changchun S, Wenyan Y (2007) Effects of cultivation
on soil microbiological properties in a freshwater march
soil in Northeast China. Soil Till Res 93:231–235
Kemper DW, Rosenau RC (1986) Aggregate stability and
aggregate size distribution. In: Klute A (ed) Methods of soil
analysis, Part 1. America Society of Agronomy, WI,
pp 425–442
Lal R (2004) Soil carbon sequestration to mitigate climate
change. Geoderma 123:1–22
Lal R (2008) Carbon sequestration. Philos T Roy Soc B
63:815–830
Lee J, Hopmans JW, Rolston DE, Baer SG, Six J (2009)
Determining soil carbon stock changes: simple bulk den-
sity corrections fail. Agric Ecosyst Environ 134:251–256
Leifeld J, Kogel-Knabner I (2005) Soil organic matter fractions
as early indicators for carbon stock changes under different
land-use? Geoderma 124:143–155
Li YY, Shao MA (2006) Change of soil physical properties
under long-term natural vegetation restoration in the Loess
Plateau of China. J Arid Environ 64:77–96
Li FM, Song QH, Hao JH, Jjemba PK, Shi YC (2004) Dynamics
of soil microbial biomass C and soil fertility in cropland
mulched with plastic film in a semi-arid agroecosystem.
Soil Biol Biochem 36:1893–1902
Li XG, Li YK, Li FM, Ma QF, Zhang PL, Yin P (2009a)
Changes in soil organic carbon, nutrients and aggregation
after conversion of native desert soil into irrigated arable
land. Soil Till Res 104:263–269
Li XG, Zhang PL, Yin P, Li YK, Ma QF, Long RJ, Li FM (2009b)
Soil organic carbon and nitrogen fractions and water-stable
aggregation as affected by cropping and grassland reclama-
tion in an arid sub-alpine soil. Land Degrad Dev 20:176–186
Lopez-Bermudez F, Romero-Diaz A, Martinez-Fernandez J,
Martinez-Fernandez J (1996) The El Ardal field site: soil
and vegetation cover. In: Brandt CJ, Thornes JB (eds)
Mediterranean desertification and land use. John Wiley and
Sons, Chichester, pp 169–188
Lundquist EJ, Jackson LE, Scow KM (1999) Wet-dry cycles
affect dissolved organic carbon in two California agricul-
tural soils. Soil Biol Biochem 31:1031–1038
Mclauchlan KK, Hobbie SH, Post WM (2006) Conversion from
agriculture to grassland builds soil organic matter on dec-
adal timescales. Ecol Appl 16:143–153
Nannipieri P, Grego S, Ceccanti B (1990) Ecological signifi-
cance of the biological activity in soil. In: Bollag JM,
Stotzky G (eds) Soil biochemistry, vol 6. Marcel Dekker,
New York, pp 293–355
Post WM, Kwon KC (2000) Soil carbon sequestration and land-
use change: processes and potential. Glob Change Biol
6:317–328
Preger AC, Kosters R, Du Preez CC, Brodowski S, Amelung W
(2010) Carbon sequestration in secondary pasture soils: a
chronosequence study in the South African Highveld. Eur J
Soil Sci 61:551–562
Qiu L, Wei X, Zhang X, Cheng J, Gale W, Guo C, Long T
(2012) Soil organic carbon losses due to land use change in
a semiarid grassland. Plant Soil 355:299–309
Raiesi F (2007) The conversion of overgrazed pastures to
almond orchards and alfalfa cropping systems may favor
microbial indicators of soil quality in Central Iran. Agric
Ecosyst Environ 121:309–318
Raiesi F (2012a) Land abandonment effect on N mineralization
and microbial biomass N in a semi-arid calcareous soil
from Iran. J Arid Environ 76:80–87
Raiesi F (2012b) Soil properties and C dynamics in abandoned
and cultivated farmlands in a semi-arid ecosystem. Plant
Soil 351:161–175
Rey Benayas JM, Martins A, Nicolau JM, Schulz JJ (2007)
Abandonment of agricultural land: an overview of drivers
and consequences. CAB Rev Perspect Agric Vet Sci Nutr
Nat Resour 2:057. doi:10.1079/PAVSNNR20072057
Saggar S, Yeates GW, Shepherd TG (2001) Cultivation effects
on soil biological properties, microfauna and organic
matter dynamics in Eutric Gleysol and Gleyic Luvisol soils
in New Zealand. Soil Till Res 58:55–68
SAS Institute (2005). SAS user’s guide, system-release, version
8.02. SAS Institute, Inc., Cary
Schimel DS (1986) Carbon and nitrogen turnover in adjacent
grassland and cropland ecosystems. Biogeochemistry
2:345–357
Schipper LA, Sparling GP (2011) Accumulation of soil organic
C and change in C: N ratio after establishment of pastures
on reverted scrubland in New Zealand. Biogeochemistry
104:49–58
Six J, Elliott ET, Paustian K (2000) Soil macro-aggregate
turnover and micro-aggregate formation for C sequestra-
tion under no-tillage agriculture. Soil Biol Biochem
32:2099–2103
Sparling GP (1992) Ratio of microbial biomass carbon to soil
organic carbon is sensitive indicator of changes in soil
organic matter. Aust J Soil Res 30:195–207
Templer PH, Groffman PM, Flecker AS, Power AG (2005) Land
use change and soil nutrient transformations in the LosHaitises region of the Dominican Republic. Soil Biol
Biochem 37:215–225
Vance ED, Brookes PC, Jenkinson DS (1987) An extraction
method for measuring soil microbial biomass C. Soil Biol
Biochem 19:703–707
Nutr Cycl Agroecosyst (2013) 96:215–232 231
123
Walker SM, Desanker PV (2004) The impact of land use on soil
carbon in Miombo Woodlands of Malawi. Forest Ecol
Manag 203:345–360
Zhang J, Song C, Yang W (2006) Land use effects on the dis-
tribution of labile organic carbon fractions through soil
profiles. Soil Sci Soc Am J 70:660–667
Zhang J, Song C, Wang S (2007) Dynamics of soil organic
carbon and its fractions after abandonment of cultivated
wetlands in northeast China. Soil Till Res 96:350–360
Zhang K, Dang H, Tan S, Wang Z, Zhang Q (2010) Vegetation
community and soil characteristics of abandoned agricul-
tural land and pine plantation in the Qinling Mountains,
China. Forest Ecol Manag 259:2036–2047
Zhao WZ, Xiao HL, Liu ZM, Li J (2005) Soil degradation and
restoration as affected by land use change in the semi-arid
Bashang area, northern China. Catena 59:173–186
Zhu B, Li Z, Li P, Liu G, Xue S (2010) Soil erodibility,
microbial biomass, and physical-chemical property chan-
ges during long-term natural vegetation restoration: a case
study in the Loess Plateau, China. Ecol Res 25:531–541
Zibilske LM (1994) Carbon mineralization. In: Weaver RW,
Angle JS, Bottomley PS (eds) Methods of soil analysis, part
2. Microbiological and biochemical properties, Soil Sci-
ence Society of America, Madison, WI, pp 835–864
Zornoza R, Guerrero C, Mataix-Solera J, Scow KM, Arcenegui
V, Mataix-Beneyto J (2009) Changes in soil microbial
community structure following the abandonment of agri-
cultural terraces in mountainous areas of Eastern Spain.
Appl Soil Ecol 42:315–323
232 Nutr Cycl Agroecosyst (2013) 96:215–232
123