soil organic matter dynamics in long-term temperate
TRANSCRIPT

1
Soil Organic Matter Dynamics in Long-term Temperate Agroecosystems:
Rotation and Nutrient Addition Effects
Jichen Li1, Guillermo Hernandez Ramirez1*, Mina Kiani2, Sylvie Quideau1, Elwin
Smith3, Henry Janzen3, Francis Larney3, Dick Puurveen1
1 Department of Renewable Resources, University of Alberta, Edmonton, AB
2 Department of Agricultural Sciences, University of Helsinki, P.O. Box 27, FI-00014,
Helsinki, Finland.
3 Agriculture and Agri-Food Canada, Lethbridge Research Centre, Lethbridge,
Alberta, Canada
* Corresponding author: [email protected]. Department of Renewable Resources,
University of Alberta, Edmonton, AB
Page 1 of 46C
an. J
. Soi
l. Sc
i. D
ownl
oade
d fr
om w
ww
.nrc
rese
arch
pres
s.co
m b
y H
EL
SIN
KI
UN
IV o
n 03
/08/
18Fo
r pe
rson
al u
se o
nly.
Thi
s Ju
st-I
N m
anus
crip
t is
the
acce
pted
man
uscr
ipt p
rior
to c
opy
editi
ng a
nd p
age
com
posi
tion.
It m
ay d
iffe
r fr
om th
e fi
nal o
ffic
ial v
ersi
on o
f re
cord
.

2
Abstract
Soil organic matter (SOM) is a major driver of key agroecosystem functions.
Our objective was to examine the dynamics of organic matter in whole soil,
particulate (POM; > 53 µm size) and mineral-associated (MAOM) fractions under
varying crop rotations and nutrient managements at two long-term experimental sites
(Breton and Lethbridge). Soil samples were collected from simple (2 yrs) and
complex (5 or 6 yrs) crop rotations at the 5-10 cm depth. We found associations
between SOM pools versus microbial community and soil aggregation. Compared to
cropped soils, an adjacent forest exhibited a significantly higher soil total organic
carbon (TOC) and a shift in SOM fractions with substantially higher POM. However,
the forest soil had the lowest microbial biomass C (MBC) among all the assessed land
use systems (P<0.05), suggesting that other factors than the amount of labile SOM
(i.e., POM-C) were controlling the microbial community. When contrasted to simple
2-yr rotations, the complex rotations including perennials and legumes significantly
raised TOC and soil total nitrogen (TN) as well as the stable SOM fraction (i.e.,
MAOM-C and -N) consistently for both Breton and Lethbridge sites. Our findings
highlight that varying land managements have profound feedbacks on soil quality as
mediated by alterations in long-term SOM dynamics.
Keywords:
Agroecosystem, Microbial biomass, Soil organic matter, Aggregation, Soil quality
Introduction
Page 2 of 46C
an. J
. Soi
l. Sc
i. D
ownl
oade
d fr
om w
ww
.nrc
rese
arch
pres
s.co
m b
y H
EL
SIN
KI
UN
IV o
n 03
/08/
18Fo
r pe
rson
al u
se o
nly.
Thi
s Ju
st-I
N m
anus
crip
t is
the
acce
pted
man
uscr
ipt p
rior
to c
opy
editi
ng a
nd p
age
com
posi
tion.
It m
ay d
iffe
r fr
om th
e fi
nal o
ffic
ial v
ersi
on o
f re
cord
.

3
Retaining and developing soil quality is crucial for achieving sustainable
agriculture systems. When focusing on soil quality status, the quantity and
composition of soil organic matter (SOM) emerges as one of the key criteria that
govern the overall performance of most land use systems (Coulter et al., 2009).
Among soil properties, SOM plays a driving role on soil quality responses by
supporting soil nutrient turnover and availability (Curtin et al., 2012). Most nutrients
necessary for the growth of plants and soil organisms are sourced by SOM
mineralization. Within common agriculture systems, implementation of beneficial
land management practices and cropping strategies is a feasible approach to improve
SOM contents and enhance soil quality (Coulter et al., 2009). As suggested by earlier
long-term studies (Shrestha et al., 2015), when changing crop management practices
such as nutrients additions and crop rotation sequences, the contents, distribution and
transformation of SOM pools responded in conjunction with alterations in other
physical, chemical and biological soil properties (Islam and Weil, 2000).
Examination of SOM partitioning and allocation between labile particulate
organic matter (POM) and stabilized mineral associated organic matter (MAOM)
under contrasting land management can be an effective approach to understand how
soil, plants and microbes interact with management and environmental conditions,
influence C cycling, and change soil quality (Figueiredo et al., 2010; Castro et al.,
2015). While the labile POM pool cycles rapidly and controls the short-term
availability of nutrients (including carbon that supports microbial activity and
Page 3 of 46C
an. J
. Soi
l. Sc
i. D
ownl
oade
d fr
om w
ww
.nrc
rese
arch
pres
s.co
m b
y H
EL
SIN
KI
UN
IV o
n 03
/08/
18Fo
r pe
rson
al u
se o
nly.
Thi
s Ju
st-I
N m
anus
crip
t is
the
acce
pted
man
uscr
ipt p
rior
to c
opy
editi
ng a
nd p
age
com
posi
tion.
It m
ay d
iffe
r fr
om th
e fi
nal o
ffic
ial v
ersi
on o
f re
cord
.

4
decomposition processes), the stable MAOM pool serves as a long-term nutrient
storage reservoir with relatively slow turnover rate in soils; hence, both POM and
MAOM pools mediate the effects of management practices on the capacity or quality
of soils to sustain agricultural systems (Gregorich et al., 1994; Muñoz-Romero et al.,
2017). As nitrogen and carbon dynamics influence and interplay with several other
key soil properties and processes (nutrient availability, biological activity, soil
structure, and water availability), the dynamics of these SOM pools is a multi-faceted,
paramount controlling factor for soil quality in soil-plant systems (Gregorich et al.,
1994; Bhowmik et al., 2017).
Particulate organic matter (POM), which typically represents the most recent
addition of the plant material to the soil, has been proven as a sensitive indicator of
the change in soil C and N under different managements (Cambardella & Elliott, 1993;
Bu et al., 2015). When comparing two simple biennial crop rotations, Bu et al. (2015)
documented increases in N mineralization and microbial biomass with higher
presence and decomposition of POM. They attributed these relationships to varying
quality and bioavailability of POM fraction as a substrate and source for N supply.
Previous reports describe the impacts of common cropping systems and intensity on
SOM accumulation in the short term, but few studies have focused on the change of
labile POM and stabilized MAOM pools under long-term experimentation where
management effects and SOM partitioning can be assessed once the system has
reached steady state. A recent study reported no long-term effects of various simple
Page 4 of 46C
an. J
. Soi
l. Sc
i. D
ownl
oade
d fr
om w
ww
.nrc
rese
arch
pres
s.co
m b
y H
EL
SIN
KI
UN
IV o
n 03
/08/
18Fo
r pe
rson
al u
se o
nly.
Thi
s Ju
st-I
N m
anus
crip
t is
the
acce
pted
man
uscr
ipt p
rior
to c
opy
editi
ng a
nd p
age
com
posi
tion.
It m
ay d
iffe
r fr
om th
e fi
nal o
ffic
ial v
ersi
on o
f re
cord
.

5
biennial rotations on POM concentrations (Diochon et al. 2016); however, reports
assessing complex, diverse crop rotations are still lacking in the literature. Moreover,
intensive manure or fertilizer addition has been regarded as an approach to increase
soil TOC and fertility (Liu et al, 2013). However, few studies have focused on how
long-term application of manuring versus inorganic fertilization may differentially
affect the concentration and distribution of organic C fractions and soil quality
indicators. Such new knowledge will aid to understand the different functions and
feedbacks of varying cropping and nutrient addition practices on SOM
transformations and accrual.
Earlier studies show that crop rotation systems including diverse crop species
have significant effect on stabilizing the soil macroaggregates as well as improving
porosity and bulk density (Balota et al., 2004). Such improvement in soil
macroaggregation has been associated with the enhancement of the soil POM fraction
(Aoyama et al., 1999). Castro et al. (2015) also recently reported increased POM as a
function of increased crop diversity in their rotations. Moreover, changes in SOM
pools and transformations can also have a great impact on soil biology. Soil biological
properties have increasingly been studied by researchers as another sensitive indicator
of changes in soil quality as caused by the choice of cropping management options
(Kennedy & Papendick, 1995). This preeminent focus on soil biology is in part
because microbial community plays a key mediating role in SOM turnover processes
(Powlson et al., 1987). Previous reports showed that a greater soil microbial activity
Page 5 of 46C
an. J
. Soi
l. Sc
i. D
ownl
oade
d fr
om w
ww
.nrc
rese
arch
pres
s.co
m b
y H
EL
SIN
KI
UN
IV o
n 03
/08/
18Fo
r pe
rson
al u
se o
nly.
Thi
s Ju
st-I
N m
anus
crip
t is
the
acce
pted
man
uscr
ipt p
rior
to c
opy
editi
ng a
nd p
age
com
posi
tion.
It m
ay d
iffe
r fr
om th
e fi
nal o
ffic
ial v
ersi
on o
f re
cord
.

6
was observed in diverse crop rotation systems compared to traditional mono-cropping
management (Dick, 1984). However, the specific relationships between SOM pools
and the associated microbial community are still subject to examination and further
characterization. Hence, there is a need to continue investigating how shifts in SOM
pools relate to changes in microbial community as well as how the presence of
particular microbial species changes under different soil conditions and contrasting
land use systems. The objectives of our study were to: (i) evaluate the long-term
impacts of different crop rotations and nutrient additions on SOM accrual, pools, and
distribution, and (ii) assess functional relationships between SOM size-fractions and
selected soil quality indicators including structure and microbial biomass.
Materials and Methods
3.1. Study sites
Our study was conducted at two long-term field sites. The University of
Alberta Experiment Plots in Breton (53.089°N, 114.442°W) and the Agriculture and
Agri-Food Canada’s Lethbridge Research and Development Centre (49.705°N,
112.775°W). The loamy soils in Breton and Lethbridge plots are classified as Orthic
Gray Luvisols and Orthic Dark Brown Chernozems, respectively, based on the
Canadian System of Soil Classification (AGRASID, 2015). Particle size, analyzed
through the hydrometer method, showed a granulometric distribution of 362 g kg-1 of
sand (2000–50 µm size diameter), 444 g kg-1 of silt (50–2 µm), and 194 g kg-1 of clay
(<2 µm) for Breton and 432 g kg-1 of sand, 304 g kg-1 of silt and 264 g kg-1 of clay for
Page 6 of 46C
an. J
. Soi
l. Sc
i. D
ownl
oade
d fr
om w
ww
.nrc
rese
arch
pres
s.co
m b
y H
EL
SIN
KI
UN
IV o
n 03
/08/
18Fo
r pe
rson
al u
se o
nly.
Thi
s Ju
st-I
N m
anus
crip
t is
the
acce
pted
man
uscr
ipt p
rior
to c
opy
editi
ng a
nd p
age
com
posi
tion.
It m
ay d
iffe
r fr
om th
e fi
nal o
ffic
ial v
ersi
on o
f re
cord
.

7
Lethbridge (Kiani, et al. 2017). Soil clay mineralogy in both sites is dominant by
smectite, kaolinite and illite, with presence of evaporates such as calcite and gypsum
in Lethbridge (Pawluk et al., 1961; Kohut and Dudas, 1993; Kohut and Dudas, 1994;
Plante et al., 2010). Bulk density of Breton soils under cropping ranged from
1.27-1.41 g cm-3, while for soils in Lethbridge, bulk density lies within the range of
1.32 to1.50 g cm-3. According to the long-term climate data (20 yrs, Jan 1997 to Dec
2006) collected from permanent weather stations located in each field sites, the mean
annual air temperature is 2.1 °C in Breton and 5 °C in Lethbridge, and the mean
annual precipitation is 547 ± 37 mm in Breton (ranging from 374 to 726 mm), and
402 ± 43 mm in Lethbridge (ranging from 204 to 608 mm) (Alberta - Weather
Conditions and Forecast, 2016).
3.2. Soil sample collection and analysis method
Two crop rotations, both established in 1929, were selected for our study at the
Breton Plots site. One is a 2-yr wheat–fallow rotation and the other is a 5-yr rotation
with a sequence of wheat–oat–barley/hay–hay1–hay2. Alfalfa and brome-grass were
included in the hay phases since 1967 (Kiani et al., 2017). Three nutrient
managements were applied for each rotation in Breton, including balanced
fertilization (N-P-K-S fertilizer), manure, and control which received no additional
nutrients. In balanced fertilization management, inorganic fertilizers were applied at
the rates of 22 kg P ha−1, 46kg K ha−1, 5.5 kg S ha−1, and the N rate depended on the
crop and its place in the rotation (wheat on fallow: 90 kg N ha−1; wheat after forage:
Page 7 of 46C
an. J
. Soi
l. Sc
i. D
ownl
oade
d fr
om w
ww
.nrc
rese
arch
pres
s.co
m b
y H
EL
SIN
KI
UN
IV o
n 03
/08/
18Fo
r pe
rson
al u
se o
nly.
Thi
s Ju
st-I
N m
anus
crip
t is
the
acce
pted
man
uscr
ipt p
rior
to c
opy
editi
ng a
nd p
age
com
posi
tion.
It m
ay d
iffe
r fr
om th
e fi
nal o
ffic
ial v
ersi
on o
f re
cord
.

8
50 kg N ha−1; oats or barley after wheat: 75 kg N ha−1; barley under seeded to hay: 50
kg N ha−1; legume-grass forages: 0 kg N ha−1). The N application via manure also
depended on the rotation (2-yr rotation: 90 kg N ha−1 during cropped years; cereal
crops in 5-yr rotation: 175 kg N ha−1 every 5 years applied in two equal applications)
(Kiani et al., 2017).
Field samples at the fallow phase in 2-yr rotation and the samples at oat and
Hay2 phases in 5-yr rotation were collected in June 2014 and 2015 shortly following
spring crop planting in order to examine the effects of the previous year’s rotation
phase (i.e., wheat phase in 2yr rotation, wheat phase in 5yr rotation and hay1 phase in
5yr rotation, respectively). Soil samples from an adjacent forest were also collected as
a reference location that represented the native vegetation in Breton site. With three
nutrient managements for each of the selected phases, there were in total ten sampling
locations at the Breton site.
For the Lethbridge site, there were also two rotations involved: a 2-yr wheat–
fallow rotation established in 1985 and a 6-yr fallow–wheat1–wheat2–alfalfa1–
alfalfa2–alfalfa3 rotation established in 1951. Alfalfa and crested wheat grass were
included in the alfalfa phases in the 6yr rotation. The fertilization management
included ammonium nitrate broadcasted in the early spring prior to any tillage or
seeding at a rate of 45 kg N ha−1 on the wheat phase of the 2-yr rotation. Fertilizer P
(0-45-0) was applied to wheat at 22.5 kg P ha-1 from 1985 to 1994, 20 kg P ha-1 from
1995 to 2000, and 11 kg P ha-1 from 2001 to present. For the 6-yr rotation, triple super
Page 8 of 46C
an. J
. Soi
l. Sc
i. D
ownl
oade
d fr
om w
ww
.nrc
rese
arch
pres
s.co
m b
y H
EL
SIN
KI
UN
IV o
n 03
/08/
18Fo
r pe
rson
al u
se o
nly.
Thi
s Ju
st-I
N m
anus
crip
t is
the
acce
pted
man
uscr
ipt p
rior
to c
opy
editi
ng a
nd p
age
com
posi
tion.
It m
ay d
iffe
r fr
om th
e fi
nal o
ffic
ial v
ersi
on o
f re
cord
.

9
phosphate was broadcasted at a rate of 50 kg P ha-1 prior to the spring tillage during
the establishment of the alfalfa1 plots. The experiment is arranged in a randomized
complete block design. The four replicates in this experiment were sampled for each
selected phase. In further detail, all phases within the two rotations were sampled
except alfalfa2 in the 6-yr rotation, so there were 28 sampling plots in total (Kiani et
al., 2017). In contrast to the Breton site where an adjacent native vegetation (forest)
location was available for soil sampling, an immediately adjacent location to sample
soils under native vegetation (prairie) was unavailable in Lethbridge site. At both
study sites, aboveground plant residues were left on the soil surface following the
grain harvest operations for the annual crops and the forage hay removal for the
grass-legume mixes.
For chemical and microbial analyses, disturbed soil samples were collected in
each field by mixing 4 subsamples taken using a 2-cm inner diameter push probe
(three samples per plot for Breton, and one for Lethbridge). These disturbed samples
were placed in the Whirl-Pak® (Nasco, Fort Watkins, Wisconsin) sterile sampling
bags and transported in an icebox to the laboratory. Samples for microbial
characterization were kept frozen at −86 °C until they were freeze-dried in
preparation for analysis. Within each sampling plot, all soil samples were taken at
randomly selected sampling points and at the depth increment of 5-10 cm. Soil
undisturbed clods (~ 500 cm3) were also excavated from each plot with a shovel at
the 5-cm depth (three samples per plot for Breton, and two for Lethbridge). Clods
Page 9 of 46C
an. J
. Soi
l. Sc
i. D
ownl
oade
d fr
om w
ww
.nrc
rese
arch
pres
s.co
m b
y H
EL
SIN
KI
UN
IV o
n 03
/08/
18Fo
r pe
rson
al u
se o
nly.
Thi
s Ju
st-I
N m
anus
crip
t is
the
acce
pted
man
uscr
ipt p
rior
to c
opy
editi
ng a
nd p
age
com
posi
tion.
It m
ay d
iffe
r fr
om th
e fi
nal o
ffic
ial v
ersi
on o
f re
cord
.

10
were wrapped in aluminum foil and plastic sampling bags to prevent significant
moisture loss, and placed in a plastic container to minimize disturbance during
transport from the field. The field protocol for collecting undisturbed samples
consistently excluded the top 5 cm of soil to prevent potential extreme effects due to
high presence of plant roots and litter near soil surface in particular in soils under
forest and perennial crops as well as surface crusting and excessive dryness in
particular in soils under fallow. As a sole soil sampling depth, the 5-10 cm increment
was collected to reflect and compare the potential effects of contrasting land
management systems on soil quality and SOM dynamics.
3.3. Soil particulate organic matter
The particulate organic matter (POM) fraction in our study referred to all soil
organic matter particles between 0.053 to 2 mm in size diameter (Cambardella and
Elliot, 1992, Hernandez-Ramirez et al., 2011). Prior to dispersing the soil, moisture
content of each air-dried soil sample was measured by drying 10 g of soil sample in
the oven (50 °C) for 24 hours to conduct a moisture content correction. Soil
dispersion was conducted using sodium hexametaphosphate as recommended in
international standard ISO 11277; this chemical method aims at dispersing aggregates
into soil particles (Ryzak and Bieganowski, 2011). Ten grams (oven dry equivalent
weight) of non-ground, air dried soil sample, 20 mL of degassed deionized water, and
10 mL of 1.5% Na-hexametaphosphate were added into a 50 mL centrifuge tubes and
dispersed overnight (24 hr) by horizontal reciprocal shaker at a rate of 120 rpm. After
Page 10 of 46C
an. J
. Soi
l. Sc
i. D
ownl
oade
d fr
om w
ww
.nrc
rese
arch
pres
s.co
m b
y H
EL
SIN
KI
UN
IV o
n 03
/08/
18Fo
r pe
rson
al u
se o
nly.
Thi
s Ju
st-I
N m
anus
crip
t is
the
acce
pted
man
uscr
ipt p
rior
to c
opy
editi
ng a
nd p
age
com
posi
tion.
It m
ay d
iffe
r fr
om th
e fi
nal o
ffic
ial v
ersi
on o
f re
cord
.

11
dispersion, soils were transferred through a set of nested sieves with mesh size of 2
and 0.053 mm to obtain different soil size fractions. Organic matter remaining on the
0.053-mm sieve was the POM fraction with a size range of 0.053 to 2.0 mm. POM on
the 0.053 mm sieve was transferred into a beaker and oven dried at a temperature of
50 °C to remove all the moisture until constant mass was achieved (72 hours). The
POM samples in the beaker were weighted, ground to powder consistency and stored
in 20 mL vials at room temperature.
3.4. Soil carbon and nitrogen
Particulate organic matter carbon (POM-C) and particulate organic matter
nitrogen (POM-N) of each soil sample were measured by the dry combustion method
using a Costech ECS 4010 Elemental Analyzer (Costech Analytical Technologies Inc.,
Valencia, CA, USA). This method was also used to measure the content of total soil
organic carbon (TOC) and soil total nitrogen (TN) from composited, ground soil
samples. In our research, we assumed that the total organic carbon (TOC) present in
the whole soil can be further divided into two fractions: POM-C and MAOM-C. To
calculate the concentration of MAOM-C, we simply subtracted the concentrations (g
kg-1 soil) of total organic carbon in whole soil from the concentration of the POM-C
for each soil sample as follow:
MAOM-C = WholesoilTOC − POM-C [1]
Fractions of POM-C and MAOM-C relative to the total soil carbon (ratios)
were also calculated to examine the proportional change, partitioning and allocation
Page 11 of 46C
an. J
. Soi
l. Sc
i. D
ownl
oade
d fr
om w
ww
.nrc
rese
arch
pres
s.co
m b
y H
EL
SIN
KI
UN
IV o
n 03
/08/
18Fo
r pe
rson
al u
se o
nly.
Thi
s Ju
st-I
N m
anus
crip
t is
the
acce
pted
man
uscr
ipt p
rior
to c
opy
editi
ng a
nd p
age
com
posi
tion.
It m
ay d
iffe
r fr
om th
e fi
nal o
ffic
ial v
ersi
on o
f re
cord
.

12
of organic matter into these C pools as a function of land management. These
calculation approaches were also applied to the soil nitrogen data to derive MAOM-N
concentration and fraction, and POM-N fraction.
3.5. Soil fractal aggregation
One approach to quantify the development of soil aggregation is by
determining the mass fractal dimension of the soil aggregates. Fractal dimension (Dm)
is a measure of how soil aggregates are hierarchically organized in soils and can be
obtained using the following equation:
M�v� = K�V�� [2]
In this equation, M(v) is the mass of aggregates (g) with volume v (cm3), �� is a
constant representing the mass of aggregate unit volume, and �� is the fractal
dimension (Hebb et al., 2017; Kiani et al., 2017). Larger aggregates have a lower
mass to volume ratio as explained by the porosity exclusion principle (Hirmas et al.,
2013); denser micro-aggregates are bonded to form macro-aggregates with greater
porosity. Therefore, a lower the �� value represents an increasing hierarchical
aggregation and improved soil structure. The laboratory analyses consisted of
quantifying mass and volume for a range of undisturbed soil aggregates using
multistripe laser triangulation scanning (3D Scanner Ultra HD, NextEngine,
California). Parent clods (~500 cm3) were broken down into five smaller size classes
(i.e. 4-8, 2-4, 1-2, 0.5-1, and 0.25-0.5 cm diameter) and two aggregates from each
class were randomly selected and scanned to obtain a 3D image to determine
Page 12 of 46C
an. J
. Soi
l. Sc
i. D
ownl
oade
d fr
om w
ww
.nrc
rese
arch
pres
s.co
m b
y H
EL
SIN
KI
UN
IV o
n 03
/08/
18Fo
r pe
rson
al u
se o
nly.
Thi
s Ju
st-I
N m
anus
crip
t is
the
acce
pted
man
uscr
ipt p
rior
to c
opy
editi
ng a
nd p
age
com
posi
tion.
It m
ay d
iffe
r fr
om th
e fi
nal o
ffic
ial v
ersi
on o
f re
cord
.

13
aggregate volume. Repeated laser scanning (n= 20) were used to assure the precision
of the volume measurement. Details about measuring fractal dimension were
described by Hebb et al. (2017).
3.6. Microbial community
Soil microbial communities were characterized using phospholipid fatty acid
(PLFA) analysis (Kiani et al., 2017). Polar lipids were extracted from freeze-dried
samples using a modified Bligh and Dyer protocol (Hannam et al., 2006). The
resulting fatty-acid methyl esters were separated using an Agilent 6890 Series
capillary gas chromatograph (Agilent Technologies, Wilmington, DE, USA).
Individual peaks were identified and quantified (nmol g-1) using the MIDI peak
identification software (MIDI, Inc., Newark, DE, USA). The PLFAs containing 14 to
20 carbon atoms were representative of the soil microbial community (Quideau et al.,
2016). They were summed and used as an index of microbial biomass carbon. In
addition, specific PLFA biomarkers were assigned to different microbial groups,
including gram-positive and gram-negative bacteria, fungi, and protists.
3.7. Statistical analysis
For the Lethbridge data, we use Bartlett’s and Shapiro-Wilk’s tests for
assessing the normality and equal variance of the data. A two-way analysis of variance
(ANOVA) with mixed models followed by Tukey’s tests were used to determine
significant differences across rotations and phases for TOC, POM-C concentration
and fraction, MAOM-C concentration and fraction, TN, POM-N concentration and
Page 13 of 46C
an. J
. Soi
l. Sc
i. D
ownl
oade
d fr
om w
ww
.nrc
rese
arch
pres
s.co
m b
y H
EL
SIN
KI
UN
IV o
n 03
/08/
18Fo
r pe
rson
al u
se o
nly.
Thi
s Ju
st-I
N m
anus
crip
t is
the
acce
pted
man
uscr
ipt p
rior
to c
opy
editi
ng a
nd p
age
com
posi
tion.
It m
ay d
iffe
r fr
om th
e fi
nal o
ffic
ial v
ersi
on o
f re
cord
.

14
fraction, MAOM-C concentration and fraction, whole soil C:N, POM C:N, MAOM
C:N, MBC and Dm. When a significant effect was detected based on the ANOVA
models (p < 0.05), Tukey HSD tests were subsequently run to compare means and
identify any treatment grouping structure.
For the Breton site (established in 1929), since there is no experimental
design or randomized replication to allow for conventional parametric statistical tests,
we used nonparametric Dunn's test as well as Kruskal–Wallis test to determine
significant differences across rotations, phases and the different nutrient managements
at the Breton plots. All our statistical analyses were accomplished using SAS 9.1
(SAS Institute, 2015) and SigmaStat 13 (Systat Software, 2014) with a critical level
alpha of 0.05.
Pearson and Spearman correlations were used for both Lethbridge and Breton
sites separately to assess the association among all available properties and SOM
fractions.
Results
4.1. Organic Carbon and Total Nitrogen in Whole Soil
In our study, the TOC and TN concentrations were affected by rotation type
and nutrient management in the two long-term experimental sites. At the Breton site,
TOC from adjacent forest plots was significantly greater than in the crop rotations (P
< 0.001) (Table 1). Both TOC and TN were significantly higher in the 5-yr rotation
Page 14 of 46C
an. J
. Soi
l. Sc
i. D
ownl
oade
d fr
om w
ww
.nrc
rese
arch
pres
s.co
m b
y H
EL
SIN
KI
UN
IV o
n 03
/08/
18Fo
r pe
rson
al u
se o
nly.
Thi
s Ju
st-I
N m
anus
crip
t is
the
acce
pted
man
uscr
ipt p
rior
to c
opy
editi
ng a
nd p
age
com
posi
tion.
It m
ay d
iffe
r fr
om th
e fi
nal o
ffic
ial v
ersi
on o
f re
cord
.

15
than the 2-yr rotation (Ps < 0.03). Manure addition also had significantly greater TOC
and TN than both the inorganic balanced fertilization and the control soils. With
respect to soil C:N ratio, although there was no significant difference between the two
rotation types and nutrient management practices, cropland systems as a whole had
significantly narrower C:N ratio compared to the undisturbed forest soil (P < 0.001;
Table 1). Additionally, at the Lethbridge site, TN was significantly higher in the 6-yr
complex crop rotation; TOC was also numerically greater in this 6-yr rotation
although not statistically significant (Table 2). Within all the phases of the 6-yr
rotation, alfalfa phase had significantly greater TN than both wheat phase and fallow
phase. No significant difference in soil C:N ratio was found among treatments for the
Lethbridge site.
4.2. Carbon and Nitrogen within POM and MAOM Fractions
Soil organic carbon and nitrogen in the different SOM size fractions were
strongly affected by the crop rotation type. At the Breton site, a significant increase in
mineral associated (MAOM) carbon fraction was observed in crop sites when
compared to the adjacent forest site (P < 0.001). The POM-C fraction in the forest soil
was 44% of the total soil organic C; and after about 86 years of continuous cropping,
this POM-C had sharply decreased to 25% of the total soil carbon (Table 1), likely
reflecting an increased disturbance and reduced C inputs to the soils under agricultural
uses. A similar trend was also found in POM nitrogen fraction of the whole soil.
Implementation of continuous cropping in this landscape where native vegetation had
Page 15 of 46C
an. J
. Soi
l. Sc
i. D
ownl
oade
d fr
om w
ww
.nrc
rese
arch
pres
s.co
m b
y H
EL
SIN
KI
UN
IV o
n 03
/08/
18Fo
r pe
rson
al u
se o
nly.
Thi
s Ju
st-I
N m
anus
crip
t is
the
acce
pted
man
uscr
ipt p
rior
to c
opy
editi
ng a
nd p
age
com
posi
tion.
It m
ay d
iffe
r fr
om th
e fi
nal o
ffic
ial v
ersi
on o
f re
cord
.

16
been forest had significantly depleted the POM-N fraction from 34% to 20% on
average (P < 0.001; Table 1). However, when comparing between the 2-yr rotation
and 5-yr rotation in the Breton Plots, although there was a significant increase in
MAOM-C and -N concentration in complex crop rotation (P= 0.014; P= 0.004), no
significant difference was observed in POM and MAOM fractions between these two
crop rotation types. Conversely, at the Lethbridge site, the complex rotation including
legumes and perennials had significantly greater POM-C and -N fractions than the
2-yr rotation (Table 2). Moreover, within the 6-yr complex rotation at Lethbridge, the
two evaluated alfalfa phases consistently resulted in significantly higher MAOM-N
concentrations and fractions than the two wheat phases in this same rotation.
The POM C:N ratio became significantly narrower in the soils under the
Breton crop rotations compared to the adjacent forest land (P<0.001; Table 1).
Nevertheless, there was no significant difference in POM C:N ratio across the rotation
types or the nutrient management practices. Regarding nutrient management options,
both manure and inorganic balanced fertilization addition had significantly greater
POM-C and -N fraction than the control soils (P< 0.001) (Table 1).
4.3. Fractal dimension (Dm) of soil aggregation
Focusing on soil fractal aggregation as indicator of hierarchical soil structure
development, soils were significantly fractal under both the forest and complex
rotation in Breton (P < 0.05; Table 1) and a significant difference in fractal
aggregation between forest and croplands was detected (P < 0.05; Table 1); more
Page 16 of 46C
an. J
. Soi
l. Sc
i. D
ownl
oade
d fr
om w
ww
.nrc
rese
arch
pres
s.co
m b
y H
EL
SIN
KI
UN
IV o
n 03
/08/
18Fo
r pe
rson
al u
se o
nly.
Thi
s Ju
st-I
N m
anus
crip
t is
the
acce
pted
man
uscr
ipt p
rior
to c
opy
editi
ng a
nd p
age
com
posi
tion.
It m
ay d
iffe
r fr
om th
e fi
nal o
ffic
ial v
ersi
on o
f re
cord
.

17
specifically, the simple 2-yr rotation did not result in fractal aggregation. When
comparing across each crop rotation phase, soils were not significantly fractal at
fallow phases of both simple and complex rotations in Lethbridge (0.987 and 0.993,
respectively; Table 2), indicating the lack of soil structural development. A similar
result was also found in Breton with a nonfractal soil wheat phase in the simple
wheat-fallow rotation (i.e., 0.991). On the contrary, the wheat phases in complex
rotations exhibited clear fractal aggregation (Dm values significantly different than
one). Focusing on nutrient addition, regimes at the Breton site, only long-term
balanced fertilization showed significantly fractal aggregation (Dm= 0.965, P <0.001;
Table 1), suggesting progressive development of soil hierarchical aggregation.
Likewise, these results also showed an improved soil hierarchical fractal aggregation
under complex rotations including perennial legumes and grasses.
4.4. Soil microbial biomass carbon
At both study sites, we found that soil MBC (nmol g-1) had increased
significantly with the complex rotations. At the Breton site, MBC in the 5-yr rotation
was about 1.5 times greater than in both the forested and 2-yr rotation soils (P = 0.01;
Table 1). The same trend was found at the Lethbridge site where MBC in the complex
crop rotation was about 19% greater than in the simple rotation (P = 0.05; Table 2).
No significant differences in MBC were found between phases within these long-term
rotations. Regarding the nutrient management comparisons at the Breton site, a large
increase in MBC was observed for the manured soils when compared to the control
Page 17 of 46C
an. J
. Soi
l. Sc
i. D
ownl
oade
d fr
om w
ww
.nrc
rese
arch
pres
s.co
m b
y H
EL
SIN
KI
UN
IV o
n 03
/08/
18Fo
r pe
rson
al u
se o
nly.
Thi
s Ju
st-I
N m
anus
crip
t is
the
acce
pted
man
uscr
ipt p
rior
to c
opy
editi
ng a
nd p
age
com
posi
tion.
It m
ay d
iffe
r fr
om th
e fi
nal o
ffic
ial v
ersi
on o
f re
cord
.

18
fields (Table 1).
4.4. Correlation analyses among soil properties
Several significant correlations were found among soil properties across the
assessed land-use systems and nutrient management regimes. At the Breton site, both
POM carbon and nitrogen fraction were significantly correlated with TOC (P < 0.01,
Table 3), while in Lethbridge, no significant relationship was observed. When
examining the association between soil fractal aggregation and SOM fractions, we
found that TOC and POM-C concentration were both inversely correlated with the
Dm value in Breton soils (ρ= -0.363; ρ= -0.354; Ps < 0.01, Table 3). Significantly
improved soil fractal aggregation was also observed with increasing C:N ratios in
both POM and MAOM fractions (ρ= -0.628; ρ= -0.421; P < 0.05; P < 0.01;
respectively). These observations were further supported by a significant linear
regression (Dm = 1.07 – 0.0073 POM-C:N; P < 0.001) which also registered a
moderate goodness-of-fit (R2) of 39% (data not shown). No such significant patterns
were found for the Lethbridge site as these Chernozemic soils can be considered more
resilient by nature when compared to the Luvisolic soils at Breton, and hence, the
soils at the Breton site are expected to be relatively more responsive to management
choices.
In terms of MBC, a weak but significant correlation was found with TN (ρ=
0.338; P < 0.05), and a slightly stronger correlation was observed with MAOM-N (ρ=
0.424; P < 0.05) (Table 3). A regression analysis described well the direct, linear
Page 18 of 46C
an. J
. Soi
l. Sc
i. D
ownl
oade
d fr
om w
ww
.nrc
rese
arch
pres
s.co
m b
y H
EL
SIN
KI
UN
IV o
n 03
/08/
18Fo
r pe
rson
al u
se o
nly.
Thi
s Ju
st-I
N m
anus
crip
t is
the
acce
pted
man
uscr
ipt p
rior
to c
opy
editi
ng a
nd p
age
com
posi
tion.
It m
ay d
iffe
r fr
om th
e fi
nal o
ffic
ial v
ersi
on o
f re
cord
.

19
relationship between these soil properties (i.e., MBC = 1186 + 815 MAOM-N, P =
0.006, R2 = 0.19; data not shown). Regarding the association between soil properties
and microbial biomarkers at the Breton site, fungal biomass was strongly correlated
with both the TOC and POM-C (ρ= 0.400; ρ= 0.371; respectively; Ps < 0.05; Table 3).
Furthermore, occurrence of fungi biomarkers tended to increase with POM-C while it
decreased with MAOM-C, although these patterns were not statistically significant.
As opposed to fungi, protozoa biomarker abundance was strongly correlated with TN
(ρ= 0.467; P < 0.001; Table 3) and also associated with MAOM-N (ρ= 0.561; P <
0.001). Concurrently, wider C:N ratios were clearly associated with an increasing
fungi biomarker presence, and an opposite response was observed for protozoa, which
also corresponded with our MBC results as noted above (i.e., declining MBC and
protozoa occurrence with wider C:N ratios; Table 3).
Page 19 of 46C
an. J
. Soi
l. Sc
i. D
ownl
oade
d fr
om w
ww
.nrc
rese
arch
pres
s.co
m b
y H
EL
SIN
KI
UN
IV o
n 03
/08/
18Fo
r pe
rson
al u
se o
nly.
Thi
s Ju
st-I
N m
anus
crip
t is
the
acce
pted
man
uscr
ipt p
rior
to c
opy
editi
ng a
nd p
age
com
posi
tion.
It m
ay d
iffe
r fr
om th
e fi
nal o
ffic
ial v
ersi
on o
f re
cord
.

20
Discussion
5.1 Cropping leads to depletion of SOM
Cultivating undisturbed forest soil for agricultural use in the long term can
result in a significant alteration in soil properties including depletions of SOM
concentrations, decreasing labile SOM contents (i.e., POM) as well as microbial
presence (Beheshti et al., 2012; Kiani et al., 2017). Soil TOC content was
significantly depleted in the Breton crop rotations compared to the forest (P < 0.001)
(Table 1), while the 2-yr and 5-yr rotations did not differ with each other in their
overall TOC contents. Moreover, the particulate organic carbon (POM) contents in the
crop rotations were also significantly lower than that of the forest ecosystem.
Congruently, when focusing on the mineral associated organic matter (MAOM) as a
fraction, the 2-yr simple rotation and 5-yr complex rotation were not different with
each other, but they were collectively higher than the adjacent forest soils in the SOM
partitioning into this stable pool (Table 1). Similar tendencies were also found in soil
nitrogen contents and fractions.
Recurrently annual cropping practices such as tillage and seeding can cause
degradation of soil structure and aggregation resulting also in decreasing SOM
(Ashagrie et al., 2007). The POM losses from our soils under cropping can have been
triggered by low plant C inputs or by accelerated rates of biological decomposition of
both plant residues and labile SOM in soil in part due to repeated disturbance by
cultivation as well as the transfer of portion of the existing or recently-added C from
Page 20 of 46C
an. J
. Soi
l. Sc
i. D
ownl
oade
d fr
om w
ww
.nrc
rese
arch
pres
s.co
m b
y H
EL
SIN
KI
UN
IV o
n 03
/08/
18Fo
r pe
rson
al u
se o
nly.
Thi
s Ju
st-I
N m
anus
crip
t is
the
acce
pted
man
uscr
ipt p
rior
to c
opy
editi
ng a
nd p
age
com
posi
tion.
It m
ay d
iffe
r fr
om th
e fi
nal o
ffic
ial v
ersi
on o
f re
cord
.
21
labile into a recalcitrant SOM pool (Cambardella and Elliott, 1992). The seminal
study by Cambardella and Elliott reported that POM is frequently protected inside of
soil aggregates and that soil aggregates broken-up by cultivation would expose POM
to microbial decomposition, reducing its concentration, and consequently, part of
POM-C is lost to the atmosphere via biological oxidation and any remaining C from
these processes can be transformed into more stable mineral-associated organic matter
(MAOM) (Figueiredo et al., 2010). In our study, changes in SOM (both TOC and TN)
were directly associated with labile POM fraction (Tables 3 and 4). Moreover, POM
measurements lead to the detection of consistent differences between wheat and
perennial phases within the complex rotation even under the long-term management
and putative steady state condition associated with our study (POM-C for Hay >>
Wheat within Breton 5-yr rotation, Table 1), while TOC and TN data had yielded no
detectable differences for these comparison. These results further support POM as a
sensitive indicator for identifying early, short-term changes in SOM and soil quality
as function on land management options.
In annual croplands, disturbance-induced changes in driving factors such as
soil moisture, temperature or pH influence the enzymatic and microbial activities
inside the soil which collectively determine the SOM decomposition rate (Curtin et al.,
2012; Curtin et al., 2014). We infer that management-imposed disturbance stimulates
these multiplicative effects by altering the microclimate and immediate boundary
layer conditions, and consequently, resulting in a feedback towards increasing SOM
Page 21 of 46C
an. J
. Soi
l. Sc
i. D
ownl
oade
d fr
om w
ww
.nrc
rese
arch
pres
s.co
m b
y H
EL
SIN
KI
UN
IV o
n 03
/08/
18Fo
r pe
rson
al u
se o
nly.
Thi
s Ju
st-I
N m
anus
crip
t is
the
acce
pted
man
uscr
ipt p
rior
to c
opy
editi
ng a
nd p
age
com
posi
tion.
It m
ay d
iffe
r fr
om th
e fi
nal o
ffic
ial v
ersi
on o
f re
cord
.

22
decomposition.
5.2 Complex rotations alter SOM pools and partitioning
Soil organic matter plays a key role in nutrient cycling function in the soil. In
our study, this vital soil attribute has been improved in under the diverse, complex
rotations as evidenced by enhanced TOC, TN, POM and MAOM (Tables 1 and 2).
The SOM accrual and allocation is mostly determined by the balance between inputs
of animal manure and plant residues versus losses via decomposition (Curtin et al.,
2012). By introducing perennial legumes and grasses in long-term complex rotations,
an enhanced N availability may result in both a faster SOM turnover rate and an
increased crop yield which subsequently may also feedback into an even greater plant
residue input into the soil.
Evidence of accumulating carbon and nitrogen into certain SOM pools under
complex rotations compared to simple wheat-fallow rotation was observed in our
study. Specifically in Lethbridge, we also found significant change in greater soil
POM carbon and nitrogen fraction in complex rotation (Table 2), likely indicating that
the partitioning of SOM into labile pools has been increased by the diversity of crop
species included in this rotation. Compared to simple rotations, diverse crop rotations
can change soils by affecting depth of rooting, nutrient status, soil aggregation and
microbial habitat (Balota et al., 2004; Castro et al., 2015). Since most crop residues
contain much more carbon than nitrogen, introducing N-enriching legumes into
long-term crop rotations benefits the decomposition of the plant residues in the soil
Page 22 of 46C
an. J
. Soi
l. Sc
i. D
ownl
oade
d fr
om w
ww
.nrc
rese
arch
pres
s.co
m b
y H
EL
SIN
KI
UN
IV o
n 03
/08/
18Fo
r pe
rson
al u
se o
nly.
Thi
s Ju
st-I
N m
anus
crip
t is
the
acce
pted
man
uscr
ipt p
rior
to c
opy
editi
ng a
nd p
age
com
posi
tion.
It m
ay d
iffe
r fr
om th
e fi
nal o
ffic
ial v
ersi
on o
f re
cord
.

23
and increase the efficiency of the conversion rate from plant residue into stable SOM
accrual (Bowren et al, 1995). The increased fresh organic material and nutrient inputs
provided by perennial legumes, forages and grasses within complex rotations is prone
to be transformed into labile SOM pools such as POM and readily used by soil
microbial communities (Ohtonen et al., 1997; Castro et al., 2015). By contrast, with
slower SOM decomposition rate and less N availability, a scarcity of nutrient
availability such as in forest soils limits the growth of the soil microbes (Quideau et
al., 2013).
Across all assessed soils, the quality of labile SOM appears to be improved
under complex crop rotations, and the labile SOM pool seems to be more utilized and
cycled by soil microbial communities. In this context, a greater quality of labile SOM
implies enhanced bioavailability and decomposability of the POM fraction as
indicated by narrower C:N ratios (Bu et al., 2015; Castro et al., 2015; Stehlíková et al.,
2016), suggesting that utilization of this labile SOM by microbes is propensive to
occur. Moreover, it is noteworthy that although the forest soil had much higher SOM
concentration than both simple and complex rotations, the MBC values in forest land
was the lowest among all these land use systems, with 1.5 times significantly lower
MBC in the forest soil than under the complex rotation (Table 1), which may reflect
that the soil microorganisms could have limited access to decompose SOM in forest
land. The POM fraction has been often described as a labile pool of SOM (Gregorich
et al., 1994; Castro et al., 2015), but with an intermediate turnover time in afforested
Page 23 of 46C
an. J
. Soi
l. Sc
i. D
ownl
oade
d fr
om w
ww
.nrc
rese
arch
pres
s.co
m b
y H
EL
SIN
KI
UN
IV o
n 03
/08/
18Fo
r pe
rson
al u
se o
nly.
Thi
s Ju
st-I
N m
anus
crip
t is
the
acce
pted
man
uscr
ipt p
rior
to c
opy
editi
ng a
nd p
age
com
posi
tion.
It m
ay d
iffe
r fr
om th
e fi
nal o
ffic
ial v
ersi
on o
f re
cord
.

24
soils (Hernandez-Ramirez et al., 2011) as well as a relatively easily decomposable
fraction acting as a primary energy source for most soil microorganisms (Zou et al.,
2005). In our study, forest soils had a significantly greater POM-C content than the
soils under both simple and complex rotations in Breton (Table 1). This suggests that
instead of being enriched with recalcitrant C, forest soils do have abundant labile
organic carbon (as POM), but perhaps the concentration of this labile organic C is not
the key factor that drives the soil microbial activity in such forest ecosystem. When
focusing on the C:N ratios in both forests and croplands in our study, we found the
forest soils had significantly wider C:N ratios in both whole SOM and POM fraction
(P< 0.01; Table 1). This indicates that the POM lability (i.e., as propensity to undergo
utilization and decay) in forest soils may function under a very different dynamics and
controls than in cropland soils as suggested by a higher SOM-N availability under
much narrower C:N ratios in the cropland soils (Table 1) where exogenous N inputs
are common. Moreover, when examining the relationship between soil MBC and C:N
ratios in our study, we found a moderate but very consistent association of decreasing
MBC with wider C:N ratios in whole soil, POM and MAOM pools (Tables 3 and 4).
This functional relationship between soil C pools as substrates and microbial presence
has not been fully documented in the literature. Although forest ecosystems have
much lower or negligible disturbance compared to conventional croplands, nutrient
availability in forest soils could still be constrained due to wide C:N ratios (Quideau
et al., 2013), and this higher proportionality of C in forest soils may be caused by
further limited N inputs and availability which prevents the soil organic compounds
Page 24 of 46C
an. J
. Soi
l. Sc
i. D
ownl
oade
d fr
om w
ww
.nrc
rese
arch
pres
s.co
m b
y H
EL
SIN
KI
UN
IV o
n 03
/08/
18Fo
r pe
rson
al u
se o
nly.
Thi
s Ju
st-I
N m
anus
crip
t is
the
acce
pted
man
uscr
ipt p
rior
to c
opy
editi
ng a
nd p
age
com
posi
tion.
It m
ay d
iffe
r fr
om th
e fi
nal o
ffic
ial v
ersi
on o
f re
cord
.

25
from being utilized by microorganisms.
Another perspective to explain the observed TOC accruals in forest soils
compared to cropped soils may be related to differences in the temperature and soil
moisture conditions under forest cover. Warm-wet conditions can lead to lesser
organic carbon content in the soils compared to the comparatively colder-drier
scenarios as driven by the impacts of microclimate on microbial decomposition
processes. Shaded by greater, permanent canopies, soils in forest ecosystems tend to
exhibit cooler surface temperatures than cropland (Wickham et al., 2012). Such lower
temperature as well as water uptake by trees in forest soils may depress the production
and activity of soil exoenzymes, which are essential for microbes to breakdown SOM
molecules into bioavailable compounds (Miller and Dick, 1995; Curtin et al., 2012).
5.3 Complex rotations further improve other soil quality indicators
Besides an improved SOM accrual and dynamics, other key soil quality
indicators such as soil fractal aggregation (as indicated by decreasing Dm values) and
MBC were also enhanced under the longer, diverse, complex crop rotations. By
including perennial grasses and legumes (e.g., alfalfa) into complex rotation systems,
significantly fractal aggregation (Dm < 1) was readily observed. The root systems of
these perennial plant species can facilitate the development and enhancement of soil
structure (Danga et al., 2009). More interestingly, in the Breton soils, Dm was seen to
be correlated with POM-C concentration and POM C:N ratio. Collectively, these
findings intriguingly suggest that increases in POM carbon due to long-term
Page 25 of 46C
an. J
. Soi
l. Sc
i. D
ownl
oade
d fr
om w
ww
.nrc
rese
arch
pres
s.co
m b
y H
EL
SIN
KI
UN
IV o
n 03
/08/
18Fo
r pe
rson
al u
se o
nly.
Thi
s Ju
st-I
N m
anus
crip
t is
the
acce
pted
man
uscr
ipt p
rior
to c
opy
editi
ng a
nd p
age
com
posi
tion.
It m
ay d
iffe
r fr
om th
e fi
nal o
ffic
ial v
ersi
on o
f re
cord
.

26
implementation of diverse crop rotations are strongly interlinked with improvements
of hierarchical soil aggregation (Table 3). Earlier studies focusing on the reciprocal
relationship between soil aggregation and SOM have shown the mechanistic
contribution of POM in forming and preserving soil aggregates, and vice versa (i.e.,
aggregates protecting existing soil TOC). Both factors – aggregation and POM – can
putatively act synergistically leading to an enlarged whole SOM pool in the long-term.
The aggregate hierarchy model postulated by Tisdall and Oades (1982) proposes that
soil structure arises from aggregation of fine mineral particles into microaggregates
(53 to 250 µm size diameter) which continue aggregating into macroaggregates (>
250 µm) with increasing dependence on more transient, organic binding agents as the
aggregate sizes increases. As subsequently, hypothesized by Oades (1984), these
aggregating processes are considered to be closely linked with soil POM presence and
turnover; soil microaggregates will first form around POM, and then enmeshed within
stable macroaggregates. Thus, a large loss of soil TOC under recurrent cultivation
management could often be explained by a short macroaggregate turnover time, and
hence, a reduced opportunity for formation of stable microaggregates around POM
cores (Six et al., 2002). Under our long-term complex rotation management,
benefiting from new inputs of plant materials and a more dynamic C and N cycling,
enhanced soil aggregation was effectively detected because it putatively facilitates the
microaggregate formation and gradual stabilization of labile POM into the MAOM
pool (Six et al., 2000).
Page 26 of 46C
an. J
. Soi
l. Sc
i. D
ownl
oade
d fr
om w
ww
.nrc
rese
arch
pres
s.co
m b
y H
EL
SIN
KI
UN
IV o
n 03
/08/
18Fo
r pe
rson
al u
se o
nly.
Thi
s Ju
st-I
N m
anus
crip
t is
the
acce
pted
man
uscr
ipt p
rior
to c
opy
editi
ng a
nd p
age
com
posi
tion.
It m
ay d
iffe
r fr
om th
e fi
nal o
ffic
ial v
ersi
on o
f re
cord
.

27
Focusing on soil microbial community properties, we found that microbial
biomass tended to be more sensitive to the variations in soil nitrogen pools (Table 3),
and the complex crop rotations had greater MBC than the simple rotations. Based on
results for Breton site, both TN and MAOM-N were well associated with soil MBC
(P<0.05) (Table 3). These findings support our initial hypothesis that soil microbial
communities can benefit from the N inputs as provided by perennial legumes in the
complex rotations. Increasing TN and MAOM-N can benefit the soil microbial
community by providing organic N substrate that can also become eventually
available via mineralization to enhance plant productivity, which in turn contributes to
increasing soil TOC and further promoting the growth of microorganisms (Treseder et
al., 2008). Nevertheless, it should be noted that soil MBC increased with increasing
organic N pools within our specific N concentration range (up to approx. 2.7 g N kg-1
soil; data not shown). It could be further hypothesized that beyond a certain N
accumulation threshold, both soil microbial diversity and MBC plateau off or even
decline due to soil N saturation (Treseder et al., 2008). These relationships need to be
examined under a broader variety of agroecological conditions.
Both protozoa and fungi can be sensitive to intense cropping disturbance
management, such as simple 2-yr rotations. As previously reported in a related work
by Kiani et al. (2017), biomarker indicators for protozoa and fungi were distinctly
present in the undisturbed Breton forest soil, and these two biomarkers were not
evident under any cropping systems. Based on our correlation analyses, fungi showed
Page 27 of 46C
an. J
. Soi
l. Sc
i. D
ownl
oade
d fr
om w
ww
.nrc
rese
arch
pres
s.co
m b
y H
EL
SIN
KI
UN
IV o
n 03
/08/
18Fo
r pe
rson
al u
se o
nly.
Thi
s Ju
st-I
N m
anus
crip
t is
the
acce
pted
man
uscr
ipt p
rior
to c
opy
editi
ng a
nd p
age
com
posi
tion.
It m
ay d
iffe
r fr
om th
e fi
nal o
ffic
ial v
ersi
on o
f re
cord
.

28
a close association with TOC and concurrently wider C:N ratios, while the presence
of protozoa was highly correlated to TN, and even more directly associated with the
stabilized N pool (i.e., MAOM-N) (Table 3). Existing literature supports that
mycorrhizal fungi can hold up to two-thirds of the soil total carbon stored in leaf litter
and soil profile in forest ecosystems (Clemmensen et al., 2013) and this has been
regarded as the dominant pathway by which living carbon enters the soil carbon pool
in poplar forest systems (Godbold et al., 2006). Godbold et al. (2006) further stated
that the turnover of the mycorrhizal external mycelium might be a fundamental
pathway for recently-added C inputs to be transferred into stable SOM pools.
Moreover, our study suggests that long-term cultivation practices, in particular annual
cropping, impacted and shifted the unique and dominant microbial groups in the
Breton soils. By converting boreal forest soils into repeatedly-cropped soils, fungi
would have lost their ecological advantages including adaptation to wide C:N ratios
generated by tree litter.
With respect to protozoa, as they primarily feed on bacteria and SOM, the
sharp decrease of SOM in croplands relative to forest soils would likely depress them
(Table 1). However, with a plausible reestablished and enhanced soil food web and
microbial community under diverse, complex rotations, the soil conditions could in
the long-term become suitable again for the survival and activity of protozoa in
response, the excess N that protozoa feeding on bacteria release in the form of
ammonium can become available for other soil organisms and plants within these
Page 28 of 46C
an. J
. Soi
l. Sc
i. D
ownl
oade
d fr
om w
ww
.nrc
rese
arch
pres
s.co
m b
y H
EL
SIN
KI
UN
IV o
n 03
/08/
18Fo
r pe
rson
al u
se o
nly.
Thi
s Ju
st-I
N m
anus
crip
t is
the
acce
pted
man
uscr
ipt p
rior
to c
opy
editi
ng a
nd p
age
com
posi
tion.
It m
ay d
iffe
r fr
om th
e fi
nal o
ffic
ial v
ersi
on o
f re
cord
.

29
agroecosystems (Hoorman et al., 2011). In our study, this inference is supported by a
strong correlation between presence of protozoa biomarkers and stabilized N pools
(e.g., TN and MAOM-N) (Table 3).
5.4 Nutrient additions lead to varying enhancements in SOM dynamics
Under the long-term management and steady state conditions at the Breton site,
contrasting nutrient addition managements equally improved overall soil quality,
although this response seemed to be mediated by diverging effects on SOM accrual
and pools across the different nutrient regimes. Manure additions showed accelerating
effects on accruing larger magnitudes of POM and MAOM pools compared to soils
receiving a balanced fertilization (Table 1) although these two nutrient managements
notably converged on the same allocation of SOM into POM vs. MAOM fractions.
And this consistent SOM partitioning was clearly different from the soils with no
nutrient additions (control) which disproportionally allocated less SOM into the labile
pool (represented by POM fraction). An earlier study showed that manure addition
can increase both the root and microbial biomass debris which are both key
contributing factors of soil POM (Purakayastha et al., 2008). Likewise, long-term
additions of manure have been shown to favor soil carbon cycling and
macroaggregate formation (Liu et al., 2013; Stehlíková et al. 2016). While manure
adds carbon directly to the soil profile, balanced fertilization supports plant growth
and biomass production which subsequently feedbacks into increased plant residues
leading to long-term accretion of SOM (Hati et al., 2008). Due to recurrent harvest
Page 29 of 46C
an. J
. Soi
l. Sc
i. D
ownl
oade
d fr
om w
ww
.nrc
rese
arch
pres
s.co
m b
y H
EL
SIN
KI
UN
IV o
n 03
/08/
18Fo
r pe
rson
al u
se o
nly.
Thi
s Ju
st-I
N m
anus
crip
t is
the
acce
pted
man
uscr
ipt p
rior
to c
opy
editi
ng a
nd p
age
com
posi
tion.
It m
ay d
iffe
r fr
om th
e fi
nal o
ffic
ial v
ersi
on o
f re
cord
.
30
removals (i.e., grain, forage), the amount of essential nutrients such as nitrogen,
phosphorus and potassium that can be returned to the soil through plant residues and
roots may be insufficient for replenishing the removals. Therefore, adding nutrients on
a long-term management basis could not only compensate for outputs (removals and
losses) but also lead to improvements of SOM accrual and dynamics (Purakayastha et
al., 2008). Manure, plant residues and roots all constitute fresh C inputs that can be at
least initially allocated into the soil POM pool potentially leading to similar POM to
SOM ratios. In our study two very distinct nutrient sources (i.e., manure and fertilizer)
shifted, increased and sustained very similar partitioning of newly-accrued SOM
towards the dynamic, labile POM fraction. This result expands earlier findings by
Kiani et al. (2017) who indicated that an effective accretion of new SOM can be
caused by direct manure additions in the long term.
By repeatedly applying manure into the soil, a great number and diversity of
microbes along with additional input of organic carbon, nitrogen and other nutrients
are expected to subsequently increase soil fertility in the long-term compared to
equivalent amounts of N added via inorganic fertilization (Chakraborty et al., 2011).
This postulate is in part supported by our finding of greater soil TOC, TN, and MBC
in manured soils compared to fertilized soils (Table 1).
Conclusion
Retention and cycling of soil organic matter is important for developing soil
quality as well as sustaining agricultural production. The study of the long-term
Page 30 of 46C
an. J
. Soi
l. Sc
i. D
ownl
oade
d fr
om w
ww
.nrc
rese
arch
pres
s.co
m b
y H
EL
SIN
KI
UN
IV o
n 03
/08/
18Fo
r pe
rson
al u
se o
nly.
Thi
s Ju
st-I
N m
anus
crip
t is
the
acce
pted
man
uscr
ipt p
rior
to c
opy
editi
ng a
nd p
age
com
posi
tion.
It m
ay d
iffe
r fr
om th
e fi
nal o
ffic
ial v
ersi
on o
f re
cord
.

31
effects of rotation and nutrient addition on SOM accrual and dynamics is essential to
better understand these responses in agroecosystems under steady state conditions.
Results from two long-term experimental sites indicate that certain repeated
agricultural practices such as short, simple crop rotations and annual cropping
decrease SOM and particularly reduce the labile SOM quantified as POM. The TOC
and TN decreased by up to 46 and 14% when soils originally under native forest
vegetation were continuously cropped for nearly nine decades. However, compared to
the traditional wheat-fallow rotation, the introduction of perennial legumes, forage
and grasses in diverse, complex rotation systems showed evidence of improved soil
quality with increasing TOC and TN, as well as POM-C and -N. Moreover, the
substantial amount of nitrogen likely contributed by the perennial legumes (e.g.,
alfalfa) may have facilitated microbial transformation of the labile SOM pool
(compare to the N-limited condition in forest soils). The plant residues and roots
derived from legumes and grasses in complex rotations would not only act as an
additional C source in the system but would also interplay a key role in soil C and N
cycling that directly involves supporting the microbial community and the progressive
development of soil aggregation.
Nutrient management options resulted in varying accretion and allocation of
SOM pools. Long-term manure additions can enhance soil nutrient cycling by
increasing TOC, TN, POM concentrations, and MBC, while balanced fertilization
shows much more benefits towards improved soil fractal aggregation. Moreover, our
Page 31 of 46C
an. J
. Soi
l. Sc
i. D
ownl
oade
d fr
om w
ww
.nrc
rese
arch
pres
s.co
m b
y H
EL
SIN
KI
UN
IV o
n 03
/08/
18Fo
r pe
rson
al u
se o
nly.
Thi
s Ju
st-I
N m
anus
crip
t is
the
acce
pted
man
uscr
ipt p
rior
to c
opy
editi
ng a
nd p
age
com
posi
tion.
It m
ay d
iffe
r fr
om th
e fi
nal o
ffic
ial v
ersi
on o
f re
cord
.

32
study revealed that two contrasting nutrient sources – manure or inorganic fertilizer –
equally result in increased allocation of SOM into labile POM pool, while unamended
fields led to the depletion of this C fraction.
Acknowledgement
The authors also wish to thank Lewis Fausak, Karin Lindquist, and Kris Guenette for
their assistance during field sampling at Breton and Lethbridge sites as well as Jela
Burkus and Catherine Pocklington for laboratory analyses.
References
AGRASID, 2015. Agricultural Region of Alberta Soil Inventory Database.
http://www1. agric.gov.ab.ca/$department/deptdocs.nsf/all/sag3249.
Alberta-Weather Conditions and Forecast, 2016. URL:
http://agriculture.alberta.ca/acis/alberta-weather-data-viewer.jsp
Aoyama, M., Angers, D. A. and N’Dayegamiye, A. 1999. Particulate and
mineral-associated organic matter in water-stable aggregates as affected by mineral
fertilizer and manure applications. Can. J. Soil Sci. 79: 295–302.
Ashagrie, Y., Zech, W., Guggenberger, G., Mamo, T., 2007. Soil aggregation, and total
and particulate organic matter following conversion of native forests to continuous
cultivation in Ethiopia. Soil Tillage Res. 94, 101–108. doi:10.1016/j.still.2006.07.005
Balota E.L., Arnaldo Colozzi Filho, Diva S. Andrade, Richard P. Dick., 2004.
Long-term tillage and crop rotation effects on microbial biomass and C and N
Page 32 of 46C
an. J
. Soi
l. Sc
i. D
ownl
oade
d fr
om w
ww
.nrc
rese
arch
pres
s.co
m b
y H
EL
SIN
KI
UN
IV o
n 03
/08/
18Fo
r pe
rson
al u
se o
nly.
Thi
s Ju
st-I
N m
anus
crip
t is
the
acce
pted
man
uscr
ipt p
rior
to c
opy
editi
ng a
nd p
age
com
posi
tion.
It m
ay d
iffe
r fr
om th
e fi
nal o
ffic
ial v
ersi
on o
f re
cord
.

33
mineralization in a Brazilian Oxisol. Soil & Tillage Research 77 (2004) 137–145.
Beheshti, A., Raiesi, F., Golchin, A., 2012. Soil properties, C fractions and their
dynamics in land use conversion from native forests to croplands in northern Iran.
Agric. Ecosyst. Environ. 148, 121–133. doi:10.1016/j.agee.2011.12.001
Bhowmik A., Fortuna A-M, Cihacek L.J., Bary A.I., Carr P.M., Cogger C.G. 2017.
Potential carbon sequestration and nitrogen cycling in long-term organic management
systems. Renewable Agriculture and Food Systems: 32:498–510
Bowren, K.E., V.O. Biederbeck, H.A. Bjorge, S.A. Brandt, B.P. Goplen, J.L. Henry, H.
Ukrainetz, T. Wright, and L.A. McLean. 1995. Soil Improvement with Legumes. 24
pp. Saskatchewan Agriculture and Food. (Internet site; www.gov.sk.ca)
Bu R, Lu J, Ren T, Liu B, Li X, Cong R. 2015. Particulate Organic Matter Affects Soil
Nitrogen Mineralization under Two Crop Rotation Systems. PLoS ONE 10(12):
e0143835. doi:10.1371/journal.pone.0143835
Cambardella, C.A., and E.T. Elliott. 1992. Particulate soil organic-matter changes
across a grassland cultivation sequence. Soil Sci. Soc. Am. J. 56:777–783.
Cambardella, C.A., and E.T. Elliott. 1993. Carbon and nitrogen distribution in
aggregates from cultivated and native grassland soils. Soil Sci. Soc.Am. J. 57:1071–
1076.
Castro G.S.A., Crusciol C.A.C., Calonego J.C., Rosolem C.A. 2015. Management
Impacts on Soil Organic Matter of Tropical Soils. Vadose Zone J. 14:1-8
Page 33 of 46C
an. J
. Soi
l. Sc
i. D
ownl
oade
d fr
om w
ww
.nrc
rese
arch
pres
s.co
m b
y H
EL
SIN
KI
UN
IV o
n 03
/08/
18Fo
r pe
rson
al u
se o
nly.
Thi
s Ju
st-I
N m
anus
crip
t is
the
acce
pted
man
uscr
ipt p
rior
to c
opy
editi
ng a
nd p
age
com
posi
tion.
It m
ay d
iffe
r fr
om th
e fi
nal o
ffic
ial v
ersi
on o
f re
cord
.

34
doi:10.2136/vzj2014.07.0093
Chakraborty, A., Chakrabarti, K., Chakraborty, A., Ghosh, S., 2011. Effect of
long-term fertilizers and manure application on microbial biomass and microbial
activity of a tropical agricultural soil. Biol. Fertil. Soils 47, 227–233.
doi:10.1007/s00374-010-0509-1
Clemmensen, K.E., Dahlberg, A., Stenlid, J., Finlay, R.D., Lindahl, B.D., Bahr, A.,
Wallander, H., Ovaskainen, O., Ekblad, A., and Wardle, D.A. 2013. Roots and
associated fungi drive long-term carbon sequestration in boreal forest. Science, 339:
1615-1618.
Coulter, J.A., E.D. Nafziger and M.M. Wander. 2009. Soil Organic Matter Response
to Cropping System and Nitrogen Fertilization. Agron J., 101: 592-599
Curtin, D., Beare, M.H., Hernandez-Ramirez, G., 2012. Temperature and Moisture
Effects on Microbial Biomass and Soil Organic Matter Mineralization. Soil Sci. Soc.
Am. J. 0, 0. doi:10.2136/sssaj2012.0011
Curtin, D., Beare, M.H., Scott, C.H., Hernandez-Ramirez, G., and Meenken, E.D.
(2014). Mineralization of Soil Carbon and Nitrogen Following Physical Disturbance:
A Laboratory Assessment. Soil Science Society of America Journal. 78: 925–935.
Danga, B.O., Ouma, J.P., Wakindiki, I.I.C., Bar-Tal, A., 2009. Legume-Wheat
Rotation Effects on Residual Soil Moisture, Nitrogen and Wheat Yield in Tropical
Regions, 1st ed, Advances in Agronomy. Elsevier Inc.
Page 34 of 46C
an. J
. Soi
l. Sc
i. D
ownl
oade
d fr
om w
ww
.nrc
rese
arch
pres
s.co
m b
y H
EL
SIN
KI
UN
IV o
n 03
/08/
18Fo
r pe
rson
al u
se o
nly.
Thi
s Ju
st-I
N m
anus
crip
t is
the
acce
pted
man
uscr
ipt p
rior
to c
opy
editi
ng a
nd p
age
com
posi
tion.
It m
ay d
iffe
r fr
om th
e fi
nal o
ffic
ial v
ersi
on o
f re
cord
.
35
doi:10.1016/S0065-2113(08)00805-5
Dick, W.A. 1984. Influence of long-term tillage and crop rotation combination on soil
enzyme activities. Soil Sci. Soc. Am. J., 48: 569-574.
Diochon A., Gregorich E.G., Kellman L., Morrison M., Ma B.-L. 2016. Greater soil C
inputs accelerate loss of C in cropping systems with low N input. Plant Soil 400:93–
105. DOI 10.1007/s11104-015-2718-8
Figueiredo CC, Dimas Vital Siqueira Resck & Marco Aurélio Carbone Carneiro, 2010.
Labile and stable fractions of soil organic matter under management systems and
native cerrado. R. Bras. Ci. Solo, 34:907-916, 2010.
Godbold DL et al. 2006. Mycorrhizal hyphal turnover as a dominant process for
carbon input into soil organic matter. Plant and Soil, 281: 15-24.
Gregorich, E. G, Carter, M. R., Angers, D. A., Monreal, C. M. and Ellert, B. H. 1994.
Towards a minimum data set to assess soil organic matter quatity in agricultural soils.
Can. J. Soil Sci. 74 367-385
Hannam, K. D., Quideau, S. A., Kishchuk, B. E., 2006. Forest floor microbial
communities in relation to stand composition and timber harvesting in northern
Alberta. Soil Biology and Biochemistry, 38, 2565- 2575.
Hati, KM.; Swarup, Anand; Mishra, B., Mannaa MC, Wanjaria R.H., Mandala K.G.,
Misraa A.K. 2008. Impact of long-term application of fertilizer, manure and lime
under intensive cropping on physical properties and organic carbon content of an
Page 35 of 46C
an. J
. Soi
l. Sc
i. D
ownl
oade
d fr
om w
ww
.nrc
rese
arch
pres
s.co
m b
y H
EL
SIN
KI
UN
IV o
n 03
/08/
18Fo
r pe
rson
al u
se o
nly.
Thi
s Ju
st-I
N m
anus
crip
t is
the
acce
pted
man
uscr
ipt p
rior
to c
opy
editi
ng a
nd p
age
com
posi
tion.
It m
ay d
iffe
r fr
om th
e fi
nal o
ffic
ial v
ersi
on o
f re
cord
.

36
Alfisol. Geoderma 148:173-179
Hebb CC, Schoderbek D, Hernandez-Ramirez G, Hewins D, Carlyle CN, Bork E.
2017. Soil physical quality varies among contrasting land uses in Northern Prairie
regions. Agriculture, Ecosystems and Environment 240: 14–23
Hernandez-Ramirez G, Sauer TJ, Cambardella CA, Brandle JR, James DE. (2011).
Carbon sources and dynamics in afforested and cultivated corn belt soils. Soil Sci.
Soc. Am. J.75: 216 -225.
Hirmas DR, Giménez D, Subroy V, Platt BF (2013) Fractal distribution of mass from
the millimeter- to decimeter-scale in two soils under native and restored tallgrass
prairie. Geoderma 207–208:121–130
Hoorman J J. The role of soil protozoa and nematodes[J]. Fact Sheet: Agriculture and
Natural Resources.(Smith KL), The Ohio State University Extension, Colombus,
Ohio, 2011.
Islam, K.R. and R.R. Weil. 2000. Land use effects on soil quality in a tropic forest
ecosystem of Bangladesh. Agriculture, Ecosystems & Environment, Volume 79, Issue
1, June 2000, P 9–16.
Kennedy, A.C. and R.I. Papendick. 1995. Microbial characteristics of soil quality. Soil
Water. Journal of Soil and Water Conservation, May/June 1995, vol. 50, no. 3
243-248
Kiani M, Hernandez-Ramirez G, Quideau S, Smith E, Janzen H, Larney F, Puurveen
Page 36 of 46C
an. J
. Soi
l. Sc
i. D
ownl
oade
d fr
om w
ww
.nrc
rese
arch
pres
s.co
m b
y H
EL
SIN
KI
UN
IV o
n 03
/08/
18Fo
r pe
rson
al u
se o
nly.
Thi
s Ju
st-I
N m
anus
crip
t is
the
acce
pted
man
uscr
ipt p
rior
to c
opy
editi
ng a
nd p
age
com
posi
tion.
It m
ay d
iffe
r fr
om th
e fi
nal o
ffic
ial v
ersi
on o
f re
cord
.

37
D. (2017). Quantifying the sensitive soil quality indicators across contrasting
long-term land management systems: crop rotations and nutrient regimes. Agric.
Ecosyst. Environ. 248:123–135
Kohut, C. K. and Dudas, M.J. 1993. Evaporite mineralogy and trace-element content
of salt-affected soils in Alberta. Can. J. Soil Sci. 73: 399-409.
Kohut, C. K. and Dudas, M.J. 1994. Characteristics of Clay Minerals in Saline
Alkaline Soils in Alberta, Canada. Soil Sci. Soc. Am. J. 58:1260-1269.
Liu E, Yan C, Mei X, Zhang Y, Fan T (2013) Long-Term Effect of Manure and
Fertilizer on Soil Organic Carbon Pools in Dryland Farming in Northwest China.
PLoS ONE 8(2): e56536. doi:10.1371/journal.pone.0056536
Mileti F.A., Langella G. Prins M.A., Vingiani S., Terribile F. 2013. The hidden nature
of parent material in soils of Italian mountain ecosystems. Geoderma 207:291–309.
Miller, M., and R.P. Dick. 1995. Thermal stability and activities of soil enzymes as
influenced by crop rotations. Soil Biol. Biochem. 27:1161–1166.
doi:10.1016/0038-0717(95)00045-G
Muñoz-Romero V., Lopez-Bellido R.J., Fernandez-Garcia P., Redondo R., Murillo S.,
Lopez-Bellido L. 2017. Effects of tillage, crop rotation and N application rate on
labile and recalcitrant soil carbon in a Mediterranean Vertisol. Soil & Tillage Research
169:118–123
Oades JM (1984) Soil organic-matter and structural stability -Mechanisms and
Page 37 of 46C
an. J
. Soi
l. Sc
i. D
ownl
oade
d fr
om w
ww
.nrc
rese
arch
pres
s.co
m b
y H
EL
SIN
KI
UN
IV o
n 03
/08/
18Fo
r pe
rson
al u
se o
nly.
Thi
s Ju
st-I
N m
anus
crip
t is
the
acce
pted
man
uscr
ipt p
rior
to c
opy
editi
ng a
nd p
age
com
posi
tion.
It m
ay d
iffe
r fr
om th
e fi
nal o
ffic
ial v
ersi
on o
f re
cord
.

38
implications for management. Plant and Soil 76: 319–337
Ohtonen, R., Aikio, S., and Vare, H. 1997. Ecological theories in soil biology. Soil
Biol. Biochem. 29:1613-1619.
Pawluk S. 1961. Mineralogical composition of some grey wooded soils developed
from glacial till. Canadian Journal of Soil Science, 1961, 41(2): 228-240
Plante, A.F., Virto, I. and Malhi, S.S. 2010. Pedogenic, mineralogical and land-use
controls on organic carbon stabilization in two contrasting soils. Can. J. Soil Sci.
90:15-26.
Powlson, D.S., P.C. Brookes and B.T. Christensen. 1987. Measurement of soil
microbial biomass provides an early indication of changes in tot soil organic matter
due to straw incorporation. Soil Biol. Biochem, 19: 159-164.
Purakayastha TJ, Rudrappa L, Singh D, Swarup A, Bhadraray S (2008) Long-term
impact of fertilizers on soil organic carbon pools and sequestration rates in maize–
wheat–cowpea cropping system. Geoderma 144: 370–378.
Quideau, S.A., McIntosh, A.C., Norris, C.E., Lloret, E., Swallow, M.J. Hannam, K.,
2016. Extraction and Analysis of Microbial Phospholipid Fatty Acids in Soils. JoVE
(Journal of Visualized Experiments), (114), pp.e54360-e54360.
Quideau, S.A., Swallow, M.J.B., Prescott, C.E., Grayston, S.J., Oh, S.W., 2013.
Comparing soil biogeochemical processes in novel and natural boreal forest
ecosystems. Biogeosciences 10, 5651–5661. doi:10.5194/bg-10-5651-2013
Page 38 of 46C
an. J
. Soi
l. Sc
i. D
ownl
oade
d fr
om w
ww
.nrc
rese
arch
pres
s.co
m b
y H
EL
SIN
KI
UN
IV o
n 03
/08/
18Fo
r pe
rson
al u
se o
nly.
Thi
s Ju
st-I
N m
anus
crip
t is
the
acce
pted
man
uscr
ipt p
rior
to c
opy
editi
ng a
nd p
age
com
posi
tion.
It m
ay d
iffe
r fr
om th
e fi
nal o
ffic
ial v
ersi
on o
f re
cord
.

39
Ryżak, M. and Bieganowski, A. 2011. Methodological aspects of determining soil
particle-size distribution using the laser diffraction method. J. Plant Nutr. Soil Sci. 174:
624–633. doi:10.1002/jpln.201000255
Shrestha B. M., Singh B. R., Forte C., Certini G., 2015. Long-term effects of tillage,
nutrient application and crop rotation on soil organic matter quality assessed by NMR
spectroscopy. Soil Use and Management 31: 358-366
Six J, Conant RT, Paul EA, Paustian K (2002) Stabilization mechanisms of soil
organic matter: Implications for C-saturation of soils. Plant and Soil 241: 155–176
Six J, Elliott ET, Paustian K (2000) Soil macroaggregate turnover and microaggregate
formation: a mechanism for C sequestration under no-tillage agriculture. Soil Biology
& Biochemistry 32: 2099–2103
Stehlíková I., Madaras M., Lipavský J., Šimon T. 2016. Study on some soil quality
changes obtained from long-term experiments. Plant Soil Environ. 62: 74–79 doi:
10.17221/633/2015-PSE
Tisdall JM, Oades JM (1982) Organic matter and water-stable aggregates in soils.
Journal of Soil Science 33: 141–163
Treseder K. K. Nitrogen additions and microbial biomass: A meta analysis of
ecosystem studies. Ecol. Lett. 11, 1111–1120 (2008).
Wickham H. (2012). Reshaping data with the reshape package. J. Stat. Softw. 21
Avaliable online at: http://econpapers.repec.org/article/jssjstsof/21_3ai12.htm
Page 39 of 46C
an. J
. Soi
l. Sc
i. D
ownl
oade
d fr
om w
ww
.nrc
rese
arch
pres
s.co
m b
y H
EL
SIN
KI
UN
IV o
n 03
/08/
18Fo
r pe
rson
al u
se o
nly.
Thi
s Ju
st-I
N m
anus
crip
t is
the
acce
pted
man
uscr
ipt p
rior
to c
opy
editi
ng a
nd p
age
com
posi
tion.
It m
ay d
iffe
r fr
om th
e fi
nal o
ffic
ial v
ersi
on o
f re
cord
.

40
Zou, X.M., Ruan, H.H., Fu, Y., Yang, X.D., Sha, L.Q., 2005. Estimating soil labile
organic carbon and potential turnover rates using a sequential fumigation-incubation
procedure. Soil Biol. Biochem. 37, 1923–1928. doi:10.1016/j.soilbio.2005.02.028
Page 40 of 46C
an. J
. Soi
l. Sc
i. D
ownl
oade
d fr
om w
ww
.nrc
rese
arch
pres
s.co
m b
y H
EL
SIN
KI
UN
IV o
n 03
/08/
18Fo
r pe
rson
al u
se o
nly.
Thi
s Ju
st-I
N m
anus
crip
t is
the
acce
pted
man
uscr
ipt p
rior
to c
opy
editi
ng a
nd p
age
com
posi
tion.
It m
ay d
iffe
r fr
om th
e fi
nal o
ffic
ial v
ersi
on o
f re
cord
.

41
Tables:
Table 1. Effect of crop rotation and nutrient management on soil organic matter attributes and fractions as well as fractal dimension (Dm) and microbial biomass carbon (MBC) at the 5 to 10 cm soil depth increment at the Breton site. The MBC and Dm data were presented in Kiani et al. (2017) and are repeated here on average basis for completeness of this study. Within a column, treatment means with different letters differ, P < 0.05. Three contrasts are presented.
Description TOC POM-C
Concentration
POM-C
Fraction
MAOM-C
Concentration
MAOM-C
*Fraction* TN
POM-N
Concentration
POM-N
Fraction
MAOM-N
Concentration
MAOM-N
*Fraction*
POM
C:N
MAOM
C:N
Whole
Soil C:N MBCb Dm
(g kg-1 soil) (g kg-1 soil) (g kg-1 soil) (g kg-1 soil) (g kg-1 soil) (g kg-1 soil) nmol g-1
soil unitless
Forest vs. Croplands
Forest 36.9a 15.13a 0.44a 21.74 0.56b 2.10 0.68a 0.34a 1.42 0.66b 22.30a 14.60a 17.38a 1734b 0.914aa
Croplands 20.0b 5.18b 0.25b 14.78 0.75a 1.77 0.36b 0.20b 1.40 0.80a 14.66b 10.50b 11.27b 2443a 0.962ba
P-value <0.001 <0.001 <0.001 0.059 <0.001 0.192 0.001 <0.001 0.984 <0.001 <0.001 <0.001 <0.001 0.062 0.004
2-yr vs. 5-yr Rotation
2-yr Rotation 14.7b 4.25 0.26 10.50b 0.74 1.28b 0.30 0.21 0.98b 0.79 14.56 10.72 11.46 1912b 0.970
5-yr Rotation 21.9a 5.53 0.25 16.39a 0.75 1.95a 0.38 0.20 1.56a 0.80 14.70 10.42 11.20 2421a 0.957a
P-value 0.028 0.093 0.856 0.014 0.856 0.02 0.102 0.824 0.004 0.824 0.431 0.701 0.505 0.026 0.527
5-yr Wheat vs. 5-yr Hay
5-yr Rotation Wheat 19.2 4.46b 0.23b 14.75 0.77 1.79 0.32 0.18 1.47 0.82 14.08b 10.08 10.73 2718a 0.976aa
5-yr Rotation Hay 23.6 6.17a 0.27a 17.38 0.73 2.04 0.42 0.20 1.62 0.80 15.07a 10.62 11.49 2627a 0.956aa
Page 41 of 46C
an. J
. Soi
l. Sc
i. D
ownl
oade
d fr
om w
ww
.nrc
rese
arch
pres
s.co
m b
y H
EL
SIN
KI
UN
IV o
n 03
/08/
18Fo
r pe
rson
al u
se o
nly.
Thi
s Ju
st-I
N m
anus
crip
t is
the
acce
pted
man
uscr
ipt p
rior
to c
opy
editi
ng a
nd p
age
com
posi
tion.
It m
ay d
iffe
r fr
om th
e fi
nal o
ffic
ial v
ersi
on o
f re
cord
.

42
P-value 0.056 0.037 0.027 0.210 0.027 0.189 0.152 0.210 0.474 0.210 0.002 0.136 0.107 0.83 0.12
Nutrient managements (crop rotations)
Manure 26.0a 7.45a 0.28b 18.55a 0.72b 2.28a 0.53a 0.23b 1.75a 0.77b 14.24 10.62 11.38 3018a 0.987a
Balance Fertilization 17.4b 4.72b 0.27b 12.72b 0.73b 1.57b 0.33b 0.21b 1.24b 0.79b 11.14 14.50 10.29 2258ab 0.965aa
Control 15.3b 2.77b 0.19a 12.50b 0.81a 1.34b 0.18b 0.14a 1.17b 0.86a 15.44 10.62 11.38 1982b 0.985a
P-value <0.001 <0.001 <0.001 <0.001 <0.001 <0.001 <0.001 <0.001 <0.001 <0.001 0.620 0.083 0.466 0.02 0.26
Overall Mean 22.0 6.54 0.28 15.46 0.70 1.77 0.40 0.21 1.37 0.76 15.44 11.85 11.91 2334 0.954
Standard Error 1.8 0.82 0.02 1.17 0.02 0.11 0.04 0.01 0.08 0.01 0.58 0.36 0.45 132 0.006
Note: Means within a column not sharing a lowercased italic letter differ significantly at the p < 0.05 level.
C: Carbon; N: Nitrogen; TOC: total organic carbon; POM: particulate organic matter; MAOM: mineral associated organic matter; TN: total nitrogen.
aIndicates that the Dm value is significantly different from 1 at P<0.05 or it is fractal.
bThe total PLFAs were used as an index of microbial biomass carbon.
Page 42 of 46C
an. J
. Soi
l. Sc
i. D
ownl
oade
d fr
om w
ww
.nrc
rese
arch
pres
s.co
m b
y H
EL
SIN
KI
UN
IV o
n 03
/08/
18Fo
r pe
rson
al u
se o
nly.
Thi
s Ju
st-I
N m
anus
crip
t is
the
acce
pted
man
uscr
ipt p
rior
to c
opy
editi
ng a
nd p
age
com
posi
tion.
It m
ay d
iffe
r fr
om th
e fi
nal o
ffic
ial v
ersi
on o
f re
cord
.
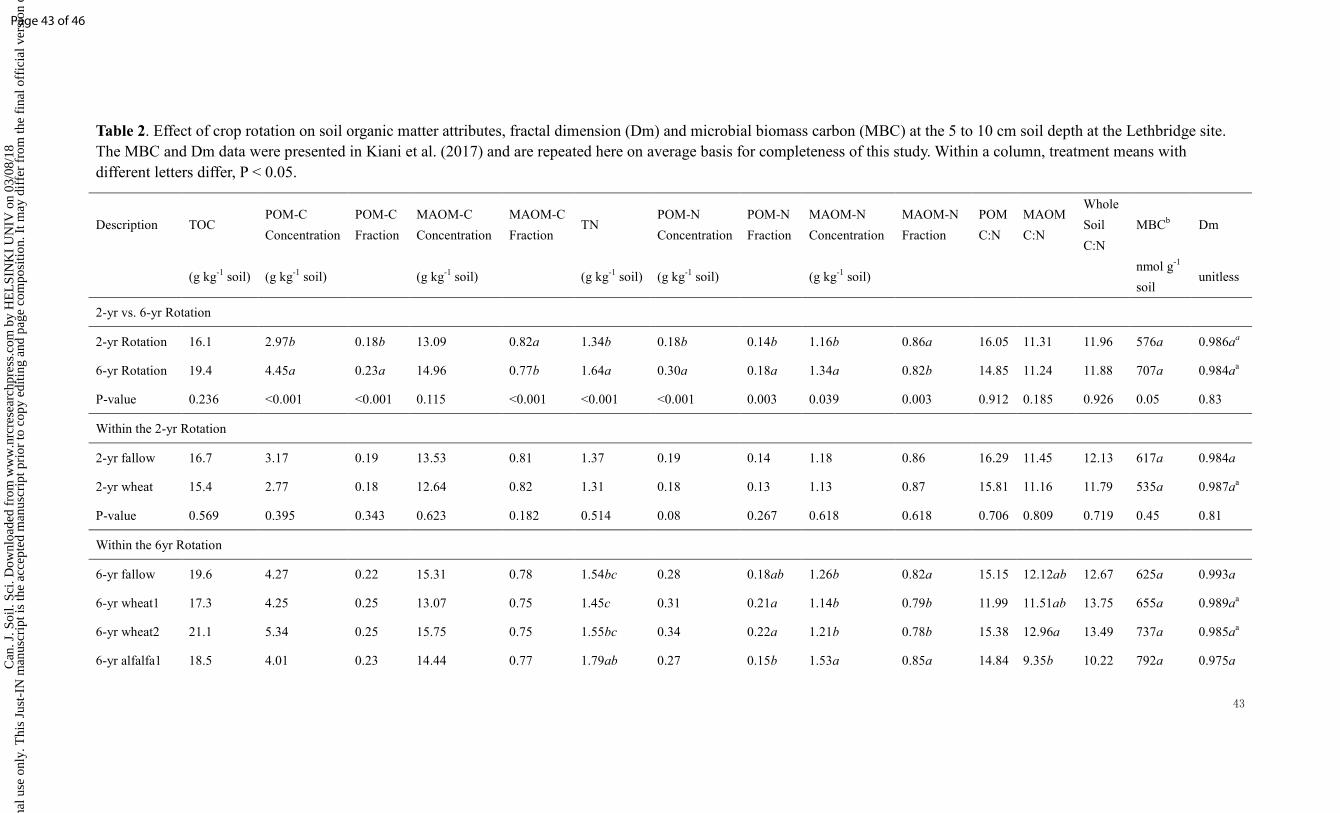
43
Table 2. Effect of crop rotation on soil organic matter attributes, fractal dimension (Dm) and microbial biomass carbon (MBC) at the 5 to 10 cm soil depth at the Lethbridge site. The MBC and Dm data were presented in Kiani et al. (2017) and are repeated here on average basis for completeness of this study. Within a column, treatment means with different letters differ, P < 0.05.
Description TOC POM-C
Concentration
POM-C
Fraction
MAOM-C
Concentration
MAOM-C
Fraction TN
POM-N
Concentration
POM-N
Fraction
MAOM-N
Concentration
MAOM-N
Fraction
POM
C:N
MAOM
C:N
Whole
Soil
C:N
MBCb Dm
(g kg-1 soil) (g kg-1 soil) (g kg-1 soil) (g kg-1 soil) (g kg-1 soil) (g kg-1 soil) nmol g-1
soil unitless
2-yr vs. 6-yr Rotation
2-yr Rotation 16.1 2.97b 0.18b 13.09 0.82a 1.34b 0.18b 0.14b 1.16b 0.86a 16.05 11.31 11.96 576a 0.986aa
6-yr Rotation 19.4 4.45a 0.23a 14.96 0.77b 1.64a 0.30a 0.18a 1.34a 0.82b 14.85 11.24 11.88 707a 0.984aa
P-value 0.236 <0.001 <0.001 0.115 <0.001 <0.001 <0.001 0.003 0.039 0.003 0.912 0.185 0.926 0.05 0.83
Within the 2-yr Rotation
2-yr fallow 16.7 3.17 0.19 13.53 0.81 1.37 0.19 0.14 1.18 0.86 16.29 11.45 12.13 617a 0.984a
2-yr wheat 15.4 2.77 0.18 12.64 0.82 1.31 0.18 0.13 1.13 0.87 15.81 11.16 11.79 535a 0.987aa
P-value 0.569 0.395 0.343 0.623 0.182 0.514 0.08 0.267 0.618 0.618 0.706 0.809 0.719 0.45 0.81
Within the 6yr Rotation
6-yr fallow 19.6 4.27 0.22 15.31 0.78 1.54bc 0.28 0.18ab 1.26b 0.82a 15.15 12.12ab 12.67 625a 0.993a
6-yr wheat1 17.3 4.25 0.25 13.07 0.75 1.45c 0.31 0.21a 1.14b 0.79b 11.99 11.51ab 13.75 655a 0.989aa
6-yr wheat2 21.1 5.34 0.25 15.75 0.75 1.55bc 0.34 0.22a 1.21b 0.78b 15.38 12.96a 13.49 737a 0.985aa
6-yr alfalfa1 18.5 4.01 0.23 14.44 0.77 1.79ab 0.27 0.15b 1.53a 0.85a 14.84 9.35b 10.22 792a 0.975a
Page 43 of 46C
an. J
. Soi
l. Sc
i. D
ownl
oade
d fr
om w
ww
.nrc
rese
arch
pres
s.co
m b
y H
EL
SIN
KI
UN
IV o
n 03
/08/
18Fo
r pe
rson
al u
se o
nly.
Thi
s Ju
st-I
N m
anus
crip
t is
the
acce
pted
man
uscr
ipt p
rior
to c
opy
editi
ng a
nd p
age
com
posi
tion.
It m
ay d
iffe
r fr
om th
e fi
nal o
ffic
ial v
ersi
on o
f re
cord
.

44
6-yr alfalfa3 20.6 4.38 0.21 16.23 0.79 1.86a 0.29 0.16b 1.57a 0.84a 15.12 10.27ab 11.02 723a 0.979a
P-value 0.654 0.581 0.487 0.628 0.487 0.001 0.106 <0.001 <0.001 <0.001 0.085 0.856 0.042 0.64 0.42
Overall Mean 18.5 4.03 0.22 14.42 0.78 1.55 0.27 0.17 1.29 0.83 15.19 11.26 11.90 669 0.985
Standard Error 0.7 0.22 0.01 0.57 0.01 0.04 0.01 0.01 0.04 0.01 0.39 0.34 0.33 31.0 0.003
Note: Means within a column not sharing a lowercased italic letter differ significantly at the p < 0.05 level.
TOC: total organic carbon; POM: particulate organic matter; MAOM: mineral associated organic matter; TN: total nitrogen.
aIndicates that the Dm value is significantly different from 1 at P<0.05 or it is fractal.
bThe total PLFAs were used as an index of microbial biomass carbon.
Page 44 of 46C
an. J
. Soi
l. Sc
i. D
ownl
oade
d fr
om w
ww
.nrc
rese
arch
pres
s.co
m b
y H
EL
SIN
KI
UN
IV o
n 03
/08/
18Fo
r pe
rson
al u
se o
nly.
Thi
s Ju
st-I
N m
anus
crip
t is
the
acce
pted
man
uscr
ipt p
rior
to c
opy
editi
ng a
nd p
age
com
posi
tion.
It m
ay d
iffe
r fr
om th
e fi
nal o
ffic
ial v
ersi
on o
f re
cord
.

45
Table 3. Spearman correlation coefficients (ρ) for relationships among soil properties in Breton site. The fungi and protozoa data were presented in Kiani et al. (2017).
TOC POM-C POM-CF MAOM-C MAOM-CF TN POM-N POM-NF MAOM-N MAOM-NF WS-C:N POM-C:N MAOM-C:N MBC Fungi Protozoa
POM-C 0.874**
POM-CF 0.509** 0.829**
MAOM-C 0.940** 0.655** 0.208 NS
MAOM-CF -0.509** -0.829** -1.00** -0.208 NS
TN 0.859** 0.608 0.255 NS 0.908** -0.255 NS
POM-N 0.853** 0.915 0.744** 0.682** -0.744** 0.764**
POM-NF 0.578** 0.855 0.954** 0.298 NS -0.954** 0.342* 0.839**
MAOM-N 0.726** 0.368* -0.016 NS 0.870** 0.0156 NS 0.953** 0.532** 0.055 NS
MAOM-NF -0.578** -0.855** -0.954** -0.298 NS 0.954** 0.342* -0.839** -1.00** -0.055 NS
WS-C:N 0.724** 0.847** 0.697** 0.529** -0.697** 0.285 NS 0.612** 0.708** 0.086 NS -0.708**
POM-C:N 0.537** 0.681** 0.619** 0.355 NS -0.619** 0.121 NS 0.350* 0.478** -0.006 NS -0.478** 0.854**
MAOM-C:N 0.734** 0.756** 0.476** 0.609** -0.476** 0.327* 0.574** 0.571** 0.160 NS -0.571** 0.936** 0.680**
MBC 0.021 NS -0.102 NS -0.217 NS 0.106 NS 0.217 NS 0.338* 0.021 NS -0.275 NS 0.424* 0.275 NS -0.404* -0.253 NS -0.402*
Fungi 0.400* 0.371* 0.305 NS 0.360* -0.305 NS 0.169 NS 0.219 NS 0.265 NS 0.119 NS -0.265 NS 0.530** 0.550** 0.481** -0.355*
Protozoa 0.123 NS -0.074 NS -0.171 NS 0.244 NS 0.171 NS 0.467** 0.110 NS -0.194 NS 0.561** 0.194 NS -0.361* -0.287 NS -0.356* 0.637** -0.249 NS
Dm -0.363* -0.354* -0.266 NS -0.308 NS 0.266 NS -0.124 NS -0.141 NS -0.177 NS -0.093 NS 0.177 NS -0.508** -0.628** -0.421* 0.267 NS -0.489** 0.235 NS
Note: F stands for fraction; WS, whole soil.
* and ** indicate significant correlation at P<0.05 and P<0.01, respectively.
NS indicate no significant relationship between variables.
Page 45 of 46C
an. J
. Soi
l. Sc
i. D
ownl
oade
d fr
om w
ww
.nrc
rese
arch
pres
s.co
m b
y H
EL
SIN
KI
UN
IV o
n 03
/08/
18Fo
r pe
rson
al u
se o
nly.
Thi
s Ju
st-I
N m
anus
crip
t is
the
acce
pted
man
uscr
ipt p
rior
to c
opy
editi
ng a
nd p
age
com
posi
tion.
It m
ay d
iffe
r fr
om th
e fi
nal o
ffic
ial v
ersi
on o
f re
cord
.

46
Table 4. Pearson correlation coefficients (r) for relationships among soil properties in Lethbridge site.
TOC POM-C POM-CF MAOM-C MAOM-CF TN POM-N POM-NF MAOM-N MAOM-NF WS-C:N POM-C:N MAOM-C:N MBC
POM-C 0.800**
POM-CF 0.129 NS 0.688**
MAOM-C 0.973** 0.639** -0.10 NS
MAOM-CF -0.129 NS -0.688 NS -1.00** 0.100 NS
TN 0.645** 0.523** 0.173 NS 0.625** -0.173 NS
POM-N 0.554** 0.860** 0.779** 0.378* -0.779** 0.517**
POM-NF 0.230 NS 0.653** 0.788** 0.043 NS -0.788** -0.014 NS 0.845**
MAOM-N 0.549** 0.312 NS -0.057 NS 0.583** 0.057 NS 0.961** 0.260 NS -0.289 NS
MAOM-NF -0.230 NS -0.653** -0.788** -0.043 NS 0.788** 0.014 NS -0.845** -1.00** 0.289 NS
WS-C:N 0.732** 0.586** 0.026 NS 0.712** -0.026 NS -0.045 NS 0.270 NS 0.321 NS -0.138 NS -0.321 NS
POM-C:N 0.602** 0.486** 0.048 NS 0.583** -0.048 NS 0.127 NS -0.013 NS -0.141 NS 0.148 NS 0.141 NS 0.681**
MAOM-C:N 0.694** 0.516** -0.049 NS 0.691** 0.049 NS -0.088 NS 0.248 NS 0.328 NS -0.180 NS -0.328 NS 0.989** 0.577**
MBC -0.106 NS -0.053 NS 0.083 NS -0.117 NS -0.083 NS 0.347 NS 0.193 NS 0.0145 NS 0.325 NS -0.014 NS -0.448* -0.447* -0.439*
Dm -0.246 NS -0.064 NS 0.230 NS -0.295 NS -0.230 NS -0.287 NS 0.094 NS 0.282 NS -0.347 NS -0.282 NS -0.074 NS -0.250 NS -0.050 NS -0.172 NS
Note: F stands for fraction; WS, whole soil* and ** indicate significant correlation at P<0.05 and P<0.01, respectively.
NS indicate no significant relationship between variables.
Page 46 of 46C
an. J
. Soi
l. Sc
i. D
ownl
oade
d fr
om w
ww
.nrc
rese
arch
pres
s.co
m b
y H
EL
SIN
KI
UN
IV o
n 03
/08/
18Fo
r pe
rson
al u
se o
nly.
Thi
s Ju
st-I
N m
anus
crip
t is
the
acce
pted
man
uscr
ipt p
rior
to c
opy
editi
ng a
nd p
age
com
posi
tion.
It m
ay d
iffe
r fr
om th
e fi
nal o
ffic
ial v
ersi
on o
f re
cord
.