soil moisture—fertility interactions related to growth and nutrient uptake of red pine1
TRANSCRIPT

DIVISION S-7—FOREST AND RANGE SOILSSoil Moisture—Fertility Interactions Related to Growth and
Nutrient Uptake of Red Pine1
MARTIN F. JURGENSEN AND ALBERT L. LEAF2
ABSTRACTA 26-year-old red pine plantation (Pinus resinosa Ait.) sup-
ported by Carver coarse sand at O to 18 feet above lake levelon a peninsula was fertilized with 100 Ib/acre of K in 1952.Soil moisture-fertility relationships associated with tree growthand nutrient uptake were examined by (i) total tree chemicalcomposition, (ii) soil chemica l analysis, (iii) soil moistureavailability, (iv) ground water influence including chemicalcomponents, and (v) tree responses to K fertilization. Soilmoisture-fertility interactions on tree development were relatedto depth of ground water: (i) tree height growth, needlearea/acre, content of nutrients, and foliar K concentrations wereinversely related to ground water depth; (ii) tree growth re-sponse to K fertilization was directly related to ground waterdepth.
CONSIDERABLE INTEREST has been shown by investi-gators on the separate effects of soil fertility and soil
moisture on forest trees (3, 7). However, very few inves-tigations have been reported on the interaction of thesefactors on tree growth and development. In one such study,an abnormal seasonal decrease in the mineral element con-tent of Corsican pine litter has been attributed to low mois-ture contents in the tree rooting zone of the soil (21).However, agricultural experimentation has been active insoil fertility-moisture interactions. Early work by Briggsand Shantz (1) reported that fertilizer additions reducedthe water requirements for plant growth. More recently(16) a strong relationship has been reported between Puptake in alfalfa and soil moisture content, and similar re-sults have been observed with wheat (5). Increases in soilmoisture stress have also been reported to depress the netaccumulation of N and P in tomato leaves (2) .
This study attempts to evaluate some of the soil moisture-nutrient element relationships which affect the growth ofred pine (Pinus resinosa Ait.) by examining (i) the chem-ical composition of the trees, (ii) fertility level of thesoil, (iii) soil moisture status, (iv) ground water influ-ences, and (v) response to K fertilization.
MATERIALS AND METHODSThe experimental area is located on a 10-acre peninsula at the
Charles Lathrop Pack Forest in the southeastern Adirondack region1 Contribution from the Department of Silviculture, State Uni-
versity College of Forestry at Syracuse University, Syracuse, N. Y.Financial assistance from National Science Foundation, G-13054,is gratefully acknowledged. 'Presented before Div. S-7, Soil ScienceSociety of America, Nov. 21, 1963, at Denver, Colo. ReceivedNov. 12, 1963. Approved Feb. 16, 1965.
2 Research Assistant in Soils, North Carolina State College,Raleigh; and Professor of Silviculture, State University College ofForestry at Syracuse University. Sincere appreciation is expressedto J. B. Hart, Jr., R. G. Miller, D. M. Riordan, E. H. White,G. K. Xydias, Dr. H. A. I. 'Madgwick who assisted in variousphases of the field, laboratory and office work, and A. F. Ike andDean S. O. Heiberg for their consultations.
of New York having a 26-year-old, 6 by 6 feet spaced red pineplantation supported by Carver coarse sand. The slope of thepeninsula is relatively uniform with elevations ranging from O to18 feet above Pack Lake. The area had been in agricultural useprior to tree planting in 1935, and was fertilized with 100 Ib/acreof elemental K as K'Cl applied broadcast in 1952.
Six 1/40-acre plots were established at various positions on thepeninsula slope in 1961 and the plot elevations above the lakewere determined by leveling. The plots were positioned so as tohave two sampling areas at each extreme of elevation and twoadditional points in the central position of the slope. The diameterat breast height (dbh) of all trees was tallied and the tree near-est to mean basal area removed from each plot for total treesampling. All needles segrega ted by age, branches segregatedbetween living and dead, bole bark, and bole wood were collected,refrigerated, and transported to the laboratory. Total tree heights,internodal growth, and leader elongation were determined with atape by climbing each tree in the plot. Soil pits were dug to theground water on the four plots of lowest elevation above the lakeand to 10 feet depth on the remainder. Eight 250-cc soil cores (4)were removed from each horizon and strata for chemical andphysical analyses. Soil samples for gravimetric moisture determi-nations were obtained periodically with a Veihmeyer tube. Theground water at each elevation was sampled periodically with apitcher pump attached to a 1-inch diameter pipe which had beenhydraulically forced to the ground water. Four milliliters of for-maldehyde were added to each water sample to retard bacterialand algal growth. Fluctuations in ground water level were deter-mined periodically on all plots and an automatic water levelrecorder^ was maintained on a plot 8 feet above the lake.
In the laboratory all organic material was dried to a constantweight at 70C, and ground to pass a 2-mm sieve. Samples werequartered and representative subsamples were analyzed for N bythe Kjeldahl method, and others were ashed at 480C, dissolvedin HC1, and analyzed for K, Ca, and Mg flame spectrophotometri-cally (17, 20) and P determined by the vanadate colorimetricprocedure.
Soil less than 2 mm in diameter was analyzed for organicmatter concentration by loss on ignition, total N by the Kjeldahlmethod, IN neutral NHiOAc extractable K, Ca, and Mg was deter-mined flame spectrophotometrically, and 0.002N H2SCU extractableP analyzed by the molybdenum colorimetric procedure (20) .
In the water analysis all samples were filtered, aliquots evapo-rated to dryness and dissolved in HC1, and the K analyzed flamespectrophotometrically (20) . The total salt content was determinedwith a conductance bridge calibrated with KC1 solution.
Field capacity of each horizon and strata was estimated byplacing soil cores in water for 24 hours, allowing to drain for 36hours in a saturated atmosphere, and placing on filter paper for2 minutes to remove water held at the soil-air interface. Thedwarf sunflower method was used for wilting point determina-tions (10).
RESULTS AND DISCUSSIONThe presentation of experimental results and ensuing
discussion are d iv ided into two parts: (i) differencesobserved in tree and stand growth, tree chemical composi-tion, and soil properties as related to the height of thestand above ground water; and (ii) additional informationwhich may delineate the mechanisms by which depth dif-ferences to ground water influenced tree growth.
Mensurational DataConsiderable differences in tree height, basal area, and
total needle area occurred among plots, and were related3 Stevens Recorder, Type F. Leopold and Stevens Instruments,
Portland, Greg.
294

JURGENSEN AND LEAF: SOIL MOISTURE—FERTILITY INTERACTIONS RELATED TO RED PINE 295
to the stand elevation above the lake (Table 1). In thiscoarse sand the ground water level under the peninsulacorresponded in elevation to the lake level.
The correlation coefficient of basal areas and stand ele-vations above the ground water level was significant (r =—0.878*), indicating that a strong inverse relationshipexisted. An inverse relation with total tree heights anddepth to ground water also occurred. Analysis of varianceof the dominant tree heights denoted a significant F value.The Scheffe Test was used for individual comparisonsamong various stand elevations, and showed that the totalheights among plots (except plots 3 to 4 and 5 to 6)differed significantly to at least the 5% level. The lack ofsignificance between the two middle plots may be attributedto the small difference in ground water depth, but the re-sults between the two plots of greatest elevation aboveground water indicated that below a depth of 10 feet fromthe soil surface the influence of the ground water decreasedmarkedly.
The terminal leader growth of the red pine at each ele-vation above the lake was examined at three dates duringthe summer of 1961 to determine if the total tree heightswere based only on differences in the growth rate or if thelength of the leader elongation period was affected. Figure1 presents the leader growth prior to June 22, and betweenJune 22 to July 22 for five dominant trees per plot. Asimilar observation on August 22 showed that no noticeableincrease in tree leader growth had occurred on any plot.The two observations indicated an inverse relation betweenthe rate of tree leader growth and the plot elevation abovethe ground water. Also, on the plot of greatest elevationleader growth had halted by June 22 while additionalelongation continued at the lower elevations. Thus, differ-ences in tree height growth may be largely attributed tovariations in the rate of leader growth but in part to differ-ences in the length of the growing period.
Needle area was estimated by a formula that assumes aneedle of true cylindrical shape (9), consequently thismeasure overestimates due to deviations from the model.However, the values obtained are valid for relative com-parisons. Figure 2 presents the relationship of total needlearea to average stand height growth from 1956 to I960and compares these values to the regression line computedfor near-by, similar age red pine stands supported by sim-ilar soil but not influenced by the presence of ground water.(H. A. I. Madgwick. 1962. Studies in the growth and nutri-tion of Pinus resinosa Ait. Ph.D. Thesis. State Univ. Col-lege of Forestry at Syracuse University, Syracuse, NeivYork.) Assuming that height growth is a function ofneedle efficiency in producing photosynthate, the higherneedle area to height growth ratio than estimated by the
Table 1—Stand data of a 26-year-old, 6 by 6 feet spaced redpine plantation supported by Carver coarse sand at
varying depths to ground water
2J
Plot Depthno. to
groundwater*
feet
1 2 22 33 84 85 106 16
50
•380
Totalheight
feet
50. 847. 843.243.040 .940. 2
Men
Siteindext
454339403835
Burational analysisDBH Basal
area
inches sq ft/acre
7.08 2236.60 2475.97 1966.25 1816.11 1926.13 167
Totalneedlearea
acres/acre^
8. 429. 787.637. 736. 006. 87
IjO S 6
103ft I6£ft
Fig. 1—Average leader growth rate of 26-year-old red pinesupported by Carver coarse sand at varying depths to groundwater.
Bi82i
<B8
o
4.3'
' Measured on June 10, 1961. t Site index curves from Richards et al (11). SI basedon total height over age above b. h. for six dominant trees; classification age 20 yearsabove b. h. J Estimated from tree of mean basal area.
5 6 7 8 9 10TOTAL NEEDLE AREA — ACRES/ACRE
Fig. 2—Relationship of 26-year-old red pine height growth tototal needle area for stand supported by Carver coarse sand;and compared to a similar stand and soil lacking the groundwater influence (Regression line from Madgwick). Numbers1 through 6 refer to plots with various depths to groundwater. (See Table 1).

296 SOIL SCIENCE SOCIETY PROCEEDINGS 1965
regression line indicated that the efficiency of the needleswas greater in the presence of the ground water. The totalneedle area was also found to be inversely related to depthto ground water.
Even though the mensurational data shows a strong rela-tionship to water table depth, the differences in tree growthbetween plots 1 and 2 are not pronounced. On these plotswith shallow depth to ground water, the trees are influ-enced by the ground water from very early age. As evidentfrom Fig. 3, the average annual height growth on plot 2was considerably less than that on plot 1 for the first 8years after plantation establishment. From that time verylittle differences between these plots are noted in annualheight growth. It may be concluded that at the groundwater depth of plot 2, 3.5 feet, initial height growth wasless than on plot 1, ground water At 2.2 feet and capillaryfringe influence to the soil surface, until the roots reachedthe zone of ground water influence, then the trees on plot1 and 2 developed at about the same rate. For red pine, aspecies very sensitive or intolerant to wet sites (14), aground water depth of 3.5 feet may give a better balanceof available moisture and aeration for tree development.
Chemical Composition of Trees and SoilThe nutrient element concentration of the various tree
components was examined to determine if a relationshipexisted between concentration values and depth to watertable. Of the many possible combinations only K in thefoliage was found to be correlated with elevation aboveground water. Consequently, the individual values exclud-ing foliar K were averaged and are presented in Table 2.The foliar K concentrations at each sample elevation areshown in Table 3. Generally, concentrations within the treedecreased in the order: needles, bole bark, live branches,dead branches, and bole wood, but variations occurred.While K was approximately equal in bole bark and livebranches, Ca and ash had considerably higher concentra-tions in the bark. The bole wood was consistently low innutrient elements.
Comparing ash and nutrient element concentrations indi-cated a decrease in the order: ash, Ca, N, K, Mg, and P,however, variations again occurred in the bole wood. TheCa concentrations exceeded the N values in the woody por-tion of the trees and were less than K in the first yearneedles.
In needles, K and P concentrations decreased with needleage, and N, after remaining relatively constant in the first2 years, also decreased. Ash, Ca, and Mg concentrationsincreased with needle age, but Mg concentrations decreasedsharply in the fifth year needles. Since nutrient concentra-tion values are in direct relation to variability of needledry weight and needle weight increased with age, N, P,and K would decrease by dilution as well as loss throughtranslocation and leaching. The Ca, in addition to beingan integral part of the cell wall, is precipitated in the formof organic salts or absorbed on internal plant surfaces thusincreasing the concentration.
The association of the depth to the water table to foliar
Table 2—Average concentrations of ash and nutrient elementsin various components of 26-year-old red pine supported
by Carver coarse sand of variable depths to ground water
Treecomponent
Needles1st yea2nd yea3rd yea4th yea5th yeaDead
BranchesLiveDead
BoleWoodBark
Ash N P
__,
K»
, , ,
Ca Mg
, „2.1262.4642.6442.7713.5372.799
1.3561.298
0.3003.077
1.2111.2661.1260.9990.8490.789
0.2530.187
0. 0710.269
0. 1430. 1000.0910. 0820.0690.082
0. 0310.009
0. 0050.038
---_ _ _-----_- _ _---
0. 0790.020
0. 0200. 077
0.3740.6990.7360.8420.9520.758
0. 5370.576
0. 1571. 081
0. 0520.0700. 0700.0820.0610.112
0.0480.045
0. 0360. 040
See Table 3. Only foliar K concentrations were correlated with elevations abov_ground water.
Table 3—The K concentration of foliage in 26-year-old red pinesupported by Carver coarse sand of variable depths
to ground water
Needle Elevation above ground water, feet
8.3
AGE
Fig. 3—Average annual height growth from 1935 through 1961of red pine supported by Carver coarse sand with varyingdepths to ground water.
1st2nd3rd4th5thDead
T^ ___ __ t Jm ... „,„!>! U....J..
0.6050.3900.3450.3500.3350.510
0.6400.4400.4000.3850.3300.745
0.570 0.510 0.4950.3850.3300. 2900.3600.490
0. 3150.2700.2350.2350.320
0.4000.3400. 3000.2500.220
0.5350.3300.2700. 2550.2200.145
-0. 715-0.588-0.692-0.739-0. 755»-0.859*
* Denotes significance to the 5% level.t Correlation of foliage concentrations with depth to water table.
JURGENSEN AND LEAF: SOIL MOISTURE—FERTILITY INTERACTIONS RELATED TO RED PINE 297
K is clearly seen in Table 3. There was a general decreasein K concentration in all needle ages as the depth to groundwater increased. Of particular note was the relationshipfound in the dead needles. At the lower elevations the Kconcentration increased considerably from the older needlesto the dead needles. As the plot elevation increased, thisdifferential was reduced until the highest plots showedconcentrations lower in the dead needles than in the fifthyear. This correlation between foliage K concentration andground water depth became stronger as the needle ageincreased indicating that the amount of K translocated fromthe older leaves was influenced by the ground water depth.Translocation differences may be related to the relativeavailability of the ion in the soil to the tree. Thus, sam-pling of older foliage, as advocated by Madgwick (8),would appear to be of greater diagnostic value in estimat-ing tree K status than the generally accepted near-terminalposition.
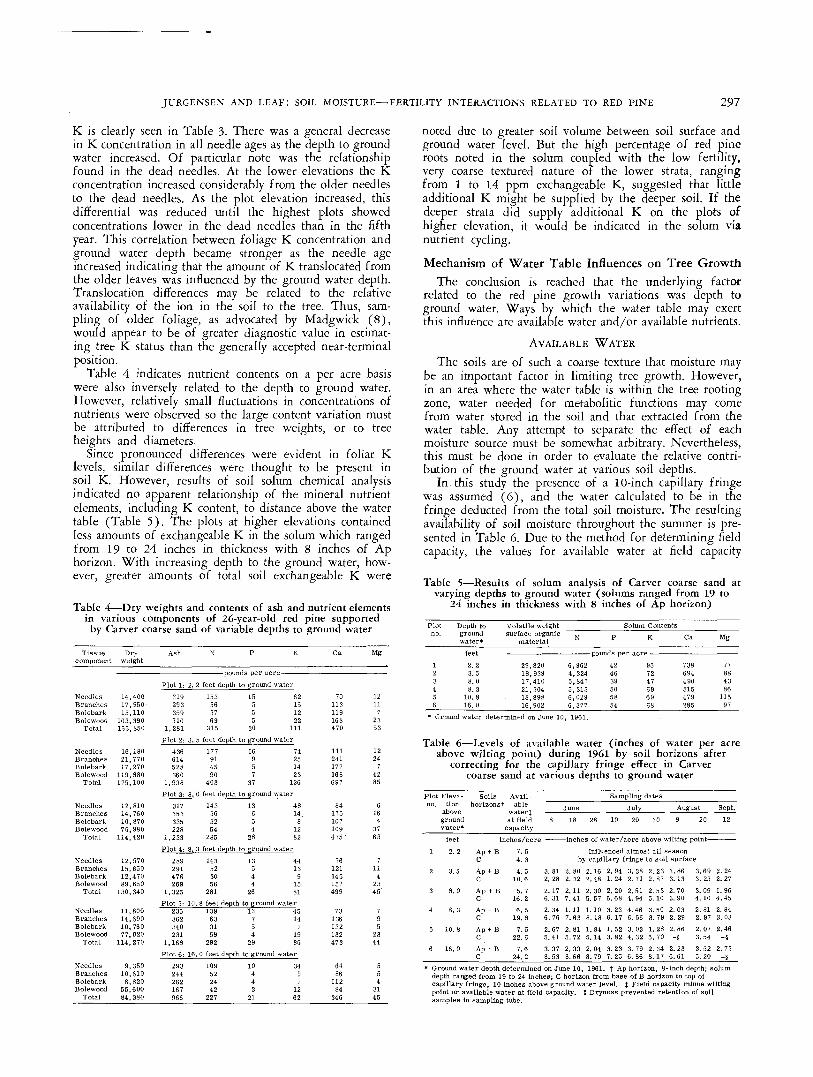
Table 4 indicates nutrient contents on a per acre basiswere also inversely related to the depth to ground water.However, relatively small fluctuations in concentrations ofnutrients were observed so the large content variation mustbe attributed to differences in tree weights, or to treeheights and diameters.
Since pronounced differences were evident in foliar Klevels, similar differences were thought to be present insoil K. However, results of soil solum chemical analysisindicated no apparent relationship of the mineral nutrientelements, including K content, to distance above the watertable (Table 5). The plots at higher elevations containedless amounts of exchangeable K in the solum which rangedfrom 19 to 24 inches in thickness with 8 inches of Aphorizon. With increasing depth to the ground water, how-ever, greater amounts of total soil exchangeable K were
Table 4—Dry weights and contents of ash and nutrient elementsin various components of 26-year-old red pine supported
by Carver coarse sand of variable depths to ground water
Tissuecomponent
NeedlesBranchesBolebarkBolewood
Total
NeedlesBranchesBolebarkBolewood
Total
NeedlesBranchesBolebarkBolewood
Total
NeedlesBranchesBolebarkBolewood
Total
NeedlesBranchesBolebarkBolewood
Total
NeedlesBranchesBolebarkBolewood
Total
Dryweight
14,17,15,
103,155,
16,21,17,
119,175,
12,14,10,75,
114,
12,15,12,89,
130,
11,14,10,77,
114,
9,10,
8,55,84,
400950110390850
180770270880100
810760870980420
570650470650340
800690760020270
350610820600380
Ash
Plot 1:
319293359310
1,281
Plot 2:
436614528360
1,938Plot 3:
317353335228
1,233
Plot 4:
289291476269
1,325Plot 5:
235362340231
1,168Plot 6:
293244262167966
N P K Ca Mg
2. 2 feet depth to ground water
153563769
315
3. 5 feet depth177914590
403
8. 0 feet depth
143563254
285
15555
30
to ground w:
16957
37
to ground w;
13654
28
8. 3 feet depth to ground w;
143523056
28110. 8 feet depth
139633159
292
16. 0 feet depth
109522442
227
13544
26
62151222
111
Iter
74251423
136
iter
4814
81282
iter
4413
91581
70 12113 11119 7168 23470 53
111 12241 24177 7168 42697 85
84 6175 16107 4109 37475 ' 63
76 7121 11145 4157 23499 45'
to ground water13
754
29to ground \\
10443
21
4514
71985
•ater
349
1262
73 7136 9132 5132 23473 44
64 586 5
112 484 31
346 45
noted due to greater soil volume between soil surface andground water level. But the high percentage of red pineroots noted in the solum coupled with the low fertility,very coarse textured nature of the lower strata, rangingfrom 1 to 14 ppm exchangeable K, suggested that littleadditional K might be supplied by the deeper soil. If thedeeper strata did supply additional K on the plots ofhigher elevation, it would be indicated in the solum vianutrient cycling.
Mechanism of Water Table Influences on Tree GrowthThe conclusion is reached that the underlying factor
related to the red pine growth variations was depth toground water. Ways by which the water table may exertthis influence are available water and/or available nutrients.
AVAILABLE WATERThe soils are of such a coarse texture that moisture may
be an important factor in limiting tree growth. However,in an area where the water table is within the tree rootingzone, water needed for metabolitic functions may comefrom water stored in the soil and that extracted from thewater table. Any attempt to separate the effect of eachmoisture source must be somewhat arbitrary. Nevertheless,this must be done in order to evaluate the relative contri-bution of the ground water at various soil depths.
In this study the presence of a 10-inch capillary fringewas assumed (6), and the water calculated to be in thefringe deducted from the total soil moisture. The resultingavailability of soil moisture throughout the summer is pre-sented in Table 6. Due to the method for determining fieldcapacity, the values for available water at field capacity
Table 5—Results of solum analysis of Carver coarse sand atvarying depths to ground water (solums ranged from 19 to
24 inches in thickness with 8 inches of Ap horizon)
Plotno.
123456
Depth togroundwater*
2.23.58.08.3
10.816.0
Volatile weightsurface organic
material
29,82018,93917,41021,30418,89816,902
N
6,9624,3245,8475,3156,0296,377
P
424639505854
Solum Contents
K
957247696968
Ca
738694490515479285
Mg
77884386
11597
* Groundwater determined on June 10, 1961.
Table 6—Levels of available water (inches of water per acreabove wilting point) during 1961 by soil horizons after
correcting for the capillary fringe effect in Carvercoarse sand at various depths to ground water
Plot Eleva-no. tlon
groundwater*
1 2.2
2 3.5
3 8.0
4 8.3
5 10.8
6 16.0
Soilshorizons t
Avail-able
at fieldcapacity
ApCApCApC
ApCAPCAPC
j ,
Sampling dates
8
+ B 7.5
+ B
-f B
t- B
+ B
+ B
4.34.5
10.6
5.716. 26. 5
19.8
7.522.6
7. 624.2
June
18 28 10
/
July
20
Influenced almos
August
30
^
9 20
.
Sept.
12
it all seasonby capillary fringe to soil surface
3.812.28
2.176.31
2.346.76
2.675.41
3.378.53
2.802.322.117.41
1.117.632.815.72
2.338.66
2.162.48
2. 305. 57
1.108.18
1.845.14
2.048.79
2.941.24
2.206.68
3.236.17
1.523.82
3.237.25
3.382.71
2.514.94
4.466.56
3.034.32
3.796.86
2.232.87
2.535.10
3.503.79
1.285.70
2.348.17
3.863.13
2.703. 90
2.032.29
2.86-§
2.236.61
3.693.23
3.094.10
2.812.97
2.073.54
3.525.20
2.242.27
1.964.45
2.843.03
2.46-§
2.73-S
1 Ground water depth determined on June 10, 1961. t Ap horizon, 8-inch depth; solumdepth ranged from 19 to 24 inches; C horizon from base of B horizon to top ofcapillary fringe, 10 inches above ground water level. J Field capacity minus wiltingpoint or available water at field capacity. § Dryness prevented retention of soilsamples in sampling tube.
298 SOIL SCIENCE SOCIETY PROCEEDINGS 1965
may be somewhat over-estimated. This would be caused byan insufficient downward force in the drainage techniqueused to remove all gravitational water. However, this over-estimatipn would have no effect on the soil moisture valuesobserved during the sampling period.
The variable trends in surface soil moisture may be par-tially attributed to horizon variability and precipitation of0.25 to 0.5 inches on June 10, 20, July 9, 18, 31, August7, 27, September 5, 10, and precipitation of approximately1 inch on July 15 and August 11, 1961. However, severalof the soil moisture variations examined could not be ade-quately explained by these reasons, e.g., moisture depletionin the subsoil. The differences observed in the lower stratawere likely related to changes in microrelief at individualmoisture sampling points. This would alter the distance toground water and introduce an error in the capillary fringemoisture correction for that date. Fluctuations in the lakeand its corresponding effect on the water table may also bea factor. At the lowest elevation, plot 1, this separation ofground water from soil water could not be employed asthe capillary fringe was greater than 10 inches in the solumand extended to the soil surface for most of the samplingperiod.
The total available moisture in plots 2 through 6 in earlyJune showed that soil moisture levels in the upper horizonswere well below field capacity, indicating that a moisturestress was present when the trees were most actively grow-ing. This condition has been found to have a pronouncedeffect on subsequent growth of agricultural plants and trees(7, 13). However, at all these elevations the upper hori-zons in which most of the soil nutrient element uptakeoccurs were quite similar in regard to soil moisture levelsthroughout the sampling periods. Thus, the differences inK uptake at the various elevations were not strongly relatedto the amount of water actually contained in the solum.
The possible contribution of the ground water to themoisture status of each plot was then examined. Since plot1 was under the direct influence of the water table for mostof the sampling period, the greatest percentage of themoisture utilized by the trees on this lowest plot came fromthe water table. A question then arises as to what was theground water contribution to trees located farther up thepeninsula slope. This was partially answered by the pres-ence of a water level recorder on plot 3, a distance of 8feet above the water table. An estimate of ground waterextracted by the tree roots was obtained from the recordercharts by comparing the rate of water level lowering in theevening to that in the daytime. (D. R. Satterlund. I960.Some interrelationships between ground water and swampforests in the western upper peninsular of Michigan. Ph.D.thesis, University Michigan, Ann Arbor.) From this tech-nique, only 1.18 inches of water were found to have beenutilized by the trees from June to the middle of Septem-ber. This estimate of water use was probably low sincewater uptake in the evening was not taken into account.However, even with this error the contribution of theground water to the water economy of the trees on this plotwould be considerably less than on a site with a shallowdepth to ground water where nearly all moisture used bythe trees was from the ground water. This conclusion issupported by investigations on phreatophytes in the south-western U.S. in which the water uptake by these plantsdecreased as the depth to the ground water increased toapproximately 7 feet (12). Also noted from the groundwater fluctuations was a greater uptake of ground water
in the early portion of the sampling period. This may beattributed to a large number of roots situated near thehigher water table levels and would be important sincemost active tree growth occurs at this time.
AVAILABLE NUTRIENTSAnother means by which ground water may have influ-
enced tree growth was by affecting nutrient element avail-ability, in this instance K. This influence was noted by treegrowth responses to an application of K fertilizer in 1952.Having obtained annual height growth data for trees ineach plot, the effect of elevation changes on the growthresponses to a K addition may be assessed (Fig. 3).
Apparent changes in height growth rate were noted atall plots following fertilization with the significance ofthe variation related to the depth of the water table. Thiswas determined by compar ing average a n n u a l heightgrowth of 10 dominant trees for 7 years prior to and 7years after fertilization. The results for this period of com-parison, expressed as values of t, indicated a near signifi-cant decrease in height growth after fertilization on thetwo plots of lowest elevation. The apparent reduction ingrowth may be attributed to less favorable climatic condi-tions after fertilization or possible increased leader damageby snow or ice.
However, the opposite effect of fertilization was observedon the plots of higher elevations. On these areas the growthreaction to the fertilizer treatment was directly correlatedto distance above the water table. The magnitude of theheight growth response increased with plot elevation untila statistically significant difference occurred on both plot5 and plot 6, soil surface 10.8 feet and 16.0 feet, respec-tively, above ground water. Thus, if these growth responseswere assumed to be dependent on the K status at each site,the availability of K to tree roots was related to the depthof ground water.
CHEMICAL COMPOSITION OF GROUND WATERFrom the response of trees at higher elevation to fer-
tilization it is likely that the availability of K to the treeswas at least partially responsible for the growth differencesobserved. However, soil tests showed that little differenceswere present in solum K levels as site elevations changed.This may be related partially to the questionable adequacyof the IN NH4OAc-extractable K as a measure of theavailable-to-trees fraction of soil K (18, 19), as well assuggesting that the ground water may be acting as a supplysource of K to the trees with the contribution decreasingat higher elevations. Analysis of the ground water undervarious elevations of the peninsula indicated the K con-centrations ranged narrowly around 0.5 ppm with no defi-nite changes throughout the summer. Such small amountsof K in solution could be of importance in the nutrienteconomy of the trees. Since the ground water K is continu-ally being replenished from the lake, a constant concentra-tion is maintained. It has been reported that such a lowconcentration of K can have considerable influence on treegrowth (15). This may be true even when the amount ofwater uptake is small since ion uptake is a metabolic func-tion and may not be n u m e r i c a l l y related to the waterabsorbed by the tree.
CONCLUSIONSThe results of these studies involving the growth of red
pine situated on a coarse-textured peninsula soil leads tothe following conclusions.
HEATON ET AL.: MICRONUTRIENTS IN FOLIAGE OF THREE CONIFEROUS TREES 299
Stand growth differences such as total height, basal area,needle area and efficiency, date of leader growth termina-tion, tree nutrient contents, and foliar K concentrationswere inversely related to the depth of the water table belowthe soil surface.
The influence of the water table on tree growth wasrelated to its effect on two environmental factors: availablewater and available nutrients. Both moisture and nutrients,particularly K, were being supplied to the trees by theground water. However, this contribution decreased as thewater table depth increased.
Water is apparently the overriding factor limiting growthon this area. But due to moisture-nutrient interactions it isdifficult to ascertain whether the inverse relation betweentree growth and increasing depth to ground water was pri-marily caused by a lack of water necessary for biologicalfunctions or to the effect of moisture on ion transport anduptake.