soil microbial dynamics in costa rica: seasonal and ... copy.pdfsoil microbial dynamics in costa...
TRANSCRIPT

BIOTROPICA 36(2): 184-195 2004
Soil Microbial Dynamics in Costa Rica: Seasonal and Biogeochemical Constraints^
Cory 0. Cleveland^, Alan R. Townsend, Briana 0. Constance
Institute o f Arctic and Alpine Research, University o f Colorado, Campus Box 450, Boulder, Colorado 80309, U.S.A.
Ruth E. Ley
Department o f Molecular, Cellular and Developmental Biology, Campus Box 347, University of Colorado, Boulder, Colorado 80309, U.S.A.
and
Steven K. Schmidt
Department o f Environmental, Population and Organismic Biology, Campus Box 334, University o f Colorado, Boulder, Colorado 80309, U.S.A.
ABSTRACTThe soil microbial biomass is largely responsible for the transformation of organic matter and the associated mineralization of important nutrients that regulate plant productivity. While the controls on soil microbial biomass and activity in temperate ecosystems have been well investigated, there is a paucity of such information from tropical rain forest ecosystems. Hence, we used a natural soil gradient (nutrient-poor oxisols and nutrient-rich mollisols) to investigate seasonal changes in the size and activity of the soil microbial community in two primary tropical rain forest sites in southwestern Costa Rica. In a nutrient-poor oxisol, microbial biomass ranged from 952 fJLg/g in the dry season (February) to 1967 fJLg/g in the wet season (June). The greater microbial biomass estimates corresponded to greater rates of microbial activity in the oxisol forest; however, the active fraction of the soil microbial biomass remained consistently low, regardless o f soil C availability. In addition, while there was very little seasonal variability in microbial C:N ratios, we found extreme variations in seasonal microbial C:P ratios, with the highest microbial C:P ratio occurring when microbial biomass C was at a maximum. Our results suggest the importance of P availability in regulating soil microbial processes and that decomposition during the wet season (of litter accumulated in the previous dry season) may play an important role in driving seasonal changes in microbial biomass and activity.
RESUMENLas comunidades microbianas del suelo influencian en gran medida la descomposicidn de materia organica y la mineralizacidn de los nutrientes necesarios para la produccidn primaria de plantas. Aunque los factores que gobiernan la actividad microbiana de suelos en la zona templada ban sido investigados extensamente, carecemos de informacidn sobre bosques tropicales bumedos. En este estudio, usamos sitios de fertilidades variables con el fin de investigar efectos estacionales en el tamano y la actividad de las comunidades microbianas del suelo en dos bosques tropicales bumedos en el sudoeste de Costa Rica (Peninsula de Osa). En los suelos infertiles (oxisoles), el tamano de la comunidad microbiana se extendio de 952 fJLg/g en la estacidn seca (febrero) a 1967 fJLg/g en la estacidn lluviosa (junio). Ademas, las mayores estimaciones de la comunidad microbiana correspondieron a mayores tazas de cambio de la actividad microbiana. Sin embargo, la fraccidn microbiana activa se mantuvo siempre baja independientemente de la cantidad de carbono en el suelo. Ademas, aunque no bubo mucba variabilidad en las proporciones de carbono (C) y nitrdgeno (N) en la masa microbiana con la estacion del ano, encontramos grandes cambios en las proporciones de C y de fosforo (P). En particular, observamos una proporcion mas grande de C (sobre P) cuando el tamano de la comunidad microbiana fue maximo. Nuestros resultados sugieren que la disponibilidad de P regula el tamano y la actividad microbiana en este ecosistema, y que la descomposicion de bojascara en la estacion lluviosa (de bojas que se cayeron en la estacion seca anterior) influencia en gran medida el tamano y la actividad microbiana entre las estaciones del ano.
Key words: C and P dynamics; microbial biomass; phosphorus; seasonal dynamics; tropical rain forest.
Received 1 July 2003; revision accepted 13 January 2004. Corresponding author; e-mail: [email protected]
184

Soil Microbial Dynamics in Costa Rica 185
S o i l m i c r o b i a l b i o m a s s , consisting largely o f a consortium o f bacteria and fungi, is im portan t in regulating ecosystem processes such as decomposition, energy flow, carbon (C) storage, and trace gas fluxes (Swift et al. 1979, Paul & C lark 1997, Schlesinger 1997). In addition, soil m icrobial processes are responsible for the transform ation o f soil organic m atter and the associated mineralization of im portan t nutrients tha t regulate p lan t productivity. O n an annual basis, m ost o f the nu trien t requirements o f land plants are m et via the mineralization o f soil organic nutrients by the microbial com m unity (Paul & C lark 1997); thus, soil m icrobial processes strongly regulate ecosystem net prim ary production.
The role o f the soil m icrobial com m unity in nu trien t transform ation m ay have additional im portance in tropical rain forest ecosystems. Specifically, phosphorus (P) is generally believed to be the m ost lim iting elem ent in the m ajority o f tropical forests on old, highly weathered soils (Walker & Syers 1976, V itousek 1984, V itousek & Sanford 1986). A lthough the biomass o f soil m icroorganisms is typically less than tha t o f vascular plants, its non-nitrogen m ineral nu trien t concentration m ay be as m uch as ten times greater (Cole et al. 1977, Paul & C lark 1997) and contain as m uch P per hectare as vegetation (H aym an 1975). M oreover, because there m ay be m ultiple generations of growth by diverse groups o f soil microorganisms each year, their annual dem and and uptake o f nu trients often exceed those o f vascular plants (Paul & C lark 1997). Hence, the strong P dem ands of the soil m icrobial com m unity in an ecosystem, where P already limits prim ary productivity, m ay acmally provide an im portan t P retention m echanism by preserving P in actively cycling biological pools (i.e., the microbial biomass) and attenuating losses to m ore perm anent geochemical sinks (Ue- hara & Gillm an 1981, O berson et al. 1997).
In spite o f the likely im portance o f the soil m icrobial biomass in m aintaining nu trien t fertility in the already P-poor soils o f the hum id tropics, very little is know n about w hat regulates soil m icrobial biomass and activity in these ecosystems. In addition, tropical forests are currently undergoing rapid rates o f land conversion and land use change. O n a global basis, deforestation and subsequent land use in tropical ecosystems remove roughly 2 percent o f the rem aining forest cover per year (W illiams & Chartres 1991, H oughton 1994, Nepstad 1999). The m ajority o f cleared tropical forests are converted to cattle pasm re (Fearnside 1996), a change that can have profound effects on the soil
m icrobial com m unity (and hence potentially serious effects on nu trien t transform ations in these nu trient-poor ecosystems). To understand how land use change is likely to affect the soil m icrobial com m unity strucm re and function, and the associated biogeochemical consequences, it is critical that we first understand the factors tha t regulate soil m icrobial processes in nam ral tropical forest ecosystems.
O ur objectives in this study were to determine seasonal changes in m icrobial biomass and a suite o f microbial processes in two lowland tropical rain forest sites o f southwestern Costa Rica. Like m any tropical rain forests, our study sites experience a pronounced annual dry season from December through M arch. We hypothesized tha t both the strucm re and the function o f the soil microbial com m unity w ould flucmate seasonally, w ith a larger, m ore active com m unity characterizing the wet season (Scatena 2001). In addition, we hypothesized tha t changes in m icrobial com m unity structure and function w ould have profound effects on both carbon and nu trien t cycling in this ecosystem.
MATERIALS AND METHODSS t u d y a r e a .— T he study area was near the tow n of Agujitas on the Osa Peninsula in southwestern Costa Rica (Cleveland et al. 2002). This region lies w ith in the tropical w et lowland forest bioclimate (H oldridge et al. 1971); annual rainfall is heavy, averaging ca 5000 m m /yr, b u t is also seasonally variable. T he Osa Peninsula is dom inated by the Pacific rainfall regime, w ith peak rainfall occurring during sum m er to early fall (June—O ctober) and a pronounced dry season during the northern w inter (D ecem ber-April). W hile the dry season on the Osa is relatively short compared to m any other tropical forests (Janzen 1983), the variation between wet and dry m onths in this area is notew orthy. Over a seven-year period (1980-1987), D ecember—M ay rainfall averaged less than 250 m m / m o at the Sirena Biological Station, 25 km southwest o f our sites. In contrast, over the same period. M ay—Novem ber rainfall averaged m ore than 500 m m /m o, and every m onth between M ay and N ovember received m ore than 250 m m of rainfall (Sterrenberg 1990). Because overall precipitation is very high, however, nearly all forms of vegetation persist in an evergreen state throughout the year. Leaf senescence and litterfall reach a m axim um during the dry season (Sterrenberg 1990).
The entire Osa Peninsula was formed in three large seafloor volcanic events between roughly from

186 Cleveland, Townsend, Ley, Schmidt, and Constance
TABLE 1. Physical and hiogeochemical characteristics o f oxisol and mollisol (0—10 cm soil) forest sites. Error values , ± 1 SR
Oxisol Mollisol
Soil texture Clay LoamSand (%) 26 42Silt (%) 30 28Clay (%) 44 31
pH (water) 5.4 ± 0.2*** 6.0 ± 0.3***Soil C (mg/g) 65.0 ± 3.0 68.0 ± 4.0Soil N (mg/g) 6.0 ± 0.0 6.0 ± 0.0Soil P (g,g/g) 557.1 ± 18.5*** 1051.4 ± 43.1***Soil Ca (q.g/g) 1418.4 ± 257.2*** 4484.8 ± 687.3***Soil Mg (q.g/g) 285.4 ± 33.3*** 546.2 ± 57 .4 ***Soil K (q.g/g) 58.8 ± 7 .1*** 110.6 ± 10.2***Bulk density 0.52 ± 0.02* 0.66 ± 0.02*Total C (kg/m^) 3.4 4.5Total N (kg/m^) 0.3 0.4Total P (g/m^) 28.9 69.4C:N 11.6 ± 0.3 11.6 ± 0.4C:P 117.0 ± 6.3** 69.9 ± 0.8**
' P < 0.05; ** P < 0.01; ' P < 0.001.
75 to 40 X 10® years ago, b u t some parts o f the region were below sea level in more recent geologic eras (Berrange & T horpe 1988). This created a wide range of paren t material ages and subsequent soil types, from highly weathered more than 40 x 1 0 ®-year-old oxisols to highly fertile alluvial m ollisols o f Q uaternary origin. Forests in this region thus occur on three general soil types: ( 1 ) old, highly w eathered oxisols on steeply dissected terrain that rarely exceeds a few hundred meters elevation; (2) m uch younger (2 to 4 10®-year-old) ultisols on roughly similar upland terrain; and (3) the highly fertile mollisols found on the alluvial plains. O ur sites were located near the transition between the old upland oxisols and the young lowland m ollisols. We selected two forest sites representing each soil type, hereafter referred to as oxisol forest (OF) and mollisol forest (MF); the M F site was located on relatively young, nutrient-rich alluvial soils, while the O F site was on old, acidic, highly w eathered, relatively nutrient-poor soils. The sites were all less than 500 m apart, and thus identical climatically (M AT = 26° C; M AP = ca 5100 m m / yr; Sterrenberg 1990). W hile the forests were all characterized by high p lan t diversity and were no t dom inated by any single species, they were floris- tically similar. For example, both sites were stratified, closed canopy prim ary forest sites, and both sites contained several com m on canopy species (e.g., Brosimum utile, Caryocar costaricense, Hie- ronyma alchorneoides, Vantanea barbourii, and Schi- zolobium parahybum) and understory species (e.g., Bromelia spp. and Geonoma spp.)
S o i l s a m p l i n g .— Soils for bulk chemical analyses (Table 1) were sampled in June 2000, and soils for P and biological analyses were sampled in both June 2000 (wet season) and February 2001 (dry season). A t both sites, 8 X 1 0 cm soil samples were extracted every 5 m from two random ly placed 25 m transects bisecting each site, for a total o f ten samples per site. Soils were sampled to a depth of 1 0 cm, reflecting the region of greatest microbial density and activity observed com m only in the soil profile (Ekelund et al. 2001). Following collection, samples were double-bagged and chilled on ice, re- m rned to the laboratory, and w ith in 72 hours o f collection, were coarsely sieved (4 mm ) to remove rocks and p lan t material. A portion o f each sample was then removed and air-dried for physical and chemical analyses. Fresh soil samples for microbial analyses were stored at 10°C, and all experiments were initiated w ith in 96 hours o f soil sampling to m inim ize artifacts incurred during long-term storage.
S o i l c p l a r a c t e r i s t i c s .— O n air-dried soils, we measured pFd on a soihdeionized water paste (1:1). Soil samples for organic C and nitrogen (N) were ground (0.5 m m ) and analyzed using a Carlo Erba EA 1110 elemental analyzer (CE Elan tech, Lakewood, N ew Jersey). Extractable N (NFd4 +/N 0 3 ^) was determ ined using a 2 M KCl solution, extracted for 24 hours and analyzed for NIT 4 + and N 0 3 colorimetrically on an A lpkem autoanalyzer (OI Analytical, College Station, Texas). Bulk density was determ ined using an excavation m ethod (Par

Soil Microbial Dynamics in Costa Rica 187
ent & C aron 1993). Exchangeable cations (calcium , Ca; m agnesium , M g, and potassium , K) were extracted in 55 m l of 1 M am m onium chloride (Silver et al. 2000), and were analyzed using an ARE 3410 inductively coupled plasma atom ic emission spectrophotom eter (ICP-AES).
P-ANALYSES.— A soil Sample (1 g) was analyzed for P fractions using the first two steps o f the modified H edley fractionation described by Tiessen and M oit (1993). Briefly, soil was subjected to a resin extraction in water (resin P;) to extract inorganic P, followed by a bicarbonate extraction (bicarb P;). O rganic bicarb extractable P (bicarb P^) was determ ined as the difference between total bicarb extractable P (bicarb P J and bicarb P; following digestion w ith am m onium persulfate and sulfuric acid (Tiessen & M oir 1993). These three fractions (resin P; and bicarb P; -I- P^) are the m ost labile forms o f P and their sum is often taken as a proxy for readily available (labile) P. Bowman et al. (1978) and Levy and Schlesinger (1999) have shown tha t bicarb P (P; -I- P^) is well correlated w ith p lan t growth. Total available P (Pj) in soil samples was determ ined by digesting 5 g o f sieved, air-dried soil in H 2 SO 4 and H 2 O 2 . Phosphate concentrations in all measured fractions were determ ined using the am m onium m olybdate ascorbic acid m ethod (Kuo 1996).
M i c r o b i a l b i o m a s s .— Soil m icrobial biomass C and N were determ ined using the chloroform fumigation—extraction m ethod (CEE; Brookes et al. 1985). Fumigated (5 day) and unfiamigated samples ( 1 0 g dry weight; dw) were extracted w ith 0 . 5
M K 2 SO 4 , centrifuged for 5 m inutes at 5400 rev/ m in, and filtered through pre-ashed 1.0 p m Gel- m an G F/F glass fiber filters. O rganic C in extracts was analyzed using a Shimadzu T O C -5050A total organic C analyzer (Shimadzu C orporation, Kyoto, Japan). M icrobial biomass C was determ ined as the difference between extractable organic C in fum igated and unfum igated samples using proportionality constant (Kc) o f 0.45 (Vance et al. 1987). Filtered extracts were also analyzed for N H 4 + and N 0 3 colorimetrically using an A lpkem autoanalyzer. Total N in soil extracts was determ ined following digestion w ith potassium persulfate (D ’Elia et al. 1977). M icrobial biomass N was determ ined as the difference between extractable N in fumigated and unfum igated samples using a correction factor (K«) o f 0 . 5 4 (Brookes et al. 1985).
M icrobial P was determ ined using the fum igation—sorption m ethod o f M orel et al. (1996) and
modified for use w ith tropical soils by O berson et al. (1997). Briefly, 10 g soil (dw) were fumigated w ith C-free chloroform liquid and vapor for 75 m inutes. Following fum igation, deionized water ( 1 0 ml) was added and samples were allowed to equilibrate for 24 hours a t 4°C. A t the end o f the equilibration, samples were extracted using an N H 4 F extract (0.03 N N H 4 F and 0.025 N H Cl) using a solution to soil ratio o f 10:1 (Bray & Kurtz 1 9 4 5 ) for 1 m inute, filtered, and stored for analysis. Concom itantly, parallel soil samples were spiked w ith different am ounts o f P (0, 2, 5, 10, 2 0 , and 50 mg/kg) and extracted to determ ine the effect o f sorption reactions over the course o f the experiment. Solutions were analyzed for P by the am m onium m olybdate ascorbic acid m ethod (Kuo 1996). M icrobial biomass estimates were obtained using the relationships described in M orel et al. (1996).
M i c r o b i a l a c t i v i t y a n d a c t i v e b i o m a s s .— ^We also assessed soil m icrobial activity and active microbial biomass using the substrate-induced growth response (SIGR) m ethod o f Colores et al. (1996) and modified by Cleveland et al. (2002). The SIG R technique was used to test the response o f the soil m icrobial com m unity to added C, thus providing an independent estimate o f m icrobial biomass. W hereas the chloroform fum igation m ethod provides an estimate o f total m icrobial biomass, the SIG R m ethod provides an estimate o f an active fraction o f the total m icrobial biomass tha t is able to respond to specific C substrate additions (Colores et al. 1996). Briefly, 10—15 g dry mass equivalent o f each soil was placed in a biom eter flask and brought to 50 percent water holding capacity w ith deionized water. A m ounts o f C substrate determ ined previously to induce maximal respiration (sensu Colores et al. 1996) were added to each flask w ith the same uniform ly labeled ^^C substrate to yield 2500 Bq (150,000 dis/m in) per flask, and 1 m l 0 . 5 M N aO H in the sidearm to trap evolved C O 2 (Colores et al. 1996). T he base trap was removed from each flask and refreshed at regular intervals and radioactivity was measured by liquid scintillation counting after m ixing w ith Scintiverse II scintillation cocktail to determ ine respiration rate. Flasks were kept a t 22°C un til soil respiration rem rned to its basal rate (ca 56 h). Respiration data were analyzed w ith Kaleidagraph software using equations derived by Colores et al. (1996). To convert units o f SIG R biomass (pg C O 2 —C/g) to mg C-biomass/g, empirically derived yields (Y J of 0.50 for glutamic acid were used in the equation =

188 Cleveland, Townsend, Ley, Schmidt, and Constance
X j (Y^ / I — Y J, where is the actual biomass in mg C-biomass/g, and X j is the biomass in units o f mg C O 2 —C /g (Colores et al. 1996, Lipson et al. 1999). Substrate-induced respiration (SIR) estimates represent the initial respiration rates (2 -3 h) following substrate additions.
T he SIG R m ethod requites exponential growth by the soil m icrobial com m unity following substrate additions, w ithout any possible nu trien t constraints (Colores et al. 1996). O u t previous work, however, suggested strong constraints by P on the soil m icrobial com m unity (Cleveland et al. 2002, 2003). Thus, ou t estimates o f SIGR-biomass represent the effect o f adding C substrates in com bination w ith P.
M i c r o b i a l r e s p o n s e t o C a m e n d m e n t s .— Responses o f microbial respiration following the addition o f organic C were determ ined using SIG R (Cleveland et al. 2002). We utilized the am ino acid glutam ate (2.0 m g glutamate—C /g), a very labile C com pound, to determ ine the physiological response o f fast-growing heteto ttophs to C additions. G lutam ate (Glu) elicits greater m icrobial responses than other simple sugar com pounds like glucose, and has a C :N ratio (5:1) that is sufficient to p rom ote microbial growth (Lipson et al. 1999). To remove the effects o f P lim itation on soil microbial processes, we added labile, inorganic P in concert w ith the glutamate and salicylate additions in the SIG R incubations {sensu Cleveland et al. 2002). For the fertilizer treatm ents, P was added as K H 2 P O 4 to water am endm ents to yield P additions o f 200 (xg K H 2 P 0 4 /g. These P additions did no t alter the pH o f the -l-P solutions relative to the treatm ents w ithout P (pH = 6 .8 ).
P h o s p h a t a s e a c t i v i t y .— Potential phosphatase activity was measured using a m ethod in w hich enzyme activity releases p-nitrophenol (pNP) from added substrates, and concentrations o f pN P are determ ined colorimetrically (Tabatabai & Bremner 1969). Briefly, 2—3 g (dw) o f soil was com bined w ith 1 5 0 m l o f acetate buffer a t pH 5. p N P —phosphatase substrate was added to the slurry and reacted a t 25°C for 2 hours. Individual samples were centrifuged and the supernatant mixed w ith N aO H to halt enzyme activity and to color the samples. A m ounts o f pN P were measured at 410 nm absorbance using an Agilent 8453 bench top spectrophotom eter (Agilent Technologies, Palo Alto, California). A lthough this m ethod is no t sensitive enough to separate abiotic, extracellular, or intra- cellularly released enzymes, for enzyme activity to
be detected using this assay, enzymes m ust cleave substrates tha t are too large to pass through cell m em branes. Therefore, this assay effectively measures activity occurring outside of m icrobial cells and p lan t roots (O lander & V itousek 2000). To test the effects o f labile C and N additions on phosphatase activity, we added 5 m g glutam ate/g to 25 g (dw) soil samples in 10 m l deionized water. We determ ined phosphatase activity in soil samples following reaction w ith added glutamate for 24 hours at 25°C.
S t a t i s t i c a l a n a l y s e s .— Differences in soil biogeochemical characteristics and microbial biomass between sites were tested w ith one-way ANOVA following tests for homoscedasticity (Levene’s test) and verification tha t data were norm ally distributed (SPSS, Chicago, Illinois). Differences in microbial growth rates following substrate addition between the sites were determ ined w ith linear regression following log transform ation of rate data during the exponential growth phase. D ifferent regression lines to estimate hom ogeneity between growth rates were compared according to the m ethods described by Steel and Torrie (1960). Seasonal differences in m icrobial indices between the sites were analyzed by ANO VA w ith site and season as m ain factors. W hen there were significant site and date interactions, separate one-way analyses for the different sites and dates were perform ed. All results are reported as significant w hen P < 0.05.
RESULTSS i t e c h a r a c t e r i s t i c s .— Soil texmre at the two sites were different, w ith clay dom inating in the oxisol and sand in the mollisol (Table 1); however, in m ost respects, our soil data suggest similarities between the oxisol and the mollisol (Table 1). In June, concentrations o f extractable N were nearly equal at the two sites, and N was nearly evenly distributed as N H 4 + and N 0 3 (Table 2). N availability increased at both sites in February bu t was never signiflcantly different between sites; nor was soil total N .
In addition, O F had (signiflcantly) lower pH and bulk density b u t higher soil C :P ratios and consistently higher concentrations o f soil-extract- able C than M F (Table 1 and Fig. 1).
P fertility was markedly different between the two sites (Table 2). Speciflcally values for P(, resin P;, and bicarb P^ at the mollisol forest were all nearly twice those measured a t the oxisol forest, and bicarb P; at the O F was less than 67 percent

Soil Microbial Dynamics in Costa Rica 189
TABLE 2. Soil N and P availability in the oxisol and mollisol soils in June (wet season) 2000 and February 2001 (dry season). Row values with different superscripts represent significant (T < 0.05) seasonal differences at one site. *, and indicate the level o f significant difference between the two sites at 2 < 0.05, 0.01, and 0.001, respectively. Error values are ± 1 SE.
Oxisol Mollisol
February June February June
Extractable N (mg/kg)N O 3- NN H 4-N
P FractionResin Pj (M.g/g) Bicarb Pj (p.g/g) Bicarb Pq (p.g/g)Pt (Bg/g)
96.9 ± 6 .8^13.4 ± 1.6^83.6 ± 6.3^***
6.6 ± 0 .6 **3.6 ± 0 .2^**
14.5 ± 0 .6 ***24.7 ± l.P***
42.8 ± 4.8b15.9 ± 0.9^26.9 ± 4 .5b
4.2 ± 0 .4b***3.4 ± O.P*
13.7 ± .06^*** 21.3 ± 0 .9b***
67.6 ± 11 .R24.2 ± 6 .1b43.5 ± (3.4c***
11.5 ± 1.3^**5.4 ± 0.5^**
28.8 ± L2 ***4 5 .7 ± 1.5c***
45.7 ± 3.8"18.7 ± 1.3b 27.0 ± 2.7"
8.9 ± 0 .9"*** 5.1 ± 0.5"*
27.6 ± El"***41.6 ± l 4"***
o f that at M R Seasonal differences in soil P availability were significantly different in the resin Pj fraction {P = 0.005) and in the total labile P fraction (Pp P = 0.03) in the oxisol (Table 2 ). In both the oxisol and the mollisol, o ther available P were generally, bu t no t significantly, more abundant in February than in June.
Temperatures were quite stable at bo th sites; m ean annual tem perature varied between 25 and 26.5°C (< 1 .5°C range), and diurnal tem peratures varied by less than 10°C (Sterrenberg 1990). Precipitation, however, did vary significantly between the seasons; in February, average precipitation reached an annual m inim um o f ca 95 mm , while
in June, precipitation averaged more than 500 m m (Sterrenberg, 1990). In spite o f strong seasonal differences in precipitation, however, soil moisture did no t vary between sites or seasons (Fig. 1).
S o i l m i c r o b i a l b i o m a s s .— Total soil microbial biomass showed significant spatial and tem poral variability. In February (dry season), microbial C and N were no t significantly different between the oxisol and mollisol sites, and biomass C and N were consistently lower than values observed in June (significant only in oxisol; Fig. 1 ). M icrobial P, however, was significantly greater in the mollisol than in the oxisol in February {P = 0.012). In
Extractable € Soli Moisture
400
Feb June Feb June
25002000 _
--- 1500
=A1000
500
0Feb
M i c ro b ia l C
a_
Microbial N400 350 300
^ 250
150too50 0
Feb June
Microbial P
Feb 'une Feb June
a a
Feb June
5 ?6
^ 3 o 2
PhosphataseActivity
I eb June
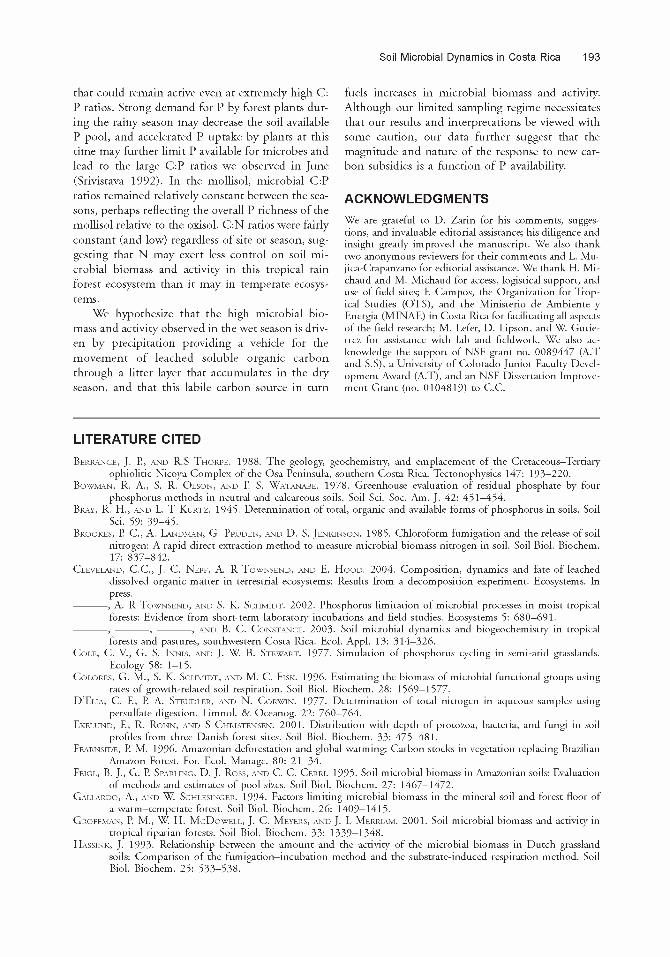
FIGURE 1. Seasonal extractable C, soil moisture, microbial C, N, P, microbial C:P, microbial C:N, and phosphatase activity in the oxisol (solid bars) and mollisol (dashed bars) soils. Microbial C, N, and P were determined using chloroform fumigation-extraction. Bars with different superscripts depict significant {P < 0.05) differences between the oxisol and mollisol within a sampling date. * indicates significant {P < 0.05) differences in the same variable between the seasons. Error values are ± 1 SE.

190 Cleveland, Townsend, Ley, Schmidt, and Constance
TABLE 3. Seasonal microbial biomass and activity in oxisol and mollisol forest sites. Substrate-induced respiration (SIR) values represent average respiration rate 2 h after substrate addition; SIGR is biomass calculated using the substrate-induced growth response method; h the exponential growth rate following substrate addition;Vmax ts the maximum rate o f respiration achieved following substrate addition. Row values with different superscripts represent significant (P < 0.05) seasonal differences at one site. Indicates a significant difference (V < 0.05) between the sites. Error values are ± 1 SE.
Substrate Variable
Oxisol Mollisol
February,2001 June, 2001
February,2001 June, 2001
Glutamate SIR (|xg C/g/h) 4.9 ± 0.5»* 8.1 ± 0.6>>* 8.9 ± 0.4>* 15.0 ± 0.8>>*SIGR: Biomass (|xg G/g) 14.5 ± 1.2> 44.6 ± 6.5*’* 30.0 ± 9.5“ 120.0 ± 24.7*’*SIGR: |X„,gx (P®t hour) 0.20 ± O.OP 0.15 ± O.OP 0.23 ± 0.03“ 0.13 ± o.oRVmax (|xg G/g/h) 74.7 ± 13.L* 73.7 ± 0.9> 140.5 ± 5.9»* 86.3 ± 0.3*’
June, microbial C in the oxisol was significantly greater than in the mollisol {P = 0.003); microbial N followed the same general pattern (Fig. 1). A m ounts o f m icrobial P were no t significantly different between the two sites in June, however, and were higher in February at both sites. M icrobial C: P ratios were higher in February than in June, bu t the difference was significant only for the oxisol. C :N ratios were fairly constant (and low) regardless of site or season (Fig. 1).
S o i l m i c r o b i a l a c t i v i t y .— Phosphatase activity was consistently low at both sites (Fig. 1). Phosphatase activity, however, was significantly higher in the oxisol in February than in the m olhsol sites {P < 0.001). In June, phosphatase activities in the OF and M F were no t significantly different. There was no significant effect o f labile C and N additions on phosphatase activity (data n o t shown).
T he SIG R m odel suggested considerable seasonal variability in the m agnitude of the active m icrobial com m unity. In the oxisol, SIG R estimates of biomass following additions o f G lu revealed that biomass ranged from 14.5 ± 1.2 in February to44.6 ± 6.5 in June. In the mollisol, SIG R estimates revealed tha t biomass ranges from 30.0 ± 9.5 (xg C /g in February to 120.0 ± 24.7 (xg C /g in June. Furtherm ore, the observed growth rates o f the com m unities responding to C enrichm ents were inversely related to com m unity size at both sites (Table 3). SIR values showed similar seasonal variability. In the oxisol, following G lu additions, SIR values ranged from 4.9 ± 0.5 (xg C /g /h in February to 8.1 ± 0.6 (xg C /g /h in June, and in the mollisol, ranged from 8.95 ± 0.42 (xg C /g /h in February to 15.02 ± 0.81 (xg C /g /h in June (Table 3). W hile the size o f the com m unities varied considerably w ith season (Table 3), m axim um growth rates and m axim um respiration rates (V ^ j)
of the com m unities responding to C additions did n o t vary consistently between seasons. In the oxisol site, despite increases in biomass from February to June, neither (X jax ^max were significantly different between seasons. In the mollisol site, however, significant increases in microbial biomass from February to June were accom panied by significant decreases in (Xn ax and V^aax (Table 3).
DISCUSSIONM i c r o b i a l b i o m a s s .— Singh et al. (1991), Luizao et al. (1992), Srivastava (1992), and H enro t and Robertson (1994) have shown that the soil microbial biomass displays pronounced seasonal variation in tropical soils. We also found tha t total soil m icrobial biomass and active biomass varied w ith season, b u t our results also suggest the im portance o f P availability in regulating microbial activity in tropical rain forest soils. In general, soil m icrobial biomass and activity were high in June and low in February. In the oxisol, elevated m icrobial biomass C in June relative to February corresponded to a decrease in soil resin P; (and no significant changes in other P fractions), suggesting tha t the resin P; fraction of soil P is an im portan t source of P for the soil m icrobial biomass. A lthough m icrobial biomass C in the mollisol was elevated in June relative to February, Pj values were n o t significantly different, suggesting that in contrast to the oxisol, higher am ounts o f labile P in the mollisol alleviate P lim itations on the m icrobial comm unity. M icrobial biomass C values observed in bo th sites fell w ithin the range com m only observed in tropical soils (Singh et al. 1991, Luizao et al. 1992, Feigl et al. 1995, Groffm an et al. 2001).
In general, soil m icrobial N co-varied directly w ith soil m icrobial C; C :N ratios m aintained a very narrow range and were low relative to those in o th

Soil Microbial Dynamics in Costa Rica 191
er ecosystems (3—6:1). M ost studies suggest that microbial C :N ratios vary between 5 and 12 (Has- sink 1993, Gallardo & Schlesinger 1994, Paul & C lark 1997, Wardle 1998); however, we observed tha t m icrobial C :N ratios stayed constant at both sites (irrespective o f season), suggesting that the N stams o f the soil is sufficient a t both sites and during bo th seasons to m eet the N dem ands o f the soil m icrobial com m unity. The fact tha t C :N ratios did n o t vary considerably between the seasons in spite o f profound increases in total m icrobial biomass from February to June w ould suggest that perhaps N availability does n o t exert as large a control on the m icrobial com m unity in this N -rich tropical ecosystem as it m ay in m ore N -lim ited tem perate ecosystems in w hich N availability largely regulates soil m icrobial processes. Both M F and O F sites contain a num ber o f leguminous, po tential N-fixing tree species in the canopy {e.g., S. f a - rahybum, Hymenaea courbaril and Mora megistos- permd), and both soil and litter N fixation rates are high at both sites (S. Reed, pets. com m .). The abundance o f both potential symbiotic N-fixing species and free-living N-fixing species m ay contribute to the narrow microbial C :N ratios we observed, and suggest tha t these sites are relatively N- rich.
P h o s p h a t a s e a c t i v i t y .— Phosphatase activity was consistently low in bo th soil types. W hile estimates o f phosphatase activity in tropical forests are extremely rare, O lander and V itousek (2000) recently reported rates o f 7.8 to 22.7 pm ol p N P /g /h in three tropical forests spanning a soil-age gradient in Fdawaii. Their results also revealed an inverse relationship between phosphatase activity and soil P availability (O lander & V itousek 2000). M cGill and Cole (1981) suggested a m odel im plying that biotic dem and for P drives phosphatase production, and hence P m ineralization. In general, our phosphatase results support this model; however, in spite o f the relationship observed in previous smd- ies between P availability and phosphatase activity (M cGill & Cole 1981, O lander & V itousek 2000), there are other factors that m ay influence phosphatase activity levels in our soil that cannot be accounted for by a simple m odel based on P availability. For example, enzymatic production and activity are influenced by physicochemical factors, such as soil tem perature, soil m oism re, and soil N availability (Paul & C lark 1997). Moreover, biotic constraints, including tem poral and spatial variation in organic P availability (the substrate upon w hich phosphatase enzymes act) and rapid micro
bial degradation of extracellular phosphatase enzyme molecules in soil, m ay preclude accum ulation o f phosphatase concentrations necessary to stim ulate high enzyme activity.
D ue to the high energetic cost and high n itro gen dem and o f m icrobial enzyme production (Paul & C lark 1997, Treseder & V itousek 2001), we hypothesized tha t the low phosphatase activity we observed was related to low soil labile C and/or N availability. Thus, we expected that inputs o f C and N w ould increase m icrobial dem and for P, leading to increases in phosphatase production and activity. In our laboratory experiment, however, additions o f bo th labile C and N (as glutamate) did n o t in duce an increase in phosphatase activity. We concede that our short incubation time m ay have been insufficient to allow increased phosphatase production and tha t C and/or N availability m ay still ultimately control the production o f phosphatase in these soils. I t is also possible tha t rapid soil physical sorption or m icrobial degradation of newly p ro duced phosphatase contributed to the neutral response we observed. Nonetheless, our results suggest tha t som ething other than C or N availability m ay lim it phosphatase p roduction and activity in both soil types. Furtherm ore, both our biogeochemical and m icrobial data suggest that the strong constraints im posed by P availability on C utilization and the strong dem and for P by the m icrobial com m unity is n o t satisfied via phosphatase p ro duction. The fact tha t phosphatase activity rates were higher in June than in February at both sites is consistent w ith the m odel o f M cGill and Cole (1981). Based on this model, one w ould predict tha t biotic dem and for P w ould be higher in June than in February, as this marks the onset o f the p lan t growing season in these ecosystems and thus the tim e o f highest P dem and by the p lan t com munity. O ur results showed just such a pattern(Fig. 1).
M i c r o b i a l a c t i v i t y .— Similar to the pattern observed for total soil m icrobial biomass, active biomass (responding to substrate additions) at both sites was higher in June than in February (Table 3). Soil m oisture values, however, did n o t vary signiflcantly between seasons, suggesting tha t the seasonal changes in m icrobial activity we observed were no t driven by soil m oisture. We hypothesize tha t the increase in total and active m icrobial biomass from the dry season (February) to the wet season (June) m ay reflect the outcom e o f intense precipitation events leaching C from large standing pools o f biomass in these ecosystems in June. Lit-

192 Cleveland, Townsend, Ley, Schmidt, and Constance
terfall accumulates during the dry season at these sites (Sterrenberg 1990), b u t concurrent low precipitation inputs prevent rapid delivery o f soluble C to the soil m icrobial comm unity. The sudden onset o f heavy precipitation in late M ay and June, however, m ay result in large, sudden fluxes o f highly soluble, low molecular w eight organic m atter through litter into surface soils (N eff & Asner 2001). O rganic C originating as litter leachate is composed of highly biologically available, decomposable carbon tha t m ay be rapidly mineralized and incorporated into new m icrobial biomass (Jandl & Sollins 1997, N eff & Asner 2001, Cleveland et al. in press). Such C fluxes m ay have led to the observed increase in activity and suggest the im portance o f litterfall dynamics in driving these patterns. Similar patterns have been noted in soil from other tropical forests in w hich nu trien t pulses caused by seasonal cycles o f soil w etting and drying strongly regulate nu trien t cycling, and smdies have shown that such pulses can have bo th positive and negative effects on the soil m icrobial biomass (Singh et al. 1989, Luizao et al. 1992).
In the oxisol, the total (chloroform extractable) and active (SIGR) biomass varied seasonally, while the p roportion o f the total biomass that is active (SIGR:CFE) did n o t and stayed relatively low {ca 3% ). In the mollisol, however, the p roportion o f the total m icrobial biomass tha t is active was higher in the wet season (10% ) than in the dry season (3% ). This m ay also suggest that the fraction of active biomass that can respond to C inputs is tightly constrained by available P. In the mollisol, where P fertility was relatively high, the soil m icrobial com m unity appeared to be able to utilize this available P and to grow following inputs o f C in the rainy season.
C arbon decom position in soil depends no t only on the total biomass o f the m icrobial com m unity b u t also on its physiological activity, a reflection o f functional group com position. The SIG R assay provides a valuable glimpse o f the functional group com position o f the soil microbial com m unity (Colores et al. 1996). Despite clear seasonal changes in the size o f the active microbial biomass at OF, represented by the increase in CFE, SIR, and SIG R biomass values at O F from February to June, m icrobial com m unity m axim um growth rate ((Xn ax) m axim um respiration rate (Vmax) did n o t show significant changes (Table 3), an indication that there were no significant seasonal changes in the physiology o f the com m unity responding to glutamate additions. A t the M F site, however, increases in microbial biomass from Feb
ruary to June were also accom panied by profound seasonal differences in p-max Vmax (June < February) , a clear indication tha t the physiology o f the moliisoFs m icrobial com m unity had changed. We hypothesize that the observed changes in the functional com position observed at M F m ay be the result o f changes in actual species com position of the m icrobial comm unity, and that these changes m ay be related to differences in P availability between the two sites.
M i c r o b i a l d y n a m i c s a n d n u t r i e n t c y c l i n g .— A
num ber o f studies have shown that soil microbial biomass and processes are closely linked to soil m oism re. In general, these smdies have indicated that soil m oisture strongly correlates w ith soil m icrobial biomass (Luizao et al. 1992, Srivastava 1992, Wardle 1992); however, the smdies also reveal tha t the effects o f increased soil m oism re may be positive or negative (Wardle 1998). O ther factors tha t vary seasonally (which m ay or m ay no t directly relate to soil moismre) m ay better explain the patterns and activity o f the soil m icrobial biomass we observed. In particular, it is notew orthy that in June, w hen soil m icrobial biomass was high, soil-extractable C was inversely related to available P (Pt) at O F; extractable organic C was strongly inversely correlated w ith resin P; (r = —0.93), bicarb P; (r = —0.88), and bicarb P^ (r = —0.89). In addition, in the oxisol, extractable organic C was428.6 (xg C /g in February and 674.5 (xg C /g in June; in the mollisol, extractable D O C rem ained relatively low and constant (Fig. 1). The SIG R experim ents w ith substrate or substrate -LP suggest that the relative increase in extractable organic C in the oxisol relative to the mollisol m ay result from the constraints P availability poses on the decomposition o f C, and this is m ost pronounced in the P-poor oxisol.
C:P ratios o f the soil m icrobial com m unity at each site also varied considerably w ith season, and the large response of the soil m icrobial com m unity (via increases in com m unity size following substrate addition, SIR, and active biomass) in June following the onset o f the rainy season corresponded w ith the m ost strikingly high C:P ratios. In addition, while chloroform-extractable C roughly doubled from February to June, m icrobial P actually declined in the oxisol. This suggests either seasonal shifts in soil m icrobial com position from a relatively small m icrobial com m unity rich in P to a large m icrobial com m unity w ith a lower P dem and, or a relatively “plastic” microbial consortium that tolerated very different am ounts o f labile P and
Soil Microbial Dynamics in Costa Rica 193
tha t could rem ain active even a t extremely high C: P ratios. Strong dem and for P by forest plants during the rainy season m ay decrease the soil available P pool, and accelerated P uptake by plants at this tim e m ay further lim it P available for microbes and lead to the large C:P ratios we observed in June (Srivistava 1992). In the mollisol, m icrobial C:P ratios rem ained relatively constant between the seasons, perhaps reflecting the overall P richness o f the mollisol relative to the oxisol. C :N ratios were fairly constant (and low) regardless o f site or season, suggesting that N m ay exert less control on soil m icrobial biomass and activity in this tropical rain forest ecosystem than it m ay in tem perate ecosystems.
We hypothesize tha t the high m icrobial biomass and activity observed in the w et season is driven by precipitation providing a vehicle for the m ovem ent o f leached soluble organic carbon through a litter layer that accumulates in the dry season, and that this labile carbon source in tu rn
fuels increases in microbial biomass and activity. A lthough our lim ited sampling regime necessitates tha t our results and interpretations be viewed w ith some caution, our data further suggest that the m agnitude and nature o f the response to new carbon subsidies is a function o f P availability.
ACKNOWLEDGMENTSWe are grateful to D. Zarin for his comments, suggestions, and invaluable editorial assistance; his diligence and insight greatly improved the manuscript. We also thank two anonymous reviewers for their comments and L. Mu- jica-Crapanzano for editorial assistance. We thank H. Michaud and M. Michaud for access, logistical support, and use of field sites; F. Campos, the Organization for Tropical Studies (GTS), and the Ministerio de Ambiente y Energia (MINAE) in Costa Rica for facilitating all aspects of the field research; M. Eefer, D. Eipson, and W Gutierrez for assistance with lab and fieldwork. We also acknowledge the support of NSF grant no. 0089447 (A.T and S.S), a University o f Colorado Junior Faculty Development Award (A.T), and an NSF Dissertation Improvement Grant (no. 0104819) to C.C.
LITERATURE CITEDB e r r a n g e , J. P., a n d R.S T h o r p e . 1988. The geology, geochemistry, and emplacement of the Cretaceous—Tertiary
ophiolitic Nicoya Complex of the Osa Peninsula, southern Costa Rica. Tectonophysics 147: 193—220.B o w m a n , R. A., S. R. O l s o n , a n d F S. W a t a n a b e . 1978. Greenhouse evaluation of residual phosphate by four
phosphorus methods in neutral and calcareous soils. Soil Sci. Soc. Am. J. 42: 451—454.B r a y , R. H., a n d E. T K u r t z . 1945. Determination of total, organic and available forms of phosphorus in soils. Soil
Sci. 59: 39-45.B r o o k e s , P. C., A. E a n d m a n , G. P r u d e n , a n d D. S. J e n k i n s o n . 1985. Chloroform fumigation and the release of soil
nitrogen: A rapid direct extraction method to measure microbial biomass nitrogen in soil. Soil Biol. Biochem.17: 837-842.
C l e v e l a n d , C.C., J. C. N e f f , A. R T o w n s e n d , a n d E. H o o d . 2004. Composition, dynamics and fate o f leached dissolved organic matter in terrestrial ecosystems: Results from a decomposition experiment. Ecosystems. In press.
---------- , A. R T o w n s e n d , a n d S. K. S c h m i d t . 2002. Phosphorus limitation of microbial processes in moist tropicalforests: Evidence from short-term laboratory incubations and field studies. Ecosystems 5: 680—691.
-------------- ,---------------- , -------------- , AND B. C. C o n s t a n c e . 2003. Soil microbial dynamics and biogeochemistry in tropicalforests and pastures, southwestern Costa Rica. Ecol. Appl. 13: 314—326.
C o l e , C . V., G. S. In n i s , a n d J. W. B. S t e w a r t . 1977. Simulation of phosphorus cycling in semi-arid grasslands. Ecology 58: 1—15.
C o l o r e s , G. M., S. K. S c h m i d t , a n d M. C . F is k . 1996. Estimating the biomass of microbial functional groups using rates of growth-related soil respiration. Soil Biol. Biochem. 28: 1569—1577.
D ’E l ia , C . F, P. A. St e u d l e r , a n d N. C o r w i n . 1977. Determination of total nitrogen in aqueous samples using persulfate digestion. Eimnol. & Oceanog. 22: 760—764.
E k e l u n d , F, R . R o n n , a n d S C h r i s t e n s e n . 2001. Distribution with depth of protozoa, bacteria, and fungi in soil profiles from three Danish forest sites. Soil Biol. Biochem. 33: 475—481.
F e a r n s id e , P. M. 1996. Amazonian deforestation and global warming: Carbon stocks in vegetation replacing Brazilian Amazon Forest. For. Ecol. Manage. 80: 21—34.
F e ig l , B. J., G. P. S p a r l in g , D. J. Ross, a n d C . C . C e r r i . 1995. Soil microbial biomass in Amazonian soils: Evaluation of methods and estimates o f pool sizes. Soil Biol. Biochem. 27: 1467—1472.
G a l l a r d o , A., a n d W. S c h l e s in g e r . 1994. Factors limiting microbial biomass in the mineral soil and forest floor of a warm—temperate forest. Soil Biol. Biochem. 26: 1409—l 4 l 5.
G r o f f m a n , P. M., W. H. M c D o w e l l , J. C. M e y e r s , a n d J. E M e r r ia m . 2001. Soil microbial biomass and activity in tropical riparian forests. Soil Biol. Biochem. 33: 1339—1348.
H a s s in k , j. 1993. Relationship between the amount and the activity of the microbial biomass in Dutch grassland soils: Comparison of the fumigation—incubation method and the substrate-induced respiration method. Soil Biol. Biochem. 25: 533—538.

194 Cleveland, Townsend, Ley, Schmidt, and Constance
H a y m a n , D. S. 1975. Phosphorus cycling by soil microorganisms and plant roots. In N. Walker (Ed). Soil microbiology, pp. 67—91. John Wiley and Sons, New York, New York.
H e n r o t , J., a n d G. P. R o b e r t s o n . 1994. Vegetation removal in two soils of the humid tropics: Effect on microbial biomass. Soil Biol. Biochem. 26: 111—116.
H o l d r i d g e , E . R., W. C. G r e n k e , W. H . H a t h e w a y , T E i a n g , a n d J. A. Tosi. 1971. Forest environments in tropical life zones: A pilot study. Pergamon Press, Oxford, England.
H o u g h t o n , R. A. 1994. The worldwide extent of land-use change. BioScience 44: 305—313.J a n d l , R . , a n d P. S o l l in s . 1997. Water-extractable soil carbon in relation to the belowground carbon cycle. Biol.
Fertil. Soils 25: 196—201.J a n z e n , D.H. (E d .). 1983. Gosta Rican natural history. University of Ghicago Press. Ghicago, IE, USA.Kuo, S. 1996. Phosphorus. In D. L. Sparks, A. L. Page, P. A. Helmke, R. H. Loepper, P. N. Soltanpour, M. A.
Tabatabai, G. T. Johnston, and M. E. Sumner (Eds.). Methods of soil analysis part 3: Ghemical methods, pp. 869—919. Soil Science Society of America, Madison, Wisconsin.
E e v y , E. T , a n d W. s. S c h l e s in g e r . 1999. A comparison of fractionation methods for forms of phosphorus in soil. Biogeochemistry 47: 25—38.
E i p s o n , D. A., T. K R a a b , S. K S c h m i d t , a n d R . K M o n s o n . 1999. Variation in competitive abilities of plants and microbes for specific amino acids. Biol. Fertil. Soils 29: 257—261.
E u i z a g , R . G. G., T. a . B o n d e , a n d T. R o s s w a l l . 1992. Seasonal variation of soil microbial biomass— The effects of clearfelling a tropical rain forest and establishment of pasture in the Gentral Amazon. Soil Biol. Biochem. 24: 805-813.
M c G il l , W. B., a n d G . V. G o l e . 1981. Gomparative aspects o f cycling of organic G, N, S, and P through soil organic matter. Geoderma 26: 267—286.
M o r e l , G., H . T ie s s e n , a n d J. W. B. St e w a r t . 1996. Gorrection for P-sorption in the measurement of soil microbial biomass P by CHCI3 fumigation. Soil Biol. Biochem. 28: 1699—1706.
N e f f , J. G., a n d G. P. A s n e r . 2001. Dissolved organic carbon in terrestrial ecosystems: Synthesis and a model. Ecosystems 4: 29—48.
N e p s t a d , D. G. 1999. Earge-scale impoverishment of Amazonian forests by logging and fire. Nature 398: 505—508.O b e r s o n , A., D. K F r ie s e n , G. M o r e l , a n d H. T ie s s e n . 1997. Determination of P released by chloroform fumigation
from microbial biomass in high P sorbing tropical soils. Soil Biol. Biochem. 29: 1579—1583.O l a n d e r , E. P., a n d P. M V i t o u s e k . 2000. Regulation of soil phosphatase and chitinase activity by N and P availability.
Biogeochemistry 49: 175—190.P a r e n t , E . E., a n d J. G a r o n . 1993. Physical properties of organic soils. In M. R. Garter, (Ed.). Soil sampling and
methods of analysis pp. 441—458, Ganadian Society of Soil Science, Boca Raton, Florida.P a u l , E. A., a n d F. E. G l a r k . 1997. Soil microbiology and biochemistry. Academic Press, San Diego, Galifornia.S c a t e n a , F. N. 2001. Ecological rhythms and the management of humid tropical forests Examples from theGaribbean
National Forest, Puerto Rico. For. Ecol. Manage. 154: 453—464.S c h l e s in g e r , W. H. 1997. Bio geochemistry: An analysis of global change. Academic Press, San Diego, Galifornia.S il v e r , W. E., J. N e f f , M . M c G r o d d y , E. V e l d k a m p , M . K e l l e r , a n d R. G o s m e . 2000. Effects of soil texture on
belowground carbon and nutrient storage in a lowland Amazonian forest ecosystem. Ecosystems 3: 193—209.S i n g h , J. S., A. S. R a g h u b a n s h i , R . S. S i n g h , a n d S. G. S r iv a s t a v a . 1989. Microbial biomass acts as a source of
plant nutrients in dry tropical forest and savanna. Nature 338: 499—500.S i n g h , R . S., S. G S r iv a s t a v a , A. S. R a g h u b a n s h i , J. S. S i n g h , a n d S. P. S i n g h . 1991. Microbial G, N, and P in
dry tropical savanna: Effects o f burning and grazing. J. Appl. Ecol. 28: 869—878.S r iv a s t a v a , S. G. 1992. Microbial G, N, and P in dry tropical soils: Seasonal changes and moisture influence of soil
moisture. Soil Biol. Biochem. 24: 711—714.St e e l , R. G. D., a n d J. H T o r r ie . I960. Principles and procedures of statistics with special reference to the biological
sciences. McGraw-Hill, New York. New York.St e r r e n b e r g , B. K 1990. Nutrient availability during vegetational regrowth in a lowland tropical rain forest, Gor-
covado National Park, Gosta Rica. M.S. Thesis. University of Texas, Austin, Texas.Sw i f t , M. J., O. W. H e a l , a n d J. M A n d e r s o n . 1979. Decomposition in terrestrial ecosystems. University of Galifornia
Press, Berkeley, Galifornia.T a b a t a b a i, M. A., a n d J. M. B r e m n e r . 1969. Use of p-nitrophenyl phosphatase for assay of soil phosphatase activity.
Soil Biol. Biochem. 1: 301—307.T ie s s e n , H . , a n d J. O. M o i r . 1993. Gharacterization of available P by sequential extraction. In: M. R. Garter, (Ed.).
Soil sampling and methods of analysis pp. 75—86. Eewis Publishers,Boca Raton, Florida.T r e s e d e r , K K , a n d P. M. V it o u s e k . 2001. Effects o f nutrient availability on investment in acquisition of N and P
in Hawaiian rain forests. Ecology 82: 946—954.U e h a r a , G . , a n d G . G il l m a n . 1981. The mineralogy, chemistry, and physics o f tropical Soils with variable charge
clays. Westview Press, Boulder, Golorado.V a n c e , E. D., P. G. B r o o k e s , a n d D. S. J e n k i n s o n . 1987. An extraction method for measuring soil microbial biomass
C. Soil Biol. Biochem. 19: 703—707.V i t o u s e k , P. M. 1984. Eitterfall, nutrient cycling, and nutrient limitation in tropical forests. Ecology 65: 285—298.--------------, AND J. R. E. Sa n f o r d . 1986. Nutrient cycling in moist tropical forest. Annu. Rev. o f Ecol. and Syst. 17:
137-167.W a l k e r , T. W , a n d J. K Sy e r s . 1976. The fate of phosporus during pedogenesis. Geoderma 15: 1—19.

Soil Microbial Dynamics in Costa Rica 195
W a r d l e , D. A. 1992. A c o m p a r a t i v e a s s e s s m e n t o f f a c t o r s w h i c h i n f l u e n c e m i c r o b i a l b i o m a s s c a r b o n a n d n i t r o g e n
levels i n soils. Biol. Rev. 67: 321—358.---------- . 1998. Controls of temporal variability of the soil microbial biomass: A global-scale synthesis. Soil Biol.
Biochem. 30: 1627—1637.W il l ia m s , J., a n d C . J. C h a r t r e s . 1991. Sustaining productive pastures in the tropics: Managing the soil resource.
Trop. Grassl. 25: 73—84.