soil management and nitrogen dynamics in burley …
TRANSCRIPT

University of Kentucky University of Kentucky
UKnowledge UKnowledge
Theses and Dissertations--Plant and Soil Sciences Plant and Soil Sciences
2015
SOIL MANAGEMENT AND NITROGEN DYNAMICS IN BURLEY SOIL MANAGEMENT AND NITROGEN DYNAMICS IN BURLEY
TOBACCO ROTATIONS TOBACCO ROTATIONS
Congming Zou University of Kentucky, [email protected]
Right click to open a feedback form in a new tab to let us know how this document benefits you. Right click to open a feedback form in a new tab to let us know how this document benefits you.
Recommended Citation Recommended Citation Zou, Congming, "SOIL MANAGEMENT AND NITROGEN DYNAMICS IN BURLEY TOBACCO ROTATIONS" (2015). Theses and Dissertations--Plant and Soil Sciences. 64. https://uknowledge.uky.edu/pss_etds/64
This Doctoral Dissertation is brought to you for free and open access by the Plant and Soil Sciences at UKnowledge. It has been accepted for inclusion in Theses and Dissertations--Plant and Soil Sciences by an authorized administrator of UKnowledge. For more information, please contact [email protected].

STUDENT AGREEMENT: STUDENT AGREEMENT:
I represent that my thesis or dissertation and abstract are my original work. Proper attribution
has been given to all outside sources. I understand that I am solely responsible for obtaining
any needed copyright permissions. I have obtained needed written permission statement(s)
from the owner(s) of each third-party copyrighted matter to be included in my work, allowing
electronic distribution (if such use is not permitted by the fair use doctrine) which will be
submitted to UKnowledge as Additional File.
I hereby grant to The University of Kentucky and its agents the irrevocable, non-exclusive, and
royalty-free license to archive and make accessible my work in whole or in part in all forms of
media, now or hereafter known. I agree that the document mentioned above may be made
available immediately for worldwide access unless an embargo applies.
I retain all other ownership rights to the copyright of my work. I also retain the right to use in
future works (such as articles or books) all or part of my work. I understand that I am free to
register the copyright to my work.
REVIEW, APPROVAL AND ACCEPTANCE REVIEW, APPROVAL AND ACCEPTANCE
The document mentioned above has been reviewed and accepted by the student’s advisor, on
behalf of the advisory committee, and by the Director of Graduate Studies (DGS), on behalf of
the program; we verify that this is the final, approved version of the student’s thesis including all
changes required by the advisory committee. The undersigned agree to abide by the statements
above.
Congming Zou, Student
Dr. Robert C. Pearce, Major Professor
Dr. Mark S. Coyne, Director of Graduate Studies

SOIL MANAGEMENT AND NITROGEN DYNAMICS IN BURLEY TOBACCO ROTATIONS
DISSERTATION
A dissertation submitted in partial fulfillment of the requirements for the degree of Doctor of Philosophy in the
College of Agriculture, Food and Environment at the University of Kentucky
By Congming Zou
Lexington, Kentucky
Co-Directors: Dr. Robert C. Pearce, Associate Professor of Plant and Soil Sciences and Dr. John H. Grove, Professor of Plant and Soil Sciences
Lexington, Kentucky
2015
Copyright © Congming Zou 2015

ABSTRACT OF DISSERTATION
SOIL MANAGEMENT AND NITROGEN DYNAMICS IN BURLEY TOBACCO ROTATIONS
Agronomic practices, including tillage, crop rotation and N fertilization, have been developed to efficiently manage soil N dynamics and crop N nutrition. These practices can affect soil organic carbon (SOC) and soil total nitrogen (STN) sequestration, and consequently influence soil nitrogen mineralization (SNM) and crop N nutrition. However, little research has been systematically and simultaneously conducted to examine the effect of agronomic management on (1) SOC and STN stocks; (2) SNM; and (3) crop N nutrition. Burley tobacco (Nicotiana tobacum L.) is a N demanding crop and subject to inefficiency in N fertilization. Moreover, conservation tillage and rotation have been integrated into traditionally tillage intensive tobacco cropping systems. Thus, a tobacco tillage and rotation study was used to test how agronomic practices can affect N dynamics and crop N status in a series of sequential experiments.
Firstly, different tobacco production systems were utilized to investigate the effects of tillage and rotation on soil aggregate stabilization and associated SOM sequestration. No-tillage and rotation management enhanced SOC and STN stocks, mainly by increasing the proportion of macroaggregates and SOC and STN concentrations.
Secondly, a series of studies were conducted on SNM, including: (1) comparison of laboratory and in situ resin-core methods in estimating SNM; (2) evaluation of the influence of N fertilizer application on SNM; and (3) comparison of chemical indices for predicting SNM across management treatments over time. Laboratory method had different results relative to in situ method due to sample pretreatments. Fertilizer N application had a priming effect on SNM, but priming depended on both the N fertilizer rate and the background SOM level. The effect of rotation/tillage treatments on SNM was stable across years and SOC appeared to be the best indicator of SNM among other soil carbon and N estimates.
Thirdly, a N fertilizer study for different tillage systems was conducted in 2012 and 2013. Crop parameters and plant available N (PAN) were collected to investigate the impact of tillage on tobacco production. Crop parameters showed that no-tillage can result in N deficiency in dry years. Similar PAN for both tillage methods suggested N deficiency in

no-till tobacco was due to the crop’s lower N uptake capacity. In 2014, tobacco root analysis confirmed that no-tillage can result in less root exploration of the soil volume than conventional tillage.
KEYWORDS: Nitrogen Nutrition, No-tillage, In situ Resin-Core Method, Net Soil N Mineralization, Tobacco
Congming Zou Student’s Signature
08/03/2015
Date

SOIL MANAGEMENT AND
NITROGEN DYNAMICS IN BURLEY TOBACCO ROTATIONS
By
Congming Zou
Robert C Pearce Co-Director of Dissertation John H Grove Co-Director of Dissertation Mark S Coyne Director of Graduate Studies 08/03/2015 Date

DEDICATION
This dissertation is dedicated to my family; my loving wife, Jinglin Xiang, and my
growing son, David Congming; for all of their support up to and during this process.

ACKNOWLEDGEMENTS
I am heartily thankful to my co-advisor, Dr. Robert Pearce, for accepting me into the
program. I am grateful for his guidance, dedication, and continued support throughout the
entirety of my doctoral program. I would like to thank my dear co-advisor, Dr. John
Grove, for his direction and support throughout my time spent at the University of
Kentucky. Both of them have given me a positive outlook on soil science and agricultural
research and became my fearless leaders. I feel incredibly privileged to have worked with
them. I would also like to thank all my doctoral committee members for their friendly
guidance and assistance over the years. I feel a deep debt of gratitude to Dr. Mark Coyne
for his hundreds of hours of mentoring and for his courage in editing my poor Chinese-
English in all of my drafts. I would like to thank my minor advisor, Dr. Dennis Egli, for
teaching me effective writing skills and for untold numbers of life lessons and stories in
crop science research. I would like to thank Dr. Ole Wendroth for his academic attitude
and inspiration. I also want to thank Dr. Sayed Saghaian for serving as my outside
examiner.
I would like to acknowledge Jack Zeleznik and Matthew Allen. Thank you for your hard
work in the management of my research plots and for helping me to conduct these
challenging studies. Thank you for training me how to operate the various pieces of farm
equipment - John Deere tractor, Kawasaki, and Spiderman - and for teaching me how to
speak English word by word. You are my closest friends at UK. You made my farming
life in Kentucky colorful. I will always remember every happy and embarrassing moment
with you. I would also like to thank Tami Smith. I can’t count how many thousands of
plant, soil, resin, and water samples that you analyzed for me. My research couldn’t have
been done without your tremendous effort. Jack Zeleznik, Matthew Allen and Tami
Smith, each of you make a quarter of my Ph.D. diploma.
I would also like to thank these people for helping me in many different ways and making
my life at the University of Kentucky a wonderful experience: Ann Freytag, Diane
Hunter, James Crutchfield, Jim Nelson, Anne Jack, Andres Nunez, John Orlowski, Ricky
Lewis, Kristi Meier, Anne Whitney, Joshua Duckworth, Laura Mitchell, John Walsh,
Donato Titolo, Martin Navarro, Antonio Marchi, Blazan Mijatovic, Jessique Ghezzi,
iii

Jonathan Judy, Bin Cai, Yang Yang, Mitchell Richmond, Riley Walton, Joe Kupper,
Zeng Wang, and Shuang Liu.
To family, I give a special thanks to those who have continuously supported and believed
in me through all of my endeavors in life. Thank you all for your love, support,
understanding and sacrifice to ensure that I would be able to become what I wanted in
life.
iv

TABLE of CONTENTS
ACKNOWLEDGEMENTS ............................................................................................... iii LIST OF TABLES ............................................................................................................ vii LIST OF FIGURES ......................................................................................................... viii Chapter 1: A Literature Review of Agronomic Practices and Soil N Dynamics ............... 1
1.1 Introduction ............................................................................................................... 1 1.2 Mechanisms and Effect of Agronomic Practices on Soil C and N Sequestration..... 8 1.3 Methodologies of Soil N Mineralization Measurement .......................................... 11
1.3.1 Laboratory Incubation Methods ....................................................................... 11 1.3.2 Field (In-situ) Incubation Methods ................................................................... 14 1.3.3 Method Selection .............................................................................................. 17
1.4 The Influence of Agronomic Practices on Root Architecture ................................. 18 1.5 Conclusions and Dissertation Overview ................................................................. 20
Chapter 2: Burley Tobacco Production Conservation Practices Increase Large Soil Aggregates and Associated Carbon and Nitrogen Stocks................................................. 22
2.1 Introduction ............................................................................................................. 22 2.2 Materials and Methods ............................................................................................ 25 2.3 Results ..................................................................................................................... 30 2.4 Discussion ............................................................................................................... 46 2.5 Conclusion ............................................................................................................... 51
Chapter 3 Part I: Laboratory or In Situ Resin-Core Methods to Estimate Net Nitrogen Mineralization for Different Rotation and Tillage Practices ............................................ 53
3.1.1 Introduction .......................................................................................................... 53 3.1.2 Materials and Methods ......................................................................................... 56 3.1.3 Results .................................................................................................................. 63 3.1.4 Discussion ............................................................................................................ 66 3.1.5 Conclusions .......................................................................................................... 69
Chapter 3 Part II: Influence of Past and Current N Fertilizer Application on In Situ Net Soil N Mineralization ........................................................................................................ 71
3.2.1 Introduction .......................................................................................................... 71 3.2.2 Materials and Methods ......................................................................................... 74 3.2.3 Results .................................................................................................................. 81 3.2.4 Discussion ............................................................................................................ 88 3.2.5 Conclusion ............................................................................................................ 93
v

Chapter 3 Part III: The Stability of Indicators for Net Soil Nitrogen Mineralization (NSNM) in Tobacco Rotation and Tillage Systems ......................................................... 94
3.3.1 Introduction .......................................................................................................... 94 3.3.2 Methods and Materials ......................................................................................... 96 3.3.3 Result .................................................................................................................. 101 3.3.4 Discussion .......................................................................................................... 106 3.3.5 Conclusion .......................................................................................................... 110
Chapter 4: No-Tillage Culture and Nitrogen Fertilizer Management for Burley Tobacco Production ....................................................................................................................... 111
4.1 Introduction ........................................................................................................... 111 4.2 Materials and Methods .......................................................................................... 114 4.3 Results ................................................................................................................... 123 4.4 Discussion ............................................................................................................. 134 4.5 Conclusion ............................................................................................................. 138
Chapter 5: Conclusion..................................................................................................... 140 References ....................................................................................................................... 144 Vita .................................................................................................................................. 177
vi

LIST OF TABLES
Table 2.1 Analysis of variance for the effects of tillage, rotation, fertilizer N rate, and their interactions, on bulk density, large macroaggregates, small macroaggregates, microaggregates, silt-clay particles, and aggregate mean weight diameter (MWD), and geometric mean diameter (GMD). .................................................................................... 32 Table 2.2 Analysis of variance for the effects of tillage, rotation, fertilizer N rate, and their interactions, on organic carbon (SOC) and total nitrogen (STN) concentrations for 0 to 10 cm whole-soil and aggregate fractions. ................................................................... 37 Table 2.3 Analysis of variance for the effects of tillage, rotation, and N fertilizer rate on whole-soil and aggregate-associated SOC stocks (SOCS) and STN stocks (STNS), for 0 to 10 cm whole-soil and aggregate fractions. ................................................................... 42 Table 2.4 The relationships between whole-soil SOC stocks (SOCS) or STN stocks (STNS) and the SOCS and STNS stocks found in different aggregate size fractions (n= 32). .................................................................................................................................... 45 Table 2.5 The relationships between aggregate SOC stocks (SOCS) or STN stocks (STNS) with aggregates size fraction (%), bulk density and aggregate SOC (or STN) concentrations (n= 32). ..................................................................................................... 45 Table 3.2.1 In situ incubation sampling dates in 2013. ................................................... 78 Table 3.2.2 Selected soil properties (0-20 cm depth) at initiation of the in situ incubation study. ................................................................................................................................. 81 Table 3.2.3 Analysis of variance for the effects of past (PN) and current (CN) fertilizer N rate, and sampling date on net soil mineralized N (NSNM). ............................................ 82 Table 3.2.4 Analysis of variance for the effects of past (PN) and current (CN) fertilizer N rate and incubation period (IP) on average daily net soil N mineralization (NSNM). ..... 85 Table 3.2.5 Average daily net soil N mineralization (NSNM) values for the three-way interaction of past (PN) and current (CN) fertilizer N rate and incubation period (IP). ... 86 Table 3.2.6 Correlation coefficients (R2) from regression of average daily net soil N mineralization (NSNM) against precipitation, air temperature and soil water content for the three incubation periods; at each past (PN) and current (CN) fertilizer N rate combination....................................................................................................................... 87 Table 3.3.1 Analysis of variance summary for the effects of different tobacco tillage-rotation systems on NSNM, POXC, PON, POC, STN and SOC. .................................. 102 Table 3.3.2 Pearson correlation coefficients (r) for correlations among NSNM values and the values for other soil carbon and nitrogen indices (n=144)........................................ 105 Table 3.3.3 Pearson correlation coefficients (r) for correlations among NSNM residuals and the residuals for other soil carbon and nitrogen indices (n=144). ............................ 106 Table 4.1 Dates of fertilizer application, transplanting, topping, and harvest. .............. 118 Table 4.2 Sampling dates for plant available nitrogen assays in 2012 and 2013. ......... 122 Table 4.3 Tobacco cured leaf yield as related to at a 280 kg N ha-1 application rate .... 124 Table 4.4 Analysis of variance (P>F) for agronomic parameters, plant available nitrogen supply, and leaf chemistry parameters. ........................................................................... 125
vii

LIST OF FIGURES
Figure 2.1 The effect of tillage on bulk density and aggregate mean weight diameter (MWD), and geometric mean diameter (GMD). For any one measured variate, vertical bars with different letter at the top are significantly different at the P < 0.05 level. ........ 33 Figure 2.2 The rotation by N rate interaction on aggregate mean weight diameter (MWD), and geometric mean diameter (GMD). For any one measured variate, vertical bars with different letters at the top are significantly different at the P < 0.05 level. ....... 34 Figure 2.3 The proportion of large macroaggregates, small macroaggregates, microaggregates and silt-clay particles due to the tillage by rotation (A) and rotation by N rate (B) interactions. For any one aggregate size class, vertical bars with different letters at the top are significantly different at the P < 0.05 level. ................................................ 35 Figure 2.4 The SOC concentrations of whole-soil, large macroaggregates, small macroaggregates, microaggregates and silt-clay particles for the tillage by rotation (A) and rotation by fertilizer N rate (B) interactions. Vertical bars within an aggregate size class, with different letters at the top, are significantly different at the P < 0.05 level. Note: * < 8000 indicates whole soil. The SOC of whole soil is without sand correction, while the other aggregate associated SOC concentrations were sand-corrected. ....................... 38 Figure 2.5 The STN concentrations for whole-soil, large macroaggregates, small macroaggregates, microaggregates and silt-clay particles for the tillage by rotation (A) and rotation by fertilizer N rate (B) interactions. Vertical bars within an aggregate size class, with different letters at the top, are significantly different at the P < 0.05 level. Note: * < 8000 indicates whole soil. The STN of whole-soil is without sand correction, while the other aggregate associated STN concentrations were sand-corrected. ............. 39 Figure 2.6 The SOC stocks (SOCS) of whole-soil, large macroaggregates, small macroaggregates, microaggregates and silt-clay particles for the tillage by rotation (A) and rotation by fertilizer N rate (B) interactions. Vertical bars within an aggregate size class, with different letters at the top, are significantly different at the P < 0.05 level. Note: * < 8000 indicates whole soil. ................................................................................. 43 Figure 2.7 The STN stocks (STNS) of whole-soil, large macroaggregates, small macroaggregates, microaggregates and silt-clay particles for the tillage by rotation (A) and rotation by fertilizer N rate (B) interactions. Vertical bars within an aggregate size class, with different letters at the top, are significantly different at the P < 0.05 level. Note: * < 8000 indicates whole soil. ................................................................................. 44
Figure 3.1.1 Cumulative precipitation and mean air temperature of the three 2012 in situ incubation periods: 22 May - 20 June (1), and 21 June -25 July (2), and 26 July – 25 September (3). ................................................................................................................... 58 Figure 3.1.2 Cutaway diagram of soil resin core, in which surficial plant residue and intact soil column (0-20.32 cm depth increment) and one mixed ion-exchange resin bag are incubated. A transparent example of the nylon bag holding the ion-exchange resins is shown. The bottom of the core was covered with nylon mesh (1mm opening) material. 61 Figure 3.1.3 Laboratory and in situ resin-core incubation results comparing tillage effects on soil net N mineralization: (A) laboratory incubation results for TTT-CT and TTT-NT; (B) in situ resin-core incubation results TTT-CT and TTT-NT; (C) laboratory incubation results for SST-CT and SST-NT; and (D) in situ resin-core incubation for SST-CT and
viii

SST-CT. Different letters for CT and NT soil net N mineralization within the same incubation method and at the same sampling date indicate a significant difference at an alpha level of 0.1 according to Tukey’s HSD means separation test................................ 64 Figure 3.1.4 Laboratory and in situ resin-core incubation results comparing previous crop effects on soil net N mineralization: (A) laboratory incubation results for CST-NT and SCT-NT; and (B) in situ resin-core incubation results for CST-NT and SCT-NT. Different letters for CST and SCT soil net N mineralization within the same incubation method and at the same sampling date indicate a significant difference at an alpha level of 0.1 according to Tukey’s HSD means separation test. ................................................. 65
Figure 3.2.1 Cutaway diagram of soil resin-core, in which surficial plant residue and intact soil (0 to 20.32 cm depth increment) and one mixed ion exchange resin bag (35 g) are incubated. A transparent example of the nylon bag holding the ion exchange resins is shown. The bottom of the core was covered with nylon mesh (1 mm opening) material. 77 Figure 3.2.2 The effect of past (PN) and current (CN) fertilizer N rate on net soil mineralized N (NSNM) at three sampling dates in 2013: A) Julian day 206 (July 26); B) Julian day 248 (September 9); C) Julian day 275 (October 3). The NSNM values for different CN rates, within the same PN rate, followed by the same lowercase letter are not significantly different at the 95 % level of confidence according to Tukey’s HSD means separation test. The NSNM values for different PN rates, within the same CN rate, followed by the same uppercase letter are not significantly different at the 95 % level of confidence according to Tukey’s HSD means separation test. ......................................... 84
Figure 3.3.1 Effect of six tobacco tillage-rotations on net soil N mineralization (NSNM) at 0 to 10 cm in 2011 (A), 2012 (B) and 2013 (C). The NSNM values are given above each vertical bar. Different letters indicate values are significantly different at the 95 % level of confidence, according to Tukey’s HSD means separation test. Note: Treatments were numerically ranked from lowest to highest in X axis. ........................................... 103 Figure 3.3.2 Effect of six tobacco tillage-rotation systems on net soil N mineralization (NSNM) at 10 to 20 cm in 2011 (A), 2012 (B) and 2013 (C). The NSNM values are given above each vertical bar. Different letters indicate values are significantly different at the 95 % level of confidence, according to Tukey’s HSD means separation test. Note: Treatments were numerically ranked from lowest to highest in X axis. ........................ 104
Figure 4.1 Monthly mean air temperature for 2012 and 2013 tobacco growing seasons and for the long term average mean (1971-2013) at the experiment site. (Source: Kentucky Agricultural Weather Center, http://wwwagwx.ca.uky.edu/) ......................... 116 Figure 4.2 Monthly total precipitation for 2012 and 2013 tobacco growing seasons and for the long term average mean (1971-2013) at the experiment site. (Source: Kentucky Agricultural Weather Center, http://wwwagwx.ca.uky.edu/) ......................................... 117 Figure 4.3 Cutaway diagram of soil resin core, in which surficial plant residue and intact soil column (0-20.32 cm) and one mixed-media ion-exchange resin bag are incubated inside a core tube. A transparent example of an ion-exchange resin nylon bag is shown with a nylon mesh (1mm opening) as a bottom cover. ................................................... 121
ix

Figure 4.4 Relationship between the NT/CT yield ratio and May to September cumulative precipitation from 2007 to 2013 ..................................................................................... 124 Figure 4.5 Tobacco leaf yield response to tillage and fertilizer N rate in 2012 (a) and 2013 (b). Values followed by the same letter are not significantly different (α ≤ 0.1). . 127 Figure 4.6 SPAD reading at topping response to tillage and fertilizer N rate in 2012 (a) and 2013 (b). Values followed by the same letter are not significantly different (α ≤ 0.1).......................................................................................................................................... 127 Figure 4.7 Leaf TN at topping response to tillage and fertilizer N rate in 2012 (a) and 2013 (b). Values followed by the same letter are not significantly different (α ≤ 0.1). . 128 Figure 4. 8 Leaf NO3-N at topping response to tillage and fertilizer N rate in 2012 (a) and 2013 (b). Values followed by the same letter are not significantly different (α ≤ 0.1).......................................................................................................................................... 128 Figure 4.9 Plant available nitrogen supply for conventional tillage and no tillage during the tobacco growth period in 2012(a) and 2013 (b). Values within a single sampling date, for a given year, followed by the same letter are not significantly different (α ≤ 0.1). Note: the scales for plant available nitrogen are different for 2012 and 2013. ............... 130 Figure 4.10 Relationship between tobacco yield and plant available nitrogen supply for no tillage and conventional tillage production in 2012 and 2013. .................................. 131 Figure 4.11 Cured leaf NO3-N concentration response to tillage and fertilizer N rate in 2012 (a) and 2013 (b). Values followed by the same letter are not significantly different (α ≤ 0.1). .......................................................................................................................... 132 Figure 4.12 Cured leaf alkaloid concentration response to tillage and fertilizer N rate in 2012 (a) and 2013 (b). Values followed by the same letter are not significantly different (α ≤ 0.1). .......................................................................................................................... 133 Figure 4.13 Cured leaf nicotine concentration response to tillage and fertilizer N rate in 2012 (a) and 2013 (b). Values followed by the same letter are not significantly different (α ≤ 0.1). .......................................................................................................................... 133 Figure 4.14 Cured leaf TSNAs concentration response to tillage and fertilizer N rate in 2012 (a) and 2013 (b). Values followed by the same letter are not significantly different (α ≤ 0.1). .......................................................................................................................... 134
Figure 5.1 The ABIT model proposed to understand factors affecting soil N mineralization ................................................................................................................. 142
x

Chapter 1: A Literature Review of Agronomic Practices and Soil N Dynamics
1.1 Introduction
The Development of Agronomic Practices Reflects the History of Managing Soil N
Dynamics
Nitrogen (N) is the most important plant mineral nutrient (Epstein, 1972). Nitrogen was
first discovered in the late 18th century, and N’s role in improving crop production was
widely recognized by the mid-19th century (Galloway and Cowling, 2002). Long before
these discoveries, ancient farmers often unknowingly employed agronomic practices that
resulted in the management of soil N availability, helping to ensure the human food
supply and nutrition. Before synthetic N fertilizers, there were two major sources of N in
agro-ecosystems - soil N and legume based biological N fixation. Ancient farmers
constructively developed tillage schemes and rotated non-legume and legume crops to
manage both N sources for millennia. However, the appearance of commercial synthetic
N fertilizers in the early 20th century brought significant changes to those traditional
agronomic practices. The history of agronomic practices from the perspective of
managing soil and biologically fixed N dynamics would seem to be a fruitful review.
Plow tillage is a form of soil N management. Much of the soil N is in complex organic
forms, such as decomposing plant and animal residues (Marschner and Marschner, 2012).
Most plants can only take up inorganic N (NH4+ and NO3
-) forms (Keeney, 1982),
although the basic amino acids are rarely absorbed by some plant species (e.g. Picea
abies.) (Boukcim and Plassard, 2003). Inorganic N and basic amino acids in the soil are
mainly derived from N mineralization processes. Mineralization can be promoted by
1

tillage practices because disturbance can expose naturally-protected (i.e. aggregate-
protected) soil organic matter (SOM) to microbes, enhancing microbial activity and N
mineralization (Tisdall and Oades, 1982). Therefore, plow tillage was considered a great
agricultural advance and, from the archeological evidence, has a very long history. There
were foot plows (Curwen, 1953), also called “digging sticks”, shown in Egyptian tomb
paintings (Burke and Connections, 1978). Also, a wooden model of oxen and plow found
in an Egyptian tomb was dated to 2000 BCE (Burke and Connections, 1978). In Asia, one
of the oldest existing Chinese books titled “Lü Shi Chun Qiu” (compiled in 239 BCE) or
“The Annals of Lu Buwei” (Lü et al., 2000), demonstrated the details of when and how to
till according to soil and weather conditions and served as an early example of a practical
farming guide.
Rotation can also be a tool to manage soil N through legume bio-fixation of N, depending
on the chosen crop species. Mono-cropping, especially with non-legumes and heavy
nutrient using crops (e.g. tobacco and corn), can deplete soil N (Bationo, 2004). Rotation
practices, even simple fallow, helps to restore soil N (Giller et al., 1997). This practice
was evident in early Roman times. One of Rome’s greatest poets, Virgil (70-19 BCE),
wrote in his poem Georgics (from the Greek, “On Working the Earth”) “For the field is
drained by flax-harvest and wheat-harvest, drained by the slumber-steeped poppy of
Lethe, but yet rotation lightens the labour”. This emphasizes that fallow was necessary to
rotate with those crops that required more nutrients. On the other hand, rotations which
include a legume crop can bring biological N fixation into agricultural production
systems. Although ancient farmers knew nothing of the biological N fixation process and
nothing about the importance of mineral N to plant growth, they intentionally included
2

legume crops into crop sequences. This was evidenced in the book of natural history
where Pliny the Elder (23-79 CE) mentioned several legume-successions as alternatives
to conditions that forbade fallowing (White, 1970).
Synthetic fertilizer N application in agriculture production has a relatively short history
compared to tillage and rotation practices, because knowledge regarding N in plant
nutrition and N synthesis techniques are recent. In 1836, Jean-Baptiste Boussingault
(1801-1887) did experiments on manure, crop rotation, and N sources and for the first
time concluded that N was a major component of plants and that the nutritional value of
fertilizer was proportional to its N content (Smil, 2004). However, ammonia could not be
easily synthesized from constituent elements until 1908, when the Haber-Bosch process
was developed. After that, synthetic fertilizer N started to play a greater role in
agricultural production, helping to improve global food security (Erisman et al., 2008).
The Influence of Synthetic Fertilizer N on Traditional Agronomic Practices
The appearance of synthetic fertilizer N brought a huge increase in the global food supply
and Erisman et al. (2008) estimated that around 50% of the world population’s food
requirements are currently met by the use of synthetic fertilizer N. However, synthetic
fertilizer N fundamentally disturbed the soil N cycling balance in agro-ecosystems, and
brought significant changes in traditional agronomic practices.
Synthetic fertilizer N played a role in the development of modern no-tillage farming.
While few people recognized the fertilizer N contribution to no-tillage, early Kentucky
no-tillage by N fertility trials unveiled its importance (Rice et al., 1986). No-tillage
without N fertilizer significantly lowered yield compared to conventional tillage without
3

N fertilizer. However no-tillage with N fertilizer reached yields comparable to those of
conventional tillage with fertilizer N. From this perspective, one can speculate that added
fertilizer N compensated for the reduction in soil N mineralization with the lack of
tillage. Other factors, including herbicide and equipment development, also made
Kentucky no-tillage farming feasible, beginning in the 1960s (Phillips and Young Jr,
1973). At the time, the move away from tillage was viewed with much skepticism, but
eventually no-tillage was accepted as a revolution in farming. By 2009 approximately 36
% of U.S. cropland, planted to eight major crops, was under no-tillage soil management
(Horowitz et al., 2010). Agriculture derives numerous benefits from no-tillage, including
fuel and labor savings, increased soil C stocks and erosion resistance.
Although ancient farmers knew nothing of biological N fixation, legume crops had been
an important cropping systems component, worldwide, before synthetic N became
available (White, 1970). However, crop rotation was discouraged during the Green
Revolution, partially because pest control benefits from crop rotation could be replaced
by chemical crop protectants (Bruns, 2012). Also, the N credits from biological N
fixation could be easily replaced by synthetic fertilizer N. However, soon after the height
of the Green Revolution, many studies reported that no amount of chemical fertilizer or
pesticide could fully compensate for crop rotation benefits (Karlen et al., 1994; Roth,
1996). Rotation systems then came back into fashion. Currently, 80 percent of all corn,
soybean, and wheat planted acres in the United States are under rotation.
4

Systematic Understanding of Agronomic Practices and N Dynamics
This brief review of agricultural history establishes that management of N dynamics is
one of the central reasons farmers developed and implemented specific agronomic
practices. Furthermore, in the last few decades, new knowledge indicates how transient N
can have negative impacts on global environments and human health (Townsend et al.,
2003). A systematic understanding of “How does soil and crop sequence management
influence nitrogen dynamics?” will have a significant impact on agronomic practice
development, but also has global meaning for the quality of human life. The aim of
optimal agricultural N management is to enhance net N mineralization at times when
crops need N, to synchronize soil N mineralization with crop N uptake, and to minimize
N loss. To systematically understand this topic, three sequential steps need clarification:
i. How do agronomic practices affect soil organic matter pools?
ii. How do soil organic matter pools contribute to soil N availability?
iii. How do agronomic practices influence crop N uptake capacity?
Soil organic and crop residue N pools provide the organic N for N mineralization. This
microbial process, primarily heterotrophic, also requires soil organic C (SOC) as an
energy source (Sollins et al., 1984; Chen et al., 2014). Thus, to understand how soil and
crop management affect mineralized soil N, it is critical to first evaluate whether and how
tillage, rotation, and fertilizer N application affect SOC and N sequestration. Soil organic
matter sequestration has been reported to be linked with soil aggregate formation, thus
the dominant concept that explains SOC and N sequestration is based on the aggregation-
SOM model (Six et al., 2004). The basic idea is that soil organic matter can function as a
5

nucleus/binding agent for aggregate formation. Aggregates are considered important
reservoirs of SOC and N that are protected from microbial access and less subject to
physical, chemical, microbial, and enzymatic degradation (Six et al., 2000).
Proper and precise estimation of soil N mineralization has been a challenge since the
early 1900s (Bundy and Meisinger, 1994). Temporal and spatial variability are large
because this process is determined by both internal soil factors (e.g. SOM level, labile C
and N pools, soil microbial community) and external environment factors (e.g.
temperature, precipitation, and aeration) (Goncalves and Carlyle, 1994; Sierra, 1997;
Zech et al., 1997). Agronomic management, such as plant species and N fertilizer
application, may also affect N mineralization (Gill et al., 1995; Van Der Krift and
Berendse, 2001). With current technology it is impossible to predict N mineralization by
taking these factors into consideration at once. Instead of being a measure of available N
supply, N mineralization estimates by current methods should be considered an index of
N availability (Binkley and Hart, 1989). Isotopic tracers and incubation methods are the
two main approaches used to estimate N mineralization. The isotopic tracer method can
measure gross N mineralization, but isotope methods are most expensive and can also
have methodological problems with mineralization rate estimates and other assumption
violations (Hart et al., 1994). Although incubation methods can only measure net soil N
mineralization (net soil N mineralization = gross N mineralization – N immobilization),
incubation can fairly estimate the available N pool, which has a practical value for
efficient N management in agro-ecosystems. Therefore, long-term biological
mineralization has been considered the most suitable soil N availability index, and is
often used to validate other indices derived from more rapid chemical or biological
6

essays (Keeney, 1982; Griffin et al., 2007). There are, however, many variations to
incubation methods, including environment, sample pretreatment, and incubation time,
and each variation has advantages and disadvantages. To use incubation to meet research
objectives, assumptions, pros and cons of each variation should be considered.
An experimentally derived N availability index might not necessarily reflect total crop N
uptake. Besides the amount of available soil N, crop N accumulation also depends on N
uptake capacity. Crop N uptake capacity might be determined by either/both genetic and
environmental controls. Genetics can control crop growth rate and biomass accumulation,
which would result in different N demands at different growth stages (Gastal and
Lemaire, 2002). Crop species have different root architectures, mostly controlled by
genetics (Clark et al., 2011). However, roots, the dominant nutrient uptake organ directly
exposed to the soil, interact with a wide array of soil physical, chemical, and biological
factors that vary in time and space (Lynch, 1995). To understand the impact of agronomic
management practices on crop N uptake or yield, both soil N availability and root
architecture need to be taken into consideration.
Literature concerning the impact of agronomic practices on crop N uptake or yield is
reviewed in three sequential steps. First, the mechanism and effect of agronomic practices
on SOC and STN sequestration are described. Second, the pros and cons of long-term
incubation methodologies for estimating N mineralization are described. Finally, the
potential effects of soil and crop management on root architecture are discussed.
7

1.2 Mechanisms and Effect of Agronomic Practices on Soil C and N Sequestration
The link between SOC and total soil N (STN) decomposition and stabilization and soil
aggregate dynamics has been developed, recognized and intensively studied since the
1900’s (Six et al., 2004). Soil organic C and N dynamics are important to agricultural
production because these affect soil nutrient cycling and plant productivity (Bauer and
Black, 1994). The C and N dynamics are also important to the environment because they
can affect greenhouse gas emissions and water quality (Spalding and Exner, 1993; Cole
et al., 1997). However, these processes happen in a heterogeneous soil matrix and have
multiple interactions with soil biota (Six et al., 2004). The task of elucidation is complex.
Aggregate-SOM models have the potential to explain some of these complexities.
Aggregates not only physically protect SOC and SON, but also influence soil microbe
community structure (Lupwayi et al., 2001), limit oxygen diffusion (Sullivan, 1990),
regulate water flow (Prove et al., 1990), determine nutrient adsorption and desorption
(Linquist et al., 1997; Zhang et al., 2011), and reduce surface runoff and erosion
(Bissonnais, 1996). All these processes have fundamental effects on soil C and N
sequestration and stabilization. Most current studies to understand the impact of
agronomic practices on soil C and N sequestration have been based on the aggregate
hierarchy concept, proposed and developed by (Tisdall and Oades, 1980).
To apply the theoretical aggregate-SOM models, the first consideration is the physical
separation of soil into different aggregates size classes. Two main methods to separate
soil aggregates are widely used by researchers: dry sieving and wet sieving (Kemper and
Rosenau, 1986). The disruption of aggregates is due mainly to slaking and micro-
cracking when the soil is initially dry. Therefore, dry sieving of air-dried samples is used
8
to characterize the aggregate size distribution with minimum destruction. Wet sieving is
used to simulate micro-cracking and slaking (Puget et al., 1995). However, water-stable
aggregate stability from wet sieving procedures was reported to be closely correlated
with SOM stabilization because SOM can act as a transient binding agent (Tisdall and
Oades, 1982) and has served as an effective early indicator of soil C change in numerous
studies (Veum et al., 2012). Therefore, the wet-sieving procedure has been frequently
used to evaluate the agronomic practice effects on both SOM sequestration and soil
structural stability (Beare et al., 1994a; Angers and Giroux, 1996). In the wet-sieving
procedure, there have been some modifications in sample pretreatment (Bissonnais,
1996). The rewetting pretreatments for soils can cause different results when comparing
soils and management history treatments (Le Bissonnais, 1996). Cambardella and Elliott
(1993a) showed that capillary-wetted soils retained larger amounts of macroaggregates (>
250 µm) than slaked soils. (Le Bissonnais, 1996) demonstrated that the different
aggregate breakdown methods and frequency of crusting soil samples can dramatically
affect soil aggregate stability within the same soil management system. Therefore,
adopting minimum breakdown aggregates in the sieving procedure would keep
comparisons between treatments relative to the natural field conditions.
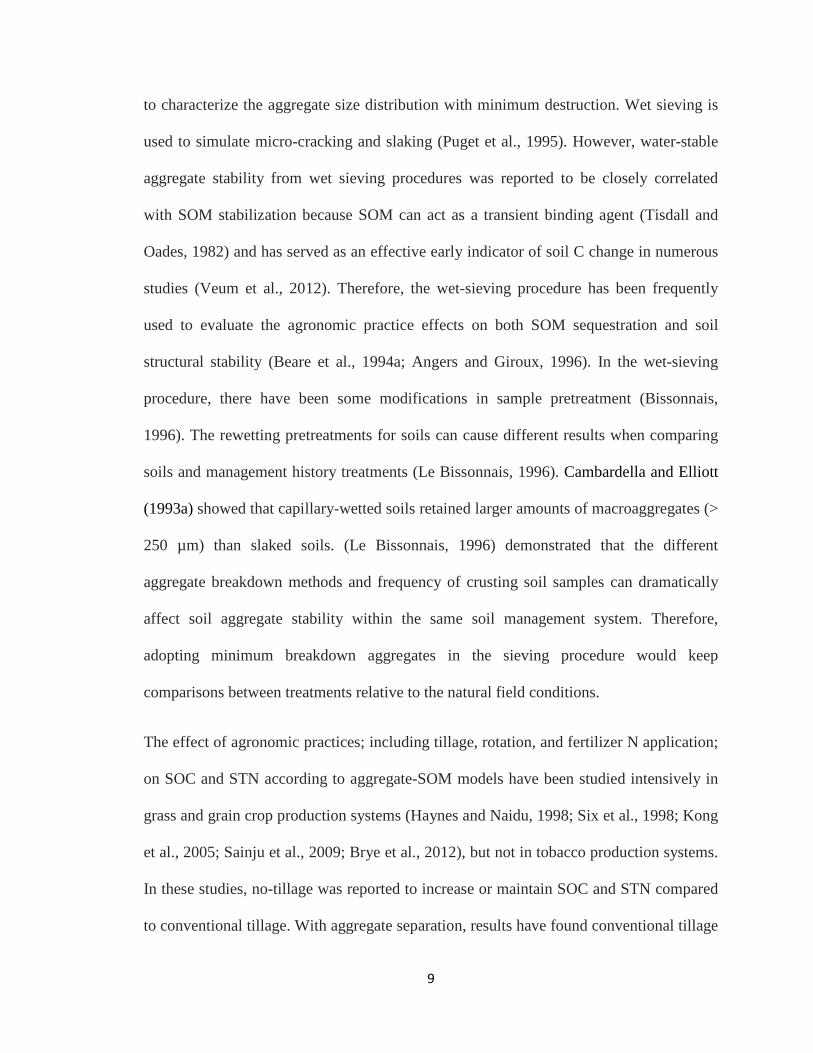
The effect of agronomic practices; including tillage, rotation, and fertilizer N application;
on SOC and STN according to aggregate-SOM models have been studied intensively in
grass and grain crop production systems (Haynes and Naidu, 1998; Six et al., 1998; Kong
et al., 2005; Sainju et al., 2009; Brye et al., 2012), but not in tobacco production systems.
In these studies, no-tillage was reported to increase or maintain SOC and STN compared
to conventional tillage. With aggregate separation, results have found conventional tillage
9

can increase large aggregate turnover rate, resulting in the loss of macro-aggregate
proportion and SOC and STN concentrations (Cambardella and Elliott, 1993a). In
contrast, no-tillage increases macro-aggregates and SOC and STN accumulation.
Most studies have shown that rotation increased SOC and STN sequestration, compared
to mono-cropping (West and Post, 2002; Kong et al., 2005). Crops in rotation schemes
have different impacts on SOM stabilization, depending on the quantity and quality of
crop residues. (Wright and Hons, 2005a) found that crop residue production was similar
among wheat, sorghum and soybean fields, but the wheat field had significant higher
SOC and STN in surface soil than the other two fields, which indicates that the higher
C:N ratio in wheat residue can play a role in SOM stabilization. Kong et al. (2005)
reported that the quantity of crop residue/carbon production had a linear relationship with
SOC sequestration in sustainable cropping systems. Therefore, when evaluating crop
rotation schemes on SOM sequestration, an examination of crop residue quantity and
quality is important.
Studies of the effect of fertilizer N application on SOM sequestration have produced the
most controversial results. Some studies report fertilizer N application to increase SOM
because higher fertilizer N input can cause more crop residue to be returned to soil
(Haynes and Naidu, 1998). Mulvaney et al. (2009) reported that fertilizer N application
decreased soil N in the long-term Morrow plot study and argued that synthetic N
application enhanced soil microbial decomposition due to the decreasing C:N ratio.
However, others found no effect of fertilizer N application on SOM sequestration (Su et
al., 2006; Brown et al., 2014).
10

1.3 Methodologies of Soil N Mineralization Measurement
There are many different methods available for long term aerobic incubation, in both
laboratory and field, depending on soil sample pretreatment and other incubation
conditions (Beauchamp et al., 1986).
1.3.1 Laboratory Incubation Methods
Most aerobic laboratory incubation methods have common features, including
maintenance of optimal soil water status (typically 60 % water filled pore space),
constant temperature (commonly 25, 30, or 35 C), and periodic sampling with time so as
to estimate N mineralization rates (Griffin et al., 2007). Although there have been several
standardized protocols (Bundy and Meisinger, 1994; Honeycutt et al., 2005), there is
significant variation in aerobic incubation details.
Leaching versus Non-Leaching Processes
In early studies with long-term N mineralization incubation, samples were usually
incubated continuously in a container without periodic leaching of the accumulated
inorganic N. The merit of this method was convenience, but there could be cumulative
inhibitory effects, such as pH decline, on mineralization during the incubation (Allison
and Sterling, 1949). Thus, non-leaching approaches were not recommended for long
incubation periods. Stanford and Hanway, (1955) proposed a periodic leaching approach
during incubation. Briefly, 0.01 M CaCl2 was used to leach mineralized N out of the
sample at the end of each incubation period (Stanford and Smith, 1972). The merit of
leaching would be avoidance of accumulation of unspecified toxins. While a time-
consuming and apparatus requiring process, there was also a technical concern with
11

potential leaching of soluble organic N during the incubation (Smith et al., 1980;
Beauchamp et al., 1986).
Excluded Crop Residue versus Included Crop Residue
Crop residue can contribute to the soil inorganic N pool either by N mineralization or
immobilization, depending on the residue C:N ratio. However, most laboratory
incubation methods exclude such contributions by discarding visible pieces of residue in
the pretreatment sieving process (Hart et al., 1994). Some laboratory methods cut
entrained residues into pieces that are mixed with soil for incubation (Heumann et al.,
2002). Certainly, discarding big portions of residue might cause inaccurate estimates of
the N credit from the previous crop because soil fertility guidelines usually recommend a
different fertilizer N rate for the current crop that depends on the previous crop.
Field-Moist Soil Sample versus Dried and/or Ground Soil Sample
Using dried and/or ground soil is convenient for a large amount of soil samples that
require time to process or for cooperative projects where soil samples come from
multiple locations at different times. However, several days are needed to rewet soil for
pre-incubation, which also causes an N mineralization flush during the first weeks of
incubation. Numerous studies have reported that sample sieving and drying-rewetting can
cause rapid microbial death and enhance microbial respiration and activity, producing an
N mineralization bloom (Mikha et al., 2005; Miller et al., 2005; Wu and Brookes, 2005;
Xiang et al., 2008). Using field-moist samples might cause less physical damage during
pre-incubation protocols and cause a better transition from field to lab conditions than
dried and/or ground soil samples. However, field-moist soil samples intended for
12

incubation need to be gently crushed through the sieve (usually 2 to 4 mm) immediately
after sample collection.
Homogenized Soil versus Undisturbed Soil Cores
Most laboratory incubation methods utilize a homogenized sample created by sieving.
However, there are reports that homogenized samples do not well represent the effects of
field soil tillage. Laboratory soil should have a physical structure similar to that of the
field environment the sample represents, but sieving artificially “tills” soil from
undisturbed/no-tillage environments. This can expose aggregate-protected SOM and
enhance microbial activity, resulting in an over-estimate of N mineralization. Therefore,
undisturbed cores may be a better option for laboratory incubations intended to
differentiate the impact of tillage on N mineralization (Rice et al., 1987).
Constant Temperature versus Variable Temperature
Most laboratory incubation methods use a constant temperature, which does not reflect
temperature fluctuation under field conditions. Carpenter-Boggs et al. (2000) proposed a
variable-temperature method for laboratory incubation where soil samples are incubated
in a variable temperature incubator (VTI) that mimicked field soil temperatures under a
growing corn canopy. They reported that the VTI technique provided lower sample
variance and a smaller initial flush of N mineralization than constant temperature (35 C)
incubation.
13

1.3.2 Field (In-situ) Incubation Methods
Due to the uncertainty regarding the extrapolation of laboratory N mineralization values
to the field, estimating N mineralization from SOM and crop residues under field
conditions would be a compelling research topic for investigators because more efficient
N fertilization practices could be hastened if a reliable in-situ N mineralization method
was developed. So far, there have been three dominant in-situ research techniques, using
buried polyethylene bags, covered cylinders, or resin-trap core methods.
Buried Polyethylene Bag Method
The buried polyethylene bag method for in situ N mineralization was proposed by Eno
(1960). The main driving force behind this technical development was the realization that
soil temperature variance would result in considerable changes in the rate of soil nitrate
production. In that preliminary laboratory study, soil in sealed polyethylene bags had an
equal rate of nitrification compared to that contained in ventilated bottles. Polyethylene is
permeable to oxygen and carbon dioxide, but no nitrate diffused through the polyethylene
bag during the 24 week incubation period. The preliminary results and polyethylene
characteristics caused this technique to have the potential to estimate aerobic in-situ soil
N mineralization.
Advantages to this technique include mimicking field temperature conditions at a low
cost. However, the technique does not reflect transient field moisture conditions
(Hanselman et al., 2004). Elevated concentrations of nitrate and carbon dioxide inside the
bags may promote denitrification (Subler et al., 1995). Physical damage to the bags by
insects or plant roots may result in losses of mineralized N into field soil via diffusion
14

and mass flow (Eno, 1960; Hanselman et al., 2004). Another major limitation of this
technique was the inevitable disturbance of soil, which does not allow a valid comparison
of tillage effects on N mineralization under field conditions (Rice et al., 1987).
Covered Cylinder Method
The covered cylinder method was developed as a more durable alternative to the buried
bag and this technique allows incubation of intact soil cores (Raison et al., 1987b).
Covered cylinders are usually constructed from PVC or metal pipes that are capped to
exclude rainfall, which is also assumed to stop inorganic N leaching (Adams and Attiwill,
1986). Although the tubes are open at the bottom, aeration is less than that found in field
soil, which might result in higher denitrification potential. Therefore, modifications such
as use of less than air-tight caps or perforations in the tube sidewall were often added to
promote air exchange and reduce denitrification potential (Rapp et al., 1979; Dou et al.,
1997). However, those sidewall aeration holes could potentially cause mineralized N loss.
Water might enter the soil tubes through aeration holes, causing N leaching at the bottom
of the soil column. Furthermore, plants roots might potentially grow into the soil column
via aeration holes or the open bottom, absorbing mineralized soil from the tubes. Another
major limitation of this technique is that the soil in the tube usually has a lower soil
moisture than that in the field (Hanselman et al., 2004).
The basic principle of the covered cylinder method was the limiting of N leaching by
sheltering incubating soil from precipitation. Based on the same principle, there was
another in-situ method called the “rain shelter” (Powlson, 1980; Rice et al., 1987), which
simply used a shelter over the sampled area to prevent leaching. However, except for
15
considerations regarding the quality and durability of the rain shelter and surface water
run-on during intense rainfall, the major drawback to this technique was that a lack of
ability to reflect field soil moisture fluctuations.
Resin-Trap Soil Core Method
Buried polyethylene bags and covered cylinder methods can capture variation in field
temperature, while failing to reflect moisture and aeration conditions, which are reported
to play a large role in soil N mineralization (Sierra, 1997). Therefore, an alternative in-
situ method was proposed that employed ion exchange resins to capture mineralized N
leaching from undisturbed soil cylinders (DiStefano and Gholz, 1986; Kolberg et al.,
1997). The major modification of this technique were an open cylinder top, which
allowed the precipitation and air to freely enter the intact soil column, and a resin trap at
the bottom to capture inorganic N that might otherwise leach from the tube. There were
some concerns about whether the soil tube caused abiotic differences between soil in the
tube and the surrounding field soil. Wienhold et al. (2009) reported that soil inside the
cylinders was slightly wetter and warmer than adjacent soil, which would likely increase
soil N mineralization. However, they further pointed out that the magnitude was likely
much less than the normally observed field core-to-core variation. Therefore, this method
was found to better track true field conditions (Hanselman et al., 2004) and has potential
to become a standard procedure (Khanna and Raison, 2013).
The drawback with the method is a large resource demand. This technique requires
preliminary studies to ensure leached ions are efficiently trapped under field conditions.
Resin duality, adsorption capacity and bypass flow are all factors that can potentially
16

influence resin effectiveness in capturing leached N. Also, the extraction of adsorbed N
from the resin is time consuming. Kolberg et al. (1997) reported that five extractions with
KCl were required to completely release adsorbed N.
Other Modifications to In-Situ Incubation Methods
Except for the major design developments mentioned above, some minor modifications
to in-situ incubation methods have been suggested. Hatch et al. (1990) proposed a
method to combine the soil core with acetylene inhibition, which would limit N loss by
denitrification due to uncontrolled soil in-situ incubation conditions. The big concern
with this modification would be that the tube must be sealed at the top, causing a loss in
practical application to the field environment if rainfall were a concern. Given
consideration of different drainage characteristics in resin-trap soil cores, relative to the
surrounding soil, Hanselman et al. (2004) developed a “new” type of resin-trap soil core
method in which resin is mixed with soil to create an artificial uniform soil column. This
method is impractical when undisturbed soil structure is a research concern, as in a
comparison of conventional and conservation tillage (Rice et al., 1987).
1.3.3 Method Selection
As discussed above, each method, including laboratory and in-situ methods, has unique
assumptions, advantages, and disadvantages. There is no a standard method that will
work for every situation. The selection of method would depend on the nature of the
study, available resources, and site-specific factors. Although laboratory methods might
not reflect natural field conditions, these can provide reasonable relative values to
estimate differences due to soil type and certain management practices. The primary
17

merit to field incubation is a more practical estimation of N mineralization, which might
be more useful in management decision making. However, the substantial time and
apparatus requirement for the in-situ incubation methods needs to be taken into
consideration. The principle is that both biotic and abiotic factors control the soil N
mineralization process. Knowing the advantage and disadvantage to each method can
help the investigator choose the best method while avoiding misinterpretation of results.
1.4 The Influence of Agronomic Practices on Root Architecture
Plant roots are a fundamental component of terrestrial ecosystems and function to
maintain nutrient and water supply to the plant (Russell, 1977). Although root system
architecture is controlled mainly by genetic factors (de Dorlodot et al., 2007), plant root
systems exhibit highly plastic development. This plasticity is possible because root
development results from continuous propagation of new meristems. In a heterogeneous
soil matrix, a wide array of physical, chemical, and biological factors can affect the
initiation and activity of root meristems (Lynch, 1995). Previous studies have reported
that certain crop root traits can enhance productivity in resource-limited environments
due to improved nutrient and water scavenging abilities (Liao et al., 2001; Ribaut et al.,
2009; Lynch, 2011). Therefore, agronomic practices have the potential to influence crop
nutrient uptake capacity by affecting the root growth environment.
Tillage can affect root growth mainly by changing soil structure, strength and penetration
resistance. Any particular root increases its length through primary growth when cells of
the meristem divide, elongate, and push the root tip forward through the surrounding
materials. Turgor pressure in the elongating cells is the driving force and must be
18

sufficient to overcome cell wall constraints and other additional constraints imposed by
the surrounding environment (Foy and Carson, 1974). Compared to conventional plow
tillage, numerous studies on grain crops report that no-tillage can increase mechanical
impedance, which can result in reduced root length density, root surface density, and
lower biomass production (Gajri et al., 1992; Mosaddeghi et al., 2009; Guan et al., 2014).
Similar results were found in a no-tillage burley tobacco study (Zartman et al., 1976).
Furthermore, greater mechanical impedance with no-tillage not only restricts root growth
but also changes root morphology, restricting main root axis elongation, stimulating
lateral root branching, and root thickening (Griffith et al., 1977; Cook et al., 1996).
Nutrient supply and distribution (or fertilizer application) can affect root system
architecture mainly by signaling (ROBINSON, 1996; López-Bucio et al., 2003).
Typically, roots proliferate in volumes where nutrients are most concentrated (Robinson,
1994). However, the mechanisms of plant root response to the different nutrient elements
might be controlled by different pathways and signals (Zhang and Forde, 1998; Zhang et
al., 1999; Williamson et al., 2001; Mantelin and Touraine, 2004).
There have been few studies of the effect of crop rotation on plant root architecture.
However, given the basic factors controlling root development, the hypothesis that crop
rotation might have different effects on root architecture than mono-cropping systems. If
rotated with residue-rich or deep rooted crops which can increase SOM levels and soil
structure. In this case, rotation can affect root proliferation by changing soil structure in a
manner similar to that observed with no-tillage. If rotation involved legumes, more N
nutrition is provided than that found with mono-cropping. In this case, rotation could
19

affect root architecture by changing soil nutrient supply in a manner similar to that found
with fertilizer application.
From the discussion above, the effects of agronomic practices on crop N uptake cannot
only affect SOM sequestration and soil N mineralization, but can also cause a soil
environment for plant root proliferation. Similarly, in the paper titled “A New Worldview
of Soils” (Lin, 2014), soil productivity is broadly defined as the soil’s unique ability to
supply water, nutrients, air, and heat, among other life-sustaining resources, adjusting that
supply to the demands of plants and microbes. Soil resources fall into two main
components; a) nutrients and moisture; and b) an environment suited for root growth and
microbial activity.
1.5 Conclusions and Dissertation Overview
Agronomic practices reflect agriculture’s N management history. Currently, agronomic
practices have two major responsibilities: a) to promote global food production; and b) to
maintain the agro-ecosystem environment. This review demonstrates that soil N
dynamics have the potential to provide a framework for understanding how agronomic
practices can connect these two responsibilities. Systematically understanding N cycling
in the context of a suite of soil and crop management practices provides a foundation to
understanding, developing, evaluating and reshaping those agronomic practices.
In this dissertation, laboratory and in-situ studies were conducted at two long-term study
sites at the University of Kentucky’s Spindletop Research Farm. In Chapter 2, the effect
of tillage, rotation, and fertilizer N application on aggregate distribution and associated C
and N storage in burley tobacco production systems is evaluated. In Chapter 3, there are
20

three topics, including a comparison study of laboratory and in-situ incubation methods
for estimating the relative impact of tillage and rotation management on soil N
mineralization, a study evaluating fertilizer N management on in-situ net N
mineralization, and a study evaluating soil indicators of laboratory soil N mineralization.
In Chapter 4, no-tillage culture and N fertilizer management for burley tobacco
production is discussed. Finally, in Chapter 5, a summary of the findings obtained in this
series of studies is presented.
21

Chapter 2: Burley Tobacco Production Conservation Practices Increase Large Soil
Aggregates and Associated Carbon and Nitrogen Stocks
2.1 Introduction
Burley tobacco has been produced in Kentucky since the 1860s (Kleber, 1992). While
still a leading producer, Kentucky burley production has fluctuated because of the
Tobacco Transition Payment (Tobacco Buy Out) Program (Womach, 2004), stricter
production requirements, and global market demand. Although Kentucky was a pioneer
in no-tillage crop production (Phillips and Young Jr, 1973), most burley tobacco
production is still tillage intensive due to grower tradition, the expense of no-tillage
tobacco transplanters, and the limited number of herbicides labeled for tobacco
production in the USA (Zou, 2013). One result of the tobacco buy out has been that field
production units have become larger, resulting in less crop rotation and, in some cases, no
rotation at all. Intensive tillage and monoculture tend to accelerate the depletion of soil
organic matter, degradation of water stable macroaggregates, and weakening of soil
physical structure, leading to increased production cost and soil erodibility (Zotarelli et
al., 2007; Kasper et al., 2009). No-tillage and rotation with grass sod or row crops are
alternative management strategies for more sustainable tobacco production. Information
is available to demonstrate the impact of no-tillage practices on tobacco productivity
(Phillips and Zeleznik, 1989; Pearce and Zeleznik, 1996b), but little is known about how
soil aggregates and associated SOC and STN stocks in tobacco production fields respond
to these conservation practices.
22

No-tillage management has been shown to be effective at increasing SOC and STN
stocks in agricultural ecosystems (Six et al., 1998; Wright and Hons, 2005a). Under no-
tillage, more shoot and root residues at the surface soil, combined with less large
aggregate disruption, results in higher carbon (C) and nitrogen (N) sequestration and a
greater macroaggregate fraction (Sainju et al., 2009). In contrast, tillage mixes crop
residues into the surface soil and disrupts aggregates, especially macroaggregates, which
enhances residue decomposition and humus oxidation (Beare et al., 1994a). Similarly,
increases in SOC and STN have been observed in diverse and intensive crop rotation
systems, relative to monoculture, in numerous studies (Wright and Hons, 2005a; Sainju
and Singh, 2008; Veum et al., 2012). The SOC and STN accumulation is regulated by the
quantity and quality of crop residue returned to the soil (Wright and Hons, 2005a).
Compared to other row or sod crops, burley tobacco production returns fewer residues to
the soil because burley tobacco is a short-season, shallow rooted crop and the entire
above ground portion of the plant is harvested.
Burley tobacco’s high cash value can lead to ineffective excess N fertilization of the crop
(MacKown and Sutton, 1997; MacKown and Sutton, 1998). However, there might be two
impacts of excess fertilizer N application on aggregation and SOC and STN
sequestration, with contrary results. One is that fertilizer N can have a positive effect on
SOM accumulation and macroaggregate formation due to increased residue biomass
input (Lugato et al., 2010; Yu et al., 2012). The other is that fertilizer N can have a
negative effect on SOM accumulation via increased SOC mineralization primed by N
fertilizer addition (El-Haris et al., 1983a; Jordan et al., 2004; Khan et al., 2007). Several
studies found no difference between N fertilized and unfertilized treatments with regard
23

to aggregate size fractions and associated SOC and STN stocks (Plaza-Bonilla et al.,
2013; Tripathi et al., 2014). Given these results, fertilizer N application effects on soil
aggregation, C and N might vary with different crop rotation and tillage management
practices.
SOC and STN sequestration have been closely linked to aggregate stability (Six et al.,
2004). Soil organic matter can be a nucleus for aggregate formation and act as a binding
agent (Tisdall and Oades, 1982). Aggregates are considered an important reservoir of
SOC and STN that is protected from microbial access and less subject to physical,
chemical, microbial, and enzymatic degradation (Bajracharya et al., 1997; Trujillo et al.,
1997; Six et al., 2000b). Therefore, aggregate-SOM models are an important and classical
way to investigate SOC and STN stabilization (Six et al., 2004). This stabilization offers
physicochemical protection in hierarchical soil aggregates and is critical to building and
maintaining SOC and STN stocks (O'Brien and Jastrow, 2013). Among the several
aggregate sizes, the proportion of the macroaggregate fraction (> 250 µm) reportedly
serves as an early effective indicator of the SOM dynamics influenced by agronomic
practices (Six et al., 1999; Veum et al., 2012).
Soil aggregate size distribution and stability are also considered important physical
indicators of soil quality, reflecting the impact of land use and management (Kemper and
Rosenau, 1986; Castro Filho et al., 2002) on aggregation or degradation (Boix-Fayos et
al., 2001; Barthes and Roose, 2002), nutrient supply potential (Bronick and Lal, 2005)
and soil health (Seybold and Herrick, 2001). Thus, physically separating aggregates and
determining the associated SOC and STN stocks is a systematic way to evaluate the
24

influence of tillage, rotation and N fertilization management on structure, SOC and STN
sequestration in burley tobacco production systems.
Conventional burley tobacco production would be considered non-sustainable due to the
negative impacts on aggregation, SOC and STN stocks. The primary objective of this
experiment was to investigate whether tillage, rotation and recent N fertilization practices
influenced aggregate size distributions and aggregate-associated SOC and STN stocks in
soils under burley tobacco production. The hypotheses were: i) no-tillage, rotation with
sod and high N fertilization rates would result in a greater proportion of macroaggregates
and improved soil structure when compared with conventional tillage, monoculture, and
low N fertilization rates; and ii) no-tillage, rotation with sod and high mineral N input
would increase bulk SOC and STN stocks by increasing macroaggregate-associated SOC
and STN concentrations and stocks.
2.2 Materials and Methods
Site description
This research was conducted at the University of Kentucky Spindletop Research Farm
near Lexington, Kentucky, USA (38°07'36.8"N 84°29'26.4"W). The soil was a deep well-
drained Bluegrass-Maury silt loam (fine, mixed, active, mesic Typic Paleudalf), formed
in phosphatic limestone residuum, with a 2 to 4 percent slope. When the study was
established in 2007, the baseline soil water pH (1:1, w/v) was 6.3, and Mehlich III
(Mehlich, 1984) extractable nutrient levels were 85, 178, 1800, 110 and 3 mg kg-1 for
phosphorus, potassium, calcium, magnesium, and zinc, respectively. The soil texture was
12 % sand, 68 % silt, and 20 % clay. The location is characterized by wide variation in
25

mean monthly air temperatures, from 0°C in January to 24°C in July and August, but a
relatively uniform distribution in mean monthly precipitation, with an annual average
rainfall of 1160 mm.
Field experiment design
The experiment was laid out in randomized complete blocks with four replications. The
four tillage-crop sequence treatments: i) no-tillage continuous tobacco (TTT-NT); ii)
conventional tillage continuous tobacco (TTT-CT); iii) 2-yr fescue sod (Festuca
arundinacea Schreb.) and 1-yr no-tillage tobacco (SST-NT); and iv) 2-yr fescue sod and
1-yr conventional tillage tobacco (SST-CT); were randomly assigned plots (6.4 m wide
by 24.4 m long) in each block. From 2007 to 2012, continuous burley tobacco was grown
for 6 seasons and in the 2-yr sod plus 1-yr burley tobacco rotation 2 cycles were
completed with 4 years of fescue and 2 years of tobacco. Primary conventional tillage
consisted of moldboard plowing, with secondary tillage consisting of disking (twice),
followed by a rotary tillage operation. Other management practices were as
recommended by the University of Kentucky Cooperative Extension Service (Seebold
and Pearce, 2011). In 2012, when all plots were in tobacco, broadcast N rates of 0, 140 or
280 kg N/ha, as NH4NO3 (34 % N), were randomly assigned to split plots on 22 May (6.4
m wide by 8.2 m long).
Soil sampling and sample preparation
Soil samples were taken on 12 February 2013. For this study, the sub-plots that had
received 0 and 280 kg N/ha fertilizer N rates the previous spring were sampled. Soil bulk
density was measured in each plot using an aluminum cutting ring 5.4 cm high by 6 cm in
26

diameter in the midst of the 0 to 10 cm depth increment. The soil cores were oven-dried
at 105 °C for 24 hours. For determination of wet aggregate size distribution and both
SOC and STN concentrations, soil cores (15 cores) were randomly collected from the 0
to 10 cm depth increment in each sub-plot using a 2.5 cm diameter probe and then
composited into one representative field moist sample. The field moist soil was passed
through an 8 mm sieve. In this study, aggregates from all treatments were smaller than 8
mm in diameter. Visible pieces of root residue and rock were removed. The field moist
samples were brought to the laboratory and kept at 4 °C in sealed plastic bags until wet
sieving. Wet sieving fractionation was performed within one week of sampling.
Wet aggregate sieving procedure
Aggregate size classes were physically separated with wet sieving (Cambardella and
Elliott, 1993b; Cambardella and Elliott, 1993a), but, to avoid potential breakage during
rewetting of air-dried soil (Kemper and Rosenau, 1986), field moist soil was used.
Subsamples of field moist soil were taken to determine gravimetric water content after
oven drying at 105 °C for 24 hr. Another subsample of field moist soil, equal to 50 g of
oven dried soil after moisture content correction, was slowly wetted via capillary action
for 10 min in deionized water to reduce slaking, and then samples were wet sieved
through a series of three sieves to obtain four aggregate size fractions: i) > 2000 µm
(large macroaggregates); ii) 250 to 2000 µm (small macroaggregates); iii) 53 to 250 µm
(microaggregates); and iv) < 53 µm (silt plus clay-sized particles). For the rewetting
process, aggregate disruption was manually accomplished by moving the sieve 3 cm
vertically 50 times during a period of 2 minutes. Materials remaining on the sieves were
quantitatively transferred to glass jars and dried at 50° C in a forced-air oven. The
27

suspension containing the < 53 μm particles was brought to 5 L, well stirred, and a 500
mL sub-sample of that suspension was transferred to a glass jar and dried at 50° C in a
forced-air oven. Aggregate fractions were weighed at room temperature. A subsample of
each 50 °C dried aggregate fraction was dried at 105 °C for 24 hours for final aggregate
moisture correction.
In this soil, both sand and iron-manganese nodules could be present in the aggregates,
without actually being part of any aggregate (Elliott et al., 1991; Rhoton et al., 1993). A
dry mass correction for the presence of sand and other coarse primary particles in intact
aggregates was accomplished by dispersing 2 g of 50 °C–dried aggregates in 15 mL of a
5 % (w/v) solution of sodium hexametaphosphate and shaking the suspension overnight
in a reciprocal shaker (180 min-1). The dispersed particles were then sieved through a 53
μm sieve, washed using ionized water, and oven-dried at 105° C. The mass of coarse
primary particles was subtracted from the previously obtained mass for that aggregate
fraction.
Soil C and N determination
Bulk soil and aggregate subsamples were analyzed for SOC and STN concentrations on
an Elementar Vario MAX CNS Analyzer (Elementar Americas Inc., Mount Laurel, NJ).
Prior to chemical analysis, visible shoot and root residue was hand removed with a
forceps and the subsamples were then ground in a mortar and pestle.
28

Calculations
To assess changes in soil structure due to the tillage, rotation and fertilizer N treatments,
parameters expressing the aggregate size distribution were calculated. Aggregate mean
weight diameter (MWD) was calculated with Equation 1 (Kemper and Rosenau, 1986):
MWD = ∑ 𝑋𝑋𝑋𝑋 × 𝑊𝑊𝑋𝑋𝑛𝑛𝑖𝑖=1 Equation 1;
where Xi is the weight fraction (percentage) of each sand/coarse particle corrected
aggregate size fraction and Wi is the mean diameter for each size fraction. The aggregate
geometric mean diameter (GMD) was calculated with Equation 2 (Kemper and Rosenau,
1986):
GMD = 𝑒𝑒𝑒𝑒𝑒𝑒 �∑ 𝑊𝑊𝑖𝑖×𝐿𝐿𝑛𝑛𝐿𝐿𝑖𝑖𝑛𝑛𝑖𝑖=1∑ 𝑊𝑊𝑖𝑖𝑛𝑛𝑖𝑖=1
� Equation 2;
Sand/coarse particle corrected aggregate SOC or STN concentration (g/kg) was expressed
as: (aggregate STN or SOC concentration (g/kg)) × 100/ (100 – sand/coarse particle %)
Stocks of SOC (SOCs) or STN (STNs) in whole soil (g/m2) were calculated with
Equation 3:
SOCs (or STNs) = D × BD × SOC (or STN) × 10 Equation 3;
where D is the thickness (cm) of the soil layer, BD is the bulk density (g/cm3), and SOC
(or STN) is the SOC (or STN) concentration (g/kg) of the 0 to 10 cm soil layer.
Stocks of SOC (SOCsi) or STN (STNsi) in each aggregate size fraction (g/m2) found in
the 0 to 10 cm soil layer were calculated with Equation 4:
29

SOCsi (or STNsi) = D×BD×SOCi(or STNi)×Wi10
Equation 4;
where SOCi (or STNi) is the OC (or TN) concentration of the ith size fraction (g/kg
aggregate), and Wi is the weight proportion of the total soil in the ith size fraction (%).
Statistical analyses
Data were analyzed with the General Linear Model (GLM) procedure of the SAS 9.3
computer package (SAS Institute Inc., Cary, NC). Fertilizer N rate was considered a
discrete variable and was not analyzed as a quantitative variable because no interpolation
of fertilizer N effects over the 0 to 280 kg N/ha rate range was intended. Rather, we
wanted to understand fertilizer N impacts at the chosen rates. Replicate measurements on
composite soil samples were averaged for statistical analysis of treatment effects.
Treatment effects were declared significant when the probability (p) of a greater F
statistic was < 0.05. Means separation was done by using the Tukey's HSD (honest
significant difference) test at the 95 % level of confidence.
2.3 Results
Soil Structure and Water Stable Aggregate Distribution
Bulk density was significantly affected by tillage, but not by rotation or previous N
fertilizer rate (Table 2.1 and Figure 2.1). The MWD and GMD were significant affected
by tillage and the rotation by N rate interaction (Figure 2.2). In the rotation by N rate
interaction, rotation with fertilizer N resulted in significantly higher MWD than rotation
without fertilizer N, while monoculture tobacco with fertilizer N resulted in a
30

significantly lower MWD than monoculture without fertilizer N. The same trend was
observed in GMD values.
Aggregate size fractions were was significantly affected by two interactions, tillage by
rotation and rotation by N rate (Table 2.1). In the tillage by rotation interaction, no-tillage
significantly increased large and small macroaggregates and rotation with sod was
synergistic to no-tillage. In contrast, conventional tillage and monoculture tobacco
degraded soil structure, reducing the proportion of large and small macroaggregates and
raising the fraction in silt-clay sized particles (Figure 2.3A). In the rotation by N rate
interaction, rotation with fertilizer N resulted in significantly more large macroaggregates
than rotation without fertilizer N, while monoculture tobacco with fertilizer N resulted in
significantly less large macroaggregates than monoculture without fertilizer N. However,
the results with small macroaggregates was reversed (Figure 2.3B).
31

Table 2.1 Analysis of variance for the effects of tillage, rotation, fertilizer N rate, and their interactions, on bulk density, large
macroaggregates, small macroaggregates, microaggregates, silt-clay particles, and aggregate mean weight diameter (MWD), and
geometric mean diameter (GMD).
Effect/contrast Bulk density Large Small Microaggregates Silt-clay MWD GMD macroaggregates Macroaggregates particles ------------------------------Probability of a greater F value------------------------------ Tillage (T) 0.0351 0.0007 0.1383 0.2801 0.0035 0.0005 0.0002 Rotation (R) 0.9597 0.0261 0.0060 0.8727 0.0095 0.0158 0.0038 Fertilizer N rate (N) 0.1784 0.5014 0.7477 0.2746 0.4931 0.4252 0.9963 T*N 0.2740 0.7009 0.3730 0.4350 0.2109 0.5208 0.2055 R*N 0.4484 0.0001 0.0015 0.0007 0.8115 0.0004 0.0351 T*R 0.5267 0.0505 0.0004 0.0011 0.0085 0.2959 0.1110 T*R*N 0.7124 0.1370 0.1075 0.6069 0.7476 0.2303 0.2756
32

Figure 2.1 The effect of tillage on bulk density and aggregate mean weight diameter
(MWD), and geometric mean diameter (GMD). For any one measured variate, vertical
bars with different letter at the top are significantly different at the P < 0.05 level.
33

Figure 2.2 The rotation by N rate interaction on aggregate mean weight diameter
(MWD), and geometric mean diameter (GMD). For any one measured variate, vertical
bars with different letters at the top are significantly different at the P < 0.05 level.
34

Figure 2.3 The proportion of large macroaggregates, small macroaggregates, microaggregates and silt-clay particles due to the tillage
by rotation (A) and rotation by N rate (B) interactions. For any one aggregate size class, vertical bars with different letters at the top
are significantly different at the P < 0.05 level.
35

Aggregate C and N Concentrations
Tillage significantly affected whole-soil and aggregate-associated SOC concentrations,
except for silt-clay particle associated SOC. Rotation significantly affected whole-soil
and silt-clay particle associated SOC, while fertilizer N application had no effect on any
aggregate size associated SOC (Table 2.2). Compared to conventional tillage, no-tillage
burley tobacco production increased whole-soil SOC and, when rotated with a grass sod
crop, there was a synergistic effect. Also, the NT-Rotation treatment exhibited the highest
aggregate-associated SOC for any aggregate size class (Figure 2.4A). There were
significant interaction effects; tillage by rotation on small macroaggregate and
microaggregate associated SOC (Figure 2.4A), and rotation by fertilizer N application on
microaggregate associated SOC (Figure 2.4B).
Tillage significantly affected whole-soil and all aggregate associated STN concentrations.
Rotation significantly affected bulk soil and small macroaggregate associated STN, while
fertilizer N application only significantly affected microaggregate associated STN (Table
2.2). Compared to conventional tillage, no-tillage burley tobacco production increased
bulk soil STN and rotation with grass sod also synergized this soil parameter. The CT-
Rotation treatment exhibited the highest aggregate associated STN for any aggregate size
class (Figure 2.5A). There was a significant tillage by rotation interaction on small
macroaggregate and microaggregate associated STN (Figure 2.5A), and there was a
significant rotation by fertilizer N application interaction on large macroaggregate
associated STN (Figure 2.5B).
36

Table 2.2 Analysis of variance for the effects of tillage, rotation, fertilizer N rate, and their interactions, on organic carbon (SOC) and
total nitrogen (STN) concentrations for 0 to 10 cm whole-soil and aggregate fractions.
Effect/contrast Whole-soil Large macroaggregates Small
macroaggregates Microaggregates Silt-clay particles
SOC STN SOC STN SOC STN SOC STN SOC STN ------------------------------Probability of a greater F value------------------------------- Tillage (T) 0.0071 0.0096 0.0004 0.0015 0.0129 0.0025 0.0129 0.0098 0.0569 0.0066 Rotation (R) 0.0020 0.0080 0.1955 0.8481 0.3212 0.0225 0.2288 0.6378 0.0105 0.1413 Fertilizer N rate (N) 0.9711 0.6117 0.8657 0.4366 0.3812 0.0949 0.9937 0.0209 0.0733 0.0853 T*N 0.7817 0.6117 0.9856 0.5358 0.9793 0.4562 0.0917 0.0140 0.5143 0.9727 R*N 0.8040 0.3932 0.1548 0.0071 0.0748 0.8144 0.0201 0.7248 0.8979 0.8111 T*R 0.4323 0.7399 0.8056 0.8535 0.0298 0.0352 <.0001 0.0003 0.8415 0.3295 T*R*N 0.5317 0.9470 0.2764 0.2137 0.3595 0.5910 0.9076 0.8538 0.4825 0.5634
37

Figure 2.4 The SOC concentrations of whole-soil, large macroaggregates, small macroaggregates, microaggregates and silt-clay
particles for the tillage by rotation (A) and rotation by fertilizer N rate (B) interactions. Vertical bars within an aggregate size class,
with different letters at the top, are significantly different at the P < 0.05 level. Note: * < 8000 indicates whole soil. The SOC of whole
soil is without sand correction, while the other aggregate associated SOC concentrations were sand-corrected.
38

Figure 2.5 The STN concentrations for whole-soil, large macroaggregates, small macroaggregates, microaggregates and silt-clay
particles for the tillage by rotation (A) and rotation by fertilizer N rate (B) interactions. Vertical bars within an aggregate size class,
with different letters at the top, are significantly different at the P < 0.05 level. Note: * < 8000 indicates whole soil. The STN of
whole-soil is without sand correction, while the other aggregate associated STN concentrations were sand-corrected.
39

Soil Aggregate Organic Carbon and Total Nitrogen Stock
Whole-soil and all aggregate associated SOC stocks were significantly influenced by
tillage, but not by fertilizer N application. Rotation significantly affected whole-soil and
aggregate associated SOC stocks, except for microaggregate associated SOC stocks
(Table 2.3). In the tillage by rotation interaction (Figure 2.6A), the order of whole-soil
SOC stock is NT-Rotation > NT-Tobacco > CT-Rotation > CT-Tobacco. Generally, no-
tillage and rotation tend to maintain whole-soil SOC stocks by maintaining large and
small macroaggregate associated SOC stocks, while conventional tillage and tobacco
monoculture can deplete whole-soil SOC stocks by depleting large and small
macroaggregate associated SOC stocks. In the rotation by fertilizer N interaction (Figure
2.6B), rotation with fertilizer N application resulted in significantly higher large
macroaggregate associated SOC stocks than rotation without fertilizer N, while tobacco
monoculture with fertilizer N resulted in significantly lower large macroaggregate
associated SOC stocks than tobacco monoculture without fertilizer N.
Whole-soil and all aggregate associated STN stocks were significantly influenced by
tillage, while rotation significantly affected whole-soil, small macroaggregate and silt-
clay particle associated STN stocks. Fertilizer N application affected only microaggregate
associated STN stocks (Table 2.3). In the tillage by rotation interaction (Figure 2.7A),
the whole-soil STN stock order was NT-Rotation > NT-Tobacco > CT-Rotation > CT-
Tobacco. As with SOC stocks, no-tillage and rotation maintained whole-soil STN stocks
by maintaining large and small macroaggregate associated STN, while conventional
tillage and tobacco monoculture depleted whole-soil STN by depleting large and small
macroaggregate associated STN stocks. In the rotation by fertilizer N interaction (Figure
40

2.7B), rotation with fertilizer N application resulted in significantly higher large
macroaggregate associated STN stocks than rotation without fertilizer N application,
while tobacco monoculture with fertilizer N application resulted in significantly lower
large macroaggregate associated STN stocks than tobacco monoculture without fertilizer
N application.
Table 2.4 shows the quality of the correlations between whole-soil SOC stocks (SOCS)
or STN stocks (STNS) and the SOCS or STNS for the different aggregate sizes. These
results showed that whole-soil SOCS and STNS have greater correlation with large and
small macroaggregate SOCS and STNS than with the SOCS and STNS found in other
aggregate size fractions. Aggregate SOCS, STNS, size of the aggregate fraction (%), bulk
density and aggregate SOC and STN are shown in Table 2.5. These results demonstrated
that large and small macroaggregate SOCS and STNS contributed more to whole-soil
SOCS and STNS via their fraction size (%) than did bulk density or aggregate SOC and
STN.
41

Table 2.3 Analysis of variance for the effects of tillage, rotation, and N fertilizer rate on whole-soil and aggregate-associated SOC
stocks (SOCS) and STN stocks (STNS), for 0 to 10 cm whole-soil and aggregate fractions.
Effect/contrast Whole-soil Large macroaggregates Small macroaggregates Microaggregates Silt-clay particles
SOCS STNS SOCS STNS SOCS STNS SOCS STNS SOCS STNS ------------------------------Probability of a greater F value------------------------------ Tillage (T) 0.0040 0.0034 0.0007 0.0006 0.0008 0.0017 0.0006 0.0017 0.0310 0.0445 Rotation (R) 0.0419 0.0286 0.0276 0.0622 0.0010 0.0013 0.5385 0.8524 0.0297 0.0179 Fertilizer N rate (N) 0.5765 0.8241 0.7762 0.2871 0.8645 0.5034 0.1250 0.0162 0.9989 0.9796 T*N 0.8020 0.3685 0.9898 0.5942 0.8705 0.9414 0.6948 0.5767 0.2890 0.1815 R*N 0.5841 0.7442 0.0001 0.0004 0.0275 0.0082 0.0199 0.0027 0.9789 0.8830 T*R 0.6047 0.6742 0.0141 0.0207 0.0206 0.0247 0.0860 0.0364 0.1257 0.2463 T*R*N 0.7312 0.8218 0.4978 0.2958 0.4122 0.3722 0.8604 0.8600 0.8985 0.9666
42

Figure 2.6 The SOC stocks (SOCS) of whole-soil, large macroaggregates, small macroaggregates, microaggregates and silt-clay
particles for the tillage by rotation (A) and rotation by fertilizer N rate (B) interactions. Vertical bars within an aggregate size class,
with different letters at the top, are significantly different at the P < 0.05 level. Note: * < 8000 indicates whole soil.
43

Figure 2.7 The STN stocks (STNS) of whole-soil, large macroaggregates, small macroaggregates, microaggregates and silt-clay
particles for the tillage by rotation (A) and rotation by fertilizer N rate (B) interactions. Vertical bars within an aggregate size class,
with different letters at the top, are significantly different at the P < 0.05 level. Note: * < 8000 indicates whole soil.
44

Table 2.4 The relationships between whole-soil SOC stocks (SOCS) or STN stocks (STNS) and the SOCS and STNS stocks found in
different aggregate size fractions (n= 32).
Large macroaggregates
Small macroaggregates
Microaggregates
Silt-clay particles
SOCS STNS
SOCS STNS
SOCS STNS
SOCS STNS
Whole-soil SOCS 0.865†
0.786
0.651
-0.437 Whole-soil STNS
0.807
0.748
0.562
-0.397
†values in the table are correlation coefficients, all of which are significant (p ≤ 0.05).
Table 2.5 The relationships between aggregate SOC stocks (SOCS) or STN stocks (STNS) with aggregates size fraction (%), bulk
density and aggregate SOC (or STN) concentrations (n= 32).
Large
macroaggregates Small
macroaggregates Microaggregates Silt-clay particles SOCS STNS SOCS STNS SOCS STNS SOCS STNS Size of Aggregate Fraction (%) 0.912† 0.908 0.839 0.873 0.494 0.617 0.920 0.921 Bulk Density 0.689 0.707 0.476 0.424 0.626 0.528 -0.025* -0.047* Aggregate SOC (or TSN) Concentration 0.479 0.317* 0.358 0.459 0.282* 0.319* -0.436 -0.302*
†values in the table are correlation coefficients. Coefficients not followed by a * sign are significantly different (p ≤ 0.05).
45

2.4 Discussion
Soil Structure and Water Stable Aggregate Size Distribution
No-tillage for burley tobacco production significantly increased soil aggregate stability
(MWD and GMD) when compared to conventional tillage, which was consistent with
earlier reports (Whalen et al., 2003; Wright and Hons, 2005a; Anders et al., 2012). In this
study, no-tillage soil bulk density was significantly higher than that found with
conventional tillage, which was not consistent with some reports. Tisdall and Oades
(1980) argued that conventional tillage destroys the original soil structure, breaking up
the macroaggregates into microaggregates, resulting in increased micro-porosity and bulk
density, though this might depend on soil type. Six et al.(2002) reported that bulk density
values under NT and CT were rarely different in tropical and subtropical soils, while NT
bulk density was generally higher than CT in temperate soils. Previous research on
Maury-Bluegrass soil found CT had significantly higher penetrometer resistance than NT
in wheel trafficked areas, due to weakened CT soil structure and lower bearing capacity
(Ritchey, 2010). In areas without significant traffic, compaction in CT and NT was
similar, even lower in CT. In the present study, plot traffic was limited due do to the
small size of the plots and the presence of sod borders around each plot.
Water stable macroaggregate content was reported to be an easily measured early
indicator of improved aggregation due to soil conservation management (Kemper and
Rosenau, 1986; Beare et al., 1994a), which mostly increases mean weight diameter
(MWD) values (Kemper and Rosenau, 1986). The macroaggregate proportion and both
GMD and MWD values found here were consistent with earlier studies and supported
46

initial hypotheses that no-tillage and rotation in burley tobacco production would
improve soil structure. Compared to conventional tillage, no-tillage can significantly
reduce macroaggregate turnover rate and increase fungal hyphae and microbial
byproducts that promote agglomeration of small aggregate factions into macroaggregates
(Chan and Heenan, 1999; Whalen et al., 2003; Spaccini and Piccolo, 2013). Whether
rotation can increase soil aggregation mainly depends on increased amounts/quality of
crop residue returned to soil and its impacts on SOC, STN and the microbial
biomass/activity that contributes to increased aggregation (Mendes et al., 1999). Burley
tobacco is typically harvested as whole plants, thus much less residue is left compared to
residue-rich crops like corn and wheat. Rotating perennial grass sod with tobacco adds
extensive shoot and root residues. The sod’s dense, fibrous root system promotes soil
structure and binds small aggregates into larger ones. Furthermore, the CT-Rotation
treatment in this study was tilled only once per three year cycle because no tillage was
necessary during the sod growth period, causing the CT-Rotation treatment to include
two years of no-tillage as well as rotation. Therefore, only two tillage events within the
two rotation cycles could dramatically deplete water stable large macroaggregates – as
compared to the NT-Rotation treatment.
The N fertilizer application to tobacco had no main effect on water stable aggregate size
distribution. This finding is similar to that of Plaza-Bonilla et al. (2013). They found
similar water stable macroaggregate size distributions among different N fertilizer rates
within grain production systems. However, there was a significant rotation by N
interaction. Rotation with 280 kg N/ha had a higher macroaggregate content than rotation
without fertilizer N, which can be explained by N immobilization with sufficient
47

available carbon. Before planting tobacco, sod was chemically killed, resulting in
significant amounts of decaying above and belowground biomass, which can cause
microbial immobilization of added inorganic N (Hart et al., 1994), increasing microbial
biomass, fostering large macroaggregate formation. However, there was no clear
mechanism to explain why tobacco monoculture without fertilizer N resulted in greater
levels of large macroaggregates than monoculture with fertilizer N. There is less carbon
input with tobacco monoculture than tobacco rotation. The addition of N fertilizer during
tobacco production might decrease the soil C:N ratio, which could promote SOM
decomposition and enhance large macroaggregate turnover.
In general, soil aggregate stability (MWD and GMD) and water stable aggregate
distribution data suggested that traditional burley tobacco production (tobacco
monoculture plus conventional tillage) was not sustainable with regards to soil structure.
Tobacco monoculture with conventional tillage can enhance macroaggregate turnover
and there was a corresponding increase in the proportion of silt-clay particles, resulting in
lower MWD and GMD values. Conversation practices, both no-tillage and rotation, have
the potential to slow soil degradation and maintain soil quality.
Soil and Aggregate SOC and STN Concentrations
No-tillage and rotation with sod significantly increased whole-soil SOC and STN
concentrations. Some reports have suggested that water stable aggregate SOC is
concomitant with STN (Jastrow et al., 1996; Six et al., 2000a; Zibilske and Bradford,
2007). This study’s findings are comparable to those reports. The SOC and STN
exhibited similar patterns across all aggregate size classes. These results indicate that
48

SOC and STN concentration in > 53µm aggregates were higher than those in < 53µm
aggregates and the trend was similar to that reported by Cambardella and Elliott (1993a).
This result confirmed the hierarchical soil aggregate-SOM model - that SOC and STN in
large aggregates were less susceptible to the physical, chemical and biological
decomposition (O'Brien and Jastrow, 2013).
Whole-Soil and Aggregate SOCS and STNS
The SOCS and STNS play a central role in soil functions that produce a wide range of
vital environmental goods and services (Banwart et al., 2014). In the evaluation of every
conversation plan for agricultural production, SOCS and STNS become important
parameters (Amundson, 2001; Dersch and Böhm, 2001; Hobbs et al., 2008a). The SOCS
and STNS were distributed among different aggregate size classes and various size of
aggregate have different formation and turnover responses to agronomic management
(Six et al., 2000a). This caused interest as regards how no-tillage and rotation practices in
burley tobacco production affected SOCS and STNS by physically separating the
different size aggregates from the whole soil.
The SOCS and STNS for each aggregate size depended on the fraction of whole soil
found in that aggregate size, bulk density and aggregate SOC and STN. The study
showed no-tillage and rotation contributed to greater levels of SOC and STN and greater
fraction of larger aggregates, which was consistent with other reports where increased
aggregation, concomitant with increased SOC, have been observed (Paustian et al., 2000;
Six et al., 2000b). The result from this study also suggest that maintaining SOCS and
STNS with no-tillage and rotation practice in burley tobacco production is due to the
49

preserving of SOCS and STNS in macroaggregates (Tables 2.4 and 2.5), which was
consistent with Wei et al.(2013). This study further showed that changes in SOCS or
STNS as a result of agronomic practices were mainly influenced by the different
aggregate size proportions, rather than SOC or STN (Tables 2.4 and 2.5). Whole-soil
SOCS and STNS were found largely in large and small macroaggregates and silt-clay
particles, but only a small percentage of SOCS and STNS were contained in
microaggregates. The main reason for the small amount of microaggregate SOCS or
STNS was not due to low SOC or STN, but to the relatively small proportion of
microaggregates (Figure 2.3). However, this phenomenon can be explained by the
pretreatment procedure before wet-sieving. Cambardella and Elliott (1993a) compared
two re-wetting processes, including slaking and capillary wetting, and found that the
more disruptive slaking procedure can convert macroaggregates into microaggregates,
compared to capillary wetting. A field-moist (average 26 % gravimetric water content) or
capillary wetted soil sample was used in this study, thereby conserving macroaggregates.
There are numerous studies showed that a greater fertilizer N rate could increase SOM
and structure by increasing plant residue inputs in grain production systems (Graham et
al., 2002; Halvorson et al., 2002). However, fertilizer N application in burley tobacco
production did not affect SOCS and STNS in whole soil, probably because the entire
plant is taken during tobacco harvest, resulting in similar plant residue levels at the
different fertilizer N rates. Although N application had no effect on SOCS and STNS in
the whole soil, a significant rotation by fertilizer N interaction on > 53 µm aggregate
SOCS and STNS was observed and attributed mainly to the significant impact of that
same interaction on the proportion of aggregates in that size fraction.
50

In general, whole soil SOCS and STNS data also suggested that the traditional burley
tobacco production, tobacco monoculture with conventional tillage, was not sustainable.
Tobacco monoculture with conventional tillage can deplete macroaggregate SOCS and
TSNS and there was a corresponding increase in silt-clay particle SOCS and STNS.
2.5 Conclusion
No-tillage and rotation with sod in burley tobacco production resulted in significantly
greater whole soil SOCS and STNS and improved soil structure relative to conventional
tillage and tobacco monoculture, respectively. A majority of the burley tobacco grown in
Kentucky is still produced using intensive conventional tillage, often with limited
rotation. The results of this study suggested that these production practices not only
reduced water stable macroaggregate content, but also decreased macroaggregate SOC
and associated SOCS and STNS. While the degradation of water stable macroaggregates
may be slowed with no-tillage soil management, potentially rebuilding structure and
SOCS and STNS, the inclusion of other high biomass residue crops and sods in rotation
with burley tobacco may be necessary to maintain or enhance soil productivity and
quality. Although no-tillage management for tobacco might be difficult due to
compaction impacts on root development and limitations in equipment and herbicides,
one viable alternative is strip tillage. Rotating tobacco with grain crops or grass sod and
inclusion of a winter cereal cover crop has been gradually accepted by growers. Over
fertilization with N in tobacco production did not affect soil structure and SOCS and
STNS. However, there is a risk that excess N could cause groundwater pollution by
leaching. Production of burley tobacco with good agricultural practices, including proper
51

tillage, rotation and N management practices, could synergistically increase SOC and
STN, enhance soil structure, and promote soil quality.
52

Chapter 3 Part I: Laboratory or In Situ Resin-Core Methods to Estimate Net
Nitrogen Mineralization for Different Rotation and Tillage Practices
3.1.1 Introduction
Obtaining an accurate and realistic estimate of soil N mineralization in agriculture
settings using current techniques is challenging because N mineralization processes can
be affected by numerous dynamic, complex, and site-specific factors. These include
biotic factors (e.g. soil organic N fractions, soil fauna activity, soil microbial community
structure) and abiotic factors (e.g. soil temperature, moisture, aeration, field soil
structure) and their interactions (Nadelhoffer et al., 1991; Knoepp and Vose, 2007). Soil
N fertility would be managed more efficiently if the relative effect of crop sequences and
tillage management on net soil N mineralization could be reasonably estimated. Soil N
mineralization is mainly derived from biological decomposition of soil organic matter
(SOM) and the plant residues (Hart et al., 1994) , which are affected by tillage and crop
rotation management (Six et al., 1998; Wright and Hons, 2005a). Conservation tillage
(reduced or no-tillage) can increase the soil N pool as compared to traditional intensive
tillage; simultaneously increasing the potentially mineralizable N pool (Sainju et al.,
2009). Rotation could also affect the SOM (Kong et al., 2005). However, the quality of
crop residue can have different effects on soil N mineralization. Rotation with high C:N
ratio residue crops will result in soil N immobilization, while rotation with legume crop
species that have a low C:N ratio residue will promote soil N mineralization for the
following crop (Smith and Sharpley, 1990). This is one of the key principles supporting
adjustment of N fertilizer recommendations according to the preceding crop (Franzen,
53

2010). Therefore, understanding the relative effect of agronomic practices on soil N
mineralization would result in better N fertility management decisions.
Long-term aerobic biological incubation to predict N mineralization has been reported to
be an acceptable N availability index (Stanford, 1982; Bundy and Meisinger, 1994). It
has been used to validate other more rapid chemical or biological indices (Curtin and
McCallum, 2004; Griffin et al., 2007). However, numerous long-term incubation
methods have been proposed, depending on incubation environment and pretreatment.
Two general incubation environment categories have been used are well-controlled
laboratory incubations and in situ incubations (Khanna and Raison, 2013). Each might
provide an N mineralization value that could be extrapolated to the field application with
various levels of confidence (Hanselman et al., 2004). Most laboratory incubation
methods were based the procedure described by Stanford and Smith (1972), where soil
was incubated in the well-controlled conditions. Thus, the biggest concern for laboratory
methods is that these do not reflect the fluctuations of soil moisture and temperature
occurring in field. Some in situ incubation methods, using buried polyethylene bags or
covered-cylinder, can capture the field temperature variation, but fail to reflect moisture
and aeration change (Sierra, 1997). The in situ resin-core method , proposed by
DiStefano and Gholz (1986) and developed by Kolberg et al. (1997), was shown to cause
contained soil to most closely mimic field soil temperature, moisture, and aeration
fluctuations (Khanna and Raison, 2013) .
Soil sample handling and pretreatment can also affect soil N mineralization (Stanford,
1982). Most laboratory incubation methods utilize a pretreatment procedure where soil is
sieved and large pieces of plant residue are discarded to create homogenous samples
54

(Stanford and Smith, 1972; Hart et al., 1994). Some researchers argue that sieved soil
does not reflect field soil structure, especially for no-tillage fields (Rice et al., 1987),
therefore, they suggested the intact soil core for laboratory incubation. Furthermore,
Smith and Sharpley (1990) reported that previous crop residue could affect net soil N
mineralization. Some researchers cut crop residue into pieces, mixing these with soil to
retain residue during incubation (Honeycutt, 1999; Heumann et al., 2002). Given
concerns with different pretreatment methods for determination of soil N mineralization,
agricultural scientists have often appealed for standardization of the biological soil N
mineralization incubation procedure (Bremmer, 1965; Honeycutt et al., 2005). However,
a methods choice mostly depends on resource availability, the nature of the study and site
specific factors. In most cases, biological incubation methods are used to compare
agronomic practices; from which N management recommendations could be made.
However, as mentioned above, the soil pretreatment procedure can introduce error in the
estimate of agronomic practice effects on N mineralization due to poor simulation of the
“real-world” field conditions. Therefore, N management recommendations could be
somewhat risky if one neglects artifacts created by soil sample pretreatments.
As important sustainability strategies, conservation tillage and crop rotation will play
more and more important roles in future agriculture production (Tilman et al., 2002;
Hobbs et al., 2008b). Properly estimating soil N mineralization as a consequence of
agronomic practices would result in better N management. Therefore, the main objective
of the present work was to determine the relative effect of tillage and rotation practices
on soil net N mineralization using current common aerobic laboratory and in situ resin-
core incubation methods. The hypotheses were: (1) laboratory incubation method with
55

sieving pretreatment can overestimate soil net N mineralization in no-tillage soil,
compared to the in situ resin-core method; and (2) laboratory incubation with crop
residue exclusion could underestimate effects due to a previous crop leaving residues
with a low C:N ratio.
3.1.2 Materials and Methods
Study site and experimental design
This study was conducted at the University of Kentucky’s Spindletop Research Farm,
near Lexington, Kentucky, USA (38°07'36.8"N 84°29'26.4"W). The soil is a Bluegrass-
Maury silt loam (fine, mixed, active, mesic Typic Paleudalf), a deep, well-drained soil
formed in residuum of phosphatic limestone. Before this study site was established, the
baseline soil pHwater (1:1, w/v) was 6.3, with Mehlich III (Mehlich, 1984) extractable
phosphorus (85 mg kg-1), potassium (178 mg kg-1), calcium (1.8 g kg-1), magnesium (110
mg kg-1), and zinc (2.97 mg kg-1). The soil had 12 % sand, 68 % silt and 20 % clay. The
location is characterized by a wide variation in mean monthly air temperature from 0 °C
in January to 24 °C in July and August and a relatively uniform distribution in mean
monthly precipitation, with an annual average precipitation of 1160 mm. Figure 1 shows
the cumulative precipitation and mean air temperature at the experiment site for three in
situ incubation periods in 2012, including 22 May - 20 June, and 21 June -25 July, and 26
July – 25 September.
The experiment was laid out in a randomized complete blocks design with four
replications. The six tillage-rotation system treatments: i) continuous conventional tillage
tobacco (TTT-CT); ii) continuous no-tillage tobacco (TTT-NT); iii) 2-yr sod (Festuca
56

arundinacea Schreb.) and 1-yr conventional tillage tobacco (SST-CT); iv) 2-yr sod and
1-yr no-tillage tobacco (SST-NT), no-tillage corn ( Zea mays L.) - soybean (Glycine max
L.) - tobacco (CST-NT), and vi) no-tillage soybean-corn-tobacco (SCT-NT); were
randomly assigned plots (6.4 m wide by 24.4 m long). These production systems were
established in 2007. This laboratory and in situ resin-core soil N mineralization study was
begun in spring 2012 after tillage but before transplanting tobacco seedlings. In 2012,
every production system was in the last year of the second rotation cycle. There were two
tillage comparisons: “TTT-CT versus TTT-NT” and “SST-CT versus SST-NT.” There
was also a preceding crop comparison of “CST-NT versus SCT-NT”. Primary
conventional tillage consisted of moldboard plowing, with secondary tillage consisting of
disking (twice), followed by a rotary tillage operation before transplanting tobacco
seedlings. Other management was recommended by the University of Kentucky
Cooperative Extension Service (Seebold and Pearce, 2013).
57

Figure 3.1.1 Cumulative precipitation and mean air temperature of the three 2012 in situ
incubation periods: 22 May - 20 June (1), and 21 June -25 July (2), and 26 July – 25
September (3).
Laboratory incubation method
The long-term aerobic laboratory N mineralization incubation method was based on a
procedure described by Hart et al.(1994). Composite soil samples (20 cores per plot)
were collected from the 0 to 10 cm and 10 to 20 cm soil depth increments on 16 May
2012 after conventional tillage was done but before N fertilizer was applied and a
subsample was immediately removed to determine the baseline levels of soil NO3-N and
NH4-N. In the soil sample pretreatment of this method, field moist soil was manually
passed through a 4 mm sieve. Large pieces of organic material and rocks were removed.
Soil water content was determined gravimetrically by oven-drying a subsample at 105
°C. The remaining soil was stored at 4 °C until incubation. To start the incubation, 50 g
58

of soil was placed in duplicate plastic zip-lock bags. Soil moisture was adjusted to 60 %
water-filled pore space, which has proved to be the ideal soil moisture for aerobic
microbial processes in most soils (Linn and Doran, 1984). Soil moisture content was
regularly checked and adjusted as necessary. Soil was incubated at a constant temperature
of 25 °C. Periodically, 5 g of soil was removed and KCl was used to extract NO3-N and
NH4-N. To match the in situ incubation sampling schedule, soils were sub-sampled at 27,
62, and 128 days of incubation.
In situ resin-core incubation method
Net N mineralization in the 0 to 20 cm soil depth increment was measured by a modified
in situ resin-core procedure (Kolberg et al., 1997). Incubation cores were prepared by
driving and removing aluminum conduit (25 cm long with an inner diameter of 4.8 cm)
into the soil between tobacco rows before fertilizer N application. The bottom 2.5 cm of
soil was removed from each soil core and replaced with a nylon bag containing an
equivalent volume of ion-exchange resin beads. The entire assembly was returned to the
original hole with a rubber washer surrounding the tube to avoid preferential bypass flow
of water along the outside of the tube, which might bring inorganic N from outside the
tube close enough to contaminate the resin. The top of the soil core was exposed so as to
be subject to field moisture and gas exchange and temperature fluctuations. The resin bag
contained equal amounts of cation and anion exchangeable resin (Lanxess Sybron,
Birmingham, NJ). The design of the in situ soil resin core is shown in Fig. 3.1.2. Resin-
soil cores were allowed to incubate 60 days in field conditions; replacement resin bags
were needed for longer incubations (Wienhold et al., 2009). In a preliminary laboratory
study, the average inorganic N adsorption capacity N for a resin bag in resin-core tubes
59

was found to be over 99 % of the inorganic N in leachate, even at the highest rates of N
fertilizer (280 kg N ha-1) and water irrigation ( 5.9 mm day-1) conditions during a 30-
day period. Intact resin-core tubes were removed and processed and re-installed on 17
and 18 May 2012. Sampling dates were intended to occur at 29, 64, and 127 days of
incubation, which was comparable to the laboratory sampling schedule.
To account for suspected high variance in the field conditions, three tubes were used to
prepare a composite sample. Therefore, the total number of installed tubes in this study
was 216 (216 = 6(treatments) × 4 (replications) × 3 (sampling dates) × 3 (tubes for a
composite sample)). On each sampling day, a sample from each composite (three tubes)
was oven-dried at 105 °C to determine the gravimetric moisture content. A 10 g sub-
sample of field moist soil was immediately analyzed for NO3-N and NH4-N. Each
composite resin sample was carefully mixed and weighed. Resin samples from different
plots exhibited different moisture contents, thus to make result comparable, a subsample
equal to 20 g based on original product moisture content was packed into a new nylon
bag for NO3-N and NH4-N assays.
60

Figure 3.1.2 Cutaway diagram of soil resin core, in which surficial plant residue and
intact soil column (0-20.32 cm depth increment) and one mixed ion-exchange resin bag
are incubated. A transparent example of the nylon bag holding the ion-exchange resins is
shown. The bottom of the core was covered with nylon mesh (1mm opening) material.
Laboratory inorganic N analysis procedure
Each soil subsample was extracted with 25 mL 1M KCl for 1 hr. A 1 mL aliquot was
centrifuged at a speed of 3700 rpm for 27 min, equivalent to filtration through a 0.45 µm
filter based on a preliminary study. The centrifuged extracts were subjected to NO3-N and
NH4-N analysis. The NO3-N analysis was determined colorimetrically according to the
procedure described by Crutchfield and Grove (2011), using cadmium brush (Paratech,
Lexington, KY). NH4-N analysis was found colorimetrically subsequent to the phenol-
61

hypochlorite reaction (Weatherburn, 1967; Ngo et al., 1982). Both NO3-N and NH4-N
were determined in duplicate. The concentration of the two inorganic N forms in each
soil sample were given in mg N kg-1 oven-dried soil (105 ºC) by adjusting for soil sample
gravimetric water content.
The subsample resin bags were serially extracted by shaking in three 50 mL volumes of 1
M KCl for 15, 30, and 60 min, respectively. The three extracts were composited and
analyzed for both NO3-N and NH4-N in duplicate, using the same analytical methods
described previously for soil sample. The final adsorbed NO3-N and NH4-N
concentration was calculated from standard resin extraction recovery equations for NO3-
N and NH4-N (Equations. 1 and 2). These equations were developed in a previous resin
extraction study utilizing the standard extraction procedure described above.
NO3-N (absorbed by resin)=NO3-N(recovered from resin)*1.27+258.54 Eqn. 1
NH4-N (absorbed by resin)=NH4-N(recovered from resin)*1.12-45.42 Eqn. 2
Calculation
For the laboratory incubation method, soil net mineralized N was determined after
correction of initial and final soil inorganic N levels. For the in situ resin-core method,
net soil mineralization N equaled the sum of resin adsorbed inorganic N and soil
inorganic N, corrected for the initial soil inorganic N levels. In this study, the unit of soil
net N mineralization is expressed in mg N kg-1 oven-dried soil.
62

Statistical analysis
Data were analyzed with the General Linear Model (GLM) procedure in the SAS 9.3
computer package (SAS Institute Inc., Cary, NC). Duplicate measurements on composite
soil and resin samples were averaged for statistical analysis of treatments effects. The
analysis considered replicate effects to be random, and the effects of treatment to be
fixed. Treatment effects were considered significant when the probability of a greater F
statistic was less than or equal to 0.1. Means separation was done using the Tukey's HSD
(honest significant difference) test at an alpha level of 0.1.
3.1.3 Results
Tillage Effects on Soil Net N Mineralization
In the comparing of TTT-CT with TTT-NT in the laboratory incubation study (Fig.
3.1.3A ), no-tillage soil exhibited significantly higher soil mineralized N than
conventional tilled soil from the second sampling date onward, while in the in situ resin-
core incubation study (Fig. 3.1.3B) , there was no significantly different soil N
mineralization due to tillage at any sampling date. In comparing SST-CT to SST-NT,
laboratory and in situ resin-core incubation methods (Fig. 3.1.3C and 3.1.3D) exhibited
soil N mineralization trends similar to those for the TTT-CT versus TTT-NT comparison.
The coefficients of variance (CV) in the laboratory incubation were 16.1, 12.6, and 10.7
for sampling dates 1, 2, and 3, respectively, while the CV value for the in situ incubation
study were 40.5, 36.9 and 23.5 for sampling dates 1, 2, and 3, respectively.
63

Figure 3.1.3 Laboratory and in situ resin-core incubation results comparing tillage effects
on soil net N mineralization: (A) laboratory incubation results for TTT-CT and TTT-NT;
(B) in situ resin-core incubation results TTT-CT and TTT-NT; (C) laboratory incubation
results for SST-CT and SST-NT; and (D) in situ resin-core incubation for SST-CT and
SST-CT. Different letters for CT and NT soil net N mineralization within the same
incubation method and at the same sampling date indicate a significant difference at an
alpha level of 0.1 according to Tukey’s HSD means separation test.
64

Rotation Effects on Soil Net N Mineralization
In 2012, the previous crop was soybean in the CST-NT production system and corn in
SCT-NT production systems. The laboratory incubation method found no significant
difference between CST-NT and SCT-NT at any incubation date (Fig. 3.1.4A). However,
the in situ resin-core method found that CST-NT resulted in slightly higher N
mineralization than SCT-NT at the second sampling date, becoming significantly
different by the third sampling date (Fig. 3.1.4B)
Figure 3.1.4 Laboratory and in situ resin-core incubation results comparing previous
crop effects on soil net N mineralization: (A) laboratory incubation results for CST-NT
and SCT-NT; and (B) in situ resin-core incubation results for CST-NT and SCT-NT.
Different letters for CST and SCT soil net N mineralization within the same incubation
method and at the same sampling date indicate a significant difference at an alpha level
of 0.1 according to Tukey’s HSD means separation test.
65

3.1.4 Discussion
There have been many studies reporting different results when comparing soil net N
mineralization from laboratory and in situ incubation methods (Arnold et al., 2008; Luce
et al., 2011). Most of these studies found that there was uncertainty in extrapolating
laboratory results to the field application because laboratory biological incubation
methods are unable to fully account for the frequent fluctuations in temperature and
moisture that occur in the field (Sierra, 1997; Honeycutt, 1999). Data from the present
study suggested that the magnitude of soil net N mineralization in laboratory incubation
was higher than that found with in situ incubation. This phenomenon was found in other
studies (Wienhold, 2007). This reason could be that the aerobic laboratory incubation has
the optimal temperature and moisture condition, however, the cumulative precipitation
for each incubation period in 2012 for in situ incubation was less than the long-term
average (Fig. 3.1.1). The in situ resin-core incubation in this study exhibited higher CV
values than the laboratory method, which means more in situ mineralization cores are
required to obtain a desired level of precision at certain confidence level per experimental
unit (Kolberg et al., 1997). However, all biological incubation methods, including
laboratory and in situ methods, can only be considered as soil N available indices due to
soil disturbance associated with each method. Rather than pursuing the perfect
assessment of soil N availability using these methods, at a high cost, a proper estimate of
the relative effect of agronomic practices on soil net N mineralization would be sufficient
for evaluation of these practices on soil N fertility management.
Conservation tillage (reduced tillage or no-tillage) is considered an important tool to
restore degraded soil and enhance SOM sequestration and soil nutrient cycling (Lal,
66

1997). Planting land by conservation tillage is continuously increasing worldwide
(Holland, 2004; Horowitz et al., 2010). Conservation tillage management is commonly
reported to maintain higher SOM than conventional tillage because conservation tillage
can reduce SOC and STN turnover rates in large soil aggregates (Cambardella and Elliott,
1993a; Six et al., 2000a). Therefore, the mechanism by which conservation tillage
influences soil N mineralization remains importance to agriculture and the surrounding
environment. There have been numerous studies on the effects of tillage on soil net N
mineralization, and most of these laboratory incubation studies found that no tillage gave
higher soil net N mineralization than conventional tillage (Wienhold and Halvorson,
1999; Sainju et al., 2009). From this perspective, one should be able to reduce the N
fertilizer rate in no-tillage, relative to conventional tillage production systems. However,
no-tillage N fertilizer rate recommendations are usually similar to, even greater than
those for conventional tillage. Part of the reason could be that N fertilizer on no-tillage
soil surfaces is susceptible to N loss (Beyrouty et al., 1986). However, these present data
suggest that there are errors in estimating the relative effect of tillage on soil N
mineralization. The laboratory incubation method, which included a sieving pretreatment,
could overestimate the net soil N mineralization in no tillage relative to the in situ resin-
core method. This is precisely because no-tillage can preserve more SOM than
conventional tillage, and most of the soil organic C and N is preserved within aggregates
under natural field conditions (Six et al., 2004). The hierarchical structure of aggregates
makes the soil organic C and N less susceptible to soil microbial decomposition
processes (Tisdall and Oades, 1982). The soil sieving pretreatment in most laboratory
incubation methods exposes aggregate-protected SOM to soil microbial activity,
67

especially for no-tillage soil. Beare et al. (1994b) reported that macroaggregates
disruption increased the SOM mineralization in no-tilled soil but had little effect in
conventional tilled soil. The reason could be that macroaggregate-associated SOC and
STN concentrations in no-tilled soil are usually higher than those in tilled soil. Therefore,
preserving field soil structure would be a key concern for properly estimating the relative
effect of tillage on net soil N mineralization with biological incubation methods.
In crop rotation systems, N fertilizer recommendations are usually adjusted for the
preceding crop because different types and amounts of crop residue have different effects
on soil N mineralization, thereby influencing the available soil N supply to the following
crop (Fox and Piekielek, 1988; Soon et al., 2001). The quality of crop residue was often
characterized as its C:N ratio, can affect N transformations in agro-ecosystems.
Generally, high C:N ratio (e.g. wheat and corn) crop residue can increase N
immobilization, while low C:N ratio (e.g. alfalfa and soybean) crop residue can enhance
N mineralization (Sylvia et al., 2005). Therefore, including crop residue could potentially
affect soil net N mineralization. Smith and Sharpley (1990) previously reported that the
positive effects of crop residue type on N mineralization generally proceeded in the order
alfalfa > peanut > soybean > sorghum >wheat >corn. Unfortunately, crop residue is
typically discarded in soil sample pretreatment protocols in most laboratory incubation
methods (Stanford and Smith, 1972; Hart et al., 1994). These data further corroborated
the hypothesis that laboratory incubations excluding crop residue could underestimate the
rotation effect due to low C:N ratio prior crop residue. Discarding prior crop residue in
this laboratory method resulted in identical soil net N mineralization in both rotation
systems. Therefore, keeping the above- and belowground crop residue in sample would
68

be a key concern to accurately estimate the relative effect of the previous crop in
different crop rotation regimes on net soil N mineralization.
These results also demonstrated that incubation time can play an important role in
estimating the relative effects of tillage and rotation on soil net N mineralization. At the
first sampling date (27 and 29 incubation days for laboratory and in situ methods,
respectively), there was no difference between any treatment for either method. On the
second sampling date, the laboratory method started to show a difference due to tillage
effect; the in situ resin-core method started to show a difference due to rotation effect on
the third sampling date. Therefore, longer term incubation methods could better separate
the effect of management on soil net N mineralization. However, what is a sufficient
length of incubation? This might depend on the nature of the study. When estimating
potential soil N supply for the crop growth season, a season-long incubation period would
be relevant; if estimating the N dynamics and N cycling in agro-ecosystems, annual or
longer incubation periods would be recommended.
3.1.5 Conclusions
Biological incubation methods can provide different estimates of the relative effect of
agronomic practices on net soil N mineralization due to soil sample pretreatments. In
estimating the relative effect of tillage these data highlighted the importance of
maintaining the inherent soil structure. In estimating the relative effect of crop rotation, it
is imperative to include the prior crop residues in the incubation system. The incubation
time can also affect the measured influence of agronomic practices on soil net N
mineralization. Therefore, more studies are needed to determine suitable incubation
69

periods that separate the effects of different practices on soil net N mineralization.
Clearly, the results of studies on N mineralization can be impacted significantly by
choices made during sample collection, preparation, and incubation of soils. The
direction and magnitude of these impacts will not be the same for all soil management
scenarios, so investigators must carefully consider the potential implications of their
experimental methods with due regard to the goals and objectives of the study.
70

Chapter 3 Part II: Influence of Past and Current N Fertilizer Application on In Situ
Net Soil N Mineralization
3.2.1 Introduction
When fertilizer N synthetized by the Haber-Bosch process began to be utilized in
agricultural production in the early 20th century (Erisman et al., 2008), the cycling of N in
agro-ecosystems was dramatically modified. While the contribution of fertilizer N to soil
organic N in agricultural soils is still under debate (Mulvaney et al., 2009; Powlson et al.,
2010), one of central points in this argument is whether fertilizer N application affects
indigenous N mineralization. In the current drive to improve N use efficiency in
production, while reducing undesirable environment impacts, the need to understand the
effect of fertilizer N on indigenous N mineralization has become increasingly important.
To address this question, two dimensions in N fertilizer application management should
be clarified. One is the effect of previous fertilizer N (PN) on the soil N mineralization
rate, which can provide insight into how the mineralizable N pool can be shaped by
previous fertilizer N management. The other dimension is the effect of current or “in-
season” fertilizer N on soil N mineralization, which can unveil the mechanism behind the
priming effect/added nitrogen interaction (ANI) effect on indigenous N mineralization
(Jenkinson et al., 1985). Most previous studies on this topic have focused on the effect of
previous N fertility management on soil N mineralization because samples were taken
either in spring just prior to crop growth, or in the fall after the growth season. Few in situ
studies have considered both past and present N fertilizer applications.
71

Previous research focusing on the effect of PN on soil N mineralization found mixed
results, regardless of the in situ or laboratory incubation method. Several studies found a
positive correlation between PN amounts and soil N mineralization in agricultural
production systems (El-Haris et al., 1983a; Singh and Singh, 1994b; Rasmussen et al.,
1998; Kolberg et al., 1999; Kanchikerimath and Singh, 2001; Graham et al., 2002; Jordan
et al., 2004). Other studies noted no effect of PN on soil N mineralization (Franzluebbers
et al., 1994a; Franzluebbers et al., 1994b). Negative PN-mineralization interactions have
also been documented (Wienhold and Halvorson, 1999; Carpenter-Boggs et al., 2000).
Although results have been mixed, the theory/mechanism that explains these effects is
rather uniform. Given a negative effect, lower soil N mineralization at higher PN rates
might be due to inorganic N immobilization with greater residue decomposition produced
by higher biomass production at higher PN rates (Wienhold and Halvorson, 1999).
However, retention of N in root biomass, plant residue, and the active soil organic pool
can still be released by mineralization over time, which can explain the positive effect of
high PN on soil N mineralization (El-Haris et al., 1983a; Yan et al., 2007). Given this, an
investigation of the status of the SOM pool seems critically important when the effect of
PN on soil N mineralization is evaluated.
There have been few studies that addressed the effect of current N fertilizer application
(CN) on soil N mineralization. The main reason could be the limited number of technical
approaches. Laboratory incubation methods based on the procedure of Stanford and
Smith (1972) are a classical way to estimate soil N mineralization. In this method,
however, leaching of inorganic N with a CaCl2 solution is frequently used. This might
cause N fertilizer additions to have a shorter retention period during incubation than
72

would occur under field conditions. Isotope tracers might seem to be a direct way to test
how fertilizer N interacts with indigenous N. However, 15N labelled fertilizers might have
an “apparent” effect, caused by pool substitution or by isotope displacement reactions
(Jenkinson et al., 1985). The biggest potential disadvantage for laboratory incubation and
isotope methods is that these do not reflect field/ambient temperature and moisture
conditions (Carpenter-Boggs et al., 2000). However, these important environment factors
affect microbial transformation of organic N (Sierra, 1997). Therefore, in order to make
the result relevant to the field, an in situ incubation method is desirable.
There are three major in situ incubation methods used by researchers to estimate soil N
mineralization, including buried bags, covered cylinders, and resin-trap soil cores.
Among these, the resin-trap soil core method causes contained soil to experience
temperature, moisture, and aeration fluctuations similar to those in the field (Khanna and
Raison, 2013). Another advantage to the resin-trap method is the method’s utility for in-
season N fertilizer application studies. The core is open at top and bottom, and inorganic
N from mineralization and/or fertilizer N addition leached from the soil column during
rainfall or irrigation is captured by the resin trap at the bottom (Hanselman et al., 2004).
This decreases artificial stimulation of denitrification, especially when the added fertilizer
N rate is high. Therefore, in this study, an in-situ resin-trap soil core method was used to
test the effect of current fertilizer N on soil N mineralization under field conditions.
Temperature and moisture are primary environmental drivers of SOM decomposition
(Kirschbaum, 1995; Gabriel and Kellman, 2011), thus substantially affecting microbial-
soil N interactions. Unlike the well-controlled conditions of laboratory incubation, in situ
N mineralization studies can be hard to explain without consideration of these drivers.
73

Generally, within a certain range in values, moisture and temperature have a positive
relationship with soil N mineralization. These two factors can exhibit a positive
interaction on N mineralization (Sierra et al., 2015). In this case, N mineralization is more
responsive to one factor when the level of the other factor was more favorable.
Additionally, except for direct effects, temperature and moisture could have indirect
effects on soil aeration, which supports aerobic microbial activity (Sierra, 1997). Previous
in situ incubation N mineralization studies found a high correlation between climate
factors and N mineralization rate. Singh and Singh (1994a) reported that as much as 80 %
of the variability in N mineralization rate was explained by the soil moisture content.
Kolberg et al. (1997) reported that precipitation, mean air temperature and the interaction
between them, gave the best prediction of the daily N mineralization rate.
The present study tests the impacts of N fertilizer rate on in situ soil net N mineralization
during the maize growing season, with separation of PN and CN fertilizer effects.
Precipitation and temperature data were taken so as to explain field N mineralization
conditions. Specifically, the objectives of this study were to: i) measure the influence of
past N fertilizer rate on net soil N mineralization; ii) measure the influence of in-season N
fertilizer rate on net soil N mineralization; and iii) relate precipitation, air temperature,
and soil moisture content to the average daily net soil N mineralization rate.
3.2.2 Materials and Methods
Field Sites and Climatic Information
This study was conducted at the University of Kentucky’s Spindletop Research Farm
near Lexington, Kentucky, USA (38°07'18.9"N 84°29'10.6"W). This site has been in a
74

monoculture corn N rate by tillage study since 1970 (Blevins et al., 1983). The soil is a
Bluegrass-Maury silt loam (fine, mixed, active, mesic Typic Paleudalf) with a 2 to 4
percent slope. This region is characterized by wide variation in mean monthly air
temperature, from 0 °C in January to 24 °C in July and August, but a relatively uniform
distribution in mean monthly precipitation, with an annual average rainfall of 1160 mm.
Experiment Design
Two factors are included in the existing field experiment design: i) N fertilizer rate (0, 84,
168 and 336 kg N ha-1); and ii) tillage (moldboard plow and no-tillage). There were four
randomized blocks, with the two tillage treatments randomly assigned to one of two strips
within each block. The N fertilizer rates were randomly assigned to one of four strips
within each block, lying perpendicular to/across the two tillage treatment strips. For this
in situ incubation N mineralization study, no-tillage soils at three of the four (0, 84 and
336 kg N ha-1) long-term N rates (PN) were investigated. Three current fertilizer N (CN)
rates (0, 84 and 336 kg N ha-1) were introduced into each PN rate plot via the incubation
tubes. For example, incubation tubes in the NT-0 kg N ha-1 plot had treatments of 0, 84
and 336 kg N ha-1.
Field Incubation Procedure
Net N mineralization in the 0 to 20 cm soil depth increment was measured by a modified
in situ resin-core procedure (Kolberg et al., 1997). Incubation cores were prepared by
driving/removing aluminum conduit (25.4 cm long with an inner diameter of 4.8 cm)
into/from non-trafficked soil between corn rows before fertilizer N application. To
remove intact soil and avoid bypass contamination a hydraulic soil sampler (Giddings 6S
75
RPS) was gently operated to remove soil cores with little disturbance to the contained and
surrounding soil. When the entire core assembly was returned to the original hole, a
rubber washer and some soil was used to surround the tube to avoid preferential bypass
flow alongside the tube wall. The original plant residue on soil surface was kept in the
tube to account for the residue contribution to N mineralization. The entire assembly was
returned to the original hole. The top of the soil core was exposed (except as noted
below) to facilitate gas exchange and field moisture and temperature fluctuations,
allowing inorganic N to leach from contained soil onto the resin as driven by rainfall.
The bottom 2.5 cm of soil was removed from each core and replaced with a nylon bag
filled with resin beads. The bottom was then wrapped in 1 mm nylon mesh material to
retain the bag. The resin-core incubation tubes are shown in Figure 3.2.1. The resin bag
contained equal amounts (total of exactly 35 g, based on original product moisture
content) of cation and anion exchange resin (Lanxess Sybron, Birmingham, NJ).
In a preliminary study, the resin was evaluated for retention of adsorbed inorganic N with
intensive water flow, and less than 1 % of total inorganic N was observed in the leachate.
For the CN treatments, a 5 mL aliquot of an NH4NO3 solution was evenly placed onto the
tube contained soil surface to give rates of 0, 84, and 336 kg N ha-1 according to the
tube’s inner soil surface area. To avoid contamination during field N fertilizer
application, the tubes were covered during that activity. The tubes were all installed just
prior to field N fertilizer application to best mimic the effect of field N fertilizer
application on indigenous N mineralization. Given limitations in resin bag durability
under field conditions, resin bags needed to be replaced at less than 60 day intervals
(Wienhold et al., 2009).
76

Figure 3.2.1 Cutaway diagram of soil resin-core, in which surficial plant residue and
intact soil (0 to 20.32 cm depth increment) and one mixed ion exchange resin bag (35 g)
are incubated. A transparent example of the nylon bag holding the ion exchange resins is
shown. The bottom of the core was covered with nylon mesh (1 mm opening) material.
Expecting considerable field variance, one observation was a composite of three soil
resin-cores. All soil resin-core tubes were randomly assigned. Sampling times were
intended to be one and two months after installation and at crop harvest. However, actual
sampling dates were adjusted due to weather and soil moisture conditions (Table 3.2.1).
Composite soil samples (20 cores plot-1, 0 to 20 cm depth) were taken at incubation
initiation to obtain baseline levels of soil NO3-N and NH4-N. At each sampling time,
resin bags and soil cores were removed, immediately transported to the laboratory, mixed
77

thoroughly, and then frozen until analysis. Dry and wet atmospheric deposition of N was
assumed to be small and the same for all treatments, an average 4.7 kg-1 ha-1 yr-1 (National
Atmospheric Deposition Program, http://nadp.sws.uiuc.edu/data/ntn/ ).
Table 3.2.1 In situ incubation sampling dates in 2013.
Operation Date Day of Year Initiation date 22-Jun-2013 172
Sampling Day 1 26-Jul-2013 206 Sampling Day 2 6-Sep-2013 248 Sampling Day 3 3-Oct-2013 275
Laboratory Analyses
Soil Sample Analysis
Gravimetric moisture content of each composite soil sample was determined by weighing
and then oven drying (105 °C) a subsample. A 10 g field moist subsample was extracted
with 25 mL M KCl for 1 hr. A 1 mL aliquot was centrifuged at a speed of 3700 rpm for
27 min, which is equivalent to filtration through a 0.45 µm filter, based on a preliminary
study. The extracts were subjected to NO3-N and NH4-N analysis. The NO3-N was
determined colorimetrically according to (Crutchfield and Grove, 2011), using a
cadmium brush (Paratech, Lexington, KY). The NH4-N was found colorimetrically
subsequent to the phenol-hypochlorite reaction (Weatherburn, 1967; Ngo et al., 1982).
Both NO3-N and NH4-N were determined in duplicate. The concentrations of the two
inorganic N forms were given in mg N kg-1 oven-dried soil (105 °C) by adjusting for
sample gravimetric water content.
78

Resin Extraction Procedure
Each composite resin sample was mixed and weighed. A subsample equal to 20 g, based
on original product moisture content, was packed into a new nylon bag. The subsample
resin bags were serially extracted by shaking bags in three 50 mL volumes of 1M KCl for
15, 30, and 60 min, respectively. The three extracts were composited and analyzed for
NO3-N and NH4-N, in duplicate, using the same analytical methods described previously.
The final adsorbed NO3-N and NH4-N concentration was calculated from standard resin
extraction/recovery equations for NO3-N and NH4-N (Equations 1 and 2, respectively).
These equations were developed in a previous resin extraction study utilizing the standard
extraction procedure described above.
NO3-N (adsorbed by resin)=NO3-N(recovered from resin)*1.27+258.54 Eqn. 1
NH4-N (adsorbed by resin)=NH4-N(recovered from resin)*1.12-45.42 Eqn. 2
Net Soil N Mineralization=Inorganic N (ti)-Inorganic N(t0)-Fertilizer N Eqn. 3
Where ti: sampling date; t0: the initial sampling date.
Calculation
Net soil mineralized N at each sampling date was determined by using the combined
amounts of NO3-N and NH4-N in both soil and resin analysis after correction for initial
soil inorganic N levels and synthetic N fertilizer input (Eqn. 3). The inorganic N
concentration of the soil samples (oven-dry weight basis) and the inorganic N
79

concentration in resin samples were converted into µg N tube-1 for each tube. Net soil
mineralized N at each sampling date equaled the sum of the total inorganic N from soil
and resin at each sampling date less the sum of the initial soil inorganic N and synthetic
N fertilizer input. The net soil N mineralization was expressed as mg N kg-1 dry soil-1.
The average daily net soil N mineralization rate in each incubation period was calculated
by dividing total net soil mineralized N by the number of days in that period.
Bulk SOC and STN were determined with a Elementar Vario MAX CNS Analyzer
(Elementar Americas Inc., Mount Laurel, NJ). Prior to chemical analysis, visible shoot
and root residue was hand removed with a forceps and the subsamples were then ground
in a mortar and pestle.
Statistical Analysis
Data were statistically analyzed using the General Linear Model (GLM) procedure of the
SAS 9.3 computer package (SAS Institute Inc., Cary, NC). Duplicate analyses for the
composite soil and resin samples were averaged for statistical analysis of treatment
effects. Treatment effects were considered significant at the 95 % level of confidence.
Means separation was done using the Tukey's HSD (honest significant difference) test at
an alpha level of 0.05.
The regression analyses related precipitation (cumulative amount during each incubation
period), temperature (mean air temperature during each incubation period), and soil
moisture (gravimetric moisture measured in the soil cores during each incubation period)
on average daily net soil N mineralization. Analyses were performed using different
80

combinations of the independent variables, comparing their predictive ability as
measured by the corresponding correlation coefficient (R2).
3.2.3 Results
Effect of Long-Term Fertilizer Applications on SOC and STN
SOC and STN in the surface soil were significantly affected by 43 years under the three
different N fertilizer rates (Table 3.2.2). The 336 kg PN ha-1 rate exhibited significantly
higher SOC, STN, C/N ratio and a significantly lower pH than 0 and 84 kg PN ha-1, while
there was no difference between 0 and 84 kg PN ha-1 in these variates. On the initial day
of field incubation there was no difference in inorganic N due to PN rate.
Table 3.2.2 Selected soil properties (0-20 cm depth) at initiation of the in situ incubation
study.
Past N fertilizer rate pH† C/N Organic C Total N Mineral-N kg PN ha-1
-----g kg-1----- mg kg-1
0 6.57A‡ 8.83B 13.71B 1.55B 4.11A 84 6.88A 9.06B 13.98B 1.54B 4.63A 336 6.09B 9.38A 17.13A 1.83A 4.78A
†pH = soil pHwater (1:1, w/v). ‡Values followed by the same letter, within a column, are not significantly different at the 95 % level of confidence according to Tukey’s HSD means separation test. Effect of Past and Current N Rate and Sampling Date on Net Soil N Mineralization
Net soil N mineralization (NSNM) was significantly (Pr > F ≤ 0.05) influenced by CN
rate, PN rate, the CN by PN interaction, sampling date, and the CN by PN by sampling
date interaction (Table 3.2.3).
81

The CN effect on NSNM, at any one PN rate, was not different between of 0 and 84 kg
CN ha-1. The NSNM were all numerically increased, within each PN rate, when the CN
rate increased to 336 kg CN ha-1. However, at 336 kg PN ha-1 and 336 kg CN ha-1 NSNM
increased significantly Day 206 and Day 248, but declined on Day 275 (Fig. 3.2.2).
Table 3.2.3 Analysis of variance for the effects of past (PN) and current (CN) fertilizer
N rate, and sampling date on net soil mineralized N (NSNM).
Source of Variation Pr > F Past N fertilizer rate (PN) < 0.0001 Current N fertilizer rate (CN) < 0.0001 PN*CN 0.0031 Sampling Date (SD) 0.0021 SD*PN 0.4068 SD*CN 0.1683 SD*PN*CN 0.0184 Coefficient of Variance 27.5 %
The NSNM was not different between 0 and 84 kg PN ha-1 at any CN rate and on any
sampling date. On Days 206 and 248, at 336 kg CN ha-1, the 336 kg PN ha-1 rate
exhibited significantly higher NSNM than 0 or 84 kg PN ha-1, but this was not observed
on Day 275, because NSNM at 336 kg PN ha-1 and 336 kg CN ha-1 declined 29 %.
Effect of Past and Current N Rates and Incubation Period on Average Daily NSNM
Average daily NSNM was significantly influenced by PN rate, CN rate and the
incubation period. The three-way interaction was also significant (Tables 3.2.4 and
3.2.5). Only at 84 and 336 kg PN ha-1, during the first incubation period, did 336 kg CN
ha-1 cause a significantly higher average daily NSNM than 0 and 84 kg CN ha-1. Only at
336 kg CN ha-1, during the first incubation period, did 336 kg PN ha-1 give a significantly
82

higher average daily NSNM than 0 and 84 kg PN ha-1. Except for 0 kg PN ha-1 at both 0
and 84 kg CN ha-1, the average daily NSNM in the first incubation period (IP) was
significantly higher than that observed in the third IP. The average daily NSNM, at each
PN rate, also exhibited a declining trend with IP: IP1 (173-206) > IP2 (206-248) > IP3
(248-275).
83

Figure 3.2.2 The effect of past (PN) and current (CN) fertilizer N rate on net soil mineralized N (NSNM) at three sampling dates in
2013: A) Julian day 206 (July 26); B) Julian day 248 (September 9); C) Julian day 275 (October 3). The NSNM values for different
CN rates, within the same PN rate, followed by the same lowercase letter are not significantly different at the 95 % level of confidence
according to Tukey’s HSD means separation test. The NSNM values for different PN rates, within the same CN rate, followed by the
same uppercase letter are not significantly different at the 95 % level of confidence according to Tukey’s HSD means separation test.
84

Table 3.2.4 Analysis of variance for the effects of past (PN) and current (CN) fertilizer
N rate and incubation period (IP) on average daily net soil N mineralization (NSNM).
Source of Variation Pr > F Past N fertilizer rate (PN) < 0.0001 Current N fertilizer rate (CN) < 0.0001 PN*CN 0.249 Incubation Period (IP) < 0.0001 IP*PN < 0.0001 IP*CN < 0.0001 IP*PN*CN < 0.0001 Coefficient of Variance 64.3%
Effect of Precipitation, Temperature and Soil Water Content on Average Daily Net
Soil N Mineralization
Regression of NSNM against precipitation and temperature, for each PN by CN
combination, found that NSNM was driven more strongly by precipitation and
temperature than soil water content (SWC) at each sampling date (Table 3.2.6). Overall
PN by CN combinations, precipitation was the largest factor influencing NSNM values at
this study site, alone accounting for 56 % of NSNM variation. Temperature was the
second most important independent variable, accounting for 40 % of NSNM variation.
The SWC accounted for 8 % of NSNM variation. Cumulative precipitation and mean air
temperature decreased as incubation progressed. Cumulative precipitation, by IP, was
309, 104 and 55 mm for IP1, IP2 and IP3, respectively. Mean air temperature, by IP, was
23.0, 21.7 and 19.2 C for IP1, IP2 and IP3, respectively.
85

Table 3.2.5 Average daily net soil N mineralization (NSNM) values for the three-way interaction of past (PN) and current (CN)
fertilizer N rate and incubation period (IP).
0 kg PN ha-1 PN Ave.*
84 kg PN ha-1 PN Ave.
336 kg PN ha-1 PN Ave. kg CN ha-1 0† 84 336 0 84 336 0 84 336
IP (Julian Day) -------------------------------------------------------NSNM (mg N kg soil-1 day-1)-------------------------------------------------------
173-206 0.94A‡a 0.86Aa§ 1.56Ba1¶ 1.12 1.42Ab1 1.34Ab1 2.69Ba1 1.82 2.03Ab1 1.82Ab1 4.98Aa1 2.94
206-248 0.21Aa 0.44Aa -0.03Aa3 0.21 0.21Aa2 0.27Aa 0.05Aa2 0.17 0.25Aa2 0.46Aa 0.04Aa 0.25
248-275 -0.03Aa -0.19Aa 0.31Aa2 0.03 0.04Aa3 -0.19Aa2 0.03Aa3 -0.04 -0.01Aa3 -0.10Aa2 -0.51Aa2 -0.20 *The mean daily NSNM for a given PN by IP combination. ‡Different NSNM values due to PN rate, within the same CN rate and IP, followed by the same uppercase letter are not significantly different at the 95 % level of confidence according to Tukey’s HSD means separation test. §Different NSNM values due to CN rate, within the same PN rate and IP, followed by same lowercase letter are not significantly different at the 95 % level of confidence according to Tukey’s HSD means separation test. ¶Different NSNM values due to IP, within the same PN rate and the same CN rate, followed by same superscript number are not significantly different at the 95 % level of confidence according to Tukey’s HSD means separation test.
86

Table 3.2.6 Correlation coefficients (R2) from regression of average daily net soil N mineralization (NSNM) against precipitation, air
temperature and soil water content for the three incubation periods; at each past (PN) and current (CN) fertilizer N rate combination.
-------0 kg PN ha-1------- ------84 kg PN ha-1------ -----336 kg PN ha-1----- Overall
Current N Rate (kg CN ha-1) 0 84 336 0 84 336 0 84 336 Independent Variables In Model: -------------------------------------------------------R2------------------------------------------------------- Precipitation (Precip)† 0.81** 0.68** 0.85** 0.82** 0.87** 0.79** 0.87** 0.70** 0.95** 0.56** Temperature (Temp) 0.67** 0.84** 0.37* 0.57** 0.75** 0.49* 0.61** 0.60** 0.65** 0.40** Soil Water Content (SWC) 0.39* 0.29 0.12 0.27 0.51** 0.40* 0.08 0.00 0.03 0.08** Precip,Temp 0.81** 0.85** 0.94** 0.82** 0.88** 0.82** 0.87** 0.72** 0.96** 0.56** Precip,SWC 0.86** 0.75** 0.82** 0.82** 0.88** 0.81** 0.89** 0.75** 0.96** 0.56** Temp,SWC 0.70** 0.85** 0.37 0.57* 0.75** 0.56* 0.75** 0.65* 0.69** 0.40** Precip,Temp, Precip* Temp 0.81** 0.85** 0.94** 0.82** 0.88** 0.82** 0.87** 0.72** 0.96** 0.56** Precip,SWC, Precip*SWC 0.89** 0.89** 0.82** 0.83** 0.88** 0.85** 0.91** 0.75** 0.96** 0.56** Temp,SWC,Temp*SWC 0.70** 0.91** 0.47 0.62* 0.85** 0.73* 0.75** 0.65* 0.69* 0.42** Precip,Temp,SWC 0.78** 0.85** 0.94** 0.82** 0.88** 0.84** 0.89** 0.76** 0.96** 0.56** Precip,Temp,SWC, Precip*Temp*SWC 0.86** 0.94** 0.95** 0.83** 0.90** 0.86** 0.91** 0.76* 0.96** 0.56** † Precip = precipitation received during each incubation period; Temp = mean air temperature during each incubation period; SWC = soil water content measured at the end of each incubation period. *,**, Significant at the 95 and 99 % levels of confidence, respectively.
87

3.2.4 Discussion
Effect of Long Term Fertilizer N Application on SOC and STN
Soil N mineralization has been reported to be highly correlated to SOC and STN
(Schomberg et al., 2009). Therefore, quantification of SOC and STN pools to predict
NSNM is important. The 336 kg PN ha-1 rate had significantly higher SOC and STN,
consistent with other long term N fertilizer studies (El-Haris et al., 1983a; Rasmussen et
al., 1998; Graham et al., 2002). The primary reason for a higher SOM pool with greater
annual fertilizer N use is likely higher crop production induced by higher fertilizer input,
thereby increasing return of shoot and root residues, with a lower C:N ratio, although Six
et al. (2002) suggested other possible stabilization mechanisms. While 84 kg PN ha-1 is
insufficient for maize production on this soil, this PN rate usually caused greater grain
yield and N removal than 0 kg PN ha-1 (data not shown). Therefore, only slightly higher
plant residue and N return might result from the higher grain N removal at 84 kg PN ha-1,
resulting in SOC and STN levels similar to those found at 0 kg PN ha-1.
Net soil N mineralization could be influenced by pH (Curtin et al., 1998) and substrate
C:N ratio (Janssen, 1996). In this study, soil pH was lower at 336 kg PN ha-1 that at 0 or
84 kg PN ha-1, due to acidification resulting from the higher N input. However,
agricultural limestone was regularly used to adjust pH in this study (Grove, personal
communication), and the pH difference between PN rates was insufficiently large to
cause NSNM differences (Dancer et al., 1973). The difference in soil C:N ratio between
the three PN rates was relatively narrow as well. This result makes sense because after 44
years of no-till monoculture maize management, the metabolizing soil microbial
88

population would be essentially similar. Therefore, differences in NSNM among the
different PN rates might not be attributable to soil pH or soil C:N ratio in this study.
Effect of PN and CN Rate, and Sampling Date, on NSNM
The effect of PN rate on NSNM reflected SOC and STN pools very well. At any CN rate
and sampling date there was no difference in NSNM between 0 and 84 kg PN ha-1, which
coincides with the similarly sized SOC and STN pools for these two PN rates. The
NSNM at 336 kg PN ha-1 was significantly higher on Days 248 and 275 than that found
at the two lower PN rates. This result indicates that increased SOM due to long term N
fertilizer application could play a role in in situ NSNM. These findings might explain
why there have been mixed results regarding the effect of PN rate on NSNM, because
there also have been mixed results regarding whether fertilizer N can result in higher
SOM than the unfertilized controls (Yan et al., 2007; Liu et al., 2013; Brown et al.,
2014). Furthermore, in contrast to fertilizer N application, most studies have reported that
manure or straw amendment can increase SOM (Sommerfeldt et al., 1988; Haynes and
Naidu, 1998; Yan et al., 2007). Therefore, unsurprisingly, most studies have shown that
these amendments can increase NSNM (Singh and Singh, 1994a; Ma et al., 1999; Jordan
et al., 2004; Zhang et al., 2009). Therefore, a hypothesis that impacts of PN on NSNM
will depend on whether PN significantly changes SOM.
From this perspective, a better understanding of the diverse results regarding the effect of
historical N rate on soil N mineralization (Franzluebbers et al., 1994a; Wienhold and
Halvorson, 1999; Carpenter-Boggs et al., 2000). Studies with a single N rate but different
crop management systems may give different NSNM responses (Kolberg et al., 1997).
89

The influence of CN (in-season) rates on NSNM, is usually referred to as the “priming
effect.” Jenkinson et al.(1985) reported that fertilizer N can promote plant growth, and
also increase the volume of soil explored by roots, resulting in the priming effect or
“added nitrogen interaction.” In this study, plant roots were excluded by herbicide
application and discarding tubes with weeds. Therefore, in this study, the CN effect was
considered an interaction between inorganic N and soil microorganisms. The in situ study
found that the CN or “priming” effect on NSNM had two requirements. First, the priming
effect needs sufficient SOM – CN application significantly affected NSNM only at 336
kg PN ha-1, where the SOM was significantly greater than that in the lower PN rate
treatments. This result is consistent with an isotopic study on SOM decomposition (Chen
et al., 2014), where sucrose or maize straw promoted additional CO2 respiration.
Second, the priming effect needs sufficient inorganic N input because increasing CN
from 0 to 84 kg CN ha-1 in this study did not significantly increase NSNM. This result is
also consistent with Chen et al. (2014), who found that when inorganic N was added with
sucrose or maize straw, exogenous organic C and inorganic N exerted a synergistic effect
on SOM decomposition. (Woods et al., 1987), in an isotope study, also suggested that the
“priming effect” on net N mineralization resulted from greater N fertilization when
mineral N concentrations were low enough to limit soil microbial activity. These results
suggest that both PN and CN need to be considered when evaluating the effect of
fertilizer N on indigenous N mineralization in an agroecosystem.
90

Effect of PN and CN Rate and IP on Average Daily NSNM
The effect of PN and CN on average daily NSNM provided more detailed information for
each IP than did total NSNM at each sampling date. During IP1, only the combination of
336 kg CN ha-1 and 336 kg PN ha-1 gave a significantly higher average daily NSNM than
those at 0 and 84 kg PN ha-1. This result confirmed that a significant priming effect on
soil N mineralization required both higher CN and the greater SOM resulting from higher
PN. In contrast to total NSNM on SD 206 and 248, where 336 kg CN ha-1 gave higher
NSNM than 0 or 84 kg CN ha-1 only at 336 kg PN ha-1, the 336 kg CN ha-1 rate gave a
significantly higher average daily NSNM than 0 and 84 kg CN ha-1, at both 84 and 336
kg PN ha-1. This result demonstrated that the 84 kg PN ha-1 soil likely had more readily
labile organic N or higher SOM quality than the 0 kg PN ha-1 soil, even though total SOC
and TSN, and total NSNM were similar (Doran and Parkin, 1994).
Generally, average daily NSNM in IP1 was significantly greater than that observed in the
following incubation periods. The average mean NSNM for each incubation period, at
each PN rate, showed the same trend: IP1 > IP2 > IP3. This trend was consistent with that
reported by and El-Haris et al. (1983a) and Zhang et al. (2009). This change in N
mineralization rate can be attributed to the greater amount of readily mineralizable N
during the initial incubation period. In the Zhang et al. (2009) study, potentially
mineralizable N in the annually N fertilized treatment was significantly higher at the rice
transplanting stage than at later stages. In the El-Haris et al. (1983) study, the soil N
mineralization rate was higher in the first 4 weeks for soils receiving higher historical
fertilizer N than soils where lower historical fertilizer N rates were used. However, after
that, soil N mineralization rates were generally unrelated to different historical fertilizer
91

N rates, and they argued that fertilizer N application contributed greatly to the readily
available N pool, with little impact on the intermediately available N pool. Another
mechanism that might explain the different soil N mineralization rates would be the
different environmental conditions occurring during each IP.
Effect of Precipitation, Temperature and Soil Water Content on NSNM
Soil N mineralization can be affected by soil moisture content and temperature
(Kirschbaum, 1995; Sierra, 1997). Compared to well-controlled laboratory conditions,
estimating soil N mineralization with in situ incubation methods might be difficult
without consideration of weather data. Regression modeling in this study found that most
of the variation in NSNM was explained by precipitation and temperature, consistent
with (Kolberg et al., 1997). Cumulative precipitation and mean air temperature gradually
decreased from IP1 to IP3. Therefore, weather data also helped explain the different
patterns in average daily NSNM over the three IPs.
Compared to precipitation and mean air temperature, SWC measured at the end of each
IP accounted for less of the NSNM variation, and can be highly affected by rain events
just before each sampling date. However, including SWC in the regression models
increased predictive capacity. Moreover, the SWC data might help explain the more
negative NSNM at the combination of 336 kg PN ha-1 and 336 kg CN ha-1 on Day 275.
The SWC on Day 275 at the plots annually receiving 336 kg PN ha-1 was significantly
higher than that found in other plots (data not shown). This higher SWC might be due to
shading from the greater biomass produced at this greatest PN rate, as well as greater soil
92

water holding capacity caused by higher SOM. Therefore, these incubation tubes likely
had higher denitrification potential due to higher SWC and high inorganic N levels.
3.2.5 Conclusion
Understanding how fertilizer N application affects indigenous N mineralization will
improve agro-ecosystem N fertilizer management, resulting in improved soil productivity
with reduced adverse environmental impacts. However, the effects of prior and present N
fertilizer application on NSNM require separation so as to achieve clarity. Whether PN
affects NSNM depends on whether the SOM pool has been modified by long term N
application. The priming effect of CN on NSNM depends on both the CN rate and
whether the soil has enough SOM to support/promote microbial decomposition. Further
studies on the effects of N fertilizer on indigenous N mineralization should go beyond
merely evaluating PN and CN rate effects. These future studies should also pay more
attention to the total and readily labile SOM pools induced by long term inorganic or
organic N applications, as well as environmental factors influencing the priming effect.
93

Chapter 3 Part III: The Stability of Indicators for Net Soil Nitrogen Mineralization
(NSNM) in Tobacco Rotation and Tillage Systems
3.3.1 Introduction
Nitrogen mineralized from soil organic matter (SOM) and crop residue is a major
component of soil N supply in agricultural production systems. Estimating net soil N
mineralization (NSNM) during a growing season is of considerable importance for
maximizing crop N use efficiency from all N sources and minimizing environmental
losses (Schomberg et al., 2009). Long term incubation to estimate biological N
mineralization has been regarded as the most suitable soil N availability index (Keeney,
1982; Griffin et al., 2007), but the incubation process is time consuming and not practical
for routine use. Consequently, rapid biological and chemical methods to estimate NSNM
have long been sought. Most studies on this topic have utilized numerous soil samples
from a broad region in order to find indices with broad application (Sharifi et al., 2007;
Schomberg et al., 2009). However, no single N availability index has proved sufficiently
robust for broad acceptance across a wide range of soils (Balkcom et al., 2003; Bushong
et al., 2008). The main reason could be that NSNM is a function of many biotic and
abiotic factors that are themselves influenced by climate conditions, soil type, cropping
history, and soil management (Griffin, 2008). Collecting soil samples from a broad
region might better represent soil types, but background information on soil management
was often not maintained.
Choosing soil samples from a relatively small geographical area could avoid variance due
to climate and soil types, and soil samples from well-designed research sites should
94

include full information on cropping history and soil management. The data might not be
extrapolated to other broader regions, but the predictive value of determined indices of N
availability could be greater and might be packaged in routine tests by local soil testing
laboratories, because fertilizer N recommendations are commonly developed on a
regional basis. Increasing utilization of NSNM while reducing the laboratory effort could
take two approaches: (1) decreasing the frequency of NSNM measurement; and (2)
determining alternative rapid indices to estimate NSNM. One of major purposes for
estimating NSNM in agriculture production is to evaluate the effect of crop and soil
management. More efficient N fertility management can then be suggested for different
production systems, based on knowledge of these effects (Kolberg et al., 1999; Balota et
al., 2004). However, the first objective would be determining the proper frequency of
NSNM assays needed to evaluate the effects of crop and soil management. Because
NSNM is a component of the biological decomposition of SOM, the second objective
would be to evaluate which soil organic C and N fractions are sufficiently robust to
predict NSNM.
Different sampling times might give different NSNM magnitudes due to seasonal soil
variation or operation error (El-Haris et al., 1983a; Zhang et al., 2009). The relative
impacts of crop and soil management practices on NSNM, across different sampling
times, would still be valuable knowledge because this can help determine the optimal
frequency for NSNM assays. Unfortunately, the literature on this topic is sparse. Using
soil organic carbon (C) and N fractions to predict NSNM has been studied extensively in
past decades (Keeney and Bremner, 1966; Curtin and Wen, 1999; Sharifi et al., 2007).
Soil organic carbon (SOC) and total nitrogen (STN) concentrations have been used as
95

indices of N availability, with mixed results. Selles et al. (1999) and Schomberg et al.
(2009) observed close correlations between STN and/or SOC and NSNM across a wide
range of soils, but other researchers reported weak correlations between STN and/or SOC
and NSNM (Hassink, 1994). There have been a few studies on the correlation between
permanganate oxidizable carbon (POXC) and NSNM, but POXC has been shown to be
sensitive to soil management (Culman et al., 2012) and this weakens consequent
prediction of crop response to N (Lucas and Weil, 2012). Particulate organic carbon
(POC) and nitrogen (PON) were also reported to be closely related to NSNM
(Schomberg et al., 2009).
In this study, six well defined tobacco rotation-tillage systems at a single research site
were used. The objectives were to: (1) test the temporal stability of the effect of six
tobacco rotation-tillage systems on NSNM; and (2) evaluate five soil C and N fractions as
predictors of NSNM.
3.3.2 Methods and Materials
Site Description and Climate
This study was conducted from 2011 to 2013 at the University of Kentucky Spindletop
Research Farm near Lexington, Kentucky, USA (38°07'36.8"N 84°29'26.4"W). The soil
is a Bluegrass-Maury silt loam (fine, mixed, active, mesic Typic Paleudalf), a deep well-
drained soil formed in phosphatic limestone residuum. Before this study site was
established, the baseline soil pHwater (1:1, w/v) was 6.3, with Mehlich III (Mehlich, 1984)
extractable nutrient levels were 85, 178, 1800, 110 and 3 mg kg-1 for phosphorus,
potassium, calcium, magnesium, and zinc, respectively. The soil texture was 12 % sand,
96

68 % silt and 20 % clay. The location is characterized by a wide variation in mean
monthly air temperatures, from 0 °C in January to 24 °C in July and August, but a
relatively uniform distribution in mean monthly precipitation, with an annual average
annual rainfall of 1160 mm.
Experiment Design and Field Sampling
Treatment plots (6.4 m wide by 24.4 m long) were arranged in four randomized complete
blocks. The six tillage-crop sequence treatments were: i) conventional tillage continuous
tobacco (TTT-CT); ii) no-tillage continuous tobacco (TTT-NT); iii) 2-yr fescue (Festuca
arundinacea Schreb.) sod and 1-yr conventional tillage tobacco (SST-CT); iv) 2-yr
fescue sod and 1-yr no-tillage tobacco (SST-NT); v) no-tillage corn, soybean and tobacco
(CST-NT); and vi) no-tillage soybean, corn and tobacco (SCT-NT). These production
systems were established in 2007.
Composite soil samples (20 cores per plot) were collected from the 0 to 10 and 10 to 20
cm depth increments on 13 May 2011, 16 May 2012 and 14 May 2013, respectively
when tillage was implemented, but prior to fertilizer application. The samples were used
to measure NSNM, POXC, POC, PON, SOC and STN. Conventional tillage refers to
moldboard plowing, followed by disking twice and a soil finisher operation before
transplanting tobacco seedlings. Other agronomic management was applied according to
recommendations from the University of Kentucky Cooperative Extension Service
(Seebold and Pearce, 2013).
97

Laboratory Analysis
Net Soil Nitrogen Mineralization (NSNM)
The aerobic laboratory N mineralization incubation method was based on a procedure
described by Hart et al. (1994). After composite soil samples were collected, a field
moist subsample was immediately extracted with 1M KCl to determine baseline levels of
soil NO3-N and NH4-N. The remaining field moist soil was manually passed through a 4
mm sieve. Large pieces of organic material and rocks were removed. Soil water content
was determined gravimetrically by oven-drying a second subsample. The remaining soil
was stored at 4 °C until incubation. To start the incubation, 50 g soil was placed in
duplicate sealable plastic bags. Soil moisture was adjusted to 60 % water-filled pore
space, which has proved to be optimal for aerobic microbial processes in most soils (Linn
and Doran, 1984). Soil moisture content was regularly checked and adjusted as
necessary. Soil was incubated at a constant temperature of 25 °C. Periodically, 5 g of soil
was removed and 1M KCl was used to extract NO3-N and NH4-N. The NO3-N analysis
was determined with a microplate cadmium brush (Paratech, Lexington, KY) reduction
method (Crutchfield and Grove, 2011). The NH4-N analysis was determined with the
phenol-hypochlorite reaction (Weatherburn, 1967; Ngo et al., 1982). The cumulative
incubation days were 127, 128, and 119 days for samples taken in 2011, 2012 and 2013,
respectively. The NSNM was calculated after correction for final and initial inorganic
soil N. The final concentration of inorganic N in each sample is reported in mg N kg-1
oven-dried (105 °C) soil after adjusting for sample gravimetric water content. The NSNM
analysis was duplicated for each sample, and the mean of the duplicates was used for
statistical analysis.
98

Permanganate Oxidizable Carbon (POXC)
The POXC analysis was based on the procedure described by Weil et al. (2003) and
modified by Stiles et al. (2011). Field moist soil was manually passed through a 4 mm
sieve to remove coarse debris and then passed through a 2 mm sieve and air-dried for 2 to
3 weeks. For POXC analysis, 2.5 g of air-dried soil were weighed into 50 mL screw-top
plastic centrifuge tubes. The soil was reacted with 20 mL of a 0.02 mol L-1 KMnO4
solution in 0.1 mol L-1 CaCl2 by shaking for exactly 2 min on a reciprocating shaker at
180 rpm. After shaking, tubes were removed from the shaker and allowed to settle for
exactly 10 min (shaking and settling times are very important, so sample batches were
limited to 10 samples or less). A 0.5 mL aliquot of the supernatant was transferred into a
second 50 mL centrifuge tube and mixed with 49.5 mL deionized water by hand shaking.
The solution absorbance at 550 nm was measured by a Genesys 20 Spectrophotometer
(Thermo Fisher Scientific, Inc.). To determine residual KMnO4 concentrations, sample
absorbance was compared with a standard curve that ranged from 0.005 to 0.02 mol L-1
KMnO4. Sample POXC was calculated as in Weil et al. (2003) and Blair et al. (1995) as
follows:
××+−= −−−
soilkg0.0025solutionL0.02
)molCmg(9000)](Lmol[0.02)kg(mgPOXC 111 bza
Eqn 1
where 0.02 mol L-1 is the initial KMnO4 concentration, a is the intercept and b the slope
of the standard curve, z is the absorbance of the unknown, 9000 mg is the amount of C
oxidized by 1 mole of MnO4 (Mn7+ reduction to Mn4+), 0.02 L is the volume of KMnO4
reaction solution, and 0.0025 kg is the mass of soil used in the reaction. The POXC
99

analysis was duplicated for each sample, and the mean of the duplicates used for
statistical analysis.
Particulate Organic Carbon (POC) and Nitrogen (PON)
Particulate organic matter fractions were isolated by a particle size fractionation method
described by Cambardella and Elliott (1992) and Cambardella and Elliott (1993a). Field
moist soil was manually passed through a 4 mm sieve to remove coarse debris and then
passed through a 2 mm sieve and air-dried for 2 to 3 weeks. For physical separation, 50 g
subsamples were dispersed in 150 mL of a 5 % (w/v) solution of sodium
hexametaphosphate by shaking 15 h on a reciprocal shaker. The dispersed samples were
passed through a 53 µm sieve. After rinsing several times with water, the material
retained on the sieve was transferred to an aluminum pan and dried at 50 °C. The dried
sample was ground with a mortar and pestle and analyzed for carbon and nitrogen by dry
combustion. The POC and PON values are given in mg C (or N) kg-1 soil.
Soil Organic Carbon (SOC) and Soil Total Nitrogen (STN)
The SOC and STN concentrations were determined by dry combustion of air-dry 2-mm-
sieved whole soil samples from each depth with an Elementar Vario Max CN analyzer
(Elementar Co.). The SOC and STN values are given in mg C (or N) kg-1 soil.
Statistical Analysis
Data were analyzed with the General Linear Model (GLM) and Pearson correlation
procedures in the SAS 9.3 computer package (SAS Institute Inc., Cary, NC). Duplicate
sample measurements were averaged for statistical analysis. The analysis considered
100

replicate effects to be random and treatments effects to be fixed. Treatment effects were
considered significant at the 95 % level of confidence. Means separation was done using
the Tukey's HSD (honest significant difference) test at an alpha level of 0.05. Graphical
presentations were developed using SigmaPlot 12.3 (Systat Software Inc., San Jose, CA).
3.3.3 Result
The effect of tobacco tillage and rotation systems on NSNM from 2011 to 2013
The NSNM was significantly affected by year, system, depth, depth by system, and depth
by year, but the system by year and system by year by depth interactions were not
significant (Table 3.3.1). POXC, PON, POC, STN, and SOC were affected by the similar
variances as to those observed for NSNM. The system by year interaction for NSNM was
used to evaluate the first objective - evaluating the temporal stability of the effect of the
six tobacco rotation-tillage systems on NSNM. The system by year interactions for
POXC, PON, POC, STN, and SOC were not significant.
Soil depth significantly affected NSNM (Table 3.3.1), so the non-significant system by
year was separated into the two sampled depths. At 0 to 10 cm, the NSNM values for the
SST-NT, SST-CT and TTT-CT treatments were stably ranked as 1st, 5th, and 6th,
respectively (Figure 1). Although the rank order for NSNM values for the TTT-NT, CST-
NT and SCT-NT treatments varied somewhat from year to year, these NSNM values
were not significantly different from one another in any year. At 10 to 20 cm (Figure. 2),
only NSNM values for SST-CT had a consistent rank (1st) across the three years, other
treatments gave NSNM values that ranked randomly each year. Furthermore, there was
no significant difference in NSNM due to treatment, in any year.
101

Table 3.3.1 Analysis of variance summary for the effects of different tobacco tillage-
rotation systems on NSNM, POXC, PON, POC, STN and SOC.
Source of variation DF† SNM POXC PON POC STN SOC
----------Probability of a greater F value---------- Replicate 3 0.5217 0.0051 0.223 0.2392 0.0021 0.0003 Year (Y) 2 <.0001 <.0001 0.0002 0.0008 <.0001 <.0001 Treatment (S) 5 <.0001 <.0001 0.1248 0.0150 <.0001 <.0001 Treatment*Year 10 0.1290 0.1020 0.6218 0.3591 0.2689 0.0948 Depth (D) 1 <.0001 <.0001 <.0001 <.0001 <.0001 <.0001 Treatment*Depth 5 <.0001 <.0001 0.070 0.0743 <.0001 <.0001 Year*Depth 2 0.016 <.0001 0.001 0.0214 0.0136 0.1887 Treatment*Year*Depth 10 0.9729 <.0001 0.6769 0.7342 0.7128 0.8202
†DF = degrees of freedom; NSNM = net soil nitrogen mineralization; POXC = permanganate oxidizable carbon; PON = particulate organic nitrogen; POC = particulate organic carbon; STN = total soil nitrogen; SOC = soil organic carbon. Statistically significant relationships are in bold.
102
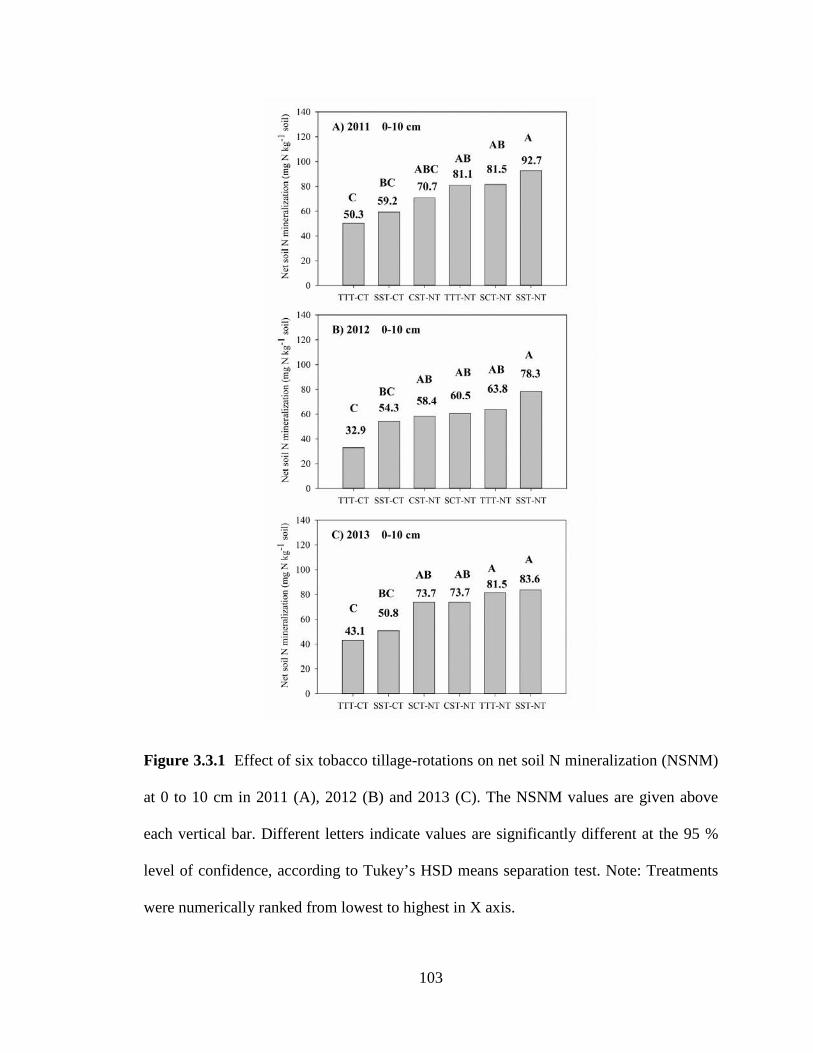
Figure 3.3.1 Effect of six tobacco tillage-rotations on net soil N mineralization (NSNM)
at 0 to 10 cm in 2011 (A), 2012 (B) and 2013 (C). The NSNM values are given above
each vertical bar. Different letters indicate values are significantly different at the 95 %
level of confidence, according to Tukey’s HSD means separation test. Note: Treatments
were numerically ranked from lowest to highest in X axis.
103

Figure 3.3.2 Effect of six tobacco tillage-rotation systems on net soil N mineralization
(NSNM) at 10 to 20 cm in 2011 (A), 2012 (B) and 2013 (C). The NSNM values are given
above each vertical bar. Different letters indicate values are significantly different at the
95 % level of confidence, according to Tukey’s HSD means separation test. Note:
Treatments were numerically ranked from lowest to highest in X axis.
104

Indices related to soil nitrogen mineralization
The correlation coefficient (r) between the NSNM values and potential indicator indices
(across both the 0 to 10 and 10 to 20 cm depth increments) varied from 0.609 to 0.863
(Table 3.3.2). The rank order for the coefficients of correlation between NSNM and these
other indices was SOC > POXC > POC > STN > PON. For Table 3.3.3, a randomized
complete block design, using the SAS GLM procedure, was fitted to each response
variable, and the residuals were output. Then, a correlation among the residuals found for
each response variable was conducted using the SAS Pearson correlation procedure. The
correlation coefficients (r) among the response variable residuals ranged from 0.191 to
0.463 (Table 3.3.3). The rank order for the coefficients of correlation between these
residuals for NSNM and the soil carbon and nitrogen fractions was SOC > STN > POC >
PON > POXC. Except for the coefficients of correlation among residuals for PON versus
POC and SOC versus STN, all other coefficients of correlation among variate residuals
were lower than the corresponding coefficients of correlation among variate values.
Table 3.3.2 Pearson correlation coefficients (r) for correlations among NSNM values and
the values for other soil carbon and nitrogen indices (n=144).
Parameter† NSNM POXC PON POC STN SOC NSNM 1‡
POXC 0.693 1 PON 0.609 0.316 1
POC 0.667 0.417 0.960 1 STN 0.632 0.350 0.552 0.538 1
SOC 0.863 0.638 0.684 0.724 0.773 1 †NSNM = net soil nitrogen mineralization; POXC = permanganate oxidizable carbon; PON = particulate organic nitrogen; POC = particulate organic carbon; STN= soil total nitrogen; SOC= soil organic carbon. ‡All correlations are significant (p < 0.001).
105

Table 3.3.3 Pearson correlation coefficients (r) for correlations among NSNM residuals
and the residuals for other soil carbon and nitrogen indices (n=144).
Parameter† r§NSNM rPOXC rPON rPOC rSTN rSOC rNSNM 1‡
rPOXC 0.191 1 rPON 0.332 0.029 1
rPOC 0.382 0.072 0.942 1 rSTN 0.438 0.109 0.291 0.299 1
rSOC 0.463 0.238 0.343 0.369 0.830 1 †NSNM = net soil nitrogen mineralization; POXC = permanganate oxidizable carbon; PON = particulate organic nitrogen; POC = particulate organic carbon; STN= soil total nitrogen; SOC = soil organic carbon. §r refers to the residual for each response variable that resulted from fitting the model. ‡All correlations are significant (p < 0.05) except for rPOXC versus rPON, rPOXC versus rPOC, and rPOXC versus rSTN.
3.3.4 Discussion
Soil N mineralization estimated by biological incubation methods is considered an
effective index of soil N availability (Binkley and Hart, 1989; Bundy and Meisinger,
1994); these incubations have also proved to have a high correlation with crop N uptake
or yield response (Stanford et al., 1973). For most studies, the main purpose for
estimating NSNM has been to evaluate the impact of agronomic practices (including crop
sequences, tillage practices, and N fertilizer application) on soil N dynamics to cope with
both agriculture production and environment concerns (Campbell et al., 1995; Ju et al.,
2009). The classic long-term aerobic laboratory incubation methods require substantial
time and equipment (Stanford and Smith, 1972). There has been much effort to simplify
NSNM methods and to find alternative but rapid biological and chemical N availability
indices (Griffin, 2008). Two questions, related to the need to reduce NSNM incubation
work and raise time efficiency, were examined in this study. Question 1 was whether
106

NSNM assay frequency could be reduced. Question 2 was whether SOC or another soil C
or N fraction could serve as an NSNM predictor.
For objective 1, the system by year interaction was not statistically significant, which
indicates that the effects of the six tobacco rotation-tillage treatments on NSNM were
stable across years. This finding suggests that long-term laboratory incubations to
estimate NSNM are not necessary every year. In this study, crop and soil management
systems significantly affected NSNM, consistent with many other studies (El-Haris et al.,
1983a; Carpenter-Boggs et al., 2000). However, the individual rotation systems were
stable – similarly ranked across several years even though the absolute amount of NSNM
varied from year to year. Soil depth significantly affected NSNM. Surface soil usually
contains much SOM and has higher soil microbial activity, thus the 0 to 10 cm depth
increment exhibited higher NSNM than the 10 to 20 cm depth increment and contributes
most to soil profile NSNM (Cassman and Munns, 1980). Most crop sequence and tillage
management choices affect SOM mainly in surface soil (Post and Kwon, 2000).
Therefore, the temporally stable NSNM pattern among the six tobacco tillage-rotation
systems gives confidence to a decision to reduce the frequency of NSNM assays.
No-tillage can increase NSNM estimates because soil is homogenized for laboratory
incubation. No-tillage can increase the surface SOM pool by reducing the
macroaggregate turnover rate (Six et al., 2000a). The system by depth interaction on
NSNM could be due mainly to a tillage effect. All samples were taken after tillage.
Therefore, soil was homogenized in the 0 to 10 and 10 to 20 cm depth increments in the
TTT-CT and SST-CT systems, and there were only slight differences in NSNM between
107
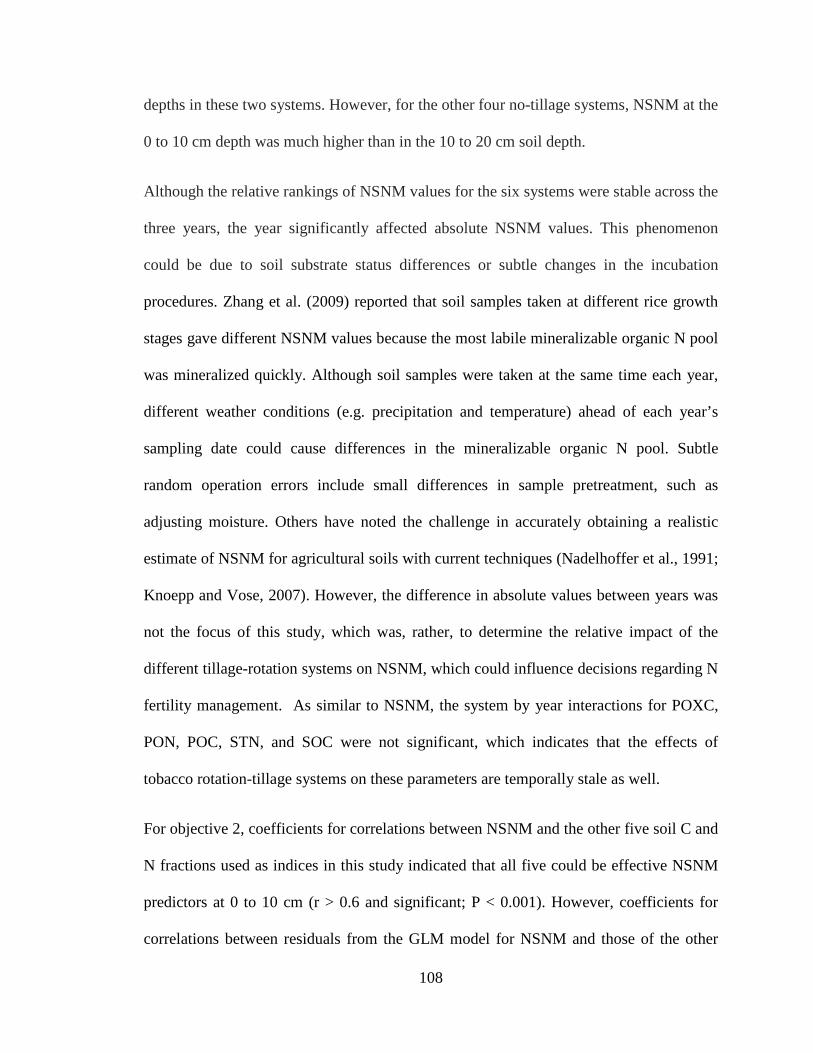
depths in these two systems. However, for the other four no-tillage systems, NSNM at the
0 to 10 cm depth was much higher than in the 10 to 20 cm soil depth.
Although the relative rankings of NSNM values for the six systems were stable across the
three years, the year significantly affected absolute NSNM values. This phenomenon
could be due to soil substrate status differences or subtle changes in the incubation
procedures. Zhang et al. (2009) reported that soil samples taken at different rice growth
stages gave different NSNM values because the most labile mineralizable organic N pool
was mineralized quickly. Although soil samples were taken at the same time each year,
different weather conditions (e.g. precipitation and temperature) ahead of each year’s
sampling date could cause differences in the mineralizable organic N pool. Subtle
random operation errors include small differences in sample pretreatment, such as
adjusting moisture. Others have noted the challenge in accurately obtaining a realistic
estimate of NSNM for agricultural soils with current techniques (Nadelhoffer et al., 1991;
Knoepp and Vose, 2007). However, the difference in absolute values between years was
not the focus of this study, which was, rather, to determine the relative impact of the
different tillage-rotation systems on NSNM, which could influence decisions regarding N
fertility management. As similar to NSNM, the system by year interactions for POXC,
PON, POC, STN, and SOC were not significant, which indicates that the effects of
tobacco rotation-tillage systems on these parameters are temporally stale as well.
For objective 2, coefficients for correlations between NSNM and the other five soil C and
N fractions used as indices in this study indicated that all five could be effective NSNM
predictors at 0 to 10 cm (r > 0.6 and significant; P < 0.001). However, coefficients for
correlations between residuals from the GLM model for NSNM and those of the other
108

indices were lower. The Pearson correlation between actual NSNM values and the
indices only shows the relationship between the two datasets without full consideration of
how the data were collected, or the experimental design, which is a suitable way to select
predictors when using numerous samples from a wide range of soil types.
Alternative analysis of the residuals was done to better account for the experimental
design, according to Kutner et al. (2004). Correlating residuals instead of the actual
values can mitigate spurious estimation of correlation coefficients. Although there were a
large number of samples (n = 144) in the study, all were collected from the same site. The
same composite soil samples were used to determine NSNM, POXC, PON, POC, STN
and SOC. In these samples, those properties would be inherently correlated due to several
reasons: (1) these measured variates all reflect certain SOC or STN fractions; (2) soil
samples were collected from the small plot areas; and (3) they belonged to one
experimental study site. These reasons caused the measurements to be similarly affected
by similar sources of variance, as shown in Table 3.3.1.
Therefore, simply using Pearson correlation without taking the background information
into account might result in overestimation of the coefficients between the five indices
and NSNM. For example, POXC was reported to be as sensitive to changes in
management as NSNM (Soon et al., 2007; Culman et al., 2012). The Pearson correlation
coefficient between values of POXC and NSNM was 0.693 (Table 3.3.1), but the Pearson
correlation coefficient between POXC and NSNM residuals was only 0.191 (Table
3.3.2). Thus, using the residuals from the GLM model can reduce the influence of known
variance, e.g. year, depth and systems, and thereby more precisely unveil the relationship
between NSNM and the five indices.
109

3.3.5 Conclusion
An efficient and simple index of NSNM would improve N fertilizer recommendations
and minimize adverse environmental impacts due to excessive N availability. This study
evaluated the frequency of NSNM (estimated by a season-long soil N mineralization
laboratory incubation method) evaluation needed to effectively compare the tillage-
rotation systems and determine the predictive success of other common measurements
that would serves as indices of NSNM. Among six tobacco tillage-rotation systems,
NSNM was relatively stable across three years, indicating that NSNM need not be
measured annually. The SOC was a reliable index of NSNM across the six tillage-
rotation systems and three years in this study. Because SOC is commonly an option in
routine soil tests done by many testing laboratories, SOC is arguably the best proxy to use
for predicting NSNM among different tillage-rotation systems.
110

Chapter 4: No-Tillage Culture and Nitrogen Fertilizer Management for Burley
Tobacco Production
4.1 Introduction
Since no-tillage commercial corn production was introduced in Kentucky in 1962
(Phillips and Young Jr, 1973), the no-tillage system has been quickly adopted for grain
crop production around the world (Derpsch et al., 2010). In 2008, 21 % of maize (Zea
mays L.) and 41 % of soybean (Glycine max (L.) Merrill) planted acres were in no-tillage
production in the United States according to the Crop Residue Management Survey
(http://www.ctic.purdue.edu/CRM/). Burley tobacco, known as a major cash crop in the
southeastern US, has been considered a conservation plan problem because tobacco
traditionally required clean cultivation and is grown in a season when intense rains raise
the erosion hazard. Recently, more growers have adopted conservation plans for burley
tobacco production, especially as the tobacco industry has promoted good agriculture
practices for future tobacco production. No-tillage tobacco offers several advantages
compared to conventional production. It can reduce soil erosion, reduce field preparation
time, and save fuel cost relative to mechanical tillage (Pearce and Zeleznik, 1996a). The
presence of ground cover at harvest might result in cleaner cured tobacco leaf than with
bare soil (Wood and Worsham, 1986). Although no-tillage burley tobacco production
research was attempted in the early 1970’s (Phillips and Zeleznik, 1989). The recent
appearance of a modified no-tillage transplanter and successful weed control options
made no-tillage tobacco production economically viable (Morrison et al., 1973; Pearce
and Zeleznik, 2003; Zou, 2013). However, past research provides inadequate detail
comparing no-till and tilled burley tobacco production with respect to seasonal
111

agronomic response, agronomic performance, nitrogen nutrition management, and cured
leaf chemical composition.
Nitrogen nutrition management is an important component of tobacco production. With
appropriate N management, it may be possible to limit excessive NO3-N accumulation in
leaves, optimize fertilizer N use efficiency, and reduce the potential for ground and
surface water pollution without compromising burley tobacco leaf yield and quality
(MacKown et al., 1999). In addition to fertilizer N, N mineralization from the soil organic
matter (SOM) is another important N source. However, soil N mineralization may be
affected by tillage method. No-tillage can have higher soil N mineralization potential
than conventional tillage (El-Haris et al., 1983b; Wienhold and Halvorson, 1999; Pandey
et al., 2010) because no-tillage tends to preserve surface soil carbon (C) and N pools
(Six et al., 1998; Six et al., 1999; Wright and Hons, 2005b) and maintain higher surface
soil moisture levels (Blevins et al., 1971). Most of these studies were conducted under
laboratory conditions and might not reflect field conditions. One strategy to approximate
field environments is to use in situ resin core incubation methods to estimate soil mineral-
N dynamics during the tobacco growth season. Compared to laboratory incubations, the
in situ approach may better predict differences in plant available nitrogen (PAN) supply
due to different tillage systems during the growth season (Hübner et al., 1991; Kolberg et
al., 1997; Khanna and Raison, 2013) .
Tobacco agronomic performance might also be influenced by the effect of tillage on soil
properties such as surface structure (Arshad et al., 1999), moisture (De Vita et al., 2007) ,
penetration resistance (Lampurlanés and Cantero-Martínez, 2003), nutrient distribution in
the soil profile (Franzluebbers and Hons, 1996; Duiker and Beegle, 2006; Wright et al.,
112

2007), and the rhizosphere environment (Andrade et al., 2003; Yadav and Tarafdar, 2004;
Thomas et al., 2007). In tobacco tillage studies, Phillips and Zeleznik (1989) found that
the killed sod mulch on no-tillage soil reduced water evaporation compared to tilled soil
for the first 60 days after transplanting. Tobacco growth rates were higher with no-tillage
than with tillage. Ritchey (2010) found that penetrometer resistance in tobacco fields over
the 0 to 10 cm depth was significantly lower with tillage than no-tillage. Zartman et al.
(1976) reported that tobacco root density over the 0 to 15 cm depth increment was higher
with tillage than no-tillage. The effects of different tillage systems on burley tobacco
cured leaf yield have been mixed. Zeleznik and Phillips (1990) reported that over a five
year period there were no significant differences in cured leaf yield and quality with
tillage or no-tillage when 336 kg N ha-1 fertilizer was applied. In contrast, Zartman et al.
(1976) reported that burley tobacco growth rates were lower with no-tillage than
conventional tillage when only 90 kg N ha-1 fertilizer was applied. Link (1984) in
Virginia reported that no-tillage burley yields were equal to conventional tillage yields
for 2 of the 5 years tested and significantly less in the remaining years.
With increasing health consciousness and regulation of tobacco products, the chemical
constituents of the cured leaf are as important as yield. Alkaloids, including nicotine,
nornicotine, anabasine, and anatabine are precursors to carcinogenic nitrosamines
(Andersen et al., 1986). Tobacco specific nitrosamines (TSNAs) have been reported as
carcinogenic compounds in tobacco for many years (MacKown et al., 1984). Since the
first report documenting the presence of N-nitrosonornicotine in unburned tobacco and
induced malignant tumors in mice, rats, and hamsters (Hoffmann and Hecht, 1985), there
have been many studies that evaluated the effects of genotypes (Guo et al., 2013),
113

chemical applications (Li et al., 2013), and the regulation of humidity and temperature
during the curing process on the formation of TSNAs (Burton et al., 1989a; Chamberlain
and Chortyk, 1992; Padmavathy et al., 2011; de Godoy Lusso et al., 2014). Liming, N
fertilizer rate, irrigation management and cultivar on reducing sugars and nicotine
concentration and leaf quality have also been investigated (Karaivazoglou et al., 2007;
Çakir and Çebi, 2010; Kaleb Rathbone et al., 2010). It is well known that tobacco
alkaloid synthesis is located in the root system (Dawson and Solt, 1959), which might be
greatly affected by the soil physical and chemical conditions resulting from tillage
practice. However, few studies have discussed the potential impacts of tillage on tobacco
leaf chemical constituents.
With more emphasis on conservation tillage, in a context of sustainable agricultural
systems, more information is needed to further improve N management in relation to no-
tillage tobacco agronomic performance and leaf quality. Therefore, the objectives of this
study were to determine if tillage method and N fertilizer rate: (i) influenced tobacco
yield; (ii) affected plant available N supply during tobacco growth season; and (iii)
altered cured tobacco leaf chemical composition.
4.2 Materials and Methods
Site Description and Climate Information
This research was conducted at the University of Kentucky Spindletop Research Farm,
near Lexington, Kentucky, USA (38°07'36.8"N 84°29'26.4"W). The soil is a Bluegrass-
Maury silt loam (fine, mixed, active, mesic Typic Paleudalf), with a 2 to 4 % slope at the
study site. A long-term study was established in 2007 to evaluate the yield response of
114

burley tobacco to tillage method. When study site was established in 2007, the baseline
soil pHwater (1:1, w/v) was 6.3, with Mehlich III extractable phosphorus (85 mg kg-1),
potassium (178 mg kg-1), calcium (1.8 g kg-1), magnesium (110 mg kg-1), and zinc (3 mg
kg-1). The soil had 12 % sand, 68 % silt and 20 % clay. The location is characterized by a
wide variation in mean monthly air temperature from 0 °C in January to 24 °C in July and
August and a relatively even distribution in mean monthly precipitation with a total
average annual precipitation of 1160 mm.
Seasonal Weather Conditions
Monthly mean air temperature and cumulative precipitation for the 2012 and 2013
tobacco growing seasons are shown in Figures 4.1 and 4.2, respectively. These two
seasons had dramatically different climate relative to the long term mean as a standard.
Total precipitation during the tobacco growing period was 432 mm in 2012 and 706 mm
in 2013 with 515 mm being the long term mean. Average air temperature during the
tobacco growing period in 2012 was warmer than 2013, especially in July and August
when tobacco enters into the rapid growing stage. Therefore, the tobacco growth season
in 2012 was considered to have a warm and dry pattern, whereas 2013 was considered to
have a cool and wet pattern.
115

Figure 4.1 Monthly mean air temperature for 2012 and 2013 tobacco growing seasons
and for the long term average mean (1971-2013) at the experiment site. (Source:
Kentucky Agricultural Weather Center, http://wwwagwx.ca.uky.edu/)
116

Figure 4.2 Monthly total precipitation for 2012 and 2013 tobacco growing seasons and
for the long term average mean (1971-2013) at the experiment site. (Source: Kentucky
Agricultural Weather Center, http://wwwagwx.ca.uky.edu/)
Experiment Design
The tillage comparison study was established with four replications in 2007. Nitrogen
fertilizer rate (280 kg N ha-1) was applied each year to both tillage treatments.
Conventional tillage in this study consisted of moldboard plowing followed by disking
twice and soil finishing operation with a rototiller, prior to tobacco seedling transplanting.
Beginning in 2012, three N fertilizer rates (0, 140, and 280 kg N ha-1) were introduced as
split-plots. Therefore, the field trial had a two factor factorial split-plot design; tillage was
included as main plot and N fertilization as sub-plot. Tillage treatments (no-tillage and
conventional tillage) were randomly assigned in main plots (6.40 m x 24.40 m). Three N
fertilizer rates were randomly assigned to split plots (6.40 m x 8.10 m) within each main
117

plot. Broadcast applications were applied by hand before transplanting tobacco seedlings.
The population density was 18,286 plants per hectare and individual plant spacing was
0.54 by 1.07 m. Winter wheat (Triticum aestivum L.) was planted after tobacco harvest
each season as a winter cover crop and was chemically killed approximately four weeks
prior to transplanting. Tobacco production practices followed recommendations of the
University of Kentucky Cooperative Extension Service (Seebold and Pearce, 2013),
except for treatments imposed. Before 2012, only total cured tobacco leaf yield data was
collected. The dates of important agronomic operation in 2012 and 2013 are shown in
Table 4.1.
Table 4.1 Dates of fertilizer application, transplanting, topping, and harvest.
Year Fertilizer Application Transplanting Topping Harvest 2012 22-May 6-Jun 30-Aug 3-Oct 2013 4-Jun 15-Jun 9-Sep 30-Sep
Variables Measured
Agronomic Parameters
Tobacco cured leaf yield, leaf chlorophyll, leaf tissue NO3-N and total N concentrations
were determined. After harvest, tobacco was cured according to standard air curing
procedures. Tobacco leaves were then manually removed and placed into “grades”
(flyings, lugs, reds, and tips), from the bottom to the top of the stalk, respectively (Tso,
1990). Only total cured leaf yield is reported in this paper. Leaf chlorophyll was
estimated using a chlorophyll meter (Minolta SPAD-502 Konica Minolta, Osaka, Japan)
at topping (removal of flowers at top of the plant). The measurement was done, avoiding
118

the central vein, on the middle position of the last fully expanded leaf, commonly the
fourth leaf from the apex. The same leaves were subsequently removed, oven-dried (55
°C), and ground to pass a 1-mm sieve for NO3-N and TN determination.
In Situ Plant Available Nitrogen (PAN)
Plant available inorganic nitrogen in the 0 to 20 cm soil depth was measured by a
modified in situ resin core procedure (Kolberg et al., 1997). Incubation cores were
prepared by driving and removing aluminum conduit (25.40 cm long with an inner
diameter of 4.80 cm) into the soil between tobacco rows before fertilizer N application.
The bottom 2.54 cm of soil was removed from each soil core and replaced with the same
volume of ion-exchange resin beads in a nylon bag. The entire assembly was returned to
the original hole with a rubber washer surrounding the tube to avoid preferential bypass
flow of surface runoff water potentially bringing inorganic nitrogen from outside the
tubes to contaminate the resin bags. The top of the core was open to the atmosphere to in
order to simulate field conditions. The resin bag consisted of equal amounts of cation and
anion exchangeable resins (Lanxess Sybron, Birmingham, NJ). The design of the in situ
soil resin core is shown in Fig. 4.3. Resins were allowed to incubate 60 days in field
conditions; replacement resin bags were needed for longer incubations. For fertilizer N
treatment application, N fertilizer solution (5 mL NH4NO3) was evenly sprayed into the
inner soil surface of tubes at rates of 0, 140, and 280 kg N ha-1 equivalent based on the
inner area of the tubes. Tillage operations were performed before the sampling date 1
(SD1). On SD1 we removed a 0 to 20 cm soil sample to analyze inorganic N as baseline,
installed the tubes, and put fertilizer N treatment into the tubes. Additional sampling
dates were intended to occur at 30 days after transplanting (DAT), 60 DAT, and at
119

tobacco harvest. Actual sampling dates were adjusted due to weather and field soil
moisture conditions (Table 4.2).
For laboratory analysis, each composite (three tubes) field soil sample dry weight was
determined by weighing the field moist sample and determining the gravimetric moisture
content of a subsample. A 10 g field moist sub-sample was immediately analyzed for
NO3-N and NH4-N. Each composite resin sample was carefully mixed and weighed.
Resin samples in different plots exhibited different moisture contents. A subsample for
each plot was removed to adjust to the same weight based on original product moisture
and recent moisture percentage. The subsample resin bags were serially extracted by
shaking bags in three separate volumes of 50 mL each of 1M KCl for three different
periods (15, 30, and 60 min). The three liquid samples were composited. The final
recovered NO3-N and NH4-N concentrations were calculated by equations (1) and (2),
respectively, derived from a previous extraction study following the standard extraction
procedure described above.
NO3-N (absorbed by resin)=NO3-N(recovered from resin)*1.30+57.15 Eqn. 1
NH4-N (absorbed by resin)=NH4-N(recovered from resin)*1.12+45.42 Eqn. 2
The analysis of inorganic N for resin and soil samples followed the same analytical
method. The NO3-N analysis was determined by cadmium reduction method (Paratech,
Lexington, KY) (Crutchfield and Grove, 2011). The NH4-N analysis was determined by
120

phenol-hypochlorite reaction (Weatherburn, 1967; Ngo et al., 1982). Each sample was
analyzed in duplicate and mean data was used for statistical analysis. PAN supply during
the incubation period was calculated as the sum of inorganic N extracted from soil and
absorbed from resin, presented as µg inorganic N g-1 dry soil.
Figure 4.3 Cutaway diagram of soil resin core, in which surficial plant residue and intact
soil column (0-20.32 cm) and one mixed-media ion-exchange resin bag are incubated
inside a core tube. A transparent example of an ion-exchange resin nylon bag is shown
with a nylon mesh (1mm opening) as a bottom cover.
121

Table 4.2 Sampling dates for plant available nitrogen assays in 2012 and 2013.
Operation 2012 2013 Sampling 1 22-May 29-May Sampling 2 20-June 9-July Sampling 3 25-July 12-Aug. Replacement of resin bag 30-July 3-Sept. Sampling 4 25-Sept. 30-Sept.
Air-Cured Leaf Chemistry Parameters
After air curing was complete, the fourth leaf from the apex of each stalk was collected
and used to quantify NO3-N, alkaloids (including nicotine, nornicotine, anabasine, and
anatabine), and TSNAS concentrations on a leaf dry matter basis. Air dried samples were
ground to pass a 1-mm sieve and all leaf analyses were done in triplicate. NO3-N
concentration was determined by cadmium reduction method (Paratech, Lexingto KY)
(Crutchfield and Grove, 2011). Nicotine, nornicotine, anabasine, and anatabine were
quantitatively analyzed by flame ionization gas chromatography (GC) (Perkin-Elmer
Autosystem XL with Prevent) according to the LC-Protocol (Jack and Bush, 2007).
Alkaloids of ground tobacco samples were extracted by methyl tert-butyl alcohol
(MTBE) and aqueous sodium hydroxide. The MTBE extract was injected into the GC,
and quantification of alkaloids was compared to chemical standards. Samples were
injected in splitless mode at 250 ºC. The carrier gas was helium, and the flow rate was 20
ml min-1. Temperature of flame ionization detector was 250 ºC. GC column was DB-5
(30m (L) × 0.53mm (D) × 1.5µm (FT)) (J&W Scientific). TSNAs analysis were
performed following methylene chloride extraction (Morgan, 2004) .
122
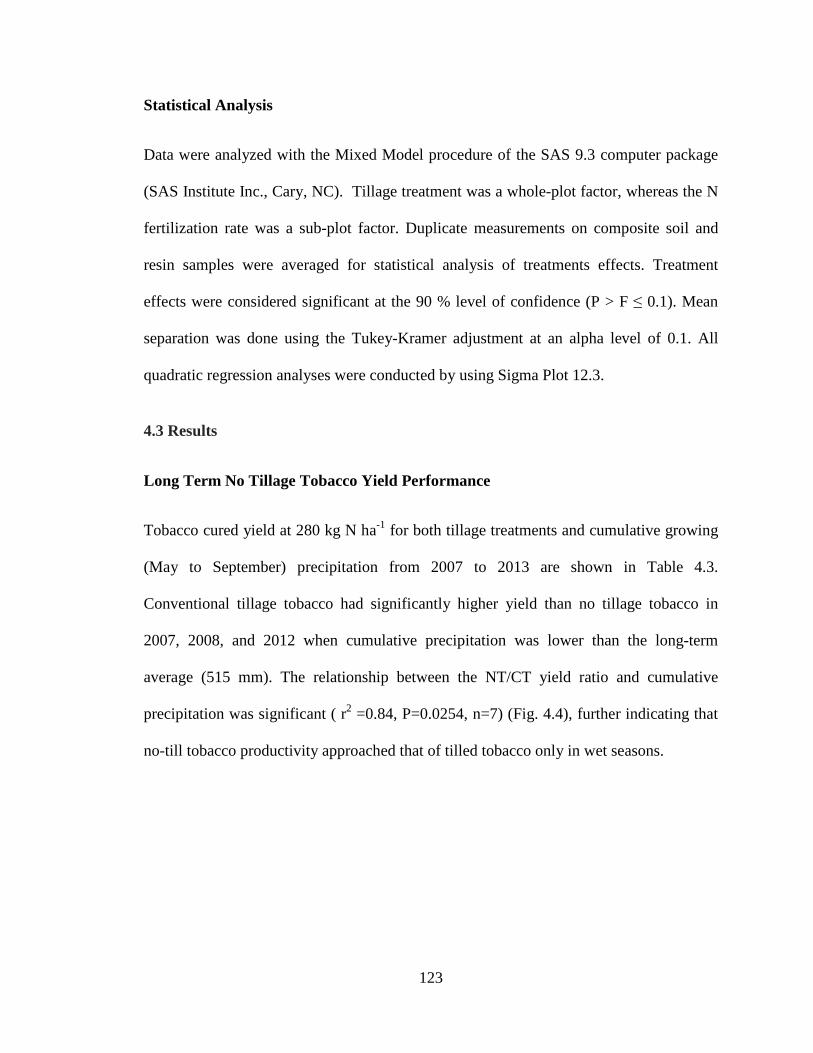
Statistical Analysis
Data were analyzed with the Mixed Model procedure of the SAS 9.3 computer package
(SAS Institute Inc., Cary, NC). Tillage treatment was a whole-plot factor, whereas the N
fertilization rate was a sub-plot factor. Duplicate measurements on composite soil and
resin samples were averaged for statistical analysis of treatments effects. Treatment
effects were considered significant at the 90 % level of confidence (P > F ≤ 0.1). Mean
separation was done using the Tukey-Kramer adjustment at an alpha level of 0.1. All
quadratic regression analyses were conducted by using Sigma Plot 12.3.
4.3 Results
Long Term No Tillage Tobacco Yield Performance
Tobacco cured yield at 280 kg N ha-1 for both tillage treatments and cumulative growing
(May to September) precipitation from 2007 to 2013 are shown in Table 4.3.
Conventional tillage tobacco had significantly higher yield than no tillage tobacco in
2007, 2008, and 2012 when cumulative precipitation was lower than the long-term
average (515 mm). The relationship between the NT/CT yield ratio and cumulative
precipitation was significant ( r2 =0.84, P=0.0254, n=7) (Fig. 4.4), further indicating that
no-till tobacco productivity approached that of tilled tobacco only in wet seasons.
123

Table 4.3 Tobacco cured leaf yield as related to at a 280 kg N ha-1 application rate
Yield Tillage Pr > F Cumulative precipitation
Conventional No-till (May-September)
----------kg ha-1----------
-------mm-------
2007 3508 2647 0.0197 351 2008 2128 1366 0.0017 330 2009 2725 2680 0.5999 688 2010 2866 2373 0.1347 523 2011 1998 2146 0.3822 610 2012 3293 2891 0.0853 432 2013 2756 2896 0.1559 706
Figure 4.4 Relationship between the NT/CT yield ratio and May to September
cumulative precipitation from 2007 to 2013
124

Table 4.4 Analysis of variance (P >F) for agronomic parameters, plant available nitrogen supply, and leaf chemistry parameters.
Variable Agronomic Parameters Plant Available Nitrogen Supply Cured Leaf Chemistry Parameters
Yield SPAD at TD† TN at TD NO3-N at TD SD§1 SD2 SD3 SD4 NO3-N Alkaloids Nicotine TSNAs
2012 Tillage 0.0187 0.0469 0.0002 0.0369 0.0005 0.3724 0.1656 0.9627 0.0597 0.0506 0.1253 0.1104 N Rate
<.0001 <.0001 <.0001 <.0001
N/A‡ <.0001 <.0001 <.0001
<.0001 0.0020 0.0032 <.0001
Tillage × N Rate
0.0868 0.0001 0.0098 0.8823
N/A 0.0498 0.1332 0.4597
0.5472 0.0360 0.0604 0.3361
2013 Tillage
0.2196 0.8549 0.8286 0.0988
0.0524 0.4605 0.3325 0.6242
0.7309 0.2936 0.5419 0.0429
N Rate
<.0001 <.0001 0.0283 0.1548
0.0048 <.0001 <.0001 <.0001
<.0001 <.0001 <.0001 0.1118 Tillage × N Rate 0.9472 0.8805 0.1679 0.0500 0.0025 0.1071 0.4391 0.0453 0.6722 0.6006 0.6526 0.0597
N/A‡ refers to not applicable in 2012, there was only one composite soil baseline sample for all three N fertilization rates because N treatment was not applied before that day. TD† refers to measure made at tobacco topping day. SD§ refers to sampling date.
125

Agronomic Parameters
The response of tobacco cured leaf yield to tillage and N fertilization rate was not the
same for 2012 as in 2013 (Table 4.4). In 2012, total yield was significantly affected by
both tillage and N fertilization rate, and there was a significant tillage by N rate
interaction (Fig. 4.5). At 0 kg N ha-1, leaf yield with tillage was significantly higher than
with no-tillage, while there was no difference due to tillage at 140 or 280 kg N ha-1. In
2012 other agronomic parameters, including SPAD reading, leaf TN, and leaf NO3-N at
topping, had a similar response to tillage and N fertilization rate as leaf yield (Table 4.4,
Figures 4.6a, 4.7a, and 4.8a). However, in 2013, only N fertilization rate significantly
affected leaf yield (Fig. 4.5b). There was no significant tillage effect and there was no
tillage by N rate interaction. The 2013 SPAD readings showed a similar response pattern
(Fig. 4.6b). The 2013 leaf TN showed no difference between no-till and tilled tobacco at
any N rate (Fig. 4.7b). The 2013 leaf NO3-N for tilled tobacco was significantly higher
only at 280 kg N ha-1 (Fig. 4.8b). In general, these agronomic parameters were
numerically higher in 2012 than in 2013.
126

Figure 4.5 Tobacco leaf yield response to tillage and fertilizer N rate in 2012 (a) and
2013 (b). Values followed by the same letter are not significantly different (α ≤ 0.1).
Figure 4.6 SPAD reading at topping response to tillage and fertilizer N rate in 2012 (a)
and 2013 (b). Values followed by the same letter are not significantly different (α ≤ 0.1).
127

Figure 4.7 Leaf TN at topping response to tillage and fertilizer N rate in 2012 (a) and
2013 (b). Values followed by the same letter are not significantly different (α ≤ 0.1).
Figure 4.8 Leaf NO3-N at topping response to tillage and fertilizer N rate in 2012 (a) and
2013 (b). Values followed by the same letter are not significantly different (α ≤ 0.1).
128

Plant Available Nitrogen (PAN) Supply
The response of PAN supply to tillage and N fertilizer rate is shown in Table 4.4 and
Figure 4.9. Tillage had a significant effect on PAN only at SD 1 in both years. Except for
SD 1, PAN supply was significantly affected largely by N fertilizer rate during the
tobacco growth period. The relationships between no-till and tilled tobacco yield and
PAN supply in 2012 and 2013 are illustrated in Figure 4.10. These relationships were all
well modeled by a quadratic polynomial. In general, 2012 tobacco had greater yield
potential but numerically lower PAN than 2013 tobacco. Tilled tobacco exhibited
generally greater yield than no-till tobacco in 2012, but in 2013 there was evidence of
substantial tobacco yield ‘overlap’ between the two tillage treatments (Fig. 4.10).
129

Figure 4.9 Plant available nitrogen supply for conventional tillage and no tillage during the tobacco growth period in 2012(a) and
2013 (b). Values within a single sampling date, for a given year, followed by the same letter are not significantly different (α ≤ 0.1).
Note: the scales for plant available nitrogen are different for 2012 and 2013.
130

Figure 4.10 Relationship between tobacco yield and plant available nitrogen supply for
no tillage and conventional tillage production in 2012 and 2013.
Air-Cured Leaf Chemistry Parameters
The responses of air-cured leaf chemical contents to tillage method and N fertilization
rate are shown in Table 4.4 and Figures 4.11 to 4.14. In 2012, tillage significantly
affected air cured leaf NO3-N concentration, and there was also a significant interaction
between tillage and N rate on leaf alkaloid and nicotine levels (Table 4.4). Tobacco-
specific N-nitrosamines (TSNAs) was significantly affected only by N fertilizer rate
(Table 4.4). Like the agronomic parameters, in 2012 no-tillage at 0 kg N ha-1 gave the
lowest values for the four cured leaf chemical parameters (Figs. 4.11-4.14). In 2013, there
was no significant tillage effect on cured leaf NO3-N, alkaloid, or nicotine concentrations
131

(Table 4.4). A significant tillage by N rate interaction on TSNAs was observed in 2013
(Table 4.4). In general, cured leaf chemical concentrations were numerically lower in
2013 than in 2012 (Figs. 4.11-4.14).
Figure 4.11 Cured leaf NO3-N concentration response to tillage and fertilizer N rate in
2012 (a) and 2013 (b). Values followed by the same letter are not significantly different
(α ≤ 0.1).
132

Figure 4.12 Cured leaf alkaloid concentration response to tillage and fertilizer N rate in
2012 (a) and 2013 (b). Values followed by the same letter are not significantly different
(α ≤ 0.1).
Figure 4.13 Cured leaf nicotine concentration response to tillage and fertilizer N rate in
2012 (a) and 2013 (b). Values followed by the same letter are not significantly different
(α ≤ 0.1).
133

Figure 4.14 Cured leaf TSNAs concentration response to tillage and fertilizer N rate in
2012 (a) and 2013 (b). Values followed by the same letter are not significantly different
(α ≤ 0.1).
4.4 Discussion
Agronomic Parameters
No-till burley tobacco production tended to result in lower cured leaf yield in dry
seasons. This result differs from that observed with no-till summer annual grain
production (De Vita et al., 2007). In summer annual grain production, no-tillage tends to
be better than tillage in dry seasons because no-tillage preserves more moisture (Blevins
et al., 1971). The same conservation of soil moisture has also been reported for no-tillage
tobacco (Phillips and Zeleznik, 1989), but this benefit did not result in greater cured leaf
yield, relative to tilled tobacco. In the dry 2012 season, cured leaf yield was significant
higher with tillage than with no-tillage at the 0 kg N/ha fertilizer rate. With increasing
fertilizer N rate, the yield difference due to tillage became smaller. The same response
134

pattern was found leaf SPAD readings, and leaf NO3-N and TN concentrations at
topping. Taken together, the agronomic parameters indicate that no-till tobacco suffered
greater N deficiency at 0 kg N ha-1 in the dry 2012 season (MacKown and Sutton, 1998;
MacKown et al., 1999). However, in the moist 2013 season tillage did not affect cured
leaf yield, leaf SPAD value, or leaf TN concentrations at any N fertilizer rate.
The relationship between yield and PAN supply showed that tilled tobacco had higher N
use efficiency than no-till tobacco in 2012. In situ incubation results showed that there
were no significant differences in PAN supply between tillage methods in either year.
Because tillage did not significantly affect N supply, there must be other reasons why
greater N deficiency was observed in no-till tobacco at 0 kg N ha-1 in 2012. One potential
explanation could be that the tobacco root system was limited by higher surface soil bulk
density with no-tillage (Unger and Kaspar, 1994). Unlike soybean and corn, tobacco
plants have extensively branched non-symmetrical rooting systems, developing
adventitious roots at many angles from the plant base due to transplanting (Bruner, 1932).
Zartman et al.(1976) found that tilled burley tobacco root density tillage was significantly
higher than that for no-till tobacco, especially in the 0 to 15 cm depth increment. The
authors’ unpublished data from roots collected during the 2014 season also supports the
hypothesis that greater tobacco root length and surface area occur with tillage. Most
inorganic N moves to plant roots via mass flow as the plant absorbs water for
transpiration (Barber, 1995). Therefore, in dry seasons, no-till tobacco N uptake might be
limited by reduced root density/surface area. Greater water availability during wet
seasons can make inorganic N more equally accessible to tobacco plants despite root
135

density differences caused by tillage. This explains the increased NT/CT cured leaf yield
ratio with increasing cumulative precipitation during the tobacco growing season.
Plant Available Nitrogen (PAN) Supply
Tilled soil exhibited higher PAN than no-till soil at the first sampling date. The reason for
this is that these baseline samples were taken immediately after tillage. Tillage exposed
soil organic matter to mineralization by soil microbes. However, there was no significant
difference in PAN supply due to tillage at later sampling dates. With plant species that do
not cause biological N fixation, the field PAN supply consists of fertilizer N and N
mineralized from soil organic matter. In this study, where the same fertilizer N rates were
applied in both tillage systems, the equality in PAN supplies with tillage indicates that
divergent trends in mineralization-immobilization turnover in soil and fertilizer N
resulted in this equivalency. This observation, likely fortuitous, differs from many other
reports (El-Haris et al., 1983b; Franzluebbers et al., 1994a; Wienhold and Halvorson,
1999). These reports argue that the no-till SOM pool is typically higher than the pool in
tilled soil, resulting in a higher no-till soil N mineralization potential. Most of these were
laboratory studies using disturbed/sieved samples. Sieving can accelerate SOM
decomposition, resulting in higher no-till soil N mineralization potential (Oorts et al.,
2006). The in situ resin core method better reflects field conditions, especially soil
structure (Raison et al., 1987a), preserving physical sequestration of labile SOM.
Consequently, although no-till soil has more SOM than tilled soil (Bernacchi et al.,
2005), intact conditions might keep aggregate SOM physically protected from
microorganisms and enhanced aeration. Rice and Smith (1984) and Rice et al. (1986) also
reported equal N availability in both no-till and tilled soil using a 15N dilution method.
136

The greater no-till SOM pools do not necessarily guarantee greater soil N mineralization
under field conditions, as those organic N pools may not be accessible to soil microbes.
The PAN supply was higher during the 2013 tobacco growth season. This difference
could be due to seasonal precipitation. There were 432 mm and 706 mm of cumulative
(May to September) precipitation in 2012 and 2013, respectively. Increasing soil
moisture would promote N mineralization (Jin et al., 2013). However, tobacco yield was
higher in 2012 than 2013. Though there could be several reasons for this seasonal
response pattern, including other weather factors, the main limiting factor to tobacco
yield was N nutrition. Given this, the result suggests that the in situ resin method
overestimates PAN supply. The function of a resin bag at the bottom of the soil core is to
capture inorganic N leaching from the soil column. But during heavy rainfall events the
inorganic N captured by resin bag would otherwise have been leached from the tobacco
root zone. A greater fraction of inorganic N was absorbed by the resin, rather than
contained in soil above the resin, in 2013 than in 2012.
Air-Cured Leaf Chemistry Parameters
Cured leaf chemical composition is an important determinant of tobacco leaf usability.
Most tobacco alkaloids are synthetized in the root, especially in elongating root tips (Solt,
1957; Dawson and Solt, 1959; Flores et al., 1999). Tso (1990) suggested that soil
conditions during root development could also affect alkaloid levels. Changes in
structure, moisture, penetration resistance, and the rhizosphere caused by different tillage
practices might affect alkaloid levels. In 2012, tillage significantly affected cured leaf
NO3-N concentration and the influence of tillage on alkaloid and nicotine levels
137

depended also on N fertilizer rate. This might be the result of the low N uptake capacity
caused by no-tillage, as tillage had no significant effect on cured leaf NO3-N, alkaloid,
and nicotine concentrations in 2013. The N fertilizer rate significantly affected these
three leaf chemical components in both years. This result suggests that fertilizer N
management is more crucial than tillage in alkaloid synthesis, and that root development
differences due to tillage might be not be enough to affect secondary tobacco metabolites.
Tobacco TNSAs levels were significantly affected by N rate in 2012, but not in 2013,
probably because TSNAs concentrations are relatively low compared to NO3-N, nicotine,
and alkaloids. Also, TSNAs formation occurs mainly during leaf curing (Burton et al.,
1989b), which is dependent on humidity, temperature, and the design of the tobacco
curing barn. This makes very difficult the identification of agronomic management
effects on TSNAs without large scale data collection.
4.5 Conclusion
Unlike no-till summer grain crop production, no-till burley tobacco production did not
derive a yield benefit from soil moisture conservation in dry seasons. Instead, the low
tobacco root density caused by higher soil bulk density and penetration resistance in no-
tillage can limit tobacco N uptake capacity in dry seasons, subsequently resulting in
tobacco N deficiency. Although tobacco cured leaf yield and chemistry were mainly
controlled by N fertilizer rate management, tillage could affect tobacco cured leaf yield
and chemistry by influencing N uptake. The impact of this effect is especially noticeable
at low N fertilizer rates in dry seasons. This N deficiency could be overcome by
appropriate N fertilizer intervention, such as N side dressing or banding, and other
agronomic practices like strip tillage or irrigation. The effects of tillage on tobacco root
138

development, at different N fertilization rates and under different weather conditions,
should be further examined to improve N nutrition management for no-tillage tobacco
production.
139

Chapter 5: Conclusion
Grower profit and environmental protection are two major concerns for sustainable
agricultural production. Soil N dynamics bridge these two concerns because N is a major
element to plant nutrition and is also a greenhouse gas and surface and groundwater
pollutant component. Conservation tillage, crop rotation, and proper N fertilizer rate
management are effective at regulating soil N dynamics in sustainable agro-ecosystems.
To better understand the influence of agronomic practices on crop N nutrition, three
mechanisms were proposed: (1) an influence on soil organic matter; (2) an influence on
soil N availability; and (3) an influence on crop N uptake capacity. A burley tobacco
tillage and rotation study established in 2007 and a corn tillage by fertilizer N rate study
established in1970 were used in this research to evaluate the three mechanisms.
Conservation tillage, crop rotation, and N fertilization rate affected SOM sequestration
differently. No-tillage and rotation increased SOM (Chapter 2), while the effect of N
fertilization on SOM depended on both application time and amount. In burley tobacco
production, a one-year N fertilizer application difference (0 versus 280 kg N ha-1) did not
cause differences in SOM (Chapter 2). In the corn study, 42 years of N fertilizer rate
difference did not cause differences in SOM between 0 and 84 kg N ha-1, while 336 kg N
ha-1 significantly increased SOM(Chapter 3, part II ).
Increased SOM did not always contribute to soil N availability. Although conservation
tillage can increase SOC and TSN stocks in surface soil, no-till did not necessarily
increase PAN supply under field conditions (Chapter 3, part I and Chapter 4). The
140

increased SOM resulting from conservation tillage was mainly found in macroaggregates
(Chapter 2), which can cause that SOM to be resistant to microbial decomposition.
Soil N availability might not be the only factor affecting crop N nutrition and yield that
was influenced by agronomic practices. In Chapter 4, similar PAN supply between the
two tillage methods suggested that tobacco N deficiency was due mainly to N uptake
capacity differences. In 2014, tobacco root architecture analysis confirmed that the higher
no-till soil bulk density could result in less root soil exploration. Thus, banding or other N
nutrition management practices should be recommended for no-till tobacco production.
Systematically evaluating these three mechanisms gave insight on how agronomic
practices affect crop N nutrition and illustrated improved strategies to balance farmer
profit with environmental benefits.
Other Lessons from This Dissertation
1. Different crop residues might have different effects on NSNM because the quality
(C:N ratio) of the residue can influence the direction of NSNM (Chapter 3, part I).
Therefore, including previous crop residues would be beneficial to soil N dynamic
evaluations for different rotation regimes.
2. To study the effect of fertilizer N application on NSNM, the separation of
previous and current fertilizer N rate management was required because these
affect NSNM differently (Chapter 3, part II). Previous fertilizer N application
influences background SOM/labile SOM levels, while the current fertilizer N
application might have a priming effect on NSNM, depending on the current N
rate and the SOM level.
141

3. From a plant nutrition management standpoint, crop differentiation may be
beneficial when conservation plans are applied to agricultural production systems.
Different crops have different root architectures and response plasticity to
imposed soil management, which can affect root nutrition uptake capacity.
A Proposed ABIT Model to Understand Factors Affecting Soil N Mineralization
Figure 5.1 The ABIT model proposed to understand factors affecting soil N
mineralization
That soil N mineralization can be affected by abiotic and biotic factors and their
interactions is well known. However, there is benefit to visualizing this in a diagram. The
crop and soil management impacts on soil N mineralization affect not only a single factor
in the ABIT model framework, but simultaneously change several factors. For an
example, no-tillage management could affect mineralization substrate (SOM), soil
temperature, and soil moisture, all at the same time. Figure 5.1 can clarify factors
influenced by agronomic practices. Furthermore, this diagram illustrates the reliability of
142

methods estimating NSNM and the hazards of interpreting the results. Soil sample
pretreatment during NSNM estimation can artificially affect some of these factors, as
compared to natural field soil conditions.
In this diagram abiotic factors include (but are not limited to) temperature, moisture,
aeration, pH and fertilizer addition; biotic factors include (but are not limited to)
substrate, microorganism quantity and quality, fauna, enzyme quantity and quality and
rhizosphere quantity and quality. There are three types of interactions: interactions among
abiotic factors; interactions among biotic factors; and interactions between abiotic and
biotic factors. The ABIT framework also includes time as a factor. Different biological
incubation times can give different results when comparing management practices
(Chapter 3, part I). Therefore, the proper incubation period length in NSNM studies
should be taken into account to limit flawed decisions in soil N fertility management.
143

References
Adams, M., Attiwill, P., 1986. Nutrient cycling and nitrogen mineralization in eucalypt
forests of south-eastern Australia. Plant and Soil 92, 341-362.
Allison, F., Sterling, L.D., 1949. Nitrate formation from soil organic matter in relation to
total nitrogen and cropping practices. Soil Science 67, 239-252.
Amundson, R., 2001. The carbon budget in soils. Annual Review of Earth and Planetary
Sciences 29, 535-562.
Anders, M., Brye, K., Olk, D.C., Schmid, B.T., 2012. Rice rotation and tillage effects on
soil aggregation and aggregate carbon and nitrogen dynamics. Soil Science Society of
America journal.
Andersen, R., Burton, H., Fleming, P., Hamilton-Kemp, T., Gay, S., 1986. Effects of air-
curing environment on alkaloid-derived nitrosamines in burley tobacco. IARC
scientific publications, 451-455.
Andrade, D.S., Colozzi-Filho, A., Giller, K.E., 2003. The soil microbial community and
soil tillage. Soil tillage in agroecosystems, 51-81.
Angers, D.A., Giroux, M., 1996. Recently deposited organic matter in soil water-stable
aggregates. Soil Science Society of America Journal 60, 1547-1551.
Arnold, J., Corre, M.D., Veldkamp, E., 2008. Cold storage and laboratory incubation of
intact soil cores do not reflect in-situ nitrogen cycling rates of tropical forest soils. Soil
Biology and Biochemistry 40, 2480-2483.
Arshad, M., Franzluebbers, A., Azooz, R., 1999. Components of surface soil structure
under conventional and no-tillage in northwestern Canada. Soil and Tillage Research
53, 41-47.
144

Bajracharya, R., Lal, R., Kimble, J., 1997. Soil organic carbon distribution in aggregates
and primary particle fractions as influenced by erosion phases and landscape position.
CRC Press. Boca Raton, USA.
Balkcom, K.S., Blackmer, A.M., Hansen, D.J., Morris, T.F., Mallarino, A.P., 2003.
Testing soils and cornstalks to evaluate nitrogen management on the watershed scale.
Journal of environmental quality 32, 1015-1024.
Balota, E.L., Colozzi Filho, A., Andrade, D.S., Dick, R.P., 2004. Long-term tillage and
crop rotation effects on microbial biomass and C and N mineralization in a Brazilian
Oxisol. Soil and Tillage Research 77, 137-145.
Banwart, S.A., Noellemeyer, E., Milne, E., 2014. Soil carbon: Science, management and
policy for multiple benefits. CABI.
Barber, S.A., 1995. Soil nutrient bioavailability: a mechanistic approach. John Wiley &
Sons.
Barthes, B., Roose, E., 2002. Aggregate stability as an indicator of soil susceptibility to
runoff and erosion; validation at several levels. Catena 47, 133-149.
Bationo, A., 2004. Managing nutrient cycles to sustain soil fertility in Sub-Saharan Africa.
CIAT.
Bauer, A., Black, A., 1994. Quantification of the effect of soil organic matter content on
soil productivity. Soil Science Society of America Journal 58, 185-193.
Beare, M., Hendrix, P., Coleman, D., 1994a. Water-stable aggregates and organic matter
fractions in conventional-and no-tillage soils. Soil Science Society of America Journal
58, 777-786.
145

Beare, M.H., Hendrix, P.F., Cabrera, M.L., Coleman, D.C., 1994b. Aggregate-protected
and unprotected organic matter pools in conventional- and no-tillage soils. Soil
Science Society of America Journal 58, 787-795.
Beauchamp, E., Reynolds, W., Brasche-Villeneuve, D., Kirby, K., 1986. Nitrogen
mineralization kinetics with different soil pretreatments and cropping histories. Soil
Science Society of America Journal 50, 1478-1483.
Bernacchi, C.J., Hollinger, S.E., Meyers, T., 2005. The conversion of the corn/soybean
ecosystem to no-till agriculture may result in a carbon sink. Global Change Biology 11,
1867-1872.
Beyrouty, C., Nelson, D., Sommers, L., 1986. Transformations and losses of fertilizer
nitrogen on no-till and conventional till soils. Fertilizer Research 10, 135-146.
Binkley, D., Hart, S.C., 1989. The components of nitrogen availability assessments in
forest soils. Advances in soil science. Springer, pp. 57-112.
Bissonnais, Y.l., 1996. Aggregate stability and assessment of soil crustability and
erodibility: I. Theory and methodology. European Journal of Soil Science 47, 425-437.
Blair, G.J., Lefroy, R.D., Lisle, L., 1995. Soil carbon fractions based on their degree of
oxidation, and the development of a carbon management index for agricultural
systems. Crop and Pasture Science 46, 1459-1466.
Blevins, R., Cook, D., Phillips, S., Phillips, R., 1971. Influence of no-tillage on soil
moisture. Agronomy Journal 63, 593-596.
Blevins, R., Thomas, G., Smith, M., Frye, W., Cornelius, P., 1983. Changes in soil
properties after 10 years continuous non-tilled and conventionally tilled corn. Soil and
Tillage Research 3, 135-146.
146

Boix-Fayos, C., Calvo-Cases, A., Imeson, A., Soriano-Soto, M., 2001. Influence of soil
properties on the aggregation of some Mediterranean soils and the use of aggregate
size and stability as land degradation indicators. Catena 44, 47-67.
Boukcim, H., Plassard, C., 2003. Juvenile nitrogen uptake capacities and root architecture
of two open-pollinated families ofPicea abies. Effects of nitrogen source and
ectomycorrhizal symbiosis. Journal of plant physiology 160, 1211-1218.
Bremmer, J., 1965. Nitrogen availability indexes. Methods of soil analysis, part 2, 1324-
1345.
Bronick, C.J., Lal, R., 2005. Soil structure and management: a review. Geoderma 124, 3-
22.
Brown, K.H., Bach, E.M., Drijber, R.A., Hofmockel, K.S., Jeske, E.S., Sawyer, J.E.,
Castellano, M.J., 2014. A long-term nitrogen fertilizer gradient has little effect on soil
organic matter in a high-intensity maize production system. Global change biology 20,
1339-1350.
Bruner, W., 1932. Root development of cotton, peanuts and tobacco in central Oklahoma.
Proc OK Acad Sc 20.
Bruns, H.A., 2012. Concepts in crop rotations. INTECH Open Access Publisher.
Brye, K., Olk, D.C., Schmid, B.T., 2012. Rice rotation and tillage effects on soil
aggregation and aggregate carbon and nitrogen dynamics. Soil Science Society of
America Journal 76, 994-1004.
Bundy, L., Meisinger, J., 1994. Nitrogen availability indices. Methods of Soil Analysis:
Part 2—Microbiological and Biochemical Properties, 951-984.
Burke, J., Connections, L., 1978. Brown and Company. Boston.
147

Burton, H.R., Bush, L.P., Djordjevic, M.V., 1989a. Influence of temperature and humidity
on the accumulation of tobacco-specific nitrosamines in stored burley tobacco. Journal
of agricultural and food chemistry 37, 1372-1377.
Burton, H.R., Childs Jr, G.H., Andersen, R.A., Fleming, P.D., 1989b. Changes in
chemical composition of burley tobacco during senescence and curing. 3. Tobacco-
specific nitrosamines. Journal of agricultural and food chemistry 37, 426-430.
Bushong, J., Roberts, T., Ross, W., Norman, R., Slaton, N., Wilson, C., 2008. Evaluation
of distillation and diffusion techniques for estimating hydrolyzable amino sugar-
nitrogen as a means of predicting nitrogen mineralization. Soil Science Society of
America Journal 72, 992-999.
Çakir, R., Çebi, U., 2010. The effect of irrigation scheduling and water stress on the
maturity and chemical composition of Virginia tobacco leaf. Field Crops Research 119,
269-276.
Cambardella, C., Elliott, E., 1992. Particulate soil organic-matter changes across a
grassland cultivation sequence. Soil Science Society of America Journal 56, 777-783.
Cambardella, C., Elliott, E., 1993a. Carbon and nitrogen distribution in aggregates from
cultivated and native grassland soils. Soil Science Society of America Journal 57,
1071-1076.
Cambardella, C., Elliott, E., 1993b. Methods for physical separation and characterization
of soil organic matter fractions. Geoderma 56, 449-457.
Campbell, C., Myers, R., Curtin, D., 1995. Managing nitrogen for sustainable crop
production. Fertilizer Research 42, 277-296.
148

Carpenter-Boggs, L., Pikul, J.L., Vigil, M.F., Riedell, W.E., 2000. Soil nitrogen
mineralization influenced by crop rotation and nitrogen fertilization. Soil Science
Society of America Journal 64, 2038-2045.
Cassman, K.G., Munns, D.N., 1980. Nitrogen mineralization as affected by soil moisture,
temperature, and depth. Soil Science Society of America Journal 44, 1233-1237.
Castro Filho, C., Lourenço, A., Guimarães, M.d.F., Fonseca, I., 2002. Aggregate stability
under different soil management systems in a red latosol in the state of Parana, Brazil.
Soil and Tillage Research 65, 45-51.
Chamberlain, W., Chortyk, O., 1992. Effects of curing and fertilization on nitrosamine
formation in bright and burley tobacco. Beiträge zur Tabakforschung international 15,
87-92.
Chan, K., Heenan, D., 1999. Microbial-induced soil aggregate stability under different
crop rotations. Biology and Fertility of Soils 30, 29-32.
Chen, R., Senbayram, M., Blagodatsky, S., Myachina, O., Dittert, K., Lin, X.,
Blagodatskaya, E., Kuzyakov, Y., 2014. Soil C and N availability determine the
priming effect: microbial N mining and stoichiometric decomposition theories. Global
change biology 20, 2356-2367.
Clark, R.T., MacCurdy, R.B., Jung, J.K., Shaff, J.E., McCouch, S.R., Aneshansley, D.J.,
Kochian, L.V., 2011. Three-dimensional root phenotyping with a novel imaging and
software platform. Plant Physiology 156, 455-465.
Cole, C., Duxbury, J., Freney, J., Heinemeyer, O., Minami, K., Mosier, A., Paustian, K.,
Rosenberg, N., Sampson, N., Sauerbeck, D., 1997. Global estimates of potential
149

mitigation of greenhouse gas emissions by agriculture. Nutrient Cycling in
Agroecosystems 49, 221-228.
Cook, A., Marriott, C., Seel, W., Mullins, C., 1996. Effects of soil mechanical impedance
on root and shoot growth of Lolium perenne L., Agrostis capillaris and Trifolium
repens L. Journal of experimental botany 47, 1075-1084.
Crutchfield, J.D., Grove, J.H., 2011. A new cadmium reduction device for the microplate
determination of nitrate in water, soil, plant tissue, and physiological fluids. Journal of
AOAC International 94, 1896-1905.
Culman, S.W., Snapp, S.S., Freeman, M.A., Schipanski, M.E., Beniston, J., Lal, R.,
Drinkwater, L.E., Franzluebbers, A.J., Glover, J.D., Grandy, A.S., 2012.
Permanganate oxidizable carbon reflects a processed soil fraction that is sensitive to
management. Soil Science Society of America Journal 76, 494-504.
Curtin, D., Campbell, C., Jalil, A., 1998. Effects of acidity on mineralization: pH-
dependence of organic matter mineralization in weakly acidic soils. Soil Biology and
Biochemistry 30, 57-64.
Curtin, D., McCallum, F., 2004. Biological and chemical assays to estimate nitrogen
supplying power of soils with contrasting management histories. Soil Research 42,
737-746.
Curtin, D., Wen, G., 1999. Organic matter fractions contributing to soil nitrogen
mineralization potential. Soil Science Society of America Journal 63, 410-415.
Curwen, E.C., 1953. Prehistoric Farming of Europe and the Near East. Pt. I., Plough and
pasture, the early history of farming. New York: Henry Schuman, 3-147.
150

Dancer, W., Peterson, L., Chesters, G., 1973. Ammonification and nitrification of N as
influenced by soil pH and previous N treatments. Soil Science Society of America
Journal 37, 67-69.
Dawson, R., Solt, M.L., 1959. Estimated contributions of root and shoot to the nicotine
content of the tobacco plant. Plant Physiology 34, 656.
de Dorlodot, S., Forster, B., Pagès, L., Price, A., Tuberosa, R., Draye, X., 2007. Root
system architecture: opportunities and constraints for genetic improvement of crops.
Trends in plant science 12, 474-481.
de Godoy Lusso, M.F., Hayes, A., Lion, K., Davis, G., Hart, F., Morris, J.W., 2014.
Methods of reducing tobacco-specific nitrosamines(TSNAs) and/or improving leaf
quality in tobacco. Google Patents.
De Vita, P., Di Paolo, E., Fecondo, G., Di Fonzo, N., Pisante, M., 2007. No-tillage and
conventional tillage effects on durum wheat yield, grain quality and soil moisture
content in southern Italy. Soil and Tillage Research 92, 69-78.
Derpsch, R., Friedrich, T., Kassam, A., Li, H., 2010. Current status of adoption of no-till
farming in the world and some of its main benefits. International Journal of
Agricultural and Biological Engineering 3, 1-25.
Dersch, G., Böhm, K., 2001. Effects of agronomic practices on the soil carbon storage
potential in arable farming in Austria. Nutrient Cycling in Agroecosystems 60, 49-55.
DiStefano, J.F., Gholz, H., 1986. A proposed use of ion exchange resins to measure
nitrogen mineralization and nitrification in intact soil cores. Communications in Soil
Science & Plant Analysis 17, 989-998.
151

Doran, J.W., Parkin, T.B., 1994. Defining and assessing soil quality. Defining soil quality
for a sustainable environment, 1-21.
Dou, H., Alva, A., Khakural, B., 1997. Nitrogen mineralization from citrus tree residues
under different production conditions. Soil Science Society of America Journal 61,
1226-1232.
Duiker, S.W., Beegle, D.B., 2006. Soil fertility distributions in long-term no-till,
chisel/disk and moldboard plow/disk systems. Soil and Tillage Research 88, 30-41.
El-Haris, M., Cochran, V., Elliott, L., Bezdicek, D., 1983a. Effect of tillage, cropping, and
fertilizer management on soil nitrogen mineralization potential. Soil Science Society
of America Journal 47, 1157-1161.
El-Haris, M.K., Cochran, V.L., Elliott, L.F., Bezdicek, D.F., 1983b. Effect of tillage,
cropping, and fertilizer management on soil nitrogen mineralization potential1. Soil
Science Society of America Journal 47, 1157-1161.
Elliott, E., Palm, C., Reuss, D., Monz, C., 1991. Organic matter contained in soil
aggregates from a tropical chronosequence: correction for sand and light fraction.
Agriculture, Ecosystems & Environment 34, 443-451.
Eno, C.F., 1960. Nitrate production in the field by incubating the soil in polyethylene bags.
Soil Science Society of America Journal 24, 277-279.
Epstein, E., 1972. Mineral nutrition of plants: principles and perspectives.
Erisman, J.W., Sutton, M.A., Galloway, J., Klimont, Z., Winiwarter, W., 2008. How a
century of ammonia synthesis changed the world. Nature Geoscience 1, 636-639.
Flores, H.E., Vivanco, J.M., Loyola-Vargas, V.M., 1999. ‘Radicle'biochemistry: the
biology of root-specific metabolism. Trends in plant science 4, 220-226.
152

Fox, R.H., Piekielek, W.P., 1988. Fertilizer N equivalence of alfalfa, birdsfoot trefoil, and
red clover for succeeding corn crops. Journal of Production Agriculture 1, 313-317.
Foy, C., Carson, E., 1974. The plant root and its environment. The plant root and its
environment.
Franzen, D.W., 2010. North Dakota Fertilizer Recommendation: Tables and Equations.
Franzluebbers, A., Hons, F., 1996. Soil-profile distribution of primary and secondary
plant-available nutrients under conventional and no tillage. Soil and Tillage Research
39, 229-239.
Franzluebbers, A., Hons, F., Zuberer, D., 1994a. Seasonal changes in soil microbial
biomass and mineralizable C and N in wheat management systems. Soil Biology and
Biochemistry 26, 1469-1475.
Franzluebbers, A.J., Hons, F.M., Zuberer, D.A., 1994b. Long-term changes in soil carbon
and nitrogen pools in wheat management systems. Soil Science Society of America
Journal 58, 1639-1645.
Gabriel, C., Kellman, L., 2011. Examining moisture and temperature sensitivity of soil
organic matter decomposition in a temperate coniferous forest soil. Biogeosciences
Discussions 8, 1369-1409.
Gajri, P., Arora, V., Prihar, S., 1992. Tillage management for efficient water and nitrogen
use in wheat following rice. Soil and Tillage Research 24, 167-182.
Galloway, J.N., Cowling, E.B., 2002. Reactive nitrogen and the world: 200 years of
change. AMBIO: A Journal of the Human Environment 31, 64-71.
Gastal, F., Lemaire, G., 2002. N uptake and distribution in crops: an agronomical and
ecophysiological perspective. Journal of Experimental Botany 53, 789-799.
153

Gill, K., Jarvis, S., Hatch, D., 1995. Mineralization of nitrogen in long-term pasture soils:
effects of management. Plant and Soil 172, 153-162.
Giller, K.E., Cadisch, G., Ehaliotis, C., Adams, E., Sakala, W.D., Mafongoya, P.L., 1997.
Building soil nitrogen capital in Africa. Replenishing soil fertility in Africa, 151-192.
Goncalves, J., Carlyle, J., 1994. Modelling the influence of moisture and temperature on
net nitrogen mineralization in a forested sandy soil. Soil Biology and Biochemistry 26,
1557-1564.
Graham, M., Haynes, R., Meyer, J., 2002. Soil organic matter content and quality: effects
of fertilizer applications, burning and trash retention on a long-term sugarcane
experiment in South Africa. Soil biology and biochemistry 34, 93-102.
Griffin, T., Honeycutt, C., Albrecht, S., Sistani, K., Torbert, H., Wienhold, B., Woodbury,
B., Hubbard, R., Powell, J.M., 2007. Nationally coordinated evaluation of soil
nitrogen mineralization rate using a standardized aerobic incubation protocol.
Communications in soil science and plant analysis 39, 257-268.
Griffin, T.S., 2008. Nitrogen availability. Nitrogen in Agricultural Systems, 613-646.
Griffith, D.R., Mannering, J.V., Moldenhauer, W.C., 1977. Conservation tillage in the
eastern Corn Belt [United States]. Journal of soil and water conservation.
Guan, D., Al-Kaisi, M.M., Zhang, Y., Duan, L., Tan, W., Zhang, M., Li, Z., 2014. Tillage
practices affect biomass and grain yield through regulating root growth, root-bleeding
sap and nutrients uptake in summer maize. Field Crops Research 157, 89-97.
Guo, P.G., Xia, Y.S., Li, R.H., Lü, Y.H., Qiu, M.W., Zhao, W.C., Yu, Y.W., 2013.
Assessment of tobacco specific nitrosamines in tobacco genotypes. Advanced
Materials Research 641, 871-874.
154

Halvorson, A.D., Wienhold, B.J., Black, A.L., 2002. Tillage, nitrogen, and cropping
system effects on soil carbon sequestration. Soil Science Society of America Journal
66, 906-912.
Hanselman, T.A., Graetz, D.A., Obreza, T.A., 2004. A comparison of in situ methods for
measuring net nitrogen mineralization rates of organic soil amendments. Journal of
environmental quality 33, 1098-1105.
Hart, S.C., Stark, J.M., Davidson, E.A., Firestone, M.K., 1994. Nitrogen mineralization,
immobilization, and nitrification. Methods of Soil Analysis: Part 2—Microbiological
and Biochemical Properties, 985-1018.
Hassink, J., 1994. Active organic matter fractions and microbial biomass as predictors of
N mineralization. European Journal of Agronomy 3, 257-265.
Hatch, D., Jarvis, S., Philipps, L., 1990. Field measurement of nitrogen mineralization
using soil core incubation and acetylene inhibition of nitrification. Plant and Soil 124,
97-107.
Haynes, R., Naidu, R., 1998. Influence of lime, fertilizer and manure applications on soil
organic matter content and soil physical conditions: a review. Nutrient Cycling in
Agroecosystems 51, 123-137.
Heumann, S., Böttcher, J., Springob, G., 2002. N mineralization parameters of sandy
arable soils. Journal of Plant Nutrition and Soil Science 165, 441-450.
Hobbs, P.R., Sayre, K., Gupta, R., 2008a. The role of conservation agriculture in
sustainable agriculture.
155
Hobbs, P.R., Sayre, K., Gupta, R., 2008b. The role of conservation agriculture in
sustainable agriculture. Philosophical Transactions of the Royal Society B: Biological
Sciences 363, 543-555.
Hoffmann, D., Hecht, S.S., 1985. Nicotine-derived N-nitrosamines and tobacco-related
cancer: current status and future directions. Cancer research 45, 935-944.
Holland, J.M., 2004. The environmental consequences of adopting conservation tillage in
Europe: reviewing the evidence. Agriculture, Ecosystems & Environment 103, 1-25.
Honeycutt, C., Griffin, T., Wienhold, B.J., Eghball, B., Albrecht, S., Powell, J.M.,
Woodbury, B., Sistani, K., Hubbard, R., Torbert, H., 2005. Protocols for nationally
coordinated laboratory and field research on manure nitrogen mineralization.
Communications in soil science and plant analysis 36, 2807-2822.
Honeycutt, C.W., 1999. Nitrogen Mineralization from Soil Organic Matter and Crop
Residues: Field Validation of Laboratory Predictions. Soil Science Society of America
Journal 63, 134-141.
Horowitz, J., Ebel, R., Ueda, K., 2010. “No-Till” Farming Is a Growing Practice.
Hübner, C., Redl, G., Wurst, F., 1991. In situ methodology for studying N-mineralization
in soils using anion exchange resins. Soil Biology and Biochemistry 23, 701-702.
Jack, A., Bush, L., 2007. The “LC” protocol.<http://www.uky.edu/Ag/Tobacco/Pdf/LC-
Protocol.pdf>.
Janssen, B.H., 1996. Nitrogen mineralization in relation to C:N ratio and decomposability
of organic materials. Plant and Soil 181, 39-45.
156

Jastrow, J., Miller, R., Boutton, T., 1996. Carbon dynamics of aggregate-associated
organic matter estimated by carbon-13 natural abundance. Soil Science Society of
America Journal 60, 801-807.
Jenkinson, D.S., Fox, R.H., Rayner, J.H., 1985. Interactions between fertilizer nitrogen
and soil nitrogen—the so-called ‘priming’ effect. Journal of Soil Science 36, 425-444.
Jin, V.L., Haney, R.L., Fay, P.A., Polley, H.W., 2013. Soil type and moisture regime
control microbial C and N mineralization in grassland soils more than atmospheric
CO2-induced changes in litter quality. Soil Biology and Biochemistry 58, 172-180.
Jordan, D., Miles, R., Hubbard, V., Lorenz, T., 2004. Effect of management practices and
cropping systems on earthworm abundance and microbial activity in Sanborn Field: a
115-year-old agricultural field. Pedobiologia 48, 99-110.
Ju, X.-T., Xing, G.-X., Chen, X.-P., Zhang, S.-L., Zhang, L.-J., Liu, X.-J., Cui, Z.-L., Yin,
B., Christie, P., Zhu, Z.-L., 2009. Reducing environmental risk by improving N
management in intensive Chinese agricultural systems. Proceedings of the National
Academy of Sciences 106, 3041-3046.
Kaleb Rathbone, D., Hoyt, G.D., Darroch, B.A., Wesley Totten, F., Ivors, K.L., 2010.
Effect of nitrogen rate and cultivar on burley tobacco yield and leaf quality. Crop
Management 9, 0-0.
Kanchikerimath, M., Singh, D., 2001. Soil organic matter and biological properties after
26 years of maize–wheat–cowpea cropping as affected by manure and fertilization in a
Cambisol in semiarid region of India. Agriculture, ecosystems & environment 86,
155-162.
157

Karaivazoglou, N.A., Tsotsolis, N.C., Tsadilas, C.D., 2007. Influence of liming and form
of nitrogen fertilizer on nutrient uptake, growth, yield, and quality of Virginia (flue-
cured) tobacco. Field Crops Research 100, 52-60.
Karlen, D.L., Varvel, G.E., Bullock, D.G., Cruse, R.M., 1994. Crop rotations for the 21st
century. In: Donald, L.S. (Ed.), Advances in Agronomy. Academic Press, pp. 1-45.
Kasper, M., Buchan, G., Mentler, A., Blum, W., 2009. Influence of soil tillage systems on
aggregate stability and the distribution of C and N in different aggregate fractions. Soil
and Tillage Research 105, 192-199.
Keeney, D., Bremner, J., 1966. Comparison and evaluation of laboratory methods of
obtaining an index of soil nitrogen availability. Agronomy Journal 58, 498-503.
Keeney, D.R., 1982. Nitrogen—availability indices. Methods of soil analysis. Part 2.
Chemical and microbiological properties, 711-733.
Kemper, W., Rosenau, R., 1986. Aggregate stability and size distribution.
Khan, S., Mulvaney, R., Ellsworth, T., Boast, C., 2007. The myth of nitrogen fertilization
for soil carbon sequestration. Journal of Environmental Quality 36, 1821-1832.
Khanna, P.K., Raison, R.J., 2013. In situ core methods for estimating soil mineral-N
fluxes: Re-evaluation based on 25 years of application and experience. Soil Biology
and Biochemistry 64, 203-210.
Kirschbaum, M.U., 1995. The temperature dependence of soil organic matter
decomposition, and the effect of global warming on soil organic C storage. Soil
Biology and biochemistry 27, 753-760.
Kleber, J.E., 1992. The Kentucky Encyclopedia. University Press of Kentucky.
158

Knoepp, J.D., Vose, J.M., 2007. Regulation of nitrogen mineralization and nitrification in
Southern Appalachian ecosystems: separating the relative importance of biotic vs.
abiotic controls. Pedobiologia 51, 89-97.
Kolberg, R., Rouppet, B., Westfall, D., Peterson, G., 1997. Evaluation of an in situ net soil
nitrogen mineralization method in dryland agroecosystems. Soil Science Society of
America Journal 61, 504-508.
Kolberg, R., Westfall, D., Peterson, G., 1999. Influence of cropping intensity and nitrogen
fertilizer rates on in situ nitrogen mineralization. Soil Science Society of America
Journal 63, 129-134.
Kong, A.Y., Six, J., Bryant, D.C., Denison, R.F., Van Kessel, C., 2005. The relationship
between carbon input, aggregation, and soil organic carbon stabilization in sustainable
cropping systems. Soil Science Society of America Journal 69, 1078-1085.
Kutner, M.H., Nachtsheim, C., Neter, J., 2004. Applied linear regression models.
McGraw-Hill/Irwin.
Lal, R., 1997. Residue management, conservation tillage and soil restoration for
mitigating greenhouse effect by CO2-enrichment. Soil and Tillage Research 43, 81-
107.
Lampurlanés, J., Cantero-Martínez, C., 2003. Soil bulk density and penetration resistance
under different tillage and crop management systems and their relationship with barley
root growth. Agronomy Journal 95, 526-536.
Le Bissonnais, Y., 1996. Aggregate stability and assessment of soil crustability and
erodibility: I. Theory and methodology
159

Stabilité structurale et évaluation de la sensibilité des sols à la battance et à l'érosion: I:
Théorie et méthologie. European Journal of Soil Science 47, 425-437.
Li, Q., Hempfling, W., Krauss, M.R., 2013. Spray and/or soil treatment of tobacco of
reduce TSNAs. Google Patents.
Liao, H., Rubio, G., Yan, X., Cao, A., Brown, K.M., Lynch, J.P., 2001. Effect of
phosphorus availability on basal root shallowness in common bean. Plant and Soil 232,
69-79.
Lin, H., 2014. A New Worldview of Soils. Soil Science Society of America Journal 78,
1831-1844.
Link, L.A., 1984. An evaluation of no-tillage culture for Burley tobacco. Bulletin-Virginia
Agricultural Experiment Station, Virginia Institute and State University (USA).
Linn, D., Doran, J., 1984. Effect of water-filled pore space on carbon dioxide and nitrous
oxide production in tilled and nontilled soils. Soil Science Society of America Journal
48, 1267-1272.
Linquist, B., Singleton, P., Yost, R., Cassman, K., 1997. Aggregate size effects on the
sorption and release of phosphorus in an Ultisol. Soil Science Society of America
Journal 61, 160-166.
Liu, E., Yan, C., Mei, X., Zhang, Y., Fan, T., 2013. Long-term effect of manure and
fertilizer on soil organic carbon pools in dryland farming in Northwest China. PLoS
ONE 8, e56536.
López-Bucio, J., Cruz-Ramı́rez, A., Herrera-Estrella, L., 2003. The role of nutrient
availability in regulating root architecture. Current Opinion in Plant Biology 6, 280-
287.
160

Lü, B., Knoblock, J., Riegel, J.K., 2000. Lü shi chun qiu. Stanford University Press.
Lucas, S., Weil, R., 2012. Can a labile carbon test be used to predict crop responses to
improve soil organic matter management? Agronomy Journal 104, 1160-1170.
Luce, M.S., Whalen, J.K., Ziadi, N., Zebarth, B.J., 2011. Nitrogen dynamics and indices
to predict soil nitrogen supply in humid temperate soils. Advances in Agronomy 112,
55-102.
Lugato, E., Simonetti, G., Morari, F., Nardi, S., Berti, A., Giardini, L., 2010. Distribution
of organic and humic carbon in wet-sieved aggregates of different soils under long-
term fertilization experiment. Geoderma 157, 80-85.
Lupwayi, N., Arshad, M., Rice, W., Clayton, G., 2001. Bacterial diversity in water-stable
aggregates of soils under conventional and zero tillage management. Applied Soil
Ecology 16, 251-261.
Lynch, J., 1995. Root architecture and plant productivity. Plant physiology 109, 7.
Lynch, J.P., 2011. Root phenes for enhanced soil exploration and phosphorus acquisition:
tools for future crops. Plant Physiology 156, 1041-1049.
Ma, B., Dwyer, L.M., Gregorich, E.G., 1999. Soil nitrogen amendment effects on seasonal
nitrogen mineralization and nitrogen cycling in maize production. Agronomy Journal
91, 1003-1009.
MacKown, C.T., Crafts-Brandner, S.J., Sutton, T.G., 1999. Relationships among soil
nitrate, leaf nitrate, and leaf yield of Burley tobacco.
MacKown, C.T., Eivazi, F., Sims, J.L., Bush, L.P., 1984. Tobacco-specific N-
nitrosamines: effect of burley alkaloid isolines and nitrogen fertility management.
Journal of agricultural and food chemistry 32, 1269-1272.
161

MacKown, C.T., Sutton, T.G., 1997. Recovery of fertilizer nitrogen applied to burley
tobacco. Agronomy journal 89, 183-189.
MacKown, C.T., Sutton, T.G., 1998. Using early-season leaf traits to predict nitrogen
sufficiency of burley tobacco. Agronomy Journal 90, 21-27.
Mantelin, S., Touraine, B., 2004. Plant growth-promoting bacteria and nitrate availability:
impacts on root development and nitrate uptake. Journal of experimental Botany 55,
27-34.
Marschner, H., Marschner, P., 2012. Marschner's mineral nutrition of higher plants.
Academic press.
Mehlich, A., 1984. Mehlich 3 soil test extractant: A modification of Mehlich 2 extractant.
Communications in Soil Science & Plant Analysis 15, 1409-1416.
Mendes, I., Bandick, A., Dick, R., Bottomley, P., 1999. Microbial biomass and activities
in soil aggregates affected by winter cover crops. Soil Science Society of America
Journal 63, 873-881.
Mikha, M.M., Rice, C.W., Milliken, G.A., 2005. Carbon and nitrogen mineralization as
affected by drying and wetting cycles. Soil Biology and Biochemistry 37, 339-347.
Miller, A.E., Schimel, J.P., Meixner, T., Sickman, J.O., Melack, J.M., 2005. Episodic
rewetting enhances carbon and nitrogen release from chaparral soils. Soil Biology and
Biochemistry 37, 2195-2204.
Morgan, W.T., Reece,J.B., Risner,C.H., Bennett,C.B., Midgett,C.H., Johnson,K.S.,
Burton, H.R. , 2004. A collaborative study for the determination of tobacco specific
nitrosamines in tobacco. Beit. Tabakforschung 21, 192−203.
162

Morrison, J., Smiley, J., Atkinson, W., Milbocker, D., 1973. no-tillage transplanter.
Tobacco New York.
Mosaddeghi, M., Mahboubi, A., Safadoust, A., 2009. Short-term effects of tillage and
manure on some soil physical properties and maize root growth in a sandy loam soil in
western Iran. Soil and tillage research 104, 173-179.
Mulvaney, R., Khan, S., Ellsworth, T., 2009. Synthetic nitrogen fertilizers deplete soil
nitrogen: a global dilemma for sustainable cereal production. Journal of
Environmental Quality 38, 2295-2314.
Nadelhoffer, K., Giblin, A., Shaver, G., Laundre, J., 1991. Effects of temperature and
substrate quality on element mineralization in six arctic soils. Ecology 72, 242-253.
Ngo, T., Phan, A., Yam, C., Lenhoff, H., 1982. Interference in determination of ammonia
with the hypochlorite-alkaline phenol method of Berthelot. Analytical Chemistry 54,
46-49.
O'Brien, S.L., Jastrow, J.D., 2013. Physical and chemical protection in hierarchical soil
aggregates regulates soil carbon and nitrogen recovery in restored perennial grasslands.
Soil Biology and Biochemistry 61, 1-13.
Oorts, K., Nicolardot, B., Merckx, R., Richard, G., Boizard, H., 2006. C and N
mineralization of undisrupted and disrupted soil from different structural zones of
conventional tillage and no-tillage systems in northern France. Soil Biology and
Biochemistry 38, 2576-2586.
Padmavathy, D., Rao, C., Rao, K.S., 2011. Investigations on Reduction of TSNA in
Burley Tobacco. Der Chemica Sinica 2.
163

Pandey, C., Chaudhari, S., Dagar, J., Singh, G., Singh, R., 2010. Soil N mineralization and
microbial biomass carbon affected by different tillage levels in a hot humid tropic.
Soil and Tillage Research 110, 33-41.
Paustian, K., Six, J., Elliott, E., Hunt, H., 2000. Management options for reducing CO2
emissions from agricultural soils. Biogeochemistry 48, 147-163.
Pearce, R., Zeleznik, J., 1996a. Evaluation of weed control options for no-till Burley
tobacco production Agronomy Research Report: Progress Report. Kentucky
Agriculture Experiment Station 385, 33-34.
Pearce, R., Zeleznik, J., 1996b. Evaluation of weed control options for no-till burley
tobacco production . Agronomy Research Report: Progress Report. Kentucky
Agriculture Experiment Station 385, 33-34.
Pearce, R., Zeleznik, J., 2003. No-till transplanter.
Phillips, R., Zeleznik, J., 1989. Production of burley tobacco using no-tillage and
conventional tillage. Journal of Production Agriculture 2, 343-346.
Phillips, S.H., Young Jr, H., 1973. No-tillage farming. No-tillage farming.
Plaza-Bonilla, D., Álvaro-Fuentes, J., Cantero-Martínez, C., 2013. Soil aggregate stability
as affected by fertilization type under semiarid no-tillage conditions. Soil Science
Society of America Journal 77, 284-292.
Post, W.M., Kwon, K.C., 2000. Soil carbon sequestration and land-use change: processes
and potential. Global change biology 6, 317-327.
Powlson, D., 1980. Effect of cultivation on the mineralization of nitrogen in soil. Plant
and Soil 57, 151-153.
164

Powlson, D., Jenkinson, D., Johnston, A., Poulton, P., Glendining, M., Goulding, K., 2010.
Comments on" synthetic nitrogen fertilizers deplete soil nitrogen: a global dilemma
for sustainable cereal production," by RL Mulvaney, sa Khan, and TR Ellsworth in the
Journal of Environmental Quality 2009 38: 2295-2314. Journal of environmental
quality 39, 749.
Prove, B., Loch, R., Foley, J., Anderson, V., Younger, D., 1990. Improvements in
aggregation and infiltration characteristics of a krasnozem under maize with direct
drill and stubble retention. Soil Research 28, 577-590.
Puget, P., Chenu, C., Balesdent, J., 1995. Total and young organic matter distributions in
aggregates of silty cultivated soils. European Journal of Soil Science 46, 449-459.
Raison, R., Connell, M., Khanna, P., 1987a. Methodology for studying fluxes of soil
mineral-N in situ. Soil Biology and Biochemistry 19, 521-530.
Raison, R., Connell, M., Khanna, P., 1987b. Methodology for studying fluxes of soil
mineral-N in situ. Soil Biology and Biochemistry 19, 521-530.
Rapp, M., Leclerc, M.C., Lossaint, P., 1979. The nitrogen economy in a Pinus pinea L.
stand. Forest Ecology and Management 2, 221-231.
Rasmussen, P., Douglas, C., Collins, H., Albrecht, S., 1998. Long-term cropping system
effects on mineralizable nitrogen in soil. Soil Biology and Biochemistry 30, 1829-
1837.
Rhoton, F., Bigham, J., Schulze, D., 1993. Properties of iron-manganese nodules from a
sequence of eroded fragipan soils. Soil Science Society of America Journal 57, 1386-
1392.
165

Ribaut, J.-M., Betran, J., Monneveux, P., Setter, T., 2009. Drought tolerance in maize.
Handbook of maize: its biology. Springer, pp. 311-344.
Rice, C., Grove, J., Smith, M., 1987. Estimating soil net nitrogen mineralization as
affected by tillage and soil drainage due to topographic position. Canadian journal of
soil science 67, 513-520.
Rice, C., Smith, M., Blevins, R., 1986. Soil nitrogen availability after long-term
continuous no-tillage and conventional tillage corn production. Soil Science Society of
America Journal 50, 1206-1210.
Rice, C.W., Smith, M.S., 1984. Short-term immobilization of fertilizer nitrogen at the
surface of no-till and plowed soils. Soil Science Society of America Journal 48, 295-
297.
Ritchey, E.L., 2010. The influence of subsurface tillage on soil compaction and yield of
burley tobacco. University of Kentucky.
Robinson, D., 1994. The responses of plants to non-uniform supplies of nutrients. New
Phytologist 127, 635-674.
ROBINSON, D., 1996. Resource capture by localized root proliferation: why do plants
bother? Annals of Botany 77, 179-186.
Roth, G.W., 1996. Crop rotations and conservation tillage. Conservation tillage series 1.
Russell, R.S., 1977. Plant root systems: their function and interaction with the soil.
McGraw-Hill Book Company (UK) Limited.
Sainju, U.M., Caesar-TonThat, T., Jabro, J.D., 2009. Carbon and nitrogen fractions in
dryland soil aggregates affected by long-term tillage and cropping sequence. Soil
Science Society of America Journal 73, 1488-1495.
166

Sainju, U.M., Singh, B.P., 2008. Nitrogen storage with cover crops and nitrogen
fertilization in tilled and nontilled soils. Agronomy journal 100, 619-627.
Schomberg, H.H., Wietholter, S., Griffin, T.S., Reeves, D.W., Cabrera, M.L., Fisher, D.S.,
Endale, D.M., Novak, J.M., Balkcom, K.S., Raper, R.L., 2009. Assessing indices for
predicting potential nitrogen mineralization in soils under different management
systems. Soil Science Society of America Journal 73, 1575-1586.
Seebold, K., Pearce, R., 2011. 2011-2012Kentucky & Tennessee tobacco production
guide. Univ Kentucky Coop Extn Svc, Lexington, Kentucky, USA.
Seebold, K., Pearce, R., 2013. 2013-2014Kentucky & Tennessee tobacco production
guide. Univ Kentucky Coop Extn Svc, Lexington, Kentucky, USA.
Selles, F., Campbell, C., McConkey, B., Brandt, S., Messer, D., 1999. Relationships
between biological and chemical measures of N supplying power and total soil N at
field scale. Canadian journal of soil science 79, 353-366.
Seybold, C., Herrick, J., 2001. Aggregate stability kit for soil quality assessments. Catena
44, 37-45.
Sharifi, M., Zebarth, B., Burton, D., Grant, C., Cooper, J., 2007. Evaluation of some
indices of potentially mineralizable nitrogen in soil. Soil Science Society of America
Journal 71, 1233-1239.
Sierra, C.A., Trumbore, S.E., Davidson, E.A., Vicca, S., Janssens, I., 2015. Sensitivity of
decomposition rates of soil organic matter with respect to simultaneous changes in
temperature and moisture. Journal of Advances in Modeling Earth Systems.
Sierra, J., 1997. Temperature and soil moisture dependence of N mineralization in intact
soil cores. Soil Biology and Biochemistry 29, 1557-1563.
167

Singh, H., Singh, K., 1994a. Nitrogen and phosphorus availability and mineralization in
dryland reduced tillage cultivation: effects of residue placement and chemical fertilizer.
Soil Biology and Biochemistry 26, 695-702.
Singh, H., Singh, K.P., 1994b. Nitrogen and phosphorus availability and mineralization in
dryland reduced tillage cultivation: Effects of residue placement and chemical
fertilizer. Soil Biology and Biochemistry 26, 695-702.
Six, J., Bossuyt, H., Degryze, S., Denef, K., 2004. A history of research on the link
between (micro) aggregates, soil biota, and soil organic matter dynamics. Soil and
Tillage Research 79, 7-31.
Six, J., Elliott, E., Paustian, K., 1999. Aggregate and soil organic matter dynamics under
conventional and no-tillage systems. Soil Science Society of America Journal 63,
1350-1358.
Six, J., Elliott, E., Paustian, K., 2000a. Soil macroaggregate turnover and microaggregate
formation: a mechanism for C sequestration under no-tillage agriculture. Soil Biology
and Biochemistry 32, 2099-2103.
Six, J., Elliott, E., Paustian, K., Doran, J., 1998. Aggregation and soil organic matter
accumulation in cultivated and native grassland soils. Soil Science Society of America
Journal 62, 1367-1377.
Six, J., Feller, C., Denef, K., Ogle, S., Sa, J.C.D.M., Albrecht, A., 2002. Soil organic
matter, biota and aggregation in temperate and tropical soils-Effects of no-tillage.
Agronomie 22, 755-775.
168

Six, J., Paustian, K., Elliott, E., Combrink, C., 2000b. Soil structure and organic matter I.
Distribution of aggregate-size classes and aggregate-associated carbon. Soil Science
Society of America Journal 64, 681-689.
Smil, V., 2004. Enriching the earth: Fritz Haber, Carl Bosch, and the transformation of
world food production. MIT press.
Smith, J.L., Schnabel, R., McNeal, B., Campbell, G., 1980. Potential errors in the first-
order model for estimating soil nitrogen mineralization potentials. Soil Science
Society of America Journal 44, 996-1000.
Smith, S.J., Sharpley, A.N., 1990. Soil nitrogen mineralization in the presence of surface
and incorporated crop residues. Agronomy Journal 82, 112-116.
Sollins, P., Spycher, G., Glassman, C., 1984. Net nitrogen mineralization from light-and
heavy-fraction forest soil organic matter. Soil Biology and Biochemistry 16, 31-37.
Solt, M.L., 1957. Nicotine production and growth of excised tobacco root cultures. Plant
physiology 32, 480.
Sommerfeldt, T., Chang, C., Entz, T., 1988. Long-term annual manure applications
increase soil organic matter and nitrogen, and decrease carbon to nitrogen ratio. Soil
Science Society of America Journal 52, 1668-1672.
Soon, Y., Haq, A., Arshad, M., 2007. Sensitivity of nitrogen mineralization indicators to
crop and soil management. Communications in soil science and plant analysis 38,
2029-2043.
Soon, Y.K., Clayton, G.W., Rice, W.A., 2001. Tillage and previous crop effects on
dynamics of nitrogen in a wheat–soil system. Agronomy Journal 93, 842-849.
169

Spaccini, R., Piccolo, A., 2013. Effects of field managements for soil organic matter
stabilization on water-stable aggregate distribution and aggregate stability in three
agricultural soils. Journal of Geochemical Exploration 129, 45-51.
Spalding, R.F., Exner, M.E., 1993. Occurrence of nitrate in groundwater—a review.
Journal of environmental quality 22, 392-402.
Stanford, G., 1982. Assessment of soil nitrogen availability. Nitrogen in agricultural soils,
651-688.
Stanford, G., Hanway, J., 1955. Predicting nitrogen fertilizer needs of Iowa soils: II. A
simplified technique for determining relative nitrate production in soils. Soil Science
Society of America Journal 19, 74-77.
Stanford, G., Legg, J., Smith, S., 1973. Soil nitrogen availability evaluations based on
nitrogen mineralization potentials of soils and uptake of labeled and unlabeled
nitrogen by plants. Plant and Soil 39, 113-124.
Stanford, G., Smith, S., 1972. Nitrogen mineralization potentials of soils. Soil Science
Society of America Journal 36, 465-472.
Stiles, C.A., Hammer, R.D., Johnson, M.G., Ferguson, R., Galbraith, J., O'Geen, T.,
Arriaga, J., Shaw, J., Falen, A., McDaniel, P., 2011. Validation testing of a portable kit
for measuring an active soil carbon fraction. Soil Science Society of America Journal
75, 2330-2340.
Su, Y.-Z., Wang, F., Suo, D.-R., Zhang, Z.-H., Du, M.-W., 2006. Long-term effect of
fertilizer and manure application on soil-carbon sequestration and soil fertility under
the wheat–wheat–maize cropping system in northwest China. Nutrient Cycling in
Agroecosystems 75, 285-295.
170

Subler, S., Parmelee, R., Allen, M., 1995. Comparison of buried bag and PVC core
methods for in situ measurement of nitrogen mineralization rates in an agricultural soil
1. Communications in Soil Science & Plant Analysis 26, 2369-2381.
Sullivan, L., 1990. Soil organic matter, air encapsulation and water-stable aggregation.
Journal of Soil Science 41, 529-534.
Sylvia, D.M., Fuhrmann, J.J., Hartel, P., Zuberer, D.A., 2005. Principles and applications
of soil microbiology. Pearson Prentice Hall Upper Saddle River, NJ:.
Thomas, G., Dalal, R., Standley, J., 2007. No-till effects on organic matter, pH, cation
exchange capacity and nutrient distribution in a Luvisol in the semi-arid subtropics.
Soil and Tillage Research 94, 295-304.
Tilman, D., Cassman, K.G., Matson, P.A., Naylor, R., Polasky, S., 2002. Agricultural
sustainability and intensive production practices. Nature 418, 671-677.
Tisdall, J., Oades, J., 1980. The effect of crop rotation on aggregation in a red-brown earth.
Soil Research 18, 423-433.
Tisdall, J., Oades, J.M., 1982. Organic matter and water-stable aggregates in soils. Journal
of soil science 33, 141-163.
Townsend, A.R., Howarth, R.W., Bazzaz, F.A., Booth, M.S., Cleveland, C.C., Collinge,
S.K., Dobson, A.P., Epstein, P.R., Holland, E.A., Keeney, D.R., 2003. Human health
effects of a changing global nitrogen cycle. Frontiers in Ecology and the Environment
1, 240-246.
Tripathi, R., Nayak, A., Bhattacharyya, P., Shukla, A., Shahid, M., Raja, R., Panda, B.,
Mohanty, S., Kumar, A., Thilagam, V., 2014. Soil aggregation and distribution of
171

carbon and nitrogen in different fractions after 41years long-term fertilizer experiment
in tropical rice–rice system. Geoderma 213, 280-286.
Trujillo, W., Amezquita, E., Fisher, M., Lal, R., 1997. Soil organic carbon dynamics and
land use in the Colombian savannas. I. Aggregate size distribution. Soil processes and
the carbon cycle. CRC Press, Boca Raton, FL, 267-280.
Tso, T.-C., 1990. Production, physiology, and biochemistry of tobacco plant.
Unger, P.W., Kaspar, T.C., 1994. Soil compaction and root growth: a review. Agronomy
Journal 86, 759-766.
Van Der Krift, T.A., Berendse, F., 2001. The effect of plant species on soil nitrogen
mineralization. Journal of Ecology 89, 555-561.
Veum, K.S., Goyne, K.W., Kremer, R., Motavalli, P.P., 2012. Relationships among water
stable aggregates and organic matter fractions under conservation management. Soil
Science Society of America Journal 76, 2143-2153.
Weatherburn, M., 1967. Phenol-hypochlorite reaction for determination of ammonia.
Analytical chemistry 39, 971-974.
Wei, X., Li, X., Jia, X., Shao, M., 2013. Accumulation of soil organic carbon in
aggregates after afforestation on abandoned farmland. Biology and fertility of soils 49,
637-646.
Weil, R.R., Islam, K.R., Stine, M.A., Gruver, J.B., Samson-Liebig, S.E., 2003. Estimating
active carbon for soil quality assessment: A simplified method for laboratory and field
use. American Journal of Alternative Agriculture 18, 3-17.
West, T.O., Post, W.M., 2002. Soil organic carbon sequestration rates by tillage and crop
rotation. Soil Science Society of America Journal 66, 1930-1946.
172

Whalen, J.K., Hu, Q., Liu, A., 2003. Compost applications increase water-stable
aggregates in conventional and no-tillage systems. Soil Science Society of America
Journal 67, 1842-1847.
White, K.D., 1970. Fallowing, crop rotation, and crop yields in Roman times. Agricultural
History, 281-290.
Wienhold, B.J., 2007. Comparison of laboratory methods and an in situ method for
estimating nitrogen mineralization in an irrigated silt-loam soil. Communications in
soil science and plant analysis 38, 1721-1732.
Wienhold, B.J., Halvorson, A.D., 1999. Nitrogen mineralization responses to cropping,
tillage, and nitrogen rate in the Northern Great Plains. Soil Science Society of America
Journal 63, 192-196.
Wienhold, B.J., Varvel, G.E., Wilhelm, W.W., 2009. Container and installation time
effects on soil moisture, temperature, and inorganic nitrogen retention for an in situ
nitrogen mineralization method. Communications in soil science and plant analysis 40,
2044-2057.
Williamson, L.C., Ribrioux, S.P., Fitter, A.H., Leyser, H.O., 2001. Phosphate availability
regulates root system architecture in Arabidopsis. Plant Physiology 126, 875-882.
Womach, J., 2004. Tobacco quota buyout. Congressional Research Service, Library of
Congress, Report to Congress Number EBAGR62, as of July, p. 2.
Wood, S.D., Worsham, A.D., 1986. Reducing soil erosion in tobacco fields with no-tillage
transplanting. Journal of soil and water conservation 41, 193-196.
173

Woods, L., Cole, C., Porter, L., Coleman, D., 1987. Transformations of added and
indigenous nitrogen in gnotobiotic soil: a comment on the priming effect. Soil Biology
and Biochemistry 19, 673-678.
Wright, A.L., Hons, F.M., 2005a. Soil carbon and nitrogen storage in aggregates from
different tillage and crop regimes. Soil Science Society of America Journal 69, 141-
147.
Wright, A.L., Hons, F.M., 2005b. Tillage impacts on soil aggregation and carbon and
nitrogen sequestration under wheat cropping sequences. Soil and tillage research 84,
67-75.
Wright, A.L., Hons, F.M., Lemon, R.G., McFarland, M.L., Nichols, R.L., 2007.
Stratification of nutrients in soil for different tillage regimes and cotton rotations. Soil
and Tillage Research 96, 19-27.
Wu, J., Brookes, P.C., 2005. The proportional mineralisation of microbial biomass and
organic matter caused by air-drying and rewetting of a grassland soil. Soil Biology and
Biochemistry 37, 507-515.
Xiang, S.-R., Doyle, A., Holden, P.A., Schimel, J.P., 2008. Drying and rewetting effects
on C and N mineralization and microbial activity in surface and subsurface California
grassland soils. Soil Biology and Biochemistry 40, 2281-2289.
Yadav, B., Tarafdar, J., 2004. Phytase activity in the rhizosphere of crops, trees and
grasses under arid environment. Journal of arid environments 58, 285-293.
Yan, D., Wang, D., Yang, L., 2007. Long-term effect of chemical fertilizer, straw, and
manure on labile organic matter fractions in a paddy soil. Biology and Fertility of
Soils 44, 93-101.
174

Yu, H., Ding, W., Luo, J., Geng, R., Cai, Z., 2012. Long-term application of organic
manure and mineral fertilizers on aggregation and aggregate-associated carbon in a
sandy loam soil. Soil and Tillage Research 124, 170-177.
Zartman, R., Phillips, R., Atkinson, W., 1976. Tillage and nitrogen influence on root
densities and yield of burley tobacco. Tob. Sci 20, 129-132.
Zech, W., Senesi, N., Guggenberger, G., Kaiser, K., Lehmann, J., Miano, T.M., Miltner,
A., Schroth, G., 1997. Factors controlling humification and mineralization of soil
organic matter in the tropics. Geoderma 79, 117-161.
Zeleznik, J.M., Phillips, R.E., 1990. Production of no-tillage burley tobacco.Soil Science
News & Views Univ KY Coop Ext Svc, Lexington, Kentucky,USA.
Zhang, H., Forde, B.G., 1998. An Arabidopsis MADS box gene that controls nutrient-
induced changes in root architecture. Science 279, 407-409.
Zhang, H., Jennings, A., Barlow, P.W., Forde, B.G., 1999. Dual pathways for regulation
of root branching by nitrate. Proceedings of the National Academy of Sciences 96,
6529-6534.
Zhang, J., Qin, J., Yao, W., Bi, L., Lai, T., Yu, X., 2009. Effect of long-term application
of manure and mineral fertilizers on nitrogen mineralization and microbial biomass in
paddy soil during rice growth stages. Plant, Soil and Environment, Prague 55, 101-109.
Zhang, W., Yao, Y., Sullivan, N., Chen, Y., 2011. Modeling the primary size effects of
citrate-coated silver nanoparticles on their ion release kinetics. Environmental science
& technology 45, 4422-4428.
175

Zibilske, L.M., Bradford, J.M., 2007. Soil aggregation, aggregate carbon and nitrogen,
and moisture retention induced by conservation tillage. Soil Science Society of
America Journal 71, 793-802.
Zotarelli, L., Alves, B., Urquiaga, S., Boddey, R., Six, J., 2007. Impact of tillage and crop
rotation on light fraction and intra-aggregate soil organic matter in two Oxisols. Soil
and Tillage Research 95, 196-206.
Zou, C., Pearce, R. C., Hu, X. Zeleznik, J. M., 2013. No-tillage practice history and
development for Burley tobacco production in Kentucky, USA. ACTA TABACARIA
SINICA 19, 125-120.
176

Vita
Congming Zou
EDUCATION
M.S. in Agronomy Southwest University, Chongqing, China, Jun. 2010
B.S. in Agronomy, Southwest University, Chongqing, China, Jun. 2007
RESEARCH, TEACHING AND EXTENSION EXPERIENCE
Aug. 2010-Present: Graduate Research Assistant, Department of Plant and Soil Sciences,
University of Kentucky, Lexington, KY
Dec. 2012- May.2013: Graduate Teaching Assistant (PLS 366 Fundamentals of Soil
Science), Department of Plant and Soil Sciences, University of Kentucky, Lexington, KY
Mar. 2008- Mar. 2009: Agricultural graduate student extension agent, Department of
Agriculture, Yunyang County, Chongqing, China
Sept.2007- Jun. 2010: Graduate Research Assistant, Southwest University, Chongqing,
China
PROFESSIONAL RECOGNITION
Representative at Graduate Student Leadership Conference at ASA-CSSA-SSSA
International Annual Meeting (2014)
A selected member of the Honor Society of Agriculture in U.K.’s Gamma Sigma Delta
Chapter (2014)
Graduate Student Scholarship, Tobacco Science Research Conference (2013)
177

Outstanding Graduate Student Award for Soil Fertility Research and Service
(Kentucky), the 42th North Central Extension-Industry Soil Fertility Conference,
International Plant Nutrition Institute (2012)
Altria Client Service Graduate Fellowships Recipient (2012 , 2013 and 2014)
Philip Morris International Graduate Fellowships Recipient (2010 and 2011)
Outstanding Master's Thesis Award, Southwest University (2010)
PUBLICATIONS (RECENT FIVE YEARS)
Zou, C., Pearce, R. C., Hu, X., Zeleznik, J. M., 2013. No-tillage practice history and
development for burley tobacco production in Kentucky, USA. Acta Tabacaria Sinica, 19
(5):125-130 Doi:10.3969/j.issn.1004-5708.2013.05.022
Wang L., Zou, C., Zhang Y., et al. 2013. Influences of conservation tillage practices on
farmland soil ecological factors and productive benefits in dryland region with triple
cropping system in Southwest China. Acta Agron Sin 39(10): 1880-1890.
Huang, C., Zhao, S., Wang, L., Anjum, S. A., Chen, M., Zhou, H., Zou, C., 2013.
Alteration in chlorophyll fluorescence, lipid peroxidation and antioxidant enzymes
activities in hybrid ramie (Boehmeria nivea L.) under drought stress. Australian Journal of
Crop Science 7(5): 594-599.
Zou, C., Hu, X., Zhang, Y., et al., 2011. Dynamic variety of soil nutrient content under
conservation tillage. Journal of Agricultural Mechanization Research 33(2): 97-101.
Xue, L., Zou, C., et al., 2011. The research on soil nutrient dynamics under straw mulch
in purple soil area. Journal of Agricultural Mechanization Research 33(2): 97-101.
178

Zhang, Y., Wang, L., Zou, C., et al., 2011. Effects of conservation tillage on soil
moisture and crop yield of wheat-maize-sweet potato triple cropping system in dryland of
hot and summer drought areas. Chinese Journal of Soil Science 42(1): 16-21.
Xue, L., Shakeel, A., Liu, X., Zou, C., et al., 2011. Effect of straw mulch conservative
cultivation on growth, yield and soil nutrients of rapeseed (Brassica compestris). Journal
of Agricultural Mechanization Research 33(2): 110-115.
Anjum, S. A., L. C. Wang, M.Farooq, M.Hussain, L.L.Xue, C.M. Zou. 2011.
Brassinolide application improves the drought tolerance in maize through modulation of
enzymatic antioxidants and leaf gas exchange. Journal of Agronomy and Crop Science
197(3): 177-185.
Zou, C., Hu, X., Zhang, Y., et al., 2010. Soil moisture dynamics and crop yield with
conservation tillage in tri-crop intercropping system of Southwest China. Bulletin of Soil
and Water Conservation 30 (6): 69-74.
Zou, C., Wang, G., Hu, X., et al., 2010. Effect of straw mulching on root development
and physiological characteristics of intercropped maize at seedling stage. Chinese Journal
of Eco-Agriculture 18(3): 496-500.
Zou, C., Hu, X., Zhang, Y., et al., 2010. Study on ecological safety under high
temperature and summer drought based on energy ecological footprint model - A case
study in Jiangjin District of Chongqing, Agricultural Research in the Arid Areas 28(6):
201- 205.
Zhang, Y., Wang, L., Zou, C., et al., 2010. Effects of conservation tillage on growth and
179

W UE in wheat. Agricultural Research in the Arid Areas 28(2): 71-74.
Zhang, Y., Wang, L., Zou, C., et al., 2010. Effects of conservation tillage on water
ecological adaptability of triple crop a year in the dry land. Journal of Agricultural
Mechanization Research 32(12): 106-109.
Zhang, Y., Wang, L., Zou, C., et al., 2010. Study on water supply and demand
equilibrium and ecological adaptability of dryland farming systems in hot and summer
drought areas. Research of Soil and Water Conservation 17(6): 95-100.
Hu, X., Wang, L., Xue, L., Zou, C., et al., 2010. Study on sustainable development of
Agro-Ecosystem in China’s western region based on EMA and GIS. Journal of Southwest
University 32(2): 7-12.
Liu R., Wang, L., Zou, C., et al., 2010. Comparative analysis on sustainable development
of Shaanxi, Sichuan and Chongqing based on energy ecological footprint method.
Chinese Agricultural Science Bulletin 26(13):339-344.
Wang, L., Xie, X., Zhang, Z., Xue, L., Zou, C., 2010. On establishment of a water-saving
farming system in seasonal drought regions of Southwest China. Journal of Southwest
University 32(2): 1-5.
180