soil erosion hazard -...
TRANSCRIPT

A U S T R A L I A ’ S S T A T E O F T H E F O R E S T S R E P O R T 2 0 0 3 | 175
C H A P T E R 4
Protecting soil and water values in forested areas is critical to maintaining most otherforest values and thus is an essential part of sustainable forest management. Knowledge ofthe causes of soil erosion and trends in its severity can be used to adapt forest managementpractices so as to limit erosion to acceptably low levels. Systematic assessment of soil erosionhazard and the implementation of site-specific measures to protect soil and water valuesdemonstrate a commitment to the protection of these values. The target for this indicatoris therefore all of the forest estate, with the initial focus on areas of high erosion risk.
It is important to realise that this indicator aims to demonstrate that soil erosion risk hasbeen explicitly addressed in forest management planning and field operations. In otherwords, it records efforts to protect soils from erosion, not whether the efforts have actuallybeen effective. Progressively, the effectiveness of any protective measures will need to beassessed, with modifications applied as required.
Soil erosion hazard is the term used to describe how likely it is for soil in a given area toerode. It depends on the inherent properties of the soil, the topography, vegetative coverand soil disturbance, and rainfall intensity.
Limited data exists nationally for the areasystematically assessed for soil erosion hazard.In some States—such as New South Wales,Victoria and Tasmania—data are available forall areas of harvested native forest. In theAustralian Capital Territory, New South Walesand South Australia, plantations are alsoassessed.
Evaluation could consist of field observationssuch as the extent of sheet or rill erosion,research findings, or targeted monitoringfocusing on situations of high erosion-risk.
Scale is an important factor in relation to soilerosion. From a soil fertility point of view,even downslope movement of soil within a
Soil erosion hazard
Indicator 4.1a (interim indicator)Area and per cent of forest land systematically assessed for soil erosion hazard, andfor which site-varying scientifically-based measures to protect soil and water valuesare implemented
RationaleThis indicator aims to demonstrate that soil erosion risk has been explicitly addressed in forestmanagement planning and field operations.
At the national level there is no numerical measure of the area of forest
assessed for soil erosion. Jurisdictions apply various measures to protect
soil and water values to suit differing conditions.
coverage
currrency
frequency
Snig track with erosion control barriers
CSIR
O

harvesting area is detrimental. Management prescriptions, such as the use of cross-banks(drains) on log extraction tracks, can minimise downslope movement. For this reason, thespacing between cross-drains is reduced in high-risk situations.
Buffer and filter strips along watercourses and drainage lines can be used to prevent thetransport of soil into streams, which might otherwise damage aquatic ecosystems.Undisturbed buffers protect larger streams and, where there is minimum ground disturbance,filter strips shield drainage lines. Buffers are increased where there is an increased risk oferosion—such as with high overland flow or on steep slopes.
In production environments of New South Wales, filter strips are placed on all streams,which are not to be disturbed during harvesting, and buffer strips are placed on unmappeddrainage depressions, which allows tree felling operations and machinery access. Other statesand territories use similar methods.
Fire can greatly increase the susceptibility of soils to erosion by reducing the protective coverthat accumulated litter and vegetation provide. Judicious fuel reduction burning or effectivefire suppression can limit the spread and impact of wildfires and thus soil erosion hazard. Onthe other hand, fuel reduction burns on impermeable soils in steep terrain may increase soilerosion risk. Careful assessment of erosion risk is thus important in nature conservationreserves as well as in multiple-use forests and plantations.
Where soil erosion hazard is high, special management considerations or exclusions areimplemented as part of the planning and conduct of operations. Roads are a point sourceof sediment in catchments, so that particular attention is given to planning and maintainingroad networks. Recreation activities in multiple-use forests and nature conservation reservescan contribute to erosion—for example, from vehicle tracks and walking trails—and aremanaged in some jurisdictions. Codes of forest practice generally require that the moreerodible portions of harvesting areas—landings, snig tracks and access roads—are rehabilitatedafter completion of harvesting operations. For example, in Queensland, Victoria andTasmania, log landings are drained, bark heaps dispersed, soils ripped and topsoil replacedprior to the commencement of regeneration or replanting activities. Audits are used to assesscompliance with the codes of forest practice.
Further reading
Ryan, P.J., Murphy, S. and McKenzie, N. (1998). Assessing Soil Erosion Hazard forAustralian Forest Management. Final Report on Project 98.801, Forest Wood ProductsResearch and Development Corporation, Melbourne.
Grant, J.C., Laffan, M.D., Hill, R.B. and Neilsen, W.A. (1995). Forest Soils of Tasmania.Forestry Tasmania, Hobart.
DNRE (1996). Victorian Code of Forest Practices for Timber Production. Department ofNatural Resources and Environment, Melbourne.
The State of Queensland Environmental Protection Agency (2002). Code of Practice forNative Forest Timber Production, Brisbane.
176 | A U S T R A L I A ’ S S T A T E O F T H E F O R E S T S R E P O R T 2 0 0 3
C H A P T E R 4

A U S T R A L I A ’ S S T A T E O F T H E F O R E S T S R E P O R T 2 0 0 3 | 177
C H A P T E R 4C H A P T E R 4
Protection of soil and water by forests
Indicator 4.1bArea and per cent of forest land (including plantations) managed primarily forprotective functions, for example, watersheds, flood mitigation, landslide preventionand riparian zones
RationaleForests provide many ecosystem services and functions. The provision of soil and water protectionis one of them. Management activities should ensure these are maintained.
Some figures suggest that up to 50 per cent of forested land may be
managed for protective functions. However, many of these areas may
have other primary functions, with soil and water protection being
ancillary. Forest protective functions are rarely mapped and therefore
are difficult to quantify.
This indicator refers to the area and proportion of forested land managed primarily for soiland water protection. In this context ‘primary’ is defined as a legal designation for soil andwater protection, and does not include areas under general management, of which soil andwater protection are one of a set of multiple management outcomes. Forest managementresponsibilities rest with the State and Territory governments, all of which have legislation inplace requiring management standards relating to watershed protection, areas vulnerable toerosion and slope instability, and riparian zones to be met. In addition to legislation, codes ofpractice set out activities to be undertaken in or near waterways, in erosion hazard areas or inwater management catchments. Table 65 indicates the area of forest managed primarily forprotective functions. This shows that, in the States included, historically more than 50 per centof forested land is collectively managed for protective functions.
Designated water supply catchments provide water for urban and rural use. To maintainwater quality, legislation exists in each State and Territory to control land use activities inthese catchments, which are generally public land, such as nature conservation reserve ormultiple-use forest.
Table 65: Forest managed primarily for protective functions in multiple-use forest in New South Wales,Victoria, Western Australia and Tasmania (‘000 ha)
Area of forest for which Area protected data are available
Multiple-use forest 3 562 6 654
Source: Commonwealth of Australia (1997)
coverage
currrency
frequency

Restrictions may be imposed on:
• the level, type and location of recreational activities;
• timing of forest management practices (such as during wet weather);
• methods of road construction and spatial distribution of roads; and
• management of fuels, grease and oils.
In Victoria, 51 000 hectares of forest are protected as water supply catchments and in NewSouth Wales 9 100 hectares of multiple-use forests are zoned primarily for water catchmentprotection (Table 66). Data are not available from other States and Territories.
Compared to open woodland or grassland, forested areas are characterised by higher leaf areaand evapotranspiration rates and deeper organic soil layers and rooting systems. As a result,runoff is generally reduced in forested catchments and the mean annual streamflow andmean annual flood peaks are less. Flooding is a function of climatic and biophysical controlsat a catchment scale, including drainage density, slope, shape, soil type and depth, andvegetation type/density. Mitigation of flooding through forest management in vulnerablecatchments will relate to harvesting patterns, intensity and timing relative to the hydrologicalyear. However, there are no data from routine monitoring on which to report.
The delivery of sediments to waterways can occur in response to erosional and/or slopeinstability processes. Erosion is a function of catchment morphology, soil properties, rainfallfactors and slope gradient. Slope instability is determined by increased loads (including waterand snow), soil moisture content, loss of soil structure due to shock or vibration,undermining, loss of soil cohesion, and the gradient of the slope. Forest codes of practice andmanagement plans, or specific legislation in each State and Territory, define appropriatemeasures to minimise risk. These include practices which limit or prohibit harvesting duringperiods of high rainfall or on steep slopes. In some codes of practice, steep slopes associatedwith high hazard risks for erodibility and slope instability may be specified (for example, 30ºin Victoria and New South Wales), while others vary according to parent material (11º to19º in relation to landslide susceptibility in Tasmania). Data are not available for most Statesand Territories. However, in Victoria 538 000 hectares of steep forested land is protected, inmultiple-use forests of New South Wales 77 600 hectares are protected from water pollutionhazard or extreme erosion risk, and the area mapped in Tasmania for landslide protection is150 000 hectares.
Riparian zones comprise the vegetation and soils immediately adjacent to streams. Thesezones are important for maintenance of habitat and biodiversity, streambank stabilisationand the trapping of sediment mobilised from upslope positions. The removal of riparianvegetation can have profound effects in terms of water quality, stream morphology, habitatand biodiversity—both at the site and beyond. In forested areas, particularly whereharvesting occurs, riparian zones are considered to be buffer or filter strips that protect
178 | A U S T R A L I A ’ S S T A T E O F T H E F O R E S T S R E P O R T 2 0 0 3
C H A P T E R 4
Table 66: Examples of area (ha) by sample forest protection categories
Tasmania New South Wales Victoria
Protection category
Water supply – 9 102 51 000
Slope 150 000 77 580 538 000
Riparian 35 000 221 460 488 000
Source: National Forest Inventory (2003)

waterways. The width of these strips, which should take account of soil properties and slope,varies between the States and Territories according to the forests codes of practice (indicator7.1d), licences, and plans of management, but is generally 5–60 metres.
The width of buffers will affect the proportion of forest set aside to protect waterways.However, it should be noted that the condition of the riparian zone—and hence its capacityto protect waterways—is not only dependent on width, but also on the type of cover andits composition, connectivity and structural integrity. There is also a relationship with theintensity of disturbance created by the activity being undertaken. Generally data are notavailable for reporting, although in Victoria 9.8 per cent (488 000 hectares) of riparianvegetation in forests within Regional Forest Agreement areas is protected from forestryactivities. In Tasmania 35 000 hectares have been mapped as streamside reserves and this areais expected to increase as a result of future planning. In New South Wales, 184 500 hectaresof multiple-use forests are reserved from harvesting as filter strips, with another 37 000 hectaresin which modified harvesting is permitted. Furthermore, specific set-back distances applyin certain areas not specified by the New South Wales Integrated Forestry OperationsApprovals. Additional information referring to condition of riparian zones is available inNew South Wales through the Stressed Rivers Report at a catchment scale; however, this isnot quantified according to land tenure or use.
Further reading
Commonwealth of Australia (1997). Australia’s First Approximation Report for the MontrealProcess. Montreal Process Implementation Group, Canberra.
DLWC (1998). Stressed Rivers Assessment Report: NSW State Summary 1998. Departmentof Land and Water Conservation, New South Wales.
A U S T R A L I A ’ S S T A T E O F T H E F O R E S T S R E P O R T 2 0 0 3 | 179
C H A P T E R 4
Native forest and plantations for production and water quality maintenance, Cotter Dam, ACT
Mic
hael
F. R
yan
180 | A U S T R A L I A ’ S S T A T E O F T H E F O R E S T S R E P O R T 2 0 0 3
C H A P T E R 4C H A P T E R 4
Stream flow in forested catchments
Indicator 4.1cPercent of stream kilometres in forested catchments in which stream flow and timinghas significantly deviated from the historic range of variation
RationaleThis indicator aims to measure the effects of forest management and other factors on water flowand variation in flow. This is important for stream health and for water supply for human use.
Studies show that stream flow increases after forest harvesting, decreases
with regrowth or plantation establishment and increases again in older
forests. Attempts to quantify changes in stream flow in forested
catchments are problematic.
Human activities since European settlement have altered the natural flows of many riversystems with resulting environmental and economic effects. Some of the consequencesinclude reduced stream flow or changes to the seasonality of flows, including the lengthof time during which there are low flows or no flows.
Catchments in Australia are used for more than water supply and storage. Although streamsmay rise in forested or wooded uplands, they can also flow through private and public land,which may be forested, agricultural, grazed or urban. It should also be noted that while forestmanagement practices such as harvesting may occur in one part of a catchment, other landuse and management practices may be going on elsewhere in the same catchment.
In some cases, the impacts of one form of land use may add or subtract to the impactsof another, such as when increased runoff after forest harvesting is offset by farm damdevelopment. Under these circumstances, it is difficult to isolate the impacts of one typeof land use on stream flow. In addition, the occurrence of bushfires and the high degree ofrainfall variability—which may result in stream flow varying between years by as much as70 per cent—complicate the difficulty of trying to characterise the system. In some States,streams have been monitored for several decades; however, there has been no systematic andconsistent analysis that provides an assessment of the temporal and spatial variability ofstream flow.
Studies have been undertaken in forested areas in which the impacts of forest managementin one catchment are measured and compared with an adjacent, undisturbed catchment.Although most studies have focussed on mountain ash forests in Victoria, other studies havebeen undertaken on mixed species forests, and are in progress in hoop pine plantations inQueensland. These studies demonstrate that:
• stream flow increases after forest harvesting, in response to higher runoff after the removalof vegetation from ground surfaces; and
• stream flow decreases in proportion to the density of regrowth in the catchment andreturns to pre-harvesting levels after 4–8 years, depending on forest type.
However, other studies show that forest management has little impact on stream flow.Significant variations of flow have occurred in three streams out of a total of 14 monitored ina Victorian study, although the conclusions drawn suggest that the major impact on yield is
coverage
currrency
frequency

probably wildfire—dating from 1939—rather than forest management. It should be notedthat there are a number of significant constraints in this study due to problems with datareliability and continuity.
In addition to impacts imposed during harvesting in forested catchments, stream flow maybe modified by the construction of storage dams. These structures retain water untilcontrolled releases contribute water downstream, and affect the timing of flows.
Further reading
Cornish, P.M. (1993). The effects of logging and forest regeneration on water yields in amoist eucalyptus forest in New South Wales, Australia. Journal of Hydrology. 150 (2–4):301–22.
Harper, P.B. and Lacey, S.T., (1995). A review of findings from the Yambulla CatchmentsHydrological Research Project, 1979–1990. State Forests of NSW, Pennant Hills.
Lane, P. and McKenna, P. (in press). Retrospective Stream Flow Analysis. Final Report toForest Management Branch. Department of Sustainability and Environment, Forests ScienceCentre, Heidelberg.
Nandekumar, N. and Mein, R.G. (1993). Analysis of Paired Catchments Data to Determinethe Hydrologic Effects of Change in Vegetative Cover on Yield. Technical Report to Landand Water Resources Research and DevelopmentCorporation and Department of Conservationand Natural Resources. Department of CivilEngineering, Monash University, Clayton.
O’Shaughnessy, P.J., Fletcher, T., and Bren, L.,(1999). The Effects of Forest Harvesting on WaterYield and Quality in the Lerderderg Catchment.Research Report to Department of Conservationand Natural Resources, Melbourne.
Smith, D.I. (1999). Water in Australia. OxfordUniversity Press, Melbourne.
A U S T R A L I A ’ S S T A T E O F T H E F O R E S T S R E P O R T 2 0 0 3 | 181
C H A P T E R 4
Dead river red gum (Eucalyptus camaldulensis) following flooding of Murray river for Yarrawonga Dam, Mulwala, NSW
Mic
hael
F. R
yan

182 | A U S T R A L I A ’ S S T A T E O F T H E F O R E S T S R E P O R T 2 0 0 3
C H A P T E R 4C H A P T E R 4
Soil organic matter
Indicator 4.1d (interim indicator)The total quantity of organic carbon in the forest floor (greater than 25 millimetresdiameter components) and in the surface 30 centimetres of soil
RationaleThe quantity and type of soil organic matter helps describe a soil’s physical, chemical andbiological status, which in turn affect many important ecosystem processes. This indicator aimsto measure soil organic matter that can impact on soil fertility.
There are no broad operational data available for soil carbon or organic
matter change in Australian forests. Certain forest practices can alter
soil organic matter.
Soil organic matter is important because it provides for the storage and release of keynutrients and is important in ecosystem carbon cycling. It also affects soil physical andhydrological properties and provides substrates for soil biota. Broad scale land clearing,primarily for agriculture, has had the most dramatic impact on soil organic matter butmany forest operations may also change the quantity and features of soil organic matter.Characteristics of soil organic matter are particular to each forest ecosystem. The interimindicator aims to provide a surrogate for the physical, chemical and biological propertiesimportant for soil fertility.
Protecting soils in forested areas is critical to maintaining most other forest values and thusis an essential part of sustainable forest management. To assist in this, the plantation forestindustry has developed chopper rolling as standard practice. Chopper rolling is used to crushthe residues from clear felling operations in situ to retain nutrients and organic matter.
Knowledge of the trends and causes of change in organic matter and other important soilchemical properties can be used to adapt management practices where required. However,
for the following reasons, there are no broadoperational data available for soil carbon ororganic matter change in Australian forests.
Total soil organic carbon is composed ofseveral components that vary greatly in theirproperties and contribution to soil fertility.Australian forest soils may containsignificant quantities of relatively inert(stable) carbon in the form of charcoal, andthere is no simple and cheap way ofseparating this from the organiccomponents when total soil carbon ismeasured. Direct measurements of carbonare a better indicator of change in theproductivity of plantations than ‘loss-on-ignition’, which is sometimes used.
coverage
currrency
frequency
Chopper rolling to retain organic matter, South Australia
Fore
stry
SA

A U S T R A L I A ’ S S T A T E O F T H E F O R E S T S R E P O R T 2 0 0 3 | 183
C H A P T E R 4
0
4
8
12
16
20
Soil
orga
nic
mat
ter (
per c
ent)
Undisturbed Only Litter Disturbed Topsoil Disturbed Subsoil Disturbed Primary Snig Track
18.6
14.4
18.1
13.6 13.8
11.1 11.19.7
12.3
9.8
0–100 mm depth 200–300 mm depth
Figure 40: Relationship between soil disturbance category and soil organic matter content on the general harvest area and snig tracks 10 years after clearfelling mountain ash (Eucalyptus regnans) forest
Source: Lacey et al. (2002)
Case study
Research during the last decade in mountain ash forest in the Victorian Central Highlandshas provided a potential means to monitor soil change in harvested forests in the future.A field survey technique for assessing soil disturbance during harvesting and regenerationhas been developed. This method has been used to survey the proportion of harvestingareas affected by operational categories (Figure 41a) and varying levels of associated soildisturbance (Figure 41b). Results show that clearfelling affects most of a site, causing about66 per cent of the area to experience moderate to severe soil disturbance.
(a) (b)
Snig Tracks 17%
Log Landings 3%
Other 5%
Harvest Area 75% Undisturbed 30%
Only Litter Disturbed 4%
Severely Disturbed 20%
Moderately Disturbed 46%
Source: Lacey et al. (2002)
Figure 41: Proportion of logging coupe area (mean of 20 operational coupes) occupied by (a) different operational categories or (b) soil disturbance categories, following clearfelling ofmountain ash forest in the Victorian Central Highlands
Soil organic matter (SOM) is also costly to monitor, and changes are not simple to interpretin terms of ecosystem functioning (apart from impacts on soil carbon stocks, which areimportant for greenhouse accounting). The importance of a change in soil organic mattervaries with forest ecosystem type and management objective.
There appears to be good potential to use soil disturbance classes as a surrogate for SOMchange (Figure 41 and case study). This would be a more cost-effective approach tomonitoring, but it needs further calibration.

Further reading
Bauhus, J., Khanna, P., Hopmans, P., Ludwig, B. and Weston, C. (2002). Evaluation of soilorganic matter as a meaningful indicator of important soil properties and processes in nativeforest ecosystems. Final Report on Project 99.803 to Forest Wood Products Research andDevelopment Corporation, Melbourne.
Carlyle, C., Snowdon, P., Polglase, P., Nambiar, S., Smith, T., Simpson, J. and Bubb, K.(2002). Soil-based information for developing sustainable plantation management inAustralia. Final Report on Project 99.801 to Forest Wood Products Research andDevelopment Corporation, Melbourne.
Lacey, S., Rab, M.A. and McCormack, R.J. (2002). Effects of forest harvesting on soilphysical properties: Developing and evaluating meaningful soil indicators for sustainablemanagement in southeastern Australia. Final Report on Project 99.805 to Forest WoodProducts Research and Development Corporation, Melbourne.
Pennington, P. and Laffan, M. (2001). Procedures for the measurement of changes in soilphysical properties following logging of wet Eucalyptus obliqua forests. Final Report onProject 99.804 to Forest Wood Products Research and Development Corporation,Melbourne.
Rab, M.A. (1999). Measures and operating standards for assessing Montreal Process soilsustainability indicators with reference to Victorian central highlands forests. Forest Ecologyand Management 117: 53–73.
Raison, R.J. and Rab, M.A. (2001). Guiding concepts for the application of indicators tointerpret change in soil properties and processes in forests. Pp. 231–258 in: R.J. Raison, A.G. Brown and D.W. Flinn (eds) Criteria and Indicators for Sustainable ForestManagement. IUFRO Research Series, No. 7. CABI, Wallingford.
Whitford, K. (2001). Evaluation of key soil indicators of sustainability in AustralianMediterranean Forests. Final Report on Project 99.802 to Forest Wood Products Researchand Development Corporation, Melbourne.
184 | A U S T R A L I A ’ S S T A T E O F T H E F O R E S T S R E P O R T 2 0 0 3
C H A P T E R 4
Sampling organic matter
Alex
Lee
A U S T R A L I A ’ S S T A T E O F T H E F O R E S T S R E P O R T 2 0 0 3 | 185
C H A P T E R 4C H A P T E R 4
Soil physical damage
Indicator 4.1e (interim indicator)Proportion of harvested forest area with significant change in bulk density of anyhorizon of the surface (0–30 centimetres) soil
RationaleTo measure the extent of soil physical change induced by human activities that might adverselyaffect soil fertility and thus other ecosystem processes.
Protecting soils in managed forests is critical to maintaining most other forest values and thusis an essential part of sustainable forest management. Knowledge of the trend and causes ofdetrimental soil compaction can be used to adapt management practices to avoid further soildamage, or to guide ameliorative activities.
This indicator measures the extent of soil physical change induced by human activities thatmight adversely affect soil fertility and thus other ecosystem processes. Balancing soil physicalproperties is important in maintaining soil fertility and hydrological processes.
Changes in soil physical properties can affect important ecosystemprocesses such as infiltration of water, aeration and growth of plantroots. The indicator focuses on bulk density (which reflects soil porespace), and the impacts of forest harvesting, because these arerecognised as having the potential to adversely affect soil physicalproperties.
Recovery from significant soil compaction is slow in the field. Thisraises concerns about the potential for cumulative impacts betweenrotations.
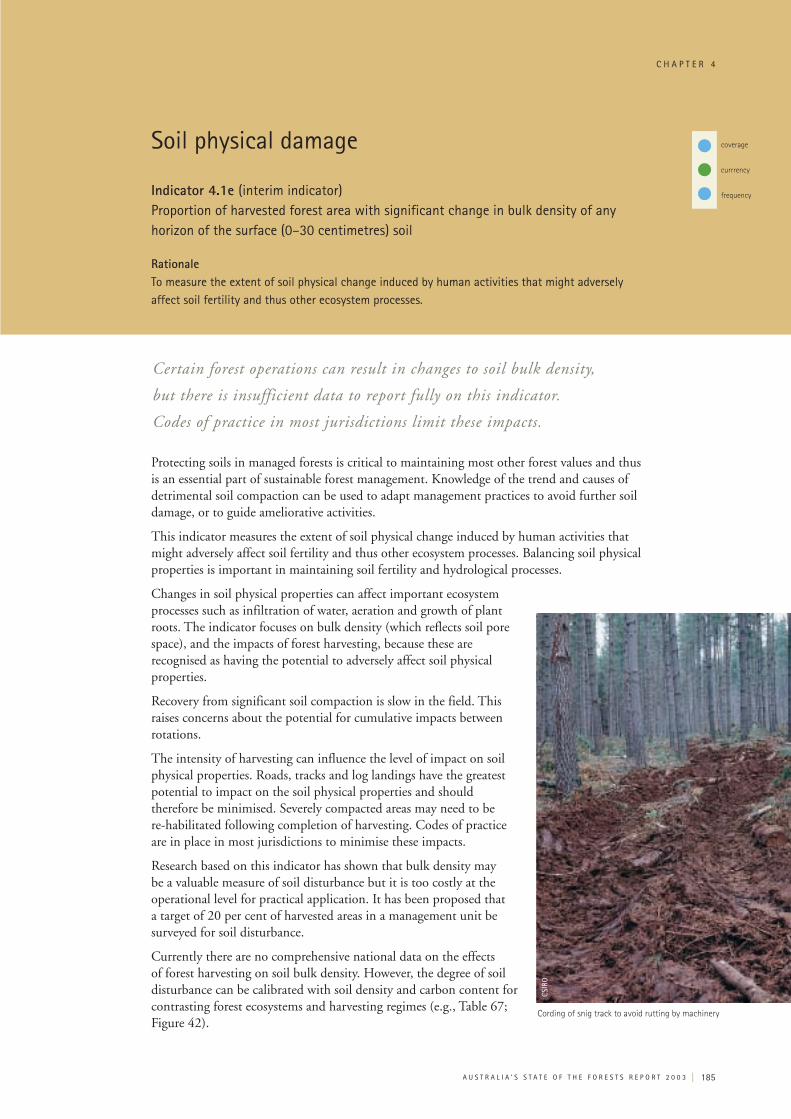
The intensity of harvesting can influence the level of impact on soilphysical properties. Roads, tracks and log landings have the greatestpotential to impact on the soil physical properties and shouldtherefore be minimised. Severely compacted areas may need to be re-habilitated following completion of harvesting. Codes of practiceare in place in most jurisdictions to minimise these impacts.
Research based on this indicator has shown that bulk density maybe a valuable measure of soil disturbance but it is too costly at theoperational level for practical application. It has been proposed thata target of 20 per cent of harvested areas in a management unit besurveyed for soil disturbance.
Currently there are no comprehensive national data on the effectsof forest harvesting on soil bulk density. However, the degree of soildisturbance can be calibrated with soil density and carbon content forcontrasting forest ecosystems and harvesting regimes (e.g., Table 67;Figure 42).
Certain forest operations can result in changes to soil bulk density,
but there is insufficient data to report fully on this indicator.
Codes of practice in most jurisdictions limit these impacts.
Cording of snig track to avoid rutting by machinery
coverage
currrency
frequency
CSIR
O

186 | A U S T R A L I A ’ S S T A T E O F T H E F O R E S T S R E P O R T 2 0 0 3
C H A P T E R 4
Table 67: Effects of soil disturbance on bulk soil density following harvest of two mature messmate stringybark (Eucalyptus obliqua) forests in Tasmania
Disturbance Level
None/Light Moderate (Topsoil) Severe (Subsoil)
(i) Dolerite soil
Fine earth bulk density (g cm-3) 0.61 0.62 0.80
Organic C (%) 4.5 4.6 3.3
(ii) Granite soil
Fine earth bulk density (g cm-3) 0.60 0.70 0.85
Organic C (%) 6.8 6.5 3.9
Source: Pennington and Laffan (2001)
Further reading
Lacey, S., Rab, M.A. and McCormack, R.J. (2002). Effects of forest harvesting on soilphysical properties: developing and evaluating meaningful soil indicators for sustainablemanagement in southeastern Australia. Final Report on Project 99.805 to Forest WoodProducts Research and Development Corporation, Melbourne.
Pennington, P. and Laffan, M. (2001). Procedures for the measurement of changes in soilphysical properties following logging of wet Eucalyptus obliqua forests. Final Report onProject 99.804 to Forest Wood Products Research and Development Corporation,Melbourne.
Rab, M.A. (1999). Measures and operating standards for assessing Montreal Process soilsustainability indicators with reference to Victorian central highlands forests. Forest Ecologyand Management 117: 53–73.
Figure 42: Relationship between soil disturbance category and soil bulk density on the generallogging area 10 years after clearfelling mountain ash (Eucalyptus regnans) forest
Source: Lacey et al. (2002)
0
0.2
0.4
0.6
0.8
1
1.2
1.4
Bulk
Den
sity
(Mg
m3 )
Undisturbed Only Litter Disturbed Topsoil Disturbed Subsoil Disturbed Primary Snig Track
0.71
0.92
0.79
0.95 0.96
1.07
1.191.26
1.07 1.12
0–100 mm depth 200–300 mm depth

A U S T R A L I A ’ S S T A T E O F T H E F O R E S T S R E P O R T 2 0 0 3 | 187
C H A P T E R 4C H A P T E R 4
Biodiversity of water bodies
Indicator 4.1f Per cent of water bodies in forested areas (e.g., stream kilometres, lake hectares) with significant change in biological diversity from the historic range of variability
RationaleThe in-stream fauna reflects the quality of the habitat and water. This in turn, reflects the impactsof off-stream management activities, so that aquatic biodiversity is a good measure of the successof protective management prescriptions.
Biodiversity in water bodies can be assessed in various ways. Most
jurisdictions assess biodiversity in major water bodies, but often these
give ‘snapshot’ results and longer term monitoring is needed to establish
temporal and spatial trends.
There are several different rapid appraisal methods by which the ecological health of a riveror stream can be assessed. However, several States and Territories use the interactive computerpackage AusRivAS (Australian River Assessment System). AusRivAS was developed underthe National River Health Program of the Commonwealth Government in 1994. It involvesthe environmental protection agencies at a State level and is centrally administered by theAustralian Government Department of the Environment and Heritage and Land andWater Australia.
AusRivAS is based on comparisons between test and reference sites. The reference sites areselected to represent the best available sites for each type of river, but do not necessarilyrepresent pristine conditions. In some cases reference sites may refer to rivers with modifiedhydrology, water quality and in-stream habitat. An additional limitation is that models aredeveloped for bioregions and not for catchments. Medium to long-term data are not yetavailable to distinguish variance in biological diversity from the historic range of variability.Importantly, stream monitoring does not specifically target forested areas and sites are oftenlocated within regions with multiple land uses where off-site impacts from other landuse andland management practices can be expressed. One-third (21 900 kilometres) of the totalriver length assessed at a national scale, and including all land uses, is to some degreeimpaired. Impairment refers to a loss of between 20 per cent and 100 per cent of the variouskinds of aquatic invertebrates that should live there.
Examination of the data at a State-by-State/Territory level suggests that New South Waleshas the poorest aquatic biota condition—approximately 50 per cent of the river length isassessed as having impaired biota. This compares with greater than 35 per cent in theAustralian Capital Territory and Western Australia, and between 12–24 per cent of the riverlength assessed in the remaining States and Territories having impaired biota.
It should be noted that aquatic habitat condition is related to water quality and waterquantity in terms of sediment and nutrient loads, and to the delivery of pollutants fromupslope or up-catchment locations. Therefore, impacts to river health will be particularlyevident in catchments characterised by low tree density and/or ground cover, erodible soils,high rainfall erosivity, intensive agriculture or urban development. In addition, wheresalinisation or soil acidification is widespread, water quality may be impacted by the inflowof surface or shallow groundwater with high salt loads or low pH. Therefore, the
coverage
currrency
frequency

188 | A U S T R A L I A ’ S S T A T E O F T H E F O R E S T S R E P O R T 2 0 0 3
C H A P T E R 4
distribution of specific catchment conditions needs to be identified both spatially andtemporally in order to assess any direct correlations between river health, soil characteristics,climate and/or landuse.
In Victoria, SIGNAL (Stream Invertebrate Grade Number – Average Level method) is alsoused to measure river health by indicating the nature of disturbance or impact at a site interms of the sensitivity of macroinvertebrates to stream salinisation and organic pollution.Index of Stream Condition benchmarking—which is partly based on AusRivAS andSIGNAL data and includes other criteria relating to hydrology, channel morphology andthe riparian zone—has been undertaken in Victoria. Results for the overall condition ofstreams—with condition of biota representing only one set of criteria—indicate that 34 per centof Victoria’s major rivers and streams are in very poor or poor condition and only 22 per centare in good or excellent condition. However, this assessment does not identify forested areasspecifically. Mapping of the biological health of streams in the East Gippsland region(1997–99) provides some data for largely forested catchments (Figure 43), which can becompared with a multiple land-use catchment dominated by agriculture and grazing (Figure 44).
Figure 43: AusRivAS and SIGNAL monitoring results for stream health in East Gippsland, Victoria
Source: Victoria, Environmental Protection Authority (2002).
In the south-east region of New South Wales, single snap shot AusRivAS monitoringindicates that Local Government Areas with a significant proportion of forestedcatchments—for example, Snowy River Shire, Bega Valley Shire and Bombala Shire—havea majority of their streams in good condition. This is in contrast to Local Government Areascharacterised by agricultural, grazing or urban landuses.
AusRivAS monitoring represents, at best, broad comparative information for river healthand biodiversity in multiple land use catchments where certain landuse or land tenure isdominant. In South Australia, AusRivAS monitoring of invertebrates, one-off surveys of fishin specific areas, and annual censuses of frogs are undertaken. However, it is estimated thatfewer than 15 per cent of streams and lakes within forested areas in South Australia aremonitored for biological diversity, with no data currently available to determine anytemporal changes with reference to the historic range of variability.
• 1997 sampling site• 1998 sampling site• 1999 sampling site• Major towns— Rivers
AUSRIVAS AND SIGNAL RATING
� Above Reference (good)� Reference (good)� Below Reference (fair)� Well Below Reference (poor)� Impoverished (very poor)� Outside the parametres of
the AUSRIVAS Model

A U S T R A L I A ’ S S T A T E O F T H E F O R E S T S R E P O R T 2 0 0 3 | 189
C H A P T E R 4
Overlaid mapping of landuse and tenure with longer term AusRivAS data is required beforemeaningful relationships and trends will be evident. Since AusRivAS is a national programco-ordinated through the Australian Government Department of the Environment andHeritage, overlaid mapping of landuse and land tenure for forest coverage on a State/Territorybasis should be possible in the future. However, longer term data are required to establishtemporal as well as spatial trends in river health (as defined by biodiversity). The limitationsof AusRivAS also need to be acknowledged and addressed.
Figure 44: AusRivAS ratings on stream health for the Campaspe catchment, Victoria
Source: Victorian Water Resource Data Warehouse (2003).
Legend
� Excellent
� Good
� Marginal
� Poor
� Very poor
� Not available
Willows (Salix spp.) planted for stream bank stabilisation
Mic
hael
F. R
yan

Further reading
Anderson, J.R. (1993) State of the Rivers Project. Report 1. Development and Validation ofthe Methodology. Department of Primary Industries, Queensland.
ACT Commissioner for the Environment. (2000). Australian Capital Region State of theEnvironment Report, Canberra.
Barmuta, L.A., Chessmand, B.C., and Hart, B.T. (1998). Interpreting the Outputs fromAusRivAS. Occasional Paper 2/98. National River Health Program, Land and WaterResources Research and Development Corporation, Canberra.
Davies, P.E. (2000). Development of a national river bioassessment system (AusRivAS) inAustralia. In J.F. Wright, D.W. Sutcliffe and Fruse, M.T. (eds) Assessing the BiologicalQuality of Fresh Waters: RIVPACS and Other Techniques. Freshwater BiologicalAssociation, Cumbria.
Davies, P.E., Chessman, B.C., Metzeling, L., Tiller, D., and Dixon, L. (1994). RiverBioassessment Manual. Monitoring River Health Initiative, National River Processes andManagement Program, Commonwealth of Australia, Canberra.
DLWC (2002). Assessing Conservation Value and Health in New South Wales Rivers.Centre for Natural Resources, New South Wales Department of Land and WaterConservation, Parramatta.
Krasnicki, T., Pinto, R. and Read, M. (2001). Australia-wide Assessment of River Health:Tasmania Program. Technical Report No. WRA 01/2001. Department of Primary Industries,Water and Environment, Hobart.
Victorian Water Resource Data Warehouse (2003). AusRivAS ratings on stream health forthe Campaspe catchment, Victoria. http://www.vicwaterdata.net/home.asp
190 | A U S T R A L I A ’ S S T A T E O F T H E F O R E S T S R E P O R T 2 0 0 3
C H A P T E R 4

A U S T R A L I A ’ S S T A T E O F T H E F O R E S T S R E P O R T 2 0 0 3 | 191
C H A P T E R 4C H A P T E R 4
Monitoring and analysis of certain key physical and chemical variables in water can provideinformation on the ecological health of water bodies and how forestry operations ormanagement practices are affecting water quality. This is important both because of humanuse of water, and in determining the health of the aquatic environment in a forested area.This indicator is closely related to indicator 4.1f.
Water quality is monitored across the States and Territories to assess river condition andhealth and to determine whether water for different uses, including drinking water, satisfiesset criteria. Guidelines, which define threshold values of physico-chemical parameters, areprovided in the Australian and New Zealand Guidelines for Fresh and Marine Water Quality.Responsibility for monitoring and/or analysing data is varied and includes State/Territoryagencies, statutory authorities, catchment management authorities, local government andcommunity groups—such as those participating in Waterwatch.
In Victoria, the environmental condition of 950 stream reaches, representing 18 000 kilometresof major rivers and tributaries, has been assessed using the Index of Stream Condition (ISC).Assessment is based on 19 indicators relating to hydrology, streamside zone, physical form ofthe channel, water quality and aquatic life. Results show regional differences but, in general,pH is decreasing, there is a slight increase in turbidity, a decrease in salinity and a slightdecrease in total nitrogen. Only 56 of the total 950 stream reaches fully meet the criteriafor ecologically healthy rivers as defined by the ISC classification.
In New South Wales, the Stressed Rivers Report andthe Interim Environmental Objectives developed bythe Environment Protection Authority provideframeworks for either describing the current healthof river systems or for developing management toolsto optimise river health in the future (Figure 45 andTable 68). Although some data provide snapshots ofthe current status for some rivers, temporal trendsare not evident yet due to the limited time seriesavailable. Regional State of the Environmentreporting for the Australian Capital Regionincluding the Australian Capital Territory and thesouth east region of New South Wales has compileddata for water quality since 1990. Some trends arebeginning to emerge, particularly in relation to
Physio-chemical properties of water bodies
Indicator 4.1g Per cent of water bodies in forest areas—e.g., stream kilometres, lake hectares—withsignificant variance from the historic range of variability in pH, dissolved oxygen,levels of chemicals (electrical conductivity), sedimentation or temperature change
RationaleTo use the physio-chemical parameters to assess the health of the aquatic environment andthe quality of water for human use (drinking, irrigation, recreation) and ecosystem health.
Although some monitoring is carried out in most jurisdictions there
are insufficient data to report fully on this indicator.
Water sampling
coverage
currrency
frequency
Mic
hael
F. R
yan

192 | A U S T R A L I A ’ S S T A T E O F T H E F O R E S T S R E P O R T 2 0 0 3
C H A P T E R 4
temperature, nutrients and salinity, but these are not conclusive without appropriate analysisusing tools which take into account variability that may be due to seasonality, climate,landuse and non-constant variance.
State Forests of New South Wales has been conducting hydrology research projects for morethan 25 years, investigating the impacts of forest management activities on water quality andquantity. At present State Forests operates more than 35 stream gauging and water qualitymonitoring stations in a number of State Forests’ regions. Results of research projects andwater quality monitoring have shown that runoff containing fine sediment from unsealedroads is the major potential source of water pollution in a managed forest environment.
Further research by State Forests, universities, CSIRO and the Cooperative Research Centrefor Catchment Hydrology has demonstrated that due to strict sediment control measuresState Forests' management activities do not have an adverse impact on water quality.
In Queensland, the State of the Rivers project uses the Anderson Method of rapid appraisalof stream condition. However this does not assess hydrology, water quality or aquatic biota.In Western Australia, ongoing Statewide monitoring is being undertaken, and increasingtrends have been identified in relation to salinity, but there are no measurement programs torecord changes in other chemical properties relating to this indicator, or sedimentation.
Figure 45: Land tenure and water resources in the Towamba/Genoa River catchment, New South Wales
Source: New South Wales Environment Protection Authority (2000).
It is clear from the data and additional information available that while water qualitymonitoring is undertaken in each of the States and Territories, and catchment managementplanning is a major activity, there is no specific focus on the contribution of forest tocatchment condition at a broad scale. Research undertaken in small forested catchmentsindicates that water quality varies in response to the design, spatial distribution and use ofroads, harvesting, wildfire and climate. The effects of these activities vary according to soilerodibility, rainfall erosivity, slope, antecedent soil moisture conditions and vegetationcharacteristics. State codes of practice and licenses provide prescriptions to protect waterquality through appropriate design, use and distribution of roads and water crossings.

A U S T R A L I A ’ S S T A T E O F T H E F O R E S T S R E P O R T 2 0 0 3 | 193
C H A P T E R 4
However, system responses to complex processes operating in multiple land use largecatchments have not been investigated, so extrapolation of these research findings is notfeasible. Relevant research has also not been undertaken in forested catchments whereminimal disturbance occurs.
Further reading
Anderson, J.R. (1993) State of the Rivers Project. Report 1. Development and Validationof the Methodology. Department of Primary Industries, Queensland.
ANZECC (2000). National Water Quality Management Strategy. Australian and NewZealand Guidelines for Fresh and Marine Water Quality. Australian and New ZealandEnvironment and Conservation Council, Canberra.
Cornish, P.M. (1992). Water quality following logging on the Tantawanglo researchcatchment. Report to Tantawanglo Technical Committee. Forestry Commission of NewSouth Wales, Pennant Hills.
Department of Natural Resources and Environment. (2002) Victorian River Health Strategy.Department of Natural Resources and Environment, Melbourne.
DLWC (1998). Stressed Rivers Assessment Report: NSW State Summary 1998. Departmentof Land and Water Conservation, New South Wales.
Doeg, T.J. and Koehn, J.D. (1990). A Review of Australian Studies on the Effects of ForestryPractices on Aquatic Values. SSP Technical Report no. 5. Fisheries Division, Department ofConservation and Environment.
New South Wales Environment Protection Authority. (2000). Towamba and Genoa RiverCatchments, Catchment at a glance http://www.epa.nsw.gov.au/ieo/Towamba
Harper, P.B. and Lacey, S.T. (1995). A review of findings from the Yambulla CatchmentsHydrological Research Project, 1979–1990. State Forests of New South Wales, Pennant Hills.
O’Shaughnessy, P.J. and Jayasuriya, M.D.A. (1991). Water Supply Catchment HydrologyResearch: Status Report 1991. Melbourne Water, Melbourne.
Table 68: Stress classifications for Towamba catchment, New South Wales for selected streams shown in Figure 32
Overall stress Full development Hydrology EnvironmentalSub-catchment classification stress classification stress rating stress rating
Pambula River S3 (medium environmental stress, high extraction) Unresolved High Medium
Towamba River S5 (high environmental stress, low extraction) S5 Low High
Mid Towamba River U3 (medium environmental stress, low extraction) U3 Low Medium
Mataganah Creek U3 (medium environmental stress, low extraction) S4 Low Medium
Wonboyn River U3 (medium environmental stress, low extraction) U2 Low Medium
Nullica Creek U4 (low environmental stress, low extraction) Unresolved Low Low
Wog Wog River Unresolved Unresolved Low Low
Source: Department of Land and Water Conservation, New South Wales (1998)

194 | A U S T R A L I A ’ S S T A T E O F T H E F O R E S T S R E P O R T 2 0 0 3
C H A P T E R 4C H A P T E R 4
Persistent toxic substances
Indicator 4.1hArea and per cent of forest land experiencing an accumulation of persistenttoxic substances
RationaleToxic substances can adversely affect important ecological processes in forest ecosystems.They may also be transported in water or sediments. Knowledge of the trend and cause ofaccumulated toxic substances can be used to design corrective measures that lower future risks.
While guidelines have been developed that deal with the use of toxic and
persistent substances, no national data are collected for this indicator.
Currently there is no systematic monitoring of forest soil pollution in Australia, except forlimited areas where bio-solids and treated effluent are applied.
An important mechanism to avoid soil pollution in forests is outlined in guidelines containedin codes of forest practice. These guidelines in codes deal with the use of pesticides, chemicals,the application of fertilisers and the careful storage and use of fuel or oil.
In forested areas one issue of concern is the impact on the environment of the applicationof heavy loads of fire retardant chemicals, as part of fire suppression activities. Fire retardantscontain high concentrations of nutrients—nitrogen, phosphorus and sulphur—as well asvery small amounts of performance additives. Minimising the use of retardants in areaswhere there is a high risk of transport to streams following fires, or where there are sensitiveecosystems and water supply catchments, can mitigate risks to the environment.
Case study
The New South Wales Environment Protection Authority (EPA) has produced comprehensiveenvironmental guidelines for the use and disposal of bio-solid products. Bio-solids can beapplied to forests, but in doing so, there is a strong emphasis on the protection of soil andwater values, particularly from nitrate leaching. The guidelines require analysis of the bio-solid to determine the pathogen and heavy metal contamination levels. This is followed bythe requirement to meet appropriate application and management practices. Ongoingmonitoring of soil and water contaminant levels is required. Land application is variedaccording to the sensitivity of the area to loss of ecological, natural, cultural or heritagevalues. Buffer zones are required around sensitive areas, and there are limits on the quantityand frequency of bio-solid application. Each application must be licensed by the EPA.
Guidelines for the disposal of bio-solid products are being refined, based on research byState Forests New South Wales. Research has been conducted on the effects of bio-solidapplication rate on growth and soil nutrient change in pine plantations. It determined thatthe release of organic nitrogen from decomposing bio-solids under a pine stand were muchhigher than indicated in the EPA guidelines. Significant leaching of nitrate occurred fromaerobically-digested bio-solids at one site, indicating the need for monitoring to provide datato support more site-specific management.
coverage
currrency
frequency

Further reading
Beese, F.O. and Ludwig, B. (2001). Indicators to guide management for multiple forest use.Pp. 199–213 in R.J. Raison, A.G. Brown and D.W. Flinn (eds) Criteria and Indicators forSustainable Forest Management. IUFRO Research Series, No. 7. CABI, Wallingford.
EPA (1997). Use and Disposal of Biosolid Products: Environmental guidelines.Environmental Protection Agency, Chatswood.
Forest Practices Board (2000). Tasmanian Forest Practices Code, Tasmaina.
Gould, J.S., Khanna, P.K., Hutchings, P.T., Cheney, N.P., and Raison, R.J. (1999).Assessment of the Effectiveness and Environmental Risk of Use of Retardants to Assist inWildfire Control in Victoria. Client Report No. 672. CSIRO Forestry and Forest Products,Canberra.
Innes, J.L. and Karnosky, D.F. (2001). Impacts of environmental stress on forest health: theneed for more accurate indicators. Pp. 215–230 in R.J. Raison, A.G. Brown and D.W. Flinn(eds) Criteria and Indicators for Sustainable Forest Management. IUFRO Research Series,No. 7. CABI, Wallingford.
Robinson, M.B. (1999). Nitrogen Dynamics After Application of Biosolids to a Pinus radiataPlantation. PhD Thesis, University Melbourne, Melbourne.
A U S T R A L I A ’ S S T A T E O F T H E F O R E S T S R E P O R T 2 0 0 3 | 195
C H A P T E R 4