soil dynamics and earthquake engineering -...
TRANSCRIPT
Soil Dynamics and Earthquake Engineering 30 (2010) 1430–1445
Contents lists available at ScienceDirect
Soil Dynamics and Earthquake Engineering
0267-72
doi:10.1
n Corr
E-m
journal homepage: www.elsevier.com/locate/soildyn
Interaction of foundation�structure systems with seismically precariousslopes: Numerical analysis with strain softening constitutive model
R. Kourkoulis, I. Anastasopoulos, F. Gelagoti, G. Gazetas n
National Technical University of Athens, Greece
a r t i c l e i n f o
Article history:
Received 18 November 2009
Received in revised form
28 April 2010
Accepted 1 May 2010
61/$ - see front matter & 2010 Elsevier Ltd. A
016/j.soildyn.2010.05.001
esponding author.
ail address: [email protected] (G. Gazet
a b s t r a c t
This paper studies the combined effects of earthquake-triggered landslides and ground shaking on
foundation�structure systems founded near slope crests. Plane-strain nonlinear finite element
dynamic analyses are performed. The soil constitutive model is calibrated against published data to
simulate the (post-peak) softening behavior of soil during a seismic event and under the action of
gravitational forces. The plastic shear zones and the yield accelerations obtained from our dynamic
analyses are shown to be consistent with the slip surfaces and the seismic coefficients obtained by
classical pseudostatic limiting equilibrium and limit analysis methods. The foundation and frame
columns and beams are modeled as flexural beam elements, while the possibility of sliding and
detachment (separation) between the foundation and the underlying soil is considered through the use
of special frictional gap elements. The effects of foundation type (isolated footings versus a rigid raft) on
the position of the sliding surface, on the foundation total and differential displacements, and on the
distress of the foundation slab and superstructure columns, are explored parametrically. It is shown
that a frame structure founded on a properly designed raft could survive the combined effects of slope
failure and ground shaking, even if the latter is the result of a strong base excitation amplified by the
soil layer and slope topography.
& 2010 Elsevier Ltd. All rights reserved.
1. Introduction
The seismic bearing capacity of shallow footings on top ofslopes has been studied mostly with pseudostatic limitequilibrium methods, which impose the inertia of soil mass in asimplified way [56,55,6,79]. Such studies have produced diagramsfor assessing the reduction in bearing capacity as the foundationgets closer to the crest. But evidently, limit equilibrium methodswould only very crudely simulate soil–structure interactioneffects during earthquake shaking. This is especially the casewith soils that degrade with increasing number of cycles, such asthose examined in the present study. On the other hand, thedecrease of strength from its peak to the residual value, leading toprogressive soil failure, is dealt in the limiting equilibriummethod in a conservative simplified way [70,60,80]. To simulateprogressive soil-failure and shear-zone development, finite ele-ment analyses have been in use for more than 30 years (e.g.[24,31,13,40,49,32,74,51].
While all the above studies were performed for static orpseudo-static conditions, the present study is dynamic, based onnon-linear finite element modeling with a post-peak softeningmaterial law. The potential separation of the foundation from the
ll rights reserved.
as).
soil, due either to separation (uplift) or to the downward slopemovement during landslide, is properly taken into account. Theanalysis can capture (with reasonable engineering realism)the mechanism of progressive slope failure and the influence ofthe presence of the foundation on the path of the generatedfailure zone. The soil is assumed to be dry, and pore pressure buildup due to cyclic loading is not modeled.
2. Analysis of slope stability: overview
Numerous methods have been developed for assessing thestability of soil slopes, most of which are based on the conceptof ideally plastic response when failure is imminent. Amongthem, the limit equilibrium methods enjoy wide acceptance dueto their reasonable agreement with reality and their simplicity[17,8,26,41,64]. Complex soil profiles, seepage, and a variety ofloading conditions can be easily dealt with [77]. Limit equilibriumsolutions, however, are not rigorous. To be called rigorous,a solution must satisfy the equilibrium equations, the compat-ibility conditions, the constitutive relations of all materials, andthe boundary conditions. Limit equilibrium methods often violatethe stress boundary conditions, they do not enforce an appro-priate plastic flow rule for the soil, while the developing stressesmay not everywhere obey the requirement for non-exceedanceof soil strength. Moreover, the introduction of assumptions
R. Kourkoulis et al. / Soil Dynamics and Earthquake Engineering 30 (2010) 1430–1445 1431
necessary to remove static indeterminacy leads to kinematicallyinadmissible collapse mechanisms.
On the other hand, limit analysis models the soil as a perfectlyplastic material obeying an associative flow rule. If the normalitycondition is applied to a frictional soil with a friction angle j, it isimplied that large volume expansion occurs during plastic flow.Frictional soils are found experimentally to dilate considerablyless than predicted by the normality condition: hence real soils donot follow the associative flow rule [6]. However, in slopestability, lateral earth pressure, and bearing capacity problems,deformation conditions are not so restrictive and the actualsoil deformation properties do not affect the collapse loadsignificantly. Hence, it is reasonable to utilize the limit analysiswith the associated flow rule for the analysis of slope stability.Drescher and Detournay [14] and Michalowski [38] have exten-ded the applicability of the method to soils with non-associatedflow rule.
The limit-analysis solution is bounded according to theupper-bound and lower-bound theorems [15,11,81]. These arerigorous solutions only in the sense that either the ‘‘stress’’ fieldassociated with a lower-bound solution is in equilibrium with theimposed loads at the boundaries, or the ‘‘velocity’’ field associatedwith an upper-bound solution is compatible with imposed‘‘velocities’’. Lower-bound solutions satisfy equilibrium; upper-bound solutions provide collapse mechanisms. The (usually small)discrepancy between upper-bound and lower-bound solutionsprovides a built-in error check on the accuracy of the approximatecollapse load [77].
Due to the complexity in construction of proper stress andvelocity fields and in obtaining the optimal solutions, themethod of limit analysis has not prevailed. Moreover, it isnot computationally straightforward to include effects such asthe existence of pore water pressures, soil inhomogeneity,and irregular slope geometry. Recently, however, finite-element-based methods for calculating upper bound solution of slopeswith multilayered or irregularly deposited soil profiles have beendeveloped [82,83].
The finite element (FE) method is an alternative approachemployed with two different methodologies: (a) those that searchfor the critical slip surface using stress fields obtained from thestress and deformation FE analysis ; and (b) those that computethe factor of safety through an iterative finite element analysis, bythe ‘strength reduction technique’ [78,35,22,24,31,40,50,49,13,32,74,51].
In the latter category of methods, finite elements are utilized tomodel the development of shear zones and the progressive failure ofsoil. The advantages of the FE approach over the conventional slopestability methods can be summarized as follows:
�
No assumption needs to be made a priori about the shape andlocation of the slip surface. Failure occurs naturally within thesoil when the applied shear stresses exceed the shear strengthof the soil mass. � The solution is kinematically admissible, and there are noarbitrary assumptions about the slice side forces.
� It can capture progressive failure phenomena, and providesinformation about the displacement field until the ultimatestate.
� It can readily (if not easily) handle irregular slope geometriesin 2 and 3 dimensions, complex soil stratigraphy, andcalculation of flow quantities (due to steady seepage, or totransient flow).
Moving now to the seismic problem, it is noted that despite theadvances in static slope stability analysis, in the realm of limit
equilibrium methods seismic stability is still largely approachedpseudo-statically. Notwithstanding the uncertainties in determin-ing the required (single) horizontal acceleration, the pseudo-staticapproach is often inadequate to describe the behavior of soils thatprogressively lose their strength with increasing number of cyclesand to account for the interplay of the deforming slope withstructures on top of it.
In this paper, we propose a non-linear FE-analyses-basedprocedure for seismic analysis of a slope with a strain-softeningsoil. The constitutive relation is calibrated to realisticallysimulate the response of both clayey and sandy soils undercyclic loading. The sliding surface is not pre-defined but‘‘emerges’’ naturally as a continuous shear band comprisingsoil elements that have reached or exceeded their peak shearstrength.
3. Problem statement, numerical discretisation, steps of theanalysis
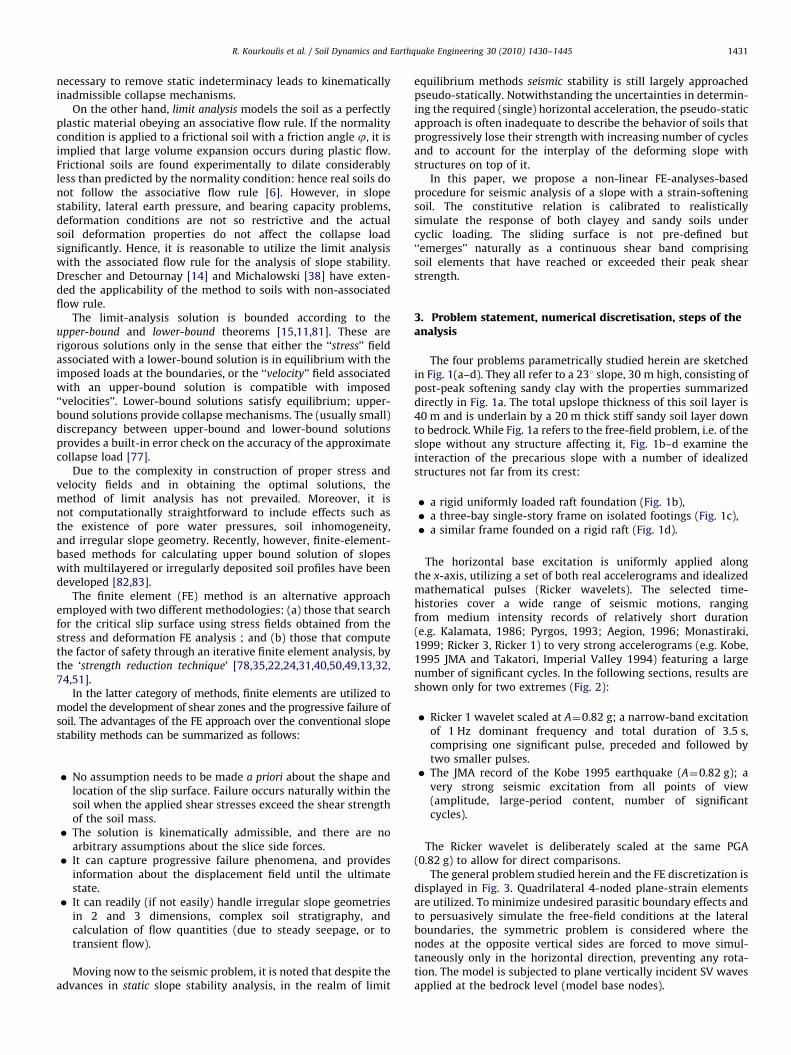
The four problems parametrically studied herein are sketchedin Fig. 1(a–d). They all refer to a 231 slope, 30 m high, consisting ofpost-peak softening sandy clay with the properties summarizeddirectly in Fig. 1a. The total upslope thickness of this soil layer is40 m and is underlain by a 20 m thick stiff sandy soil layer downto bedrock. While Fig. 1a refers to the free-field problem, i.e. of theslope without any structure affecting it, Fig. 1b–d examine theinteraction of the precarious slope with a number of idealizedstructures not far from its crest:
�
a rigid uniformly loaded raft foundation (Fig. 1b), � a three-bay single-story frame on isolated footings (Fig. 1c), � a similar frame founded on a rigid raft (Fig. 1d).The horizontal base excitation is uniformly applied alongthe x-axis, utilizing a set of both real accelerograms and idealizedmathematical pulses (Ricker wavelets). The selected time-histories cover a wide range of seismic motions, rangingfrom medium intensity records of relatively short duration(e.g. Kalamata, 1986; Pyrgos, 1993; Aegion, 1996; Monastiraki,1999; Ricker 3, Ricker 1) to very strong accelerograms (e.g. Kobe,1995 JMA and Takatori, Imperial Valley 1994) featuring a largenumber of significant cycles. In the following sections, results areshown only for two extremes (Fig. 2):
�
Ricker 1 wavelet scaled at A¼0.82 g; a narrow-band excitationof 1 Hz dominant frequency and total duration of 3.5 s,comprising one significant pulse, preceded and followed bytwo smaller pulses. � The JMA record of the Kobe 1995 earthquake (A¼0.82 g); avery strong seismic excitation from all points of view(amplitude, large-period content, number of significantcycles).
The Ricker wavelet is deliberately scaled at the same PGA(0.82 g) to allow for direct comparisons.
The general problem studied herein and the FE discretization isdisplayed in Fig. 3. Quadrilateral 4-noded plane-strain elementsare utilized. To minimize undesired parasitic boundary effects andto persuasively simulate the free-field conditions at the lateralboundaries, the symmetric problem is considered where thenodes at the opposite vertical sides are forced to move simul-taneously only in the horizontal direction, preventing any rota-tion. The model is subjected to plane vertically incident SV wavesapplied at the bedrock level (model base nodes).
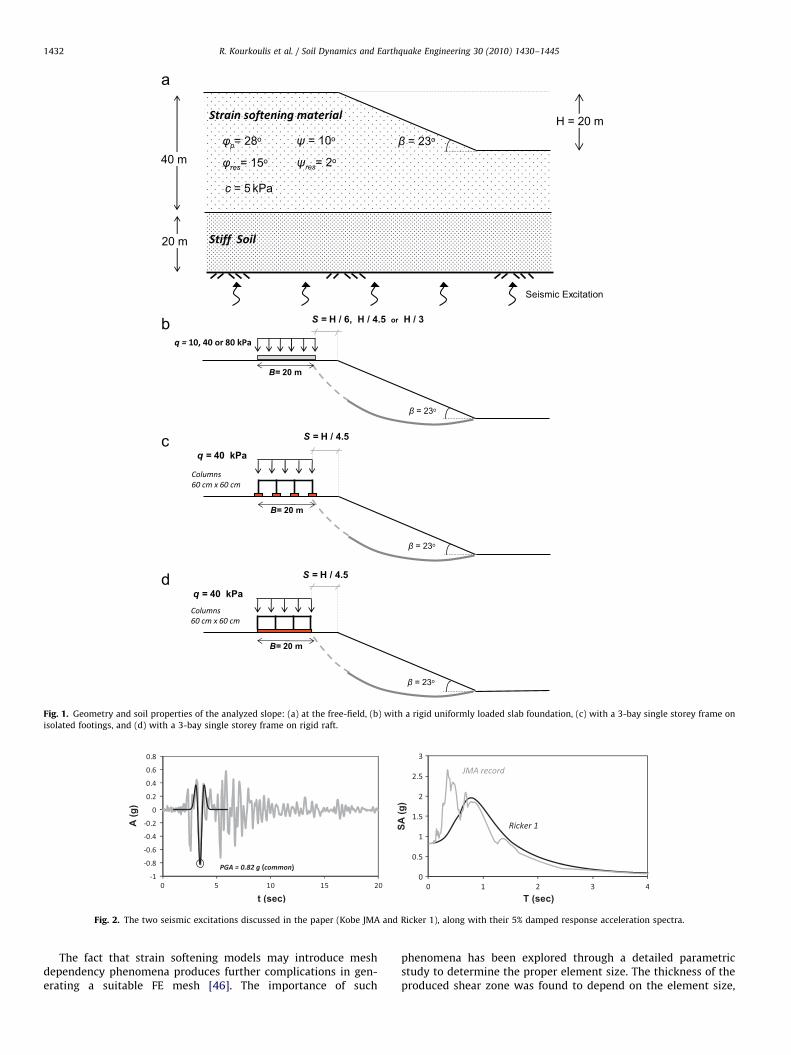
Fig. 1. Geometry and soil properties of the analyzed slope: (a) at the free-field, (b) with a rigid uniformly loaded slab foundation, (c) with a 3-bay single storey frame on
isolated footings, and (d) with a 3-bay single storey frame on rigid raft.
Fig. 2. The two seismic excitations discussed in the paper (Kobe JMA and Ricker 1), along with their 5% damped response acceleration spectra.
R. Kourkoulis et al. / Soil Dynamics and Earthquake Engineering 30 (2010) 1430–14451432
The fact that strain softening models may introduce meshdependency phenomena produces further complications in gen-erating a suitable FE mesh [46]. The importance of such
phenomena has been explored through a detailed parametricstudy to determine the proper element size. The thickness of theproduced shear zone was found to depend on the element size,
R. Kourkoulis et al. / Soil Dynamics and Earthquake Engineering 30 (2010) 1430–1445 1433
dFE, of the FE grid. For dFEr0.5 m the location of the failuresurface is not sensitive to mesh density. For the purpose of thepresent study, a discretization of 0.5 m�0.5 m (in the area ofthe slope) has been adopted. Towards the lateral boundaries ofthe model (where the accuracy requirements loosen) the mesh iscoarser: 2 m�1 m. The use of finer mesh has no effect on theposition of the concentrated plastic shear zone (which we maycall ‘failure’ zone for brevity), while at the same time thecomputational time increases exponentially.
The numerical analysis is performed in three consecutive steps:
(1)
Fig.Elem
Fig.Mate
Gravity loading (static analysis) establishment of the initialstate of stress in the slope.
(2)
Seismic excitation (dynamic analysis) triggering of shear band(depending on the intensity of seismic shaking, a shear band3. Finite element mesh. In the area of the slope the discretizaton is denser (0.5 m�0.5 m
entary transmitting boundaries ensure insignificant contamination of the response wit
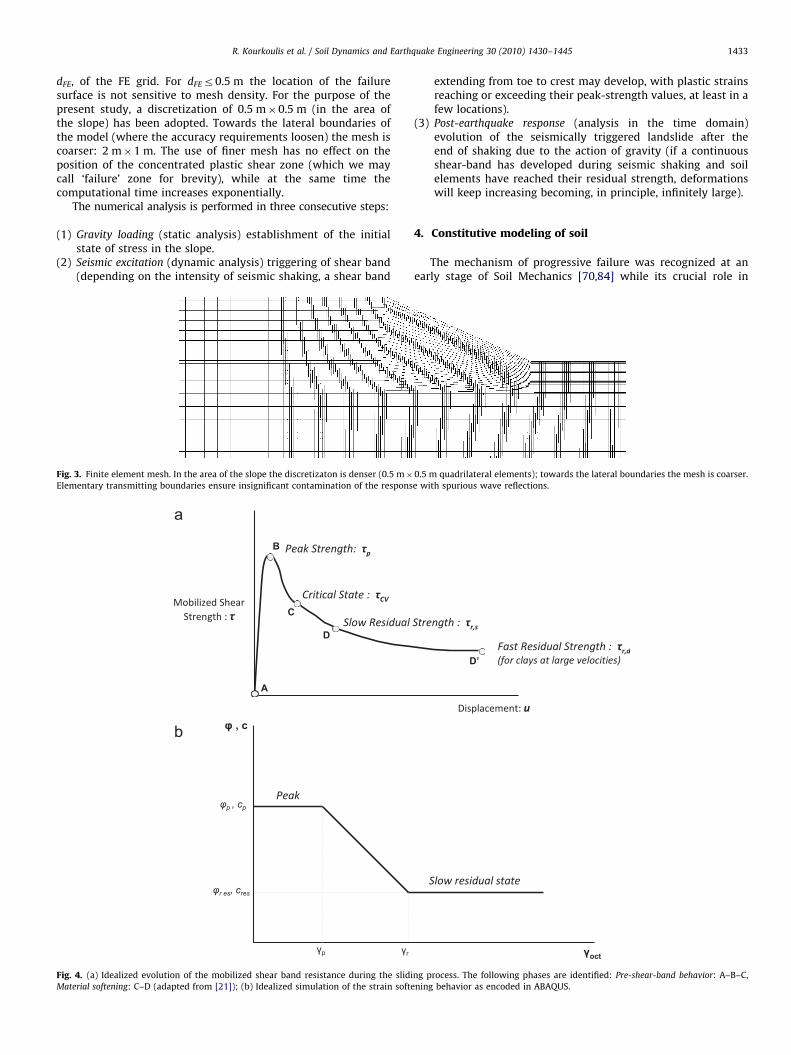
4. (a) Idealized evolution of the mobilized shear band resistance during the sliding p
rial softening: C–D (adapted from [21]); (b) Idealized simulation of the strain softening
extending from toe to crest may develop, with plastic strainsreaching or exceeding their peak-strength values, at least in afew locations).
(3)
Post-earthquake response (analysis in the time domain)evolution of the seismically triggered landslide after theend of shaking due to the action of gravity (if a continuousshear-band has developed during seismic shaking and soilelements have reached their residual strength, deformationswill keep increasing becoming, in principle, infinitely large).4. Constitutive modeling of soil
The mechanism of progressive failure was recognized at anearly stage of Soil Mechanics [70,84] while its crucial role in
quadrilateral elements); towards the lateral boundaries the mesh is coarser.
h spurious wave reflections.
rocess. The following phases are identified: Pre-shear-band behavior: A–B–C,
behavior as encoded in ABAQUS.
R. Kourkoulis et al. / Soil Dynamics and Earthquake Engineering 30 (2010) 1430–14451434
stability problems was revealed by Skempton [60], Peck [44], andTurnbull and Hvorslev [75]. Progressive failure of soil occurs if itdeforms non-uniformly. Then, as post-peak strains within thefailure zone increase, the mobilized resistance reduces from peaktowards residual. Final rupture of the soil mass usually takes placebefore the residual strength has developed everywhere. Thus, theaverage strength of the mass at failure is less than the peakstrength of the soil and greater than the residual strength.Although complete numerical analyses with incorporating pro-gressive failure were performed quite early [24], there are stillrelatively few pertinent examples in the literature [53,68,7,27,50,13].
The residual strength of clay has been studied extensively andnumerous correlations between slow residual strength and indexproperties have been proposed (e.g. [33,61,10,72]). As shownschematically in Fig. 4a, soil behavior can be categorized in twodistinguished phases [21]:
1.
Pre-shear-band behavior (path A–B–C): The peak strength ismobilized at the very early stage of displacement, and thendrops to the critical state, triggering the creation of a shearband.2.
Material softening (path C–D): The material inside the shearband is frictionally softened due to strain rate increase.In this study we adopt an elastoplastic constitutive model withMohr–Coulomb failure criterion, and isotropic strain softeningproperly calibrated in order to ‘‘macroscopically’’ imitate thepreviously described behavior of clay under shear loading. Pre-yield behavior (path A–B in Fig. 4a) is modeled as linear elastic,with a secant modulus Gs¼ty/gy linearly increasing with depth.Post-peak material softening (path B–C–D or B–C–D0) is modeledthrough a reduction of the mobilized friction angle j and dilationangle c with the increase of octahedral plastic shear strain. Asshown in Fig. 4b, the model assumes a linear decrease of j and cwith increasing plastic octahedral shear strain to their slowresidual state values, jres and cres, respectively. The model isencoded in the FE numerical algorithm ABAQUS through a usersubroutine. Model parameters are calibrated through direct sheartest results, as described in Anastasopoulos et al. [5].
Despite its simplicity and (perhaps) lack of generality, theconstitutive model employed herein is believed to captureadequately the predominant mode of deformation of the studiedproblem. The values utilized in the analyses discussed below are:jpeak¼28o, jres¼151, c¼10o, cres¼01, yield strain gy¼2%, andfailure strain gf¼12%.
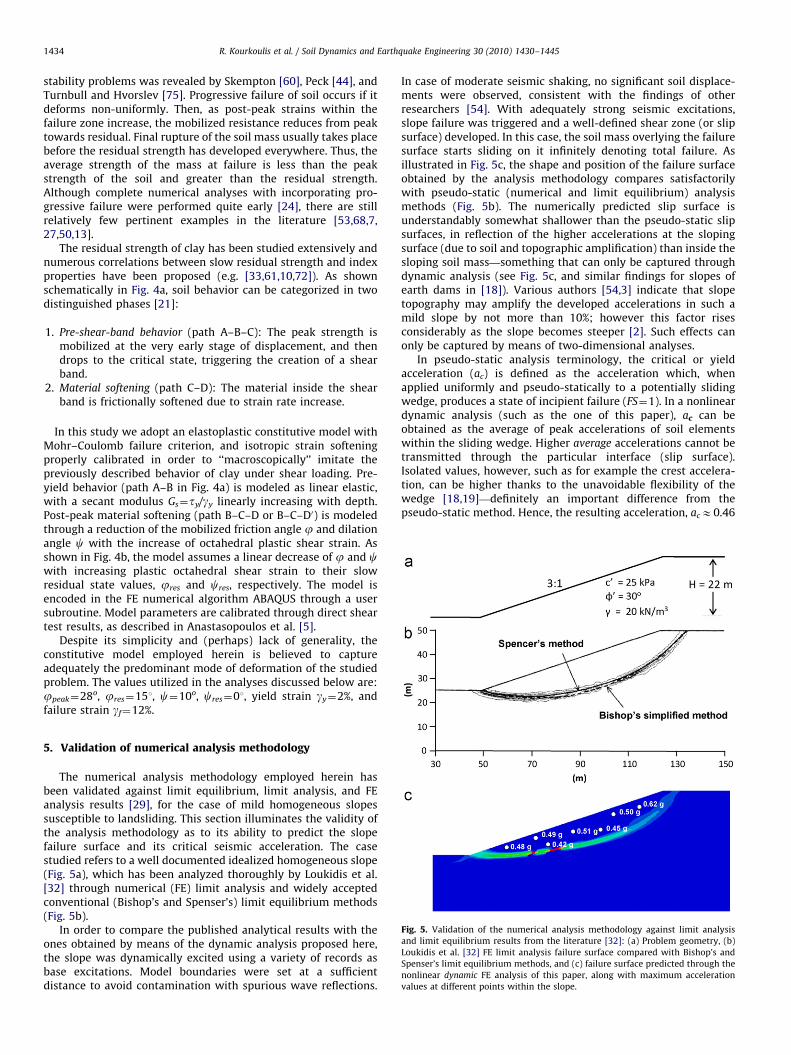
Fig. 5. Validation of the numerical analysis methodology against limit analysis
and limit equilibrium results from the literature [32]: (a) Problem geometry, (b)
Loukidis et al. [32] FE limit analysis failure surface compared with Bishop’s and
Spenser’s limit equilibrium methods, and (c) failure surface predicted through the
nonlinear dynamic FE analysis of this paper, along with maximum acceleration
values at different points within the slope.
5. Validation of numerical analysis methodology
The numerical analysis methodology employed herein hasbeen validated against limit equilibrium, limit analysis, and FEanalysis results [29], for the case of mild homogeneous slopessusceptible to landsliding. This section illuminates the validity ofthe analysis methodology as to its ability to predict the slopefailure surface and its critical seismic acceleration. The casestudied refers to a well documented idealized homogeneous slope(Fig. 5a), which has been analyzed thoroughly by Loukidis et al.[32] through numerical (FE) limit analysis and widely acceptedconventional (Bishop’s and Spenser’s) limit equilibrium methods(Fig. 5b).
In order to compare the published analytical results with theones obtained by means of the dynamic analysis proposed here,the slope was dynamically excited using a variety of records asbase excitations. Model boundaries were set at a sufficientdistance to avoid contamination with spurious wave reflections.
In case of moderate seismic shaking, no significant soil displace-ments were observed, consistent with the findings of otherresearchers [54]. With adequately strong seismic excitations,slope failure was triggered and a well-defined shear zone (or slipsurface) developed. In this case, the soil mass overlying the failuresurface starts sliding on it infinitely denoting total failure. Asillustrated in Fig. 5c, the shape and position of the failure surfaceobtained by the analysis methodology compares satisfactorilywith pseudo-static (numerical and limit equilibrium) analysismethods (Fig. 5b). The numerically predicted slip surface isunderstandably somewhat shallower than the pseudo-static slipsurfaces, in reflection of the higher accelerations at the slopingsurface (due to soil and topographic amplification) than inside thesloping soil mass—something that can only be captured throughdynamic analysis (see Fig. 5c, and similar findings for slopes ofearth dams in [18]). Various authors [54,3] indicate that slopetopography may amplify the developed accelerations in such amild slope by not more than 10%; however this factor risesconsiderably as the slope becomes steeper [2]. Such effects canonly be captured by means of two-dimensional analyses.
In pseudo-static analysis terminology, the critical or yieldacceleration (ac) is defined as the acceleration which, whenapplied uniformly and pseudo-statically to a potentially slidingwedge, produces a state of incipient failure (FS¼1). In a nonlineardynamic analysis (such as the one of this paper), ac can beobtained as the average of peak accelerations of soil elementswithin the sliding wedge. Higher average accelerations cannot betransmitted through the particular interface (slip surface).Isolated values, however, such as for example the crest accelera-tion, can be higher thanks to the unavoidable flexibility of thewedge [18,19]—definitely an important difference from thepseudo-static method. Hence, the resulting acceleration, acE0.46
R. Kourkoulis et al. / Soil Dynamics and Earthquake Engineering 30 (2010) 1430–1445 1435
g is slightly higher than the values from the limiting equilibriumanalysis (Spencer’s method: 0.43 g, Bishop’s: 0.42 g, Sarma’s:0.43 g) and quite similar to the numerical upper bound solutionof 0.45 g reported by Loukidis et al. [32]. It should be notedthat the analyses presented in the ensuing do not focus onthe accurate prediction of the slope critical acceleration andfailure surface location but rather on the effects of generalized,landslide-induced displacements on structures founded on theslope’s crest.
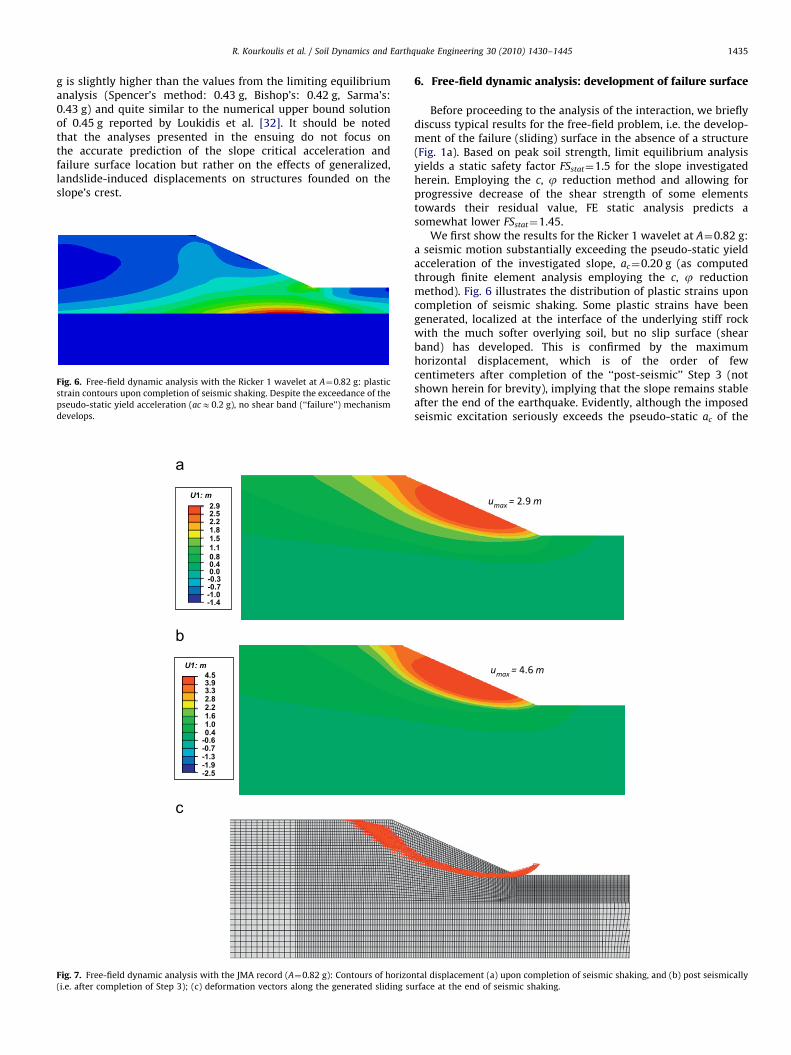
Fig. 6. Free-field dynamic analysis with the Ricker 1 wavelet at A¼0.82 g: plastic
strain contours upon completion of seismic shaking. Despite the exceedance of the
pseudo-static yield acceleration (acE0.2 g), no shear band (‘‘failure’’) mechanism
develops.
Fig. 7. Free-field dynamic analysis with the JMA record (A¼0.82 g): Contours of horizo
(i.e. after completion of Step 3); (c) deformation vectors along the generated sliding su
6. Free-field dynamic analysis: development of failure surface
Before proceeding to the analysis of the interaction, we brieflydiscuss typical results for the free-field problem, i.e. the develop-ment of the failure (sliding) surface in the absence of a structure(Fig. 1a). Based on peak soil strength, limit equilibrium analysisyields a static safety factor FSstat¼1.5 for the slope investigatedherein. Employing the c, j reduction method and allowing forprogressive decrease of the shear strength of some elementstowards their residual value, FE static analysis predicts asomewhat lower FSstat¼1.45.
We first show the results for the Ricker 1 wavelet at A¼0.82 g:a seismic motion substantially exceeding the pseudo-static yieldacceleration of the investigated slope, ac¼0.20 g (as computedthrough finite element analysis employing the c, j reductionmethod). Fig. 6 illustrates the distribution of plastic strains uponcompletion of seismic shaking. Some plastic strains have beengenerated, localized at the interface of the underlying stiff rockwith the much softer overlying soil, but no slip surface (shearband) has developed. This is confirmed by the maximumhorizontal displacement, which is of the order of fewcentimeters after completion of the ‘‘post-seismic’’ Step 3 (notshown herein for brevity), implying that the slope remains stableafter the end of the earthquake. Evidently, although the imposedseismic excitation seriously exceeds the pseudo-static ac of the
ntal displacement (a) upon completion of seismic shaking, and (b) post seismically
rface at the end of seismic shaking.
R. Kourkoulis et al. / Soil Dynamics and Earthquake Engineering 30 (2010) 1430–14451436
slope, the single strong motion cycle of the Ricker wavelet is notenough to generate a sliding surface.
The response of the slope is totally different when subjectedto the JMA record, which has the same PGA (A¼0.82 g)but dramatically different frequency content and kinematic
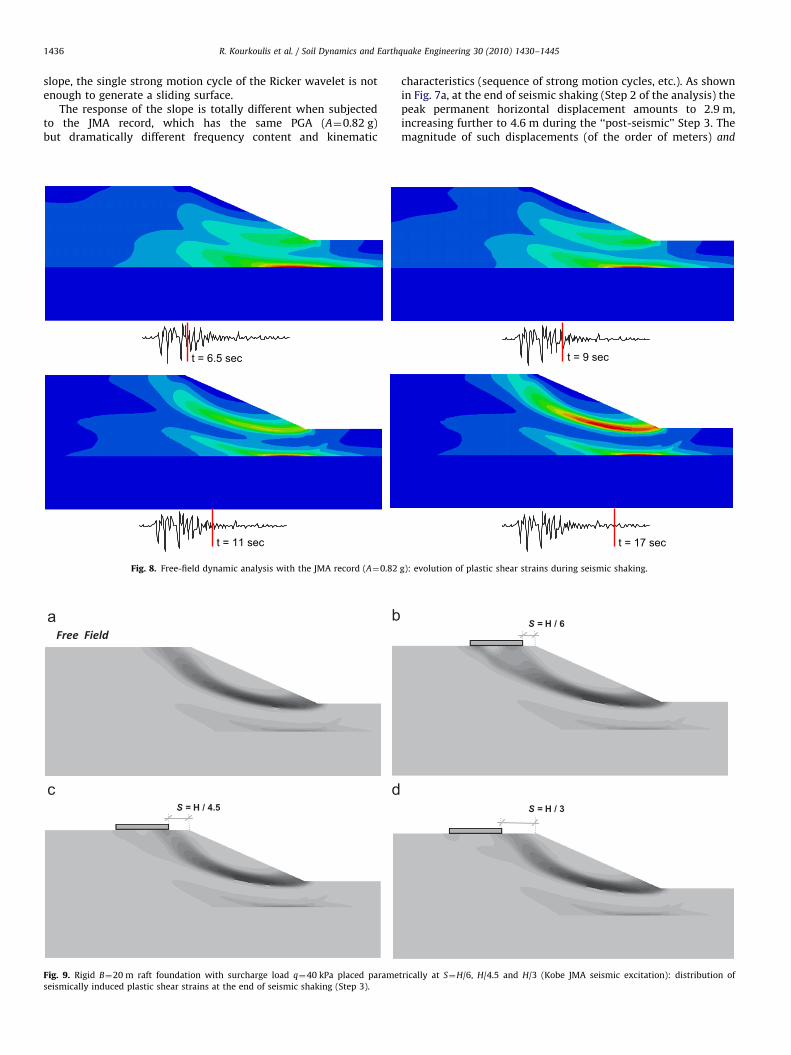
t = 6.5 sec
t = 11 sec
Fig. 8. Free-field dynamic analysis with the JMA record (A¼0.82
Fig. 9. Rigid B¼20 m raft foundation with surcharge load q¼40 kPa placed parame
seismically induced plastic shear strains at the end of seismic shaking (Step 3).
characteristics (sequence of strong motion cycles, etc.). As shownin Fig. 7a, at the end of seismic shaking (Step 2 of the analysis) thepeak permanent horizontal displacement amounts to 2.9 m,increasing further to 4.6 m during the ‘‘post-seismic’’ Step 3. Themagnitude of such displacements (of the order of meters) and
t = 9 sec
t = 17 sec
g): evolution of plastic shear strains during seismic shaking.
trically at S¼H/6, H/4.5 and H/3 (Kobe JMA seismic excitation): distribution of
R. Kourkoulis et al. / Soil Dynamics and Earthquake Engineering 30 (2010) 1430–1445 1437
the fact that they keep increasing after the end of the earthquake(Step 3), clearly imply the development of a sliding surface. This isconfirmed in Fig. 7c, in which we plot the deformation vectorsalong the sliding surface immediately after the completion of theseismic excitation. Fig. 8 depicts the evolution of the shear zoneduring seismic shaking. The failure zone initiates at the toe of theslope and propagates towards its crest. In contrast to the ‘‘weak’’single-pulse Ricker 1 wavelet, the JMA record not only hasmanaged to develop a continuous plastic shear localization, butsince the slope continues to ‘‘slide’’ after the end of theearthquake, it has generated enough plastic strain to ‘‘drive’’ theelements belonging to the sliding surface to their residual post-peak (reduced) strength values.
Summarizing, it is quite interesting to note that although thePGA of the two excitations shown here was exactly the same,the response differs completely not only in terms of theproduced displacements but also in terms of failure potential:while the Ricker wavelet is relatively harmless, the JMA record
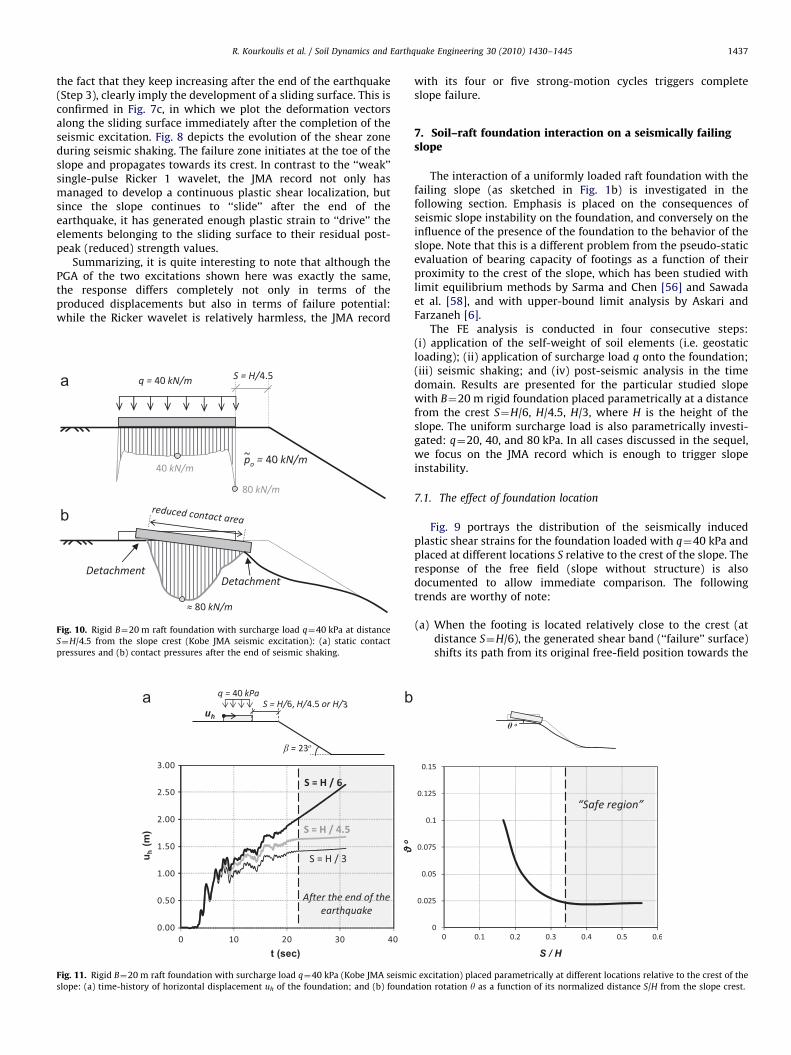
Fig. 10. Rigid B¼20 m raft foundation with surcharge load q¼40 kPa at distance
S¼H/4.5 from the slope crest (Kobe JMA seismic excitation): (a) static contact
pressures and (b) contact pressures after the end of seismic shaking.
Fig. 11. Rigid B¼20 m raft foundation with surcharge load q¼40 kPa (Kobe JMA seismi
slope: (a) time-history of horizontal displacement uh of the foundation; and (b) founda
with its four or five strong-motion cycles triggers completeslope failure.
7. Soil–raft foundation interaction on a seismically failingslope
The interaction of a uniformly loaded raft foundation with thefailing slope (as sketched in Fig. 1b) is investigated in thefollowing section. Emphasis is placed on the consequences ofseismic slope instability on the foundation, and conversely on theinfluence of the presence of the foundation to the behavior of theslope. Note that this is a different problem from the pseudo-staticevaluation of bearing capacity of footings as a function of theirproximity to the crest of the slope, which has been studied withlimit equilibrium methods by Sarma and Chen [56] and Sawadaet al. [58], and with upper-bound limit analysis by Askari andFarzaneh [6].
The FE analysis is conducted in four consecutive steps:(i) application of the self-weight of soil elements (i.e. geostaticloading); (ii) application of surcharge load q onto the foundation;(iii) seismic shaking; and (iv) post-seismic analysis in the timedomain. Results are presented for the particular studied slopewith B¼20 m rigid foundation placed parametrically at a distancefrom the crest S¼H/6, H/4.5, H/3, where H is the height of theslope. The uniform surcharge load is also parametrically investi-gated: q¼20, 40, and 80 kPa. In all cases discussed in the sequel,we focus on the JMA record which is enough to trigger slopeinstability.
7.1. The effect of foundation location
Fig. 9 portrays the distribution of the seismically inducedplastic shear strains for the foundation loaded with q¼40 kPa andplaced at different locations S relative to the crest of the slope. Theresponse of the free field (slope without structure) is alsodocumented to allow immediate comparison. The followingtrends are worthy of note:
(a)
c exc
tion
When the footing is located relatively close to the crest (atdistance S¼H/6), the generated shear band (‘‘failure’’ surface)shifts its path from its original free-field position towards the
itation) placed parametrically at different locations relative to the crest of the
rotation y as a function of its normalized distance S/H from the slope crest.
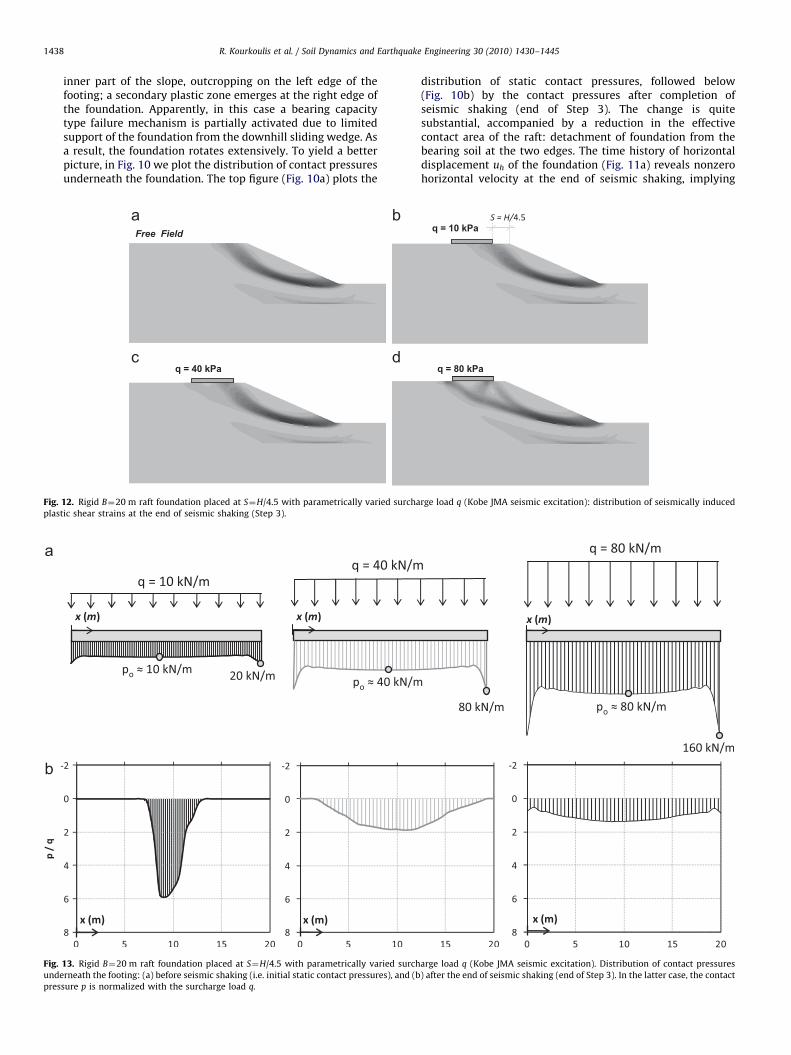
Fig.plas
Fig.unde
pres
R. Kourkoulis et al. / Soil Dynamics and Earthquake Engineering 30 (2010) 1430–14451438
inner part of the slope, outcropping on the left edge of thefooting; a secondary plastic zone emerges at the right edge ofthe foundation. Apparently, in this case a bearing capacitytype failure mechanism is partially activated due to limitedsupport of the foundation from the downhill sliding wedge. Asa result, the foundation rotates extensively. To yield a betterpicture, in Fig. 10 we plot the distribution of contact pressuresunderneath the foundation. The top figure (Fig. 10a) plots the
12. Rigid B¼20 m raft foundation placed at S¼H/4.5 with parametrically varied surcha
tic shear strains at the end of seismic shaking (Step 3).
13. Rigid B¼20 m raft foundation placed at S¼H/4.5 with parametrically varied surch
rneath the footing: (a) before seismic shaking (i.e. initial static contact pressures), and (b
sure p is normalized with the surcharge load q.
distribution of static contact pressures, followed below(Fig. 10b) by the contact pressures after completion ofseismic shaking (end of Step 3). The change is quitesubstantial, accompanied by a reduction in the effectivecontact area of the raft: detachment of foundation from thebearing soil at the two edges. The time history of horizontaldisplacement uh of the foundation (Fig. 11a) reveals nonzerohorizontal velocity at the end of seismic shaking, implying
rge load q (Kobe JMA seismic excitation): distribution of seismically induced
arge load q (Kobe JMA seismic excitation). Distribution of contact pressures
) after the end of seismic shaking (end of Step 3). In the latter case, the contact
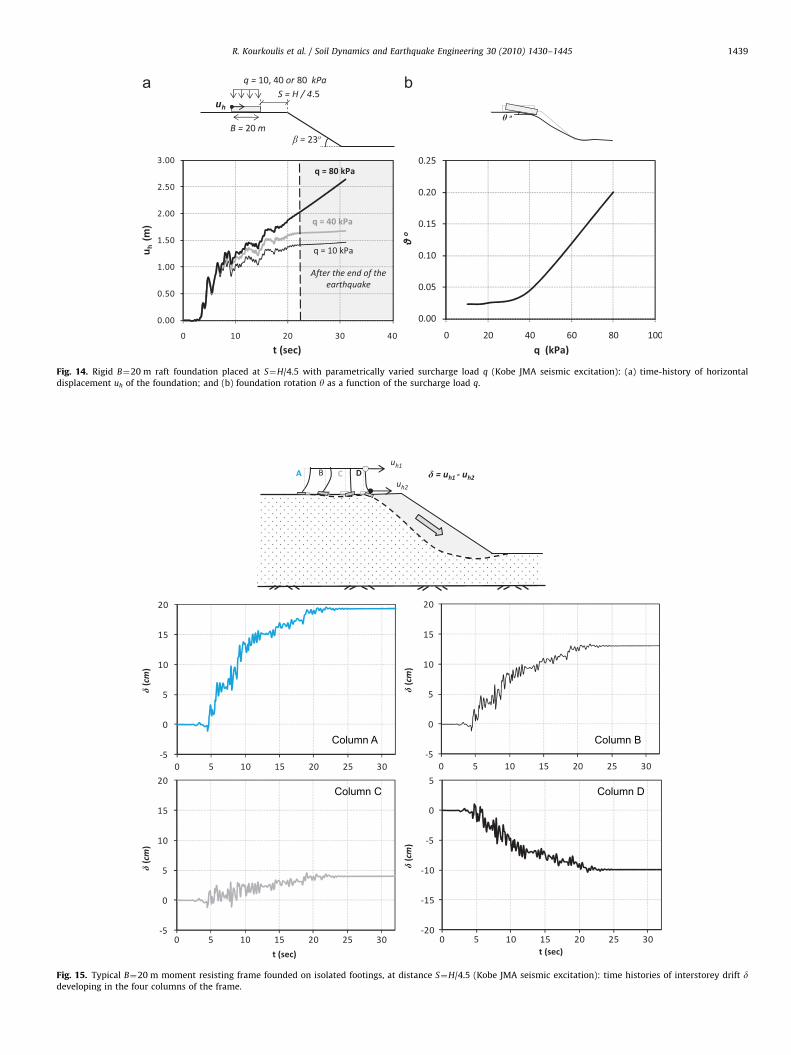
Fig. 14. Rigid B¼20 m raft foundation placed at S¼H/4.5 with parametrically varied surcharge load q (Kobe JMA seismic excitation): (a) time-history of horizontal
displacement uh of the foundation; and (b) foundation rotation y as a function of the surcharge load q.
Column A Column B
Column C Column D
Fig. 15. Typical B¼20 m moment resisting frame founded on isolated footings, at distance S¼H/4.5 (Kobe JMA seismic excitation): time histories of interstorey drift ddeveloping in the four columns of the frame.
R. Kourkoulis et al. / Soil Dynamics and Earthquake Engineering 30 (2010) 1430–1445 1439
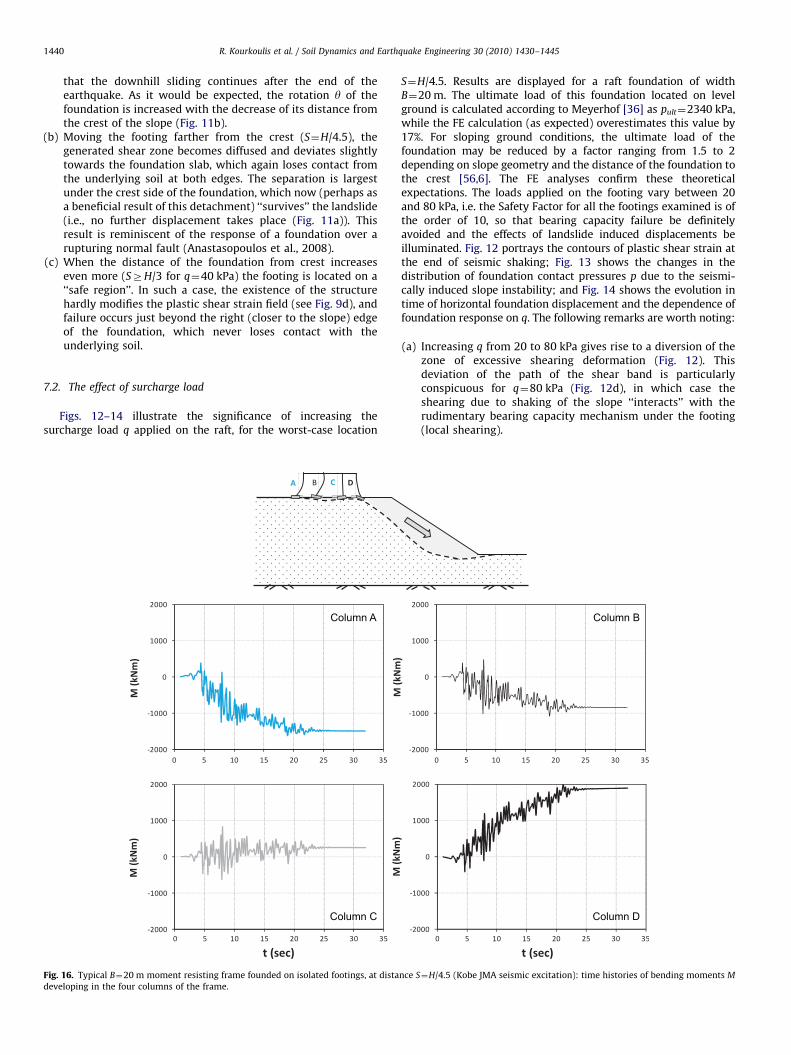
Fig.deve
R. Kourkoulis et al. / Soil Dynamics and Earthquake Engineering 30 (2010) 1430–14451440
that the downhill sliding continues after the end of theearthquake. As it would be expected, the rotation y of thefoundation is increased with the decrease of its distance fromthe crest of the slope (Fig. 11b).
(b)
Moving the footing farther from the crest (S¼H/4.5), thegenerated shear zone becomes diffused and deviates slightlytowards the foundation slab, which again loses contact fromthe underlying soil at both edges. The separation is largestunder the crest side of the foundation, which now (perhaps asa beneficial result of this detachment) ‘‘survives’’ the landslide(i.e., no further displacement takes place (Fig. 11a)). Thisresult is reminiscent of the response of a foundation over arupturing normal fault (Anastasopoulos et al., 2008).(c)
When the distance of the foundation from crest increaseseven more (SZH/3 for q¼40 kPa) the footing is located on a‘‘safe region’’. In such a case, the existence of the structurehardly modifies the plastic shear strain field (see Fig. 9d), andfailure occurs just beyond the right (closer to the slope) edgeof the foundation, which never loses contact with theunderlying soil.7.2. The effect of surcharge load
Figs. 12–14 illustrate the significance of increasing thesurcharge load q applied on the raft, for the worst-case location
Column A
Column C
16. Typical B¼20 m moment resisting frame founded on isolated footings, at dista
loping in the four columns of the frame.
S¼H/4.5. Results are displayed for a raft foundation of widthB¼20 m. The ultimate load of this foundation located on levelground is calculated according to Meyerhof [36] as pult¼2340 kPa,while the FE calculation (as expected) overestimates this value by17%. For sloping ground conditions, the ultimate load of thefoundation may be reduced by a factor ranging from 1.5 to 2depending on slope geometry and the distance of the foundation tothe crest [56,6]. The FE analyses confirm these theoreticalexpectations. The loads applied on the footing vary between 20and 80 kPa, i.e. the Safety Factor for all the footings examined is ofthe order of 10, so that bearing capacity failure be definitelyavoided and the effects of landslide induced displacements beilluminated. Fig. 12 portrays the contours of plastic shear strain atthe end of seismic shaking; Fig. 13 shows the changes in thedistribution of foundation contact pressures p due to the seismi-cally induced slope instability; and Fig. 14 shows the evolution intime of horizontal foundation displacement and the dependence offoundation response on q. The following remarks are worth noting:
(a)
nce S
Increasing q from 20 to 80 kPa gives rise to a diversion of thezone of excessive shearing deformation (Fig. 12). Thisdeviation of the path of the shear band is particularlyconspicuous for q¼80 kPa (Fig. 12d), in which case theshearing due to shaking of the slope ‘‘interacts’’ with therudimentary bearing capacity mechanism under the footing(local shearing).
Column B
Column D
¼H/4.5 (Kobe JMA seismic excitation): time histories of bending moments M
R. Kourkoulis et al. / Soil Dynamics and Earthquake Engineering 30 (2010) 1430–1445 1441
(b)
Fig.deve
The foundation detachment from the supporting soil due toseismically induced slope instability that was observed withthe light surcharge load (q¼20 kPa) is diminished with theheavier load (q¼40 kPa), practically disappearing for q¼80kPa (Fig. 13). Note that the remarkably large detachment ofthe lightly loaded foundation (only its middle 1/4 remains incontact) will generate huge bending moments on the raft.
(c)
Fig. 14a reveals that the heavily loaded foundation is not safe:it has positive velocity at the end of shaking, and itsdisplacement (outward and downward) continues to growunder the sole action of gravity (Step 4). Foundation rotation yincreases markedly with q (Fig. 14b).8. Soil–frame interaction on a seismically failing slope
This section analyzes, a typical 3-span, 20 m wide and 3 m-high, reinforced-concrete moment-resisting frame, consisting of0.60 m�0.60 m columns, founded: (a) on 1.5 m wide isolatedfootings, and (b) on a 1 m thick raft foundation (see Fig. 1c and d).Emphasis is placed on the consequences of the structural inertiaforces in conjunction with the imminent seismic slope instabilityon the distress of the foundation and the superstructure.
All structural components are modeled as elastic beamelements. Connection of the foundation nodes with the nodes of
Column A
Column C
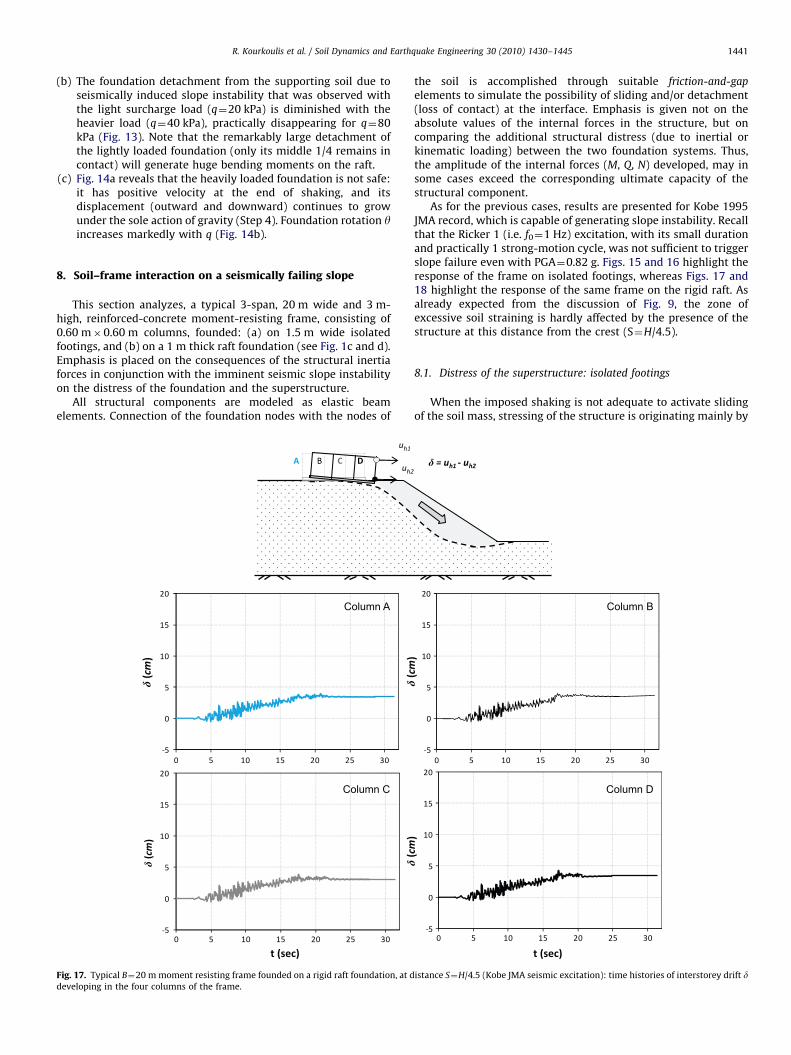
17. Typical B¼20 m moment resisting frame founded on a rigid raft foundation, at d
loping in the four columns of the frame.
the soil is accomplished through suitable friction-and-gap
elements to simulate the possibility of sliding and/or detachment(loss of contact) at the interface. Emphasis is given not on theabsolute values of the internal forces in the structure, but oncomparing the additional structural distress (due to inertial orkinematic loading) between the two foundation systems. Thus,the amplitude of the internal forces (M, Q, N) developed, may insome cases exceed the corresponding ultimate capacity of thestructural component.
As for the previous cases, results are presented for Kobe 1995JMA record, which is capable of generating slope instability. Recallthat the Ricker 1 (i.e. f0¼1 Hz) excitation, with its small durationand practically 1 strong-motion cycle, was not sufficient to triggerslope failure even with PGA¼0.82 g. Figs. 15 and 16 highlight theresponse of the frame on isolated footings, whereas Figs. 17 and18 highlight the response of the same frame on the rigid raft. Asalready expected from the discussion of Fig. 9, the zone ofexcessive soil straining is hardly affected by the presence of thestructure at this distance from the crest (S¼H/4.5).
8.1. Distress of the superstructure: isolated footings
When the imposed shaking is not adequate to activate slidingof the soil mass, stressing of the structure is originating mainly by
Column B
Column D
istance S¼H/4.5 (Kobe JMA seismic excitation): time histories of interstorey drift d
R. Kourkoulis et al. / Soil Dynamics and Earthquake Engineering 30 (2010) 1430–14451442
its inertial response. As previously discussed, for the slopegeometry and properties examined here, the JMA record triggersthe failure of the slope and consequently sparks off additionalkinematic loading on the structure founded atop the slope. It isworth noting that 2D wave propagation effects, perhaps leadingto ‘‘topographic’’ amplification, are taken into account inour analysis. It has been shown by numerous researchers thatsuch effects may lead to increased amplitude of ground shakingnear the crest of the slope. See, for example, Aki [1], Gazetas et al.[20], Pitilakis [47], Assimaki et al. [4], Ktenidou et al. [30], andPitilakis [48].
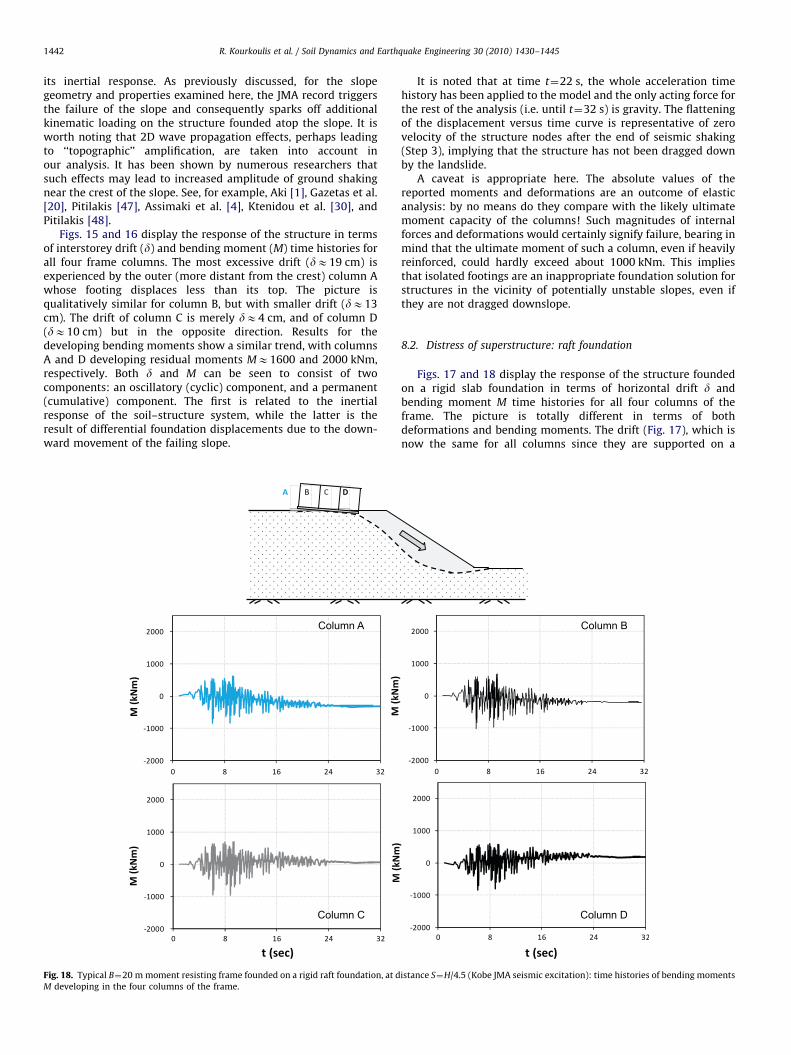
Figs. 15 and 16 display the response of the structure in termsof interstorey drift (d) and bending moment (M) time histories forall four frame columns. The most excessive drift (dE19 cm) isexperienced by the outer (more distant from the crest) column Awhose footing displaces less than its top. The picture isqualitatively similar for column B, but with smaller drift (dE13cm). The drift of column C is merely dE4 cm, and of column D(dE10 cm) but in the opposite direction. Results for thedeveloping bending moments show a similar trend, with columnsA and D developing residual moments ME1600 and 2000 kNm,respectively. Both d and M can be seen to consist of twocomponents: an oscillatory (cyclic) component, and a permanent(cumulative) component. The first is related to the inertialresponse of the soil–structure system, while the latter is theresult of differential foundation displacements due to the down-ward movement of the failing slope.
Column A
Column C
Fig. 18. Typical B¼20 m moment resisting frame founded on a rigid raft foundation, at d
M developing in the four columns of the frame.
It is noted that at time t¼22 s, the whole acceleration timehistory has been applied to the model and the only acting force forthe rest of the analysis (i.e. until t¼32 s) is gravity. The flatteningof the displacement versus time curve is representative of zerovelocity of the structure nodes after the end of seismic shaking(Step 3), implying that the structure has not been dragged downby the landslide.
A caveat is appropriate here. The absolute values of thereported moments and deformations are an outcome of elasticanalysis: by no means do they compare with the likely ultimatemoment capacity of the columns! Such magnitudes of internalforces and deformations would certainly signify failure, bearing inmind that the ultimate moment of such a column, even if heavilyreinforced, could hardly exceed about 1000 kNm. This impliesthat isolated footings are an inappropriate foundation solution forstructures in the vicinity of potentially unstable slopes, even ifthey are not dragged downslope.
8.2. Distress of superstructure: raft foundation
Figs. 17 and 18 display the response of the structure foundedon a rigid slab foundation in terms of horizontal drift d andbending moment M time histories for all four columns of theframe. The picture is totally different in terms of bothdeformations and bending moments. The drift (Fig. 17), which isnow the same for all columns since they are supported on a
Column B
Column D
istance S¼H/4.5 (Kobe JMA seismic excitation): time histories of bending moments
R. Kourkoulis et al. / Soil Dynamics and Earthquake Engineering 30 (2010) 1430–1445 1443
common rigid foundation, does not exceed dE3 cm despite theseverity of ground shaking: the deformation-related cumulativecomponent has practically disappeared. Similarly, the peakbending moments (Fig. 18) remain below the likely ultimatemoment capacity of the columns, while their residual value ispractically zero. Evidently, such deformation is mainly the resultof ground shaking (‘‘inertial’’ effect) and not of slope-induceddeformation (‘‘kinematic’’ effect).
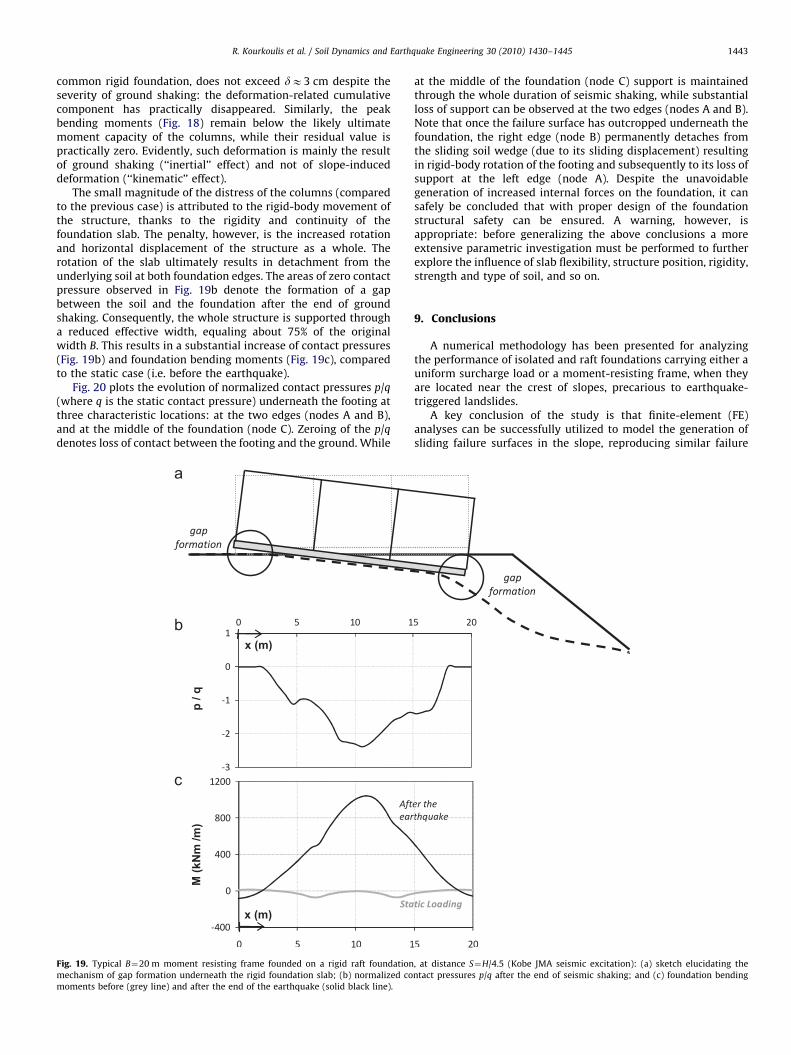
The small magnitude of the distress of the columns (comparedto the previous case) is attributed to the rigid-body movement ofthe structure, thanks to the rigidity and continuity of thefoundation slab. The penalty, however, is the increased rotationand horizontal displacement of the structure as a whole. Therotation of the slab ultimately results in detachment from theunderlying soil at both foundation edges. The areas of zero contactpressure observed in Fig. 19b denote the formation of a gapbetween the soil and the foundation after the end of groundshaking. Consequently, the whole structure is supported througha reduced effective width, equaling about 75% of the originalwidth B. This results in a substantial increase of contact pressures(Fig. 19b) and foundation bending moments (Fig. 19c), comparedto the static case (i.e. before the earthquake).
Fig. 20 plots the evolution of normalized contact pressures p/q(where q is the static contact pressure) underneath the footing atthree characteristic locations: at the two edges (nodes A and B),and at the middle of the foundation (node C). Zeroing of the p/qdenotes loss of contact between the footing and the ground. While
Fig. 19. Typical B¼20 m moment resisting frame founded on a rigid raft foundation
mechanism of gap formation underneath the rigid foundation slab; (b) normalized co
moments before (grey line) and after the end of the earthquake (solid black line).
at the middle of the foundation (node C) support is maintainedthrough the whole duration of seismic shaking, while substantialloss of support can be observed at the two edges (nodes A and B).Note that once the failure surface has outcropped underneath thefoundation, the right edge (node B) permanently detaches fromthe sliding soil wedge (due to its sliding displacement) resultingin rigid-body rotation of the footing and subsequently to its loss ofsupport at the left edge (node A). Despite the unavoidablegeneration of increased internal forces on the foundation, it cansafely be concluded that with proper design of the foundationstructural safety can be ensured. A warning, however, isappropriate: before generalizing the above conclusions a moreextensive parametric investigation must be performed to furtherexplore the influence of slab flexibility, structure position, rigidity,strength and type of soil, and so on.
9. Conclusions
A numerical methodology has been presented for analyzingthe performance of isolated and raft foundations carrying either auniform surcharge load or a moment-resisting frame, when theyare located near the crest of slopes, precarious to earthquake-triggered landslides.
A key conclusion of the study is that finite-element (FE)analyses can be successfully utilized to model the generation ofsliding failure surfaces in the slope, reproducing similar failure
, at distance S¼H/4.5 (Kobe JMA seismic excitation): (a) sketch elucidating the
ntact pressures p/q after the end of seismic shaking; and (c) foundation bending
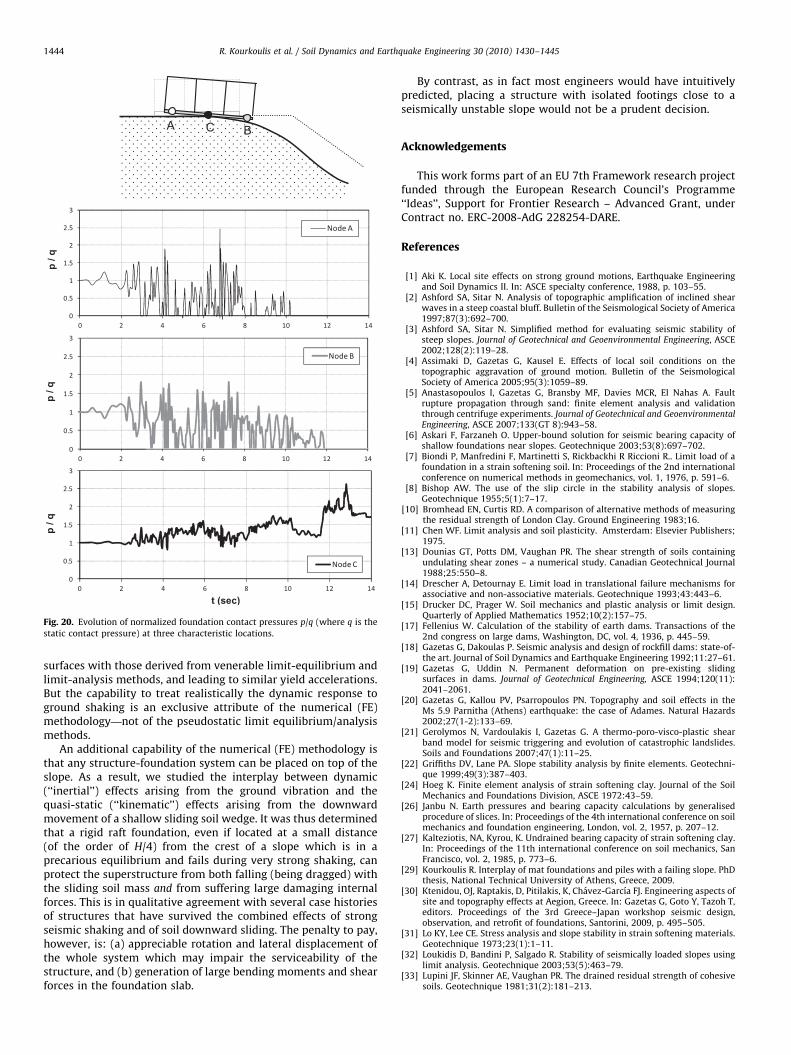
Fig. 20. Evolution of normalized foundation contact pressures p/q (where q is the
static contact pressure) at three characteristic locations.
R. Kourkoulis et al. / Soil Dynamics and Earthquake Engineering 30 (2010) 1430–14451444
surfaces with those derived from venerable limit-equilibrium andlimit-analysis methods, and leading to similar yield accelerations.But the capability to treat realistically the dynamic response toground shaking is an exclusive attribute of the numerical (FE)methodology—not of the pseudostatic limit equilibrium/analysismethods.
An additional capability of the numerical (FE) methodology isthat any structure-foundation system can be placed on top of theslope. As a result, we studied the interplay between dynamic(‘‘inertial’’) effects arising from the ground vibration and thequasi-static (‘‘kinematic’’) effects arising from the downwardmovement of a shallow sliding soil wedge. It was thus determinedthat a rigid raft foundation, even if located at a small distance(of the order of H/4) from the crest of a slope which is in aprecarious equilibrium and fails during very strong shaking, canprotect the superstructure from both falling (being dragged) withthe sliding soil mass and from suffering large damaging internalforces. This is in qualitative agreement with several case historiesof structures that have survived the combined effects of strongseismic shaking and of soil downward sliding. The penalty to pay,however, is: (a) appreciable rotation and lateral displacement ofthe whole system which may impair the serviceability of thestructure, and (b) generation of large bending moments and shearforces in the foundation slab.
By contrast, as in fact most engineers would have intuitivelypredicted, placing a structure with isolated footings close to aseismically unstable slope would not be a prudent decision.
Acknowledgements
This work forms part of an EU 7th Framework research projectfunded through the European Research Council’s Programme‘‘Ideas’’, Support for Frontier Research – Advanced Grant, underContract no. ERC-2008-AdG 228254-DARE.
References
[1] Aki K. Local site effects on strong ground motions, Earthquake Engineeringand Soil Dynamics II. In: ASCE specialty conference, 1988, p. 103–55.
[2] Ashford SA, Sitar N. Analysis of topographic amplification of inclined shearwaves in a steep coastal bluff. Bulletin of the Seismological Society of America1997;87(3):692–700.
[3] Ashford SA, Sitar N. Simplified method for evaluating seismic stability ofsteep slopes. Journal of Geotechnical and Geoenvironmental Engineering, ASCE2002;128(2):119–28.
[4] Assimaki D, Gazetas G, Kausel E. Effects of local soil conditions on thetopographic aggravation of ground motion. Bulletin of the SeismologicalSociety of America 2005;95(3):1059–89.
[5] Anastasopoulos I, Gazetas G, Bransby MF, Davies MCR, El Nahas A. Faultrupture propagation through sand: finite element analysis and validationthrough centrifuge experiments. Journal of Geotechnical and GeoenvironmentalEngineering, ASCE 2007;133(GT 8):943–58.
[6] Askari F, Farzaneh O. Upper-bound solution for seismic bearing capacity ofshallow foundations near slopes. Geotechnique 2003;53(8):697–702.
[7] Biondi P, Manfredini F, Martinetti S, Rickbackhi R Riccioni R.. Limit load of afoundation in a strain softening soil. In: Proceedings of the 2nd internationalconference on numerical methods in geomechanics, vol. 1, 1976, p. 591–6.
[8] Bishop AW. The use of the slip circle in the stability analysis of slopes.Geotechnique 1955;5(1):7–17.
[10] Bromhead EN, Curtis RD. A comparison of alternative methods of measuringthe residual strength of London Clay. Ground Engineering 1983;16.
[11] Chen WF. Limit analysis and soil plasticity. Amsterdam: Elsevier Publishers;1975.
[13] Dounias GT, Potts DM, Vaughan PR. The shear strength of soils containingundulating shear zones – a numerical study. Canadian Geotechnical Journal1988;25:550–8.
[14] Drescher A, Detournay E. Limit load in translational failure mechanisms forassociative and non-associative materials. Geotechnique 1993;43:443–6.
[15] Drucker DC, Prager W. Soil mechanics and plastic analysis or limit design.Quarterly of Applied Mathematics 1952;10(2):157–75.
[17] Fellenius W. Calculation of the stability of earth dams. Transactions of the2nd congress on large dams, Washington, DC, vol. 4, 1936, p. 445–59.
[18] Gazetas G, Dakoulas P. Seismic analysis and design of rockfill dams: state-of-the art. Journal of Soil Dynamics and Earthquake Engineering 1992;11:27–61.
[19] Gazetas G, Uddin N. Permanent deformation on pre-existing slidingsurfaces in dams. Journal of Geotechnical Engineering, ASCE 1994;120(11):2041–2061.
[20] Gazetas G, Kallou PV, Psarropoulos PN. Topography and soil effects in theMs 5.9 Parnitha (Athens) earthquake: the case of Adames. Natural Hazards2002;27(1-2):133–69.
[21] Gerolymos N, Vardoulakis I, Gazetas G. A thermo-poro-visco-plastic shearband model for seismic triggering and evolution of catastrophic landslides.Soils and Foundations 2007;47(1):11–25.
[22] Griffiths DV, Lane PA. Slope stability analysis by finite elements. Geotechni-que 1999;49(3):387–403.
[24] Hoeg K. Finite element analysis of strain softening clay. Journal of the SoilMechanics and Foundations Division, ASCE 1972:43–59.
[26] Janbu N. Earth pressures and bearing capacity calculations by generalisedprocedure of slices. In: Proceedings of the 4th international conference on soilmechanics and foundation engineering, London, vol. 2, 1957, p. 207–12.
[27] Kalteziotis, NA, Kyrou, K. Undrained bearing capacity of strain softening clay.In: Proceedings of the 11th international conference on soil mechanics, SanFrancisco, vol. 2, 1985, p. 773–6.
[29] Kourkoulis R. Interplay of mat foundations and piles with a failing slope. PhDthesis, National Technical University of Athens, Greece, 2009.
[30] Ktenidou, OJ, Raptakis, D, Pitilakis, K, Chavez-Garcıa FJ. Engineering aspects ofsite and topography effects at Aegion, Greece. In: Gazetas G, Goto Y, Tazoh T,editors. Proceedings of the 3rd Greece–Japan workshop seismic design,observation, and retrofit of foundations, Santorini, 2009, p. 495–505.
[31] Lo KY, Lee CE. Stress analysis and slope stability in strain softening materials.Geotechnique 1973;23(1):1–11.
[32] Loukidis D, Bandini P, Salgado R. Stability of seismically loaded slopes usinglimit analysis. Geotechnique 2003;53(5):463–79.
[33] Lupini JF, Skinner AE, Vaughan PR. The drained residual strength of cohesivesoils. Geotechnique 1981;31(2):181–213.
R. Kourkoulis et al. / Soil Dynamics and Earthquake Engineering 30 (2010) 1430–1445 1445
[35] Matsui T, San KC. Finite element slope stability analysis by shear strengthreduction technique. Soils and Foundations 1992;32:59–70.
[36] Meyerhof, GG. The bearing capacity of foundations under eccentric andinclined loads. In: Proceedings of the 3rd international conference on soilmechanics and foundation engineering, Zurich, vol. 1, 1953, p. 440–5.
[38] Michalowski RL. Slope stability analysis: a kinematic approach’. Geotechni-que 1995;45(2):283–93.
[40] Modaressi, H, Aubry D, Faccioli, E Noret, C. Numerical modelling approachesfor the analysis of the earthquake triggered landslides. In: Prakash S, editor.Proceedings of the 3rd international conference on recent advances ingeotechnical earthquake engineering and soil dynamics, St. Louis, MO, vol II,1995, p. 833–43.
[41] Morgenstern N, Price VE. The analysis of the stability of general slip surfaces.Geotechnique 1965;15(1):79–93.
[44] Peck RB. Stability of natural slope. Journal of Soil Mechanics and FoundationsDivision, ASCE 1967;93:403–36.
[46] Pietruszezak S, Mroz Z. Finite element analysis of deformation of strainsoftening material. International Journal of Numerical Methods in Engineer-ing 1981;17(3):327.
[47] Pitilakis K. Site effects. In: Ansal A, editor. recent advances in geotechnicalearthquake engineering and microzonation. Kluwer Academic; 2004. p.139–98. Chapter 5.
[48] Pitilakis D. Topographic irregularities and soil–foundation–structure inter-action. In: Gazetas G, Goto Y, Tazoh T, editors, Proceedings of the 3rd Greece–Japan workshop seismic design, observation, and retrofit of foundations,Santorini, 2009, p. 335–43.
[49] Potts DM, Kovacevic N, Vaughan PR. Delayed collapse of cut slopes in stiffclay. Geotechnique 1997;47(5):953–82.
[50] Potts DM, Dounias GT, Vaughan PR. Finite element analysis of progressivefailure of Carsington embankment. Geotechnique 1990;40(1):79–101.
[51] Pradel D, Smith PM, Stewart JP, Raad G. Case history of landslide movementduring the nothridge earthquake. Journal of Geotechnical and Geoenviron-mental Engineering, ASCE 2005;11:1360–9.
[53] Prevost JH, Hoeg K. Soil mechanics and plasticity analysis of strain softening.Geotechnique 1975;25(3):279–97.
[54] Rathje EM, Bray JD. One- and two-dimensional seismic analysis of solid-waste landfills. Canadian Geotechnical Journal 2001;38(4):850–62.
[55] Sarma SK, Iossifelis IS. Seismic bearing capacity factors of shallow stripfootings. Geotechnique 1990;40(2):265–73.
[56] Sarma SK, Chen YC. Bearing capacity of strip footings near sloping groundduring earthquakes. Proceedings of the 11th world conference on earthquakeengineering, Acapulco, 1996.
[58] Sawada T, Nomachi SG, Chen WF. Seismic bearing capacity of a moundedfoundation near a down-hill slope by pseudo-static analysis. Soils andFoundations 1994;34(1):11–7.
[60] Skempton AW. Long term stability of clay slopes. Geotechnique1964;14(2):77–101.
[61] Skempton AW. Slope stability of cuttings in brown London Clay. In:Proceedings of the 9th international conference on soil mechanics andfoundation engineering, San Francisco, vol. 3, 1985, p. 261–70.
[64] Spencer E. A method of analysis of the stability of embankments assumingparallel interslice forces. Geotechnique 1967;17(1):11–26.
[68] Sture S, Ko HY. Stress analysis of strain softening clay. In: Proceedings of the2nd international conference on numerical methods in geomechanics, vol. 1,1976, p. 580–9.
[70] Terzaghi K, Peck RB. Soil mechanics in engineering practice, 1st ed.. NewYork: Wiley; 1948.
[72] Tika ThE, Hutchinson JN. Ring shear tests on soil from the Vaiont landslideslip surface. Geotechnique 1999;49(1):59–74.
[74] Troncone A. Numerical analysis of a landslide in soils with strain-softeningbehaviour. Geotechnique 2005;55(8):585–96.
[75] Turnbull WJ, Hvorslev MJ. Special problems in slope stability. Journal of SoilMechanics and Foundation Engineering, ASCE 1967;93(SM4):499–528.
[77] Yu HS, Salgado R, Sloan SW, Kim JM. Limit analysis versus limit equilibrium forslope stability. Journal of Geotechnical Engineering, ASCE 1998;124(1):1–11.
[78] Zienkiewicz OC, Humpheson C, Lewis RW. Associated and non-associatedviscoplasticity and plasticity in soil mechanics. Geotechnique 1975;25:671–89.
[79] Kumar J, Rao VBKM. Seismic bearing capacity factors for spread foundations.Geotechnique 2002;52(2):79–88.
[80] Bjerrum L. Progressive failure in slopes of over consolidated plastic clays andclay shales. I. Jour. Soil Mech. Fdn. Div., ASCE, 1967, p. 93–349.
[81] Davis RO, Selvadurai APS. Elasticity and geomechanics. Cambridge UniversityPress, New York (2002).
[82] Chuang PH. Stability analysis in geomechanics by linear programming, partI–II, J. Geotech. Eng., 118, 1992, p. 1696–726.
[83] Jiang GL, Magnan JP. Stability analysis of embankments: comparison of limitanalysis with method of slices. Geotechnique 1997;47(4):857–72.
[84] Taylor DW, (1948), Fundamentals of soil mechanics. New York: Wiley, 700 p.