soil dynamics and earthquake engineering - kostas...
TRANSCRIPT

Contents lists available at ScienceDirect
Soil Dynamics and Earthquake Engineering
journal homepage: www.elsevier.com/locate/soildyn
Dynamic properties of polypropylene fibre-reinforced silica quarry sand
Haiwen Lia, Kostas Senetakisb,⁎
a University of New South Wales (UNSW), Sydney, Australiab City University of Hong Kong, Hong Kong China
A B S T R A C T
The study reports on the dynamic behavior of fibre-reinforced sand with a focus on the shear modulus at verysmall strains. A set of twenty four specimens composed of a silica quarry sand reinforced with different per-centages of polypropylene fibres was constructed in the laboratory using two different resonant columns em-bedded with bender element inserts. One resonant column is of the fixed-free type and the second apparatus is ofthe fixed-partly fixed type. The percentages of fibre ranged from 0% to 2% and the specimens were tested in afully saturated state following an isotropic stress path. The shear modulus of the specimens obtained from thebender element tests was computed based on the measured shear wave velocities considering an equivalentdensity instead of the bulk density. This is because the bender element test method corresponds to a high-frequency technique and adjustment of soil density should take place to account for the relative movementbetween the solid skeleton and the water that fills the pores. This adjustment provided a better comparisonbetween the obtained moduli from resonant column and bender element tests. Based on the set of experiments, itwas found that the small strain shear modulus of the specimens reduced with an increase of the fibre content,which trend was more pronounced for fibre contents greater than 0.5%. The use of a granular void ratio intypical power-law type formulae for the expression of soil modulus could not work effectively, as for example ithappens in granular binary mixtures. Based on the experiments, a formula was developed that correlates stiffnessto pressure. In this regard, an additional set of dynamic tests was conducted including twenty newly createdspecimens in order to further validate the new expression, which is more applicable for a well-graded quarrysand as physical portion and for contents of polypropylene fibre from 0% to 2%.
1. Introduction
Fibre-reinforcement of soils is a technique that has received greatattention in geotechnical engineering research and practice. This isbecause the inclusion of synthetic fibres has been proven experimen-tally to improve the shearing behavior of soils, which has been attrib-uted to the mobilization of the tensile strength of fibres at larger de-formations ([11,12,7–9], among others). Previous works, for examplethe studies by Dos Santos et al. [11] and Miranda Pino and Baudet [23],reported that the inclusion of fibres in soils leads to a shift of the criticalstate line (CSL) and the limiting normal compression line (NCL) of thefibre-reinforced material in comparison to the CSL and limiting NCL ofthe unreinforced soil. The contribution of fibres reinforcement has beenfound to be more effective for well-graded soils and soils with moreangular in shape grains [20]. This contribution, in terms of practicalapplications, implies that the fibre inclusion provides a means of in-creasing strength of the fibre-soil geosynthetic, which improves theground behavior against large deformation problems. In addition,
notable studies have shown that fibre-reinforcement can improve theliquefaction resistance of soils (e.g., [15,17]). For example, Ibraim et al.[15] reported that fibre reinforcement can increase the static lique-faction resistance of sands against compression and extension mono-tonic shearing and that the behavior is altered from strain-softening tostrain-hardening.
However the complete characterization of soil behavior requires theknowledge of its mechanical properties in a wide range of strains, in-cluding, apart from the large deformation behavior, the ranges of verysmall and small-to-medium strains. The stiffness at very small strains,expressed with the small-strain or maximum shear modulus (Gmax), isan essential property for the geotechnical characterization and themodeling of the small-to-medium strain behavior of geomaterials. Aprevious study by Clariá and Vettorelo [6] found that the inclusion offibres tends to reduce the initial stiffness of fibre reinforced soils at lowstrain levels. Michalowski and Čermák [22] suggested that when thefibre content is higher than 0.5%, the stiffness of the reinforced soil atsmall strains is reduced. However, in their study, the effect of void ratio
http://dx.doi.org/10.1016/j.soildyn.2017.05.035Received 25 February 2017; Received in revised form 17 May 2017; Accepted 29 May 2017
⁎ Corresponding author.E-mail address: [email protected] (K. Senetakis).
Soil Dynamics and Earthquake Engineering 100 (2017) 224–232
0267-7261/ © 2017 Elsevier Ltd. All rights reserved.
MARK

was overlooked. Another previous work by Heineck et al. [14] de-monstrated that the fibre inclusion is not effective at very small strains.In particular, Heineck et al. [14] found that the stiffness remained ap-proximately the same in magnitude when the soils they tested werereinforced with polypropylene fibres. However their study was limitedon that a percentage of 0.5% of fibre content was only considered.
In the present work, a set of resonant column and bender elementtests was carried out on samples composed of a silica quarry sand mixedwith polypropylene fibres using percentages of fibre in the range of 0%to 2%. The results were analysed by means of a power-law type ex-pression, commonly adopted in soil dynamics research and the effect ofthe void ratio was isolated in order to examine the sole effect of fibreinclusion and content on the stiffness of the specimens. In addition,free-vibration exercise was applied to the specimens to capture theirsmall strain damping ratio, thus providing information for both stiffnessand damping of fibre-reinforced sand and the role of fibre inclusion andcontent.
2. Materials and methods
2.1. Materials used and sample preparation
A well-graded silica sand composed of a quarry material was used asparent soil in the study. This material is a typical potential fill-backfillsoil which may find many applications in geotechnical and transpor-tation engineering projects. Prior to sample preparation, the parentmaterial was washed, oven-dried and sieved in order to prepare a sandof target grading characteristics removing the fine-grained inclusion.The washed sand had a mean grain size equal to 1.00 mm, a coefficientof uniformity equal to 6.1 and a specific gravity of solids equal to 2.65.The grading curve of the washed material is given in Fig. 1 and ascanning electron microscope (SEM) image of the sand is given in Fig. 2.Observation of the grains through the SEM images as well as through anoptical microscope demonstrated that the sand is composed pre-dominantly of irregular in shape grains. An empirical type chart pro-posed by Krumbein and Sloss [16], which was modified later by Choet al. [5] was used to quantify three particle shape descriptors; thesphericity (S), the roundness (R) and the regularity (ρ). These quantitieswere found equal to S = 0.54, R = 0.28 and ρ = (S + R)/2 = 0.41 forthe quarry sand.
The sand was mixed in the laboratory with polypropylene fibresusing percentages of the synthetic material equal to 0% (pure sand),0.5%, 1.0%, 1.5% and 2.0%. These percentages corresponded to drymass of fibres with respect to the dry mass of the sand. The poly-propylene fibres have an average length of 12 mm and an averagethickness of 0.03 mm, with a specific gravity of 0.9. The specimenswere first mixed in a bowl using appropriate dry masses of sand andfibre portions and by adding a small amount of distilled water so that
the fibres could be uniformly distributed within the mass of the moistsample during the mixing process. Note that for a few specimenscomposed of pure sand, the preparation was carried out without theaddition of water. Thereafter, specimens were prepared with moistcompaction (or dry compaction with respect to two pure sand speci-mens) in split molds of appropriate dimensions into two different re-sonant columns embedded with bender element inserts. One resonantcolumn is of the Stokoe-type [13,19,4] which can accommodate spe-cimens of 50 × 100 mm in size (diameter × length). The second re-sonant column is of the Hardin-type [30] which can accommodatespecimens of 70 × 140 mm in size. After the preparation of the spe-cimens, the resonant column was assembled and typical procedures ofsample saturation were followed in order to reach a B-value of at least0.95 in magnitude. After the saturation process was completed, thespecimens were subjected to an isotropic stress path with mean effec-tive confining pressures (p′) equal to 50, 100, 150, 200, 300 (if ap-plicable) and 400 kPa (if applicable). At each level of (p′), the samplewas allowed to consolidate prior to the conduction of torsional resonantcolumn tests and bender element tests. Measurements of the axialstrains of the specimens were implemented with a vertically positioneddisplacement transducer (LVDT). For the saturated specimens, volumechanges were recorded directly from a volume/pressure controller. Forthe specimens tested in a dry state, the assumption of isotropic com-pression was adopted [13] in order to estimate the volumetric strainfrom the measured axial strain.
2.2. Testing program
The primary dynamic testing program included twenty four speci-mens in total. This set of specimens is summarized in Table 1. Twospecimens of pure sand were tested in a dry state (No. 12 and 13 inTable 1) and twenty-two specimens with fibre content that ranged from0–2% were tested in a fully saturated state. Adjusting the compactionenergy during sample preparation, specimens of a given fibre contentwere prepared at different initial densities and void ratios. The primarydynamic testing program and the characteristics of the specimens aresummarized in Table 1. The initial void ratios (e) and densities of thespecimens, in terms of dry and bulk density, are plotted in Figs. 3 and 4,respectively, against the content of fibre. It was noticed that for similarcompaction energies, the increase of fibre content led to specimens ofslightly greater void ratio (e) and lower unit weight (γd and γsat).
Note that for most specimens, the confining pressure ranged from 50to 200 kPa in magnitude, which corresponded to low to relativelymoderate pressures. For some specimens, the maximum applied pres-sure reached 300 or 400 kPa. This range of pressures (i.e. 50–400 kPa)might be more applicable for the current practice of fibre-reinforcedsand, for example, applications in moderate height slopes, shallowfoundations or backfill in earth retaining support structures. InFig. 1. Grading curve of well-graded sand.
Fig. 2. Scanning electron microscope (SEM) image of the sand.
H. Li, K. Senetakis Soil Dynamics and Earthquake Engineering 100 (2017) 224–232
225

addition, due to the angular shape of the sand grains, greater pressureswould lead to leakage occurrence in many of the tests, thus the appliedpressures did not exceed values of 200–400 kPa. It is also noticed thatthe inclusion of a small amount of fibres in terms of weight, produces alarge amount of fibre volume within the sand-fibre mixtures. This isbecause of the low specific gravity of the synthetic material. For allpractical purposes and following the similar percentages of fibre used inprevious works, the study was limited to a maximum content of fibre of2% by dry weight of sand.
2.3. Calibration of the Hardin resonant column
The resonant columns (RC) used in the study were supplied by GDSInstruments. A previous work by He and Senetakis [13] provided detailsof the Stokoe RC which apparatus is of the fixed-free type. A close-upview of the drive mechanism of the system attached on the top (active)end of the specimen is given in Fig. 5. The calibration of the system wasconducted using aluminium rods of variable diameters and of knownstiffness adopting the ASTM recommendations [2,3] and the
recommendations by Drnevich [10]. From this exercise, the rotationalinertia of the apparatus was captured and was found to be a constantvalue equal to JA = 0.046 kg m2. The Hardin resonant column utilizes amore complicated configuration which allows the application of anaxial compressive or tensile stress to the sample, thus the sample maybe subjected to stress anisotropy [30]. A close-up view of the drivemechanism with the upper system of the Hardin apparatus is given inFig. 6. This system follows the fixed-partly fixed configuration with thebottom of the sample to be considered as fixed and its top to be con-sidered as partly restrained to torsional dynamic loading. This restrainis achieved from the mechanical system that connects the drive me-chanism with the load cell along the axis of the sample. This mechanicalsystem works as a rotational massless spring – damper [10,2,3].Through the calibration exercise of the Hardin resonant column, it wasrevealed that the rotational inertia of the system is not a fixed value, butit depends on the magnitude of the resonant frequency during themeasurements at resonance.
Table 1Primary dynamic testing program and sample details.
Sample No. Fibre content (%) Sample size (mm) Sample preparation method Test condition Initial dry density γd (kN/m3) Initial void ratio (e) Pressure range (kPa)
1 0 50 × 100 Dry compaction Saturated 14.17 0.834 50–2002 0 50 × 100 Dry compaction Saturated 15.74 0.651 50–2003 0.5 50 × 100 Moist compaction Saturated 14.73 0.748 50–2004 0.5 50 × 100 Moist compaction Saturated 14.98 0.719 50–3005 1.0 50 × 100 Moist compaction Saturated 14.31 0.782 50–3006 1.0 50 × 100 Moist compaction Saturated 13.79 0.849 50–3007 1.5 50 × 100 Moist compaction Saturated 14.04 0.800 50–2008 1.5 50 × 100 Moist compaction Saturated 13.80 0.832 50–2009 2.0 50 × 100 Moist compaction Saturated 13.72 0.825 50–20010 2.0 50 × 100 Moist compaction Saturated 13.68 0.831 50–20011 2.0 50 × 100 Moist compaction Saturated 13.44 0.863 50–20012 0 70 × 140 Dry compaction Dry 14.75 0.763 50–30013 0 70 × 140 Dry compaction Dry 15.16 0.715 50–40014 0 70 × 140 Dry compaction Saturated 16.51 0.575 50–20015 0 70 × 140 Dry compaction Saturated 16.41 0.584 50–20016 0 70 × 140 Dry compaction Saturated 16.45 0.581 50–20017 0.5 70 × 140 Moist compaction Saturated 16.04 0.606 50–20018 0.5 70 × 140 Moist compaction Saturated 15.44 0.667 50–20019 0.5 70 × 140 Moist compaction Saturated 15.44 0.668 50–20020 1.0 70 × 140 Moist compaction Saturated 14.94 0.707 50–30021 1.0 70 × 140 Moist compaction Saturated 14.99 0.701 50–20022 1.5 70 × 140 Moist compaction Saturated 14.10 0.792 50–20023 2.0 70 × 140 Moist compaction Saturated 14.16 0.769 50–20024 2.0 70 × 140 Moist compaction Saturated 13.84 0.809 50–200
Fig. 3. Void ratio (e) and granular void ratio (egr) of fibre-reinforced sand specimensagainst the fibre content.
Fig. 4. Unit weight of fibre-reinforced sand specimens against the fibre content.
H. Li, K. Senetakis Soil Dynamics and Earthquake Engineering 100 (2017) 224–232
226

3. Results and discussion
3.1. Interpretation of bender element signal analysis and comparisons withresonant column tests
For the bender element (BE) tests, a sinusoidal type input excitationof 10 kHz was used. Typical plots illustrating the signal analysis inter-pretation on a sample from the primary dynamic testing program aregiven in Fig. 7 indicating the time arrival based on the peak-to-peak(PP) and first time arrival (FTA) methods. For most specimens, the twodifferent methods (PP and FTA) provided similar values of the shearwave velocity (Vs). Additional BE exercise conducted on a re-presentative set of specimens at different excitation frequencies de-monstrated very similar values of the estimated Vs. For the resonantcolumn tests in torsional mode of vibration, the frequency responsecurve for each sample at a given pressure was plotted and the cyclicresonant frequency (fn) was estimated. Typical frequency responsecurves for specimens of variable fibre contents at p′ = 200 kPa aregiven in Fig. 8. These specimens corresponded to No. 18, No. 21 andNo. 23 for 0.5%, 1% and 2% of fibre content, respectively (Table 1),denoted with dashed, continuous and dot lines, respectively. Notice ashift of the resonant frequency to lower values for increasing content offibre. For this set of data, for 0.5% of fibre content (dashed line), theresonant frequency was found equal to 93.6 Hz and a drop of about 8%was found for the resonant frequency for the sample with 2% of fibrecontent (dot line) with fn equal to 86.6 Hz. This was a general trendobserved throughout the study and was affected, majorly, by the dropof void ratio and decrease of the stiffness of the specimens when the
Fig. 5. Close-up view of Stokoe type resonant column.
Fig. 6. Close-up view of the drive mechanism and upper system of the Hardin type re-sonant column.
Fig. 7. Example of the signal analysis-interpretation for the bender element tests (PP:peak to peak method and FTA: first time arrival method).
Fig. 8. Example of frequency response curves of variable specimens obtained from tor-sional resonant column tests (dashed line: 0.5% of fibre content, continuous line: 1% offibre content, dot line: 2% of fibre content).
H. Li, K. Senetakis Soil Dynamics and Earthquake Engineering 100 (2017) 224–232
227
content of fibre increased. Based on the resonant column tests, thesmall-strain shear modulus (Gmax) of the specimens was measured in astraightforward way from Eq. (1a) using the bulk (saturated) density forthe fully saturated specimens (denoted as ρs) or the dry density (de-noted as ρd) for the case of the two dry specimens of pure sand and theobtained resonant frequency (Eq. (1b)).
= ×G ρ V( )max s s2 (1a)
= ×G Vρ ( )max d s2 (1b)
However, the estimation of Gmax of fully saturated specimens, based onthe measured Vs from the bender element tests, required an adjustmentof soil density [33]. This is because the bender element test methodapplies a high-frequency excitation to the sample, which results in arelative movement between the solid skeleton and the water that fillsthe pores of the sample [25,33]. In particular, the "high-frequency"range is subjective and depends on the measured Vs of the specimens,their porosity, the hydraulic conductivity and the applied frequency ofthe dynamic excitation. Adopting the expressions by Santamarina et al.[25] (after [33]), the characteristic frequency (fc) of the fibre-reinforcedsand specimens ranged between about 0.6–6 kHz assuming a range ofthe hydraulic conductivity values from 10−2 to 10−1 cm/sec for thespecimens and for typical porosities of the mixtures of about 35–45%.The applied frequency during the bender elements exercise (equal to10 kHz) was greater than fc, thus an equivalent density (γeq) must beused to account for the relative movement of the fluid (water) that fillsthe pores of the sample in comparison to the dry skeleton [25,33]. Thus,the indirect measurement of Gmax based on the known Vs from thebender element tests was conducted adopting the following expression[33]:
= × = ⎡⎣
− × + ⎛⎝
− × × ⎞⎠
⎤⎦
×G ρ V n ρ 1a
n ρ V( ) (1 ) 1 ( )max eq s2
g f s2
(2)
where (ρeq) is the equivalent density, (n) is the porosity, (ρg) and (ρf) arethe mass density of the solid grains and the fluid, respectively, and (a) isa constant which ranges between 2 and 3 ([32], after [33]). In thepresent study, a value of a = 2 was used which provided slightly bettermatching between the resonant column and the bender element testresults, but it is noticed that the overall effect of (a) on the computationof Gmax was very small. Note that for the set of dry specimens of thestudy, Eq. (2) coincides with Eq. (1b).
It is noticed that most research works in the literature adopt thebulk density for the estimation of the shear modulus from bender ele-ment tests. This would be, perhaps, a more precise approach for highcharacteristic frequencies, which typically correspond to less permeablesoils, for example cohesive soils or fine-grained sands. On the other
hand, the resonant column tests in the study were conducted at cyclicfrequencies (fn) that ranged, typically, between about 30–80 Hz in theStokoe resonant column and 70–140 Hz in the Hardin RC, thus fn< 0.1× fc. This implies that the resonant column applied a low-frequencyexcitation with respect to fc [33]. In this case, the saturated or drydensity was used depending on whether the sample was saturated ordry, respectively.
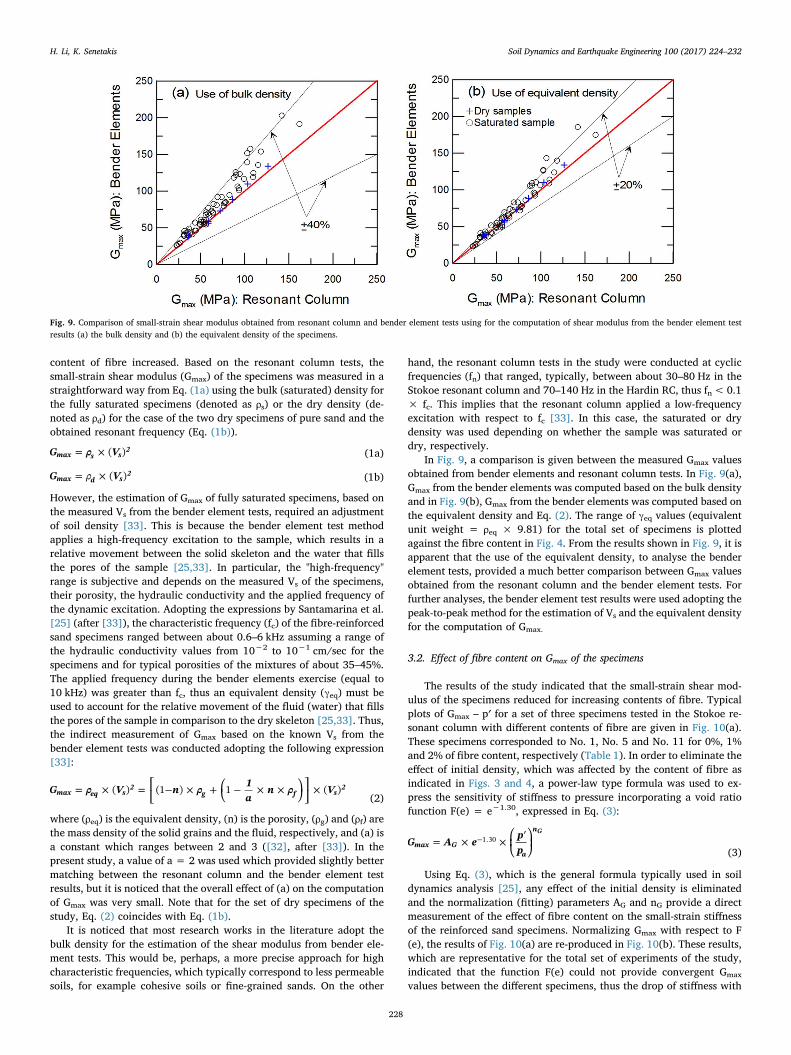
In Fig. 9, a comparison is given between the measured Gmax valuesobtained from bender elements and resonant column tests. In Fig. 9(a),Gmax from the bender elements was computed based on the bulk densityand in Fig. 9(b), Gmax from the bender elements was computed based onthe equivalent density and Eq. (2). The range of γeq values (equivalentunit weight = ρeq × 9.81) for the total set of specimens is plottedagainst the fibre content in Fig. 4. From the results shown in Fig. 9, it isapparent that the use of the equivalent density, to analyse the benderelement tests, provided a much better comparison between Gmax valuesobtained from the resonant column and the bender element tests. Forfurther analyses, the bender element test results were used adopting thepeak-to-peak method for the estimation of Vs and the equivalent densityfor the computation of Gmax.
3.2. Effect of fibre content on Gmax of the specimens
The results of the study indicated that the small-strain shear mod-ulus of the specimens reduced for increasing contents of fibre. Typicalplots of Gmax – p′ for a set of three specimens tested in the Stokoe re-sonant column with different contents of fibre are given in Fig. 10(a).These specimens corresponded to No. 1, No. 5 and No. 11 for 0%, 1%and 2% of fibre content, respectively (Table 1). In order to eliminate theeffect of initial density, which was affected by the content of fibre asindicated in Figs. 3 and 4, a power-law type formula was used to ex-press the sensitivity of stiffness to pressure incorporating a void ratiofunction F(e) = e−1.30, expressed in Eq. (3):
⎜ ⎟= × × ⎛⎝
′⎞⎠
−G A eppmax G
a
n1.30
G
(3)
Using Eq. (3), which is the general formula typically used in soildynamics analysis [25], any effect of the initial density is eliminatedand the normalization (fitting) parameters AG and nG provide a directmeasurement of the effect of fibre content on the small-strain stiffnessof the reinforced sand specimens. Normalizing Gmax with respect to F(e), the results of Fig. 10(a) are re-produced in Fig. 10(b). These results,which are representative for the total set of experiments of the study,indicated that the function F(e) could not provide convergent Gmax
values between the different specimens, thus the drop of stiffness with
Fig. 9. Comparison of small-strain shear modulus obtained from resonant column and bender element tests using for the computation of shear modulus from the bender element testresults (a) the bulk density and (b) the equivalent density of the specimens.
H. Li, K. Senetakis Soil Dynamics and Earthquake Engineering 100 (2017) 224–232
228

the increase of fibre content was not the sole result of the change of thevoid ratio of the specimens for the different contents of fibre. Note thatnormalizing Gmax with respect to F(e), for each given sample, the fittingof a power-law equation through the data using the least square methodgives the constants AG and nG, similar to the analysis presented by Menq[21], Senetakis et al. [26], Senetakis and Madhusudhan [28] or Payan
et al. [24].A second attempt was implemented to examine whether a granular
void ratio could effectively describe the small-strain dynamic behaviorof the mixtures. In this case, the void ratio was re-computed consideringthe volume of fibres as part of the total volume of voids (denoted as egr).egr against the fibre content is illustrated in Fig. 3. This type of granularvoid ratio has been effectively used to express the behavior of granularbinary mixtures, for example sand-rubber composite geo-materials[1,27]. Gmax normalized with respect to F(egr) is plotted in Fig. 10(c) forthe same set of specimens. These results indicated that the normal-ization of stiffness with respect to a granular void ratio is not effectivefor fibre-reinforced sands as it would be, for example, for sand-rubbermixtures. In the latter case, this normalization would eliminate theeffect of the synthetic inclusion and content on mixtures Gmax andwould provide convergent Gmax values between sand and binary mix-tures.
Based on best-fit of the experimental data using Eq. (3) and the voidratio (e) of the specimens considering the volume of fibres as part of thevolume of the solid skeleton, the fitting parameters AG and nG wereestimated and plotted in Fig. 11 against the content of fibre. Fig. 11(a)indicated that, within the scatter of the data, AG decreased with in-creasing the content of fibre, following a linear trend. This trend linewas fitted based on the least square method and the coefficient of de-termination (r2) was found equal to 0.59. This trend implies that for agiven void ratio and pressure level, Gmax of the mixtures is reducedwhen the content of fibre increases. In reality, this reduction in stiffnesswas more pronounced for fibre contents beyond 0.5%. Perhaps, thisobserved trend is, partly, because of the lower modulus of the materialof the fibres (polypropylene) and the possible negative contribution ofthe synthetic material inclusion in transferring the normal forcesthrough the grain contacts [18]. On the other hand, the results ofFig. 11(b) did not show a clear trend with respect to the sensitivity ofGmax to pressure, expressed through the power nG, for the differentcontents of fibre. In reality, a slight increase of nG was observed forgreater fibre contents, but, within the scatter of the data, firm conclu-sions could not be drawn with respect to the Gmax – p′ relationship. Themean value and the range of one standard deviation for nG based on thetotal set of specimens of the primary dynamic testing program is de-picted in Fig. 11(b). Based on these observations, Eq. (3) may be re-written as:
⎜ ⎟= − × × × ⎛⎝
′⎞⎠
−G FC epp
(38. 6 6. 9 )maxa
01.30
.56
(4a)
= − ×A FC38. 6 6. 9G (4b)
where FC is the content of fibres in percentile scale (%), e is the voidratio of the sample at a confining pressure (p′) and pa is the atmosphericpressure (taken as 100 kPa). This equation may be more applicable for awell-graded quarry sand, which would be a typical fill-backfill material,and for percentages of polypropylene fibre ranging from 0% to 2% byweight of sand dry mass. In Eq. (4), Gmax is expressed in MPa. Note thatthe linear-type formula of Eq. (4b) was derived from the trend line ofthe results in Fig. 11(a). A linear trend line was adopted for simplicity inthis study.
3.3. Validation of Gmax expression
An additional set of twenty specimens of fibre-reinforced sand wasconstructed using percentages of polypropylene fibre from 0% to 2%and the well-graded sand as physical portion of the mixtures (Figs. 1and 2). This set of experiments, denoted as the secondary dynamictesting program, is summarized in Table 2. For these tests, benderelement measurements were conducted in the Hardin resonant column.The specimens were tested at 100 or 400 kPa of mean effective con-fining pressure. These additional specimens were prepared and testedwith the bender elements to validate Eq. (4). All these specimens were
Fig. 10. Typical plots of small-strain shear modulus against the pressure for specimens ofvariable contents of fibre tested in the Stokoe RC (a) absolute values (b) values normal-ized with respect to the void ratio (c) values normalized with respect to the granular voidratio.
H. Li, K. Senetakis Soil Dynamics and Earthquake Engineering 100 (2017) 224–232
229

tested in a fully saturated state, thus Eq. (2) was used for thestraightforward measurement of Gmax from the bender element tests.The measured stiffness values are compared in Fig. 12 with respect tothe estimated values using Eq. (4). The results of Fig. 12 provided asatisfactory estimation for this set of additional specimens using thenewly developed formula.
3.4. Small-strain damping of fibre-reinforced sand
For a limited number of tests, material damping was measured usingthe free vibration decay (FVD) method [2,3]. Typical plots of the freevibration exercise of two specimens at p′ = 200 kPa, one samplecomposed of pure sand and one with 1% of fibre content, are given inFig. 13. Note the higher frequency content in Fig. 13(a) in comparisonto (b). This is because the pure sand specimens had slightly higher re-sonant frequencies in comparison to the mixtures at a given level ofpressure. In Fig. 14, material damping at small strains, denoted asDs,min, is plotted against the number of cycles (N) used to compute thelogarithmic decrement from the free decay curve for specimens withvariable fibre contents. These results are representative of the total setof experiments for which material damping was measured. These re-sults indicated an increase of material damping at small strains with anincrease of fibre content, which trend was more evident for contents of
Fig. 11. The effect of fibre content on the small-strain shear modulus constants: (a) AG and (b) nG.
Table 2Secondary dynamic testing program and sample details.
Sample No. Fibre content (%) Sample size (mm) Sample preparation method Test condition Initial dry density γd (kN/m3) Initial void ratio (e) Pressure (kPa)
25 0 70 × 140 Dry compaction Saturated 16.66 0.560 10026 0 70 × 140 Dry compaction Saturated 16.60 0.566 40027 0.5 70 × 140 Moist compaction Saturated 16.40 0.570 10028 0.5 70 × 140 Moist compaction Saturated 15.67 0.644 40029 1 70 × 140 Moist compaction Saturated 16.03 0.591 10030 1 70 × 140 Moist compaction Saturated 15.31 0.666 40031 1.5 70 × 140 Moist compaction Saturated 13.97 0.809 10032 1.5 70 × 140 Moist compaction Saturated 15.23 0.658 40033 2 70 × 140 Moist compaction Saturated 14.22 0.761 10034 2 70 × 140 Moist compaction Saturated 15.25 0.642 40035 0 70 × 140 Dry compaction Saturated 16.59 0.567 10036 0 70 × 140 Dry compaction Saturated 16.47 0.578 40037 0.5 70 × 140 Moist compaction Saturated 15.55 0.656 10038 0.5 70 × 140 Moist compaction Saturated 15.80 0.630 40039 1 70 × 140 Moist compaction Saturated 14.99 0.701 10040 1 70 × 140 Moist compaction Saturated 14.56 0.752 40041 1.5 70 × 140 Moist compaction Saturated 14.18 0.782 10042 1.5 70 × 140 Moist compaction Saturated 14.19 0.780 40043 2 70 × 140 Moist compaction Saturated 13.13 0.908 10044 2 70 × 140 Moist compaction Saturated 13.94 0.797 400
Fig. 12. Validation of small-strain shear modulus based on the secondary dynamic testingprogram.
H. Li, K. Senetakis Soil Dynamics and Earthquake Engineering 100 (2017) 224–232
230

fibre between 1% and 2%. For example, in Fig. 14(a) it is noticed thatfor the pure sand (0% of fibre content), Ds,min was equal to about 1.0%,but for contents of fibre between 1–2%, material damping had valuesbetween about 1.3% and 1.8%. Note that in soil dynamics research it ismore common to use 2 or 3 successive cycles during the free vibrationexercise to measure damping [21,29,31]. The aim of presenting resultsusing different number of cycles in Fig. 14 was solely to provide roughlya range of values for material damping accounting for the effect of thetotal number of cycles used during the free vibration exercise.
4. Conclusions
The dynamic tests results of the study indicated that Gmax of thefibre-reinforced sand reduced with an increase of fibre content. Thistrend could not be explained solely because of the effect of fibre contenton the specimens void ratio. It is possible that this trend was because ofthe negative contribution of the fibres in transferring the normal con-tact forces through the grain-to-grain contacts which could have playeda major role in the reduction of the stiffness of the specimens. Theseresults imply that the fibre reinforcement is effective at larger strains,where it has been shown from literature works that the synthetic fibresare mobilized in tensile mode. At very small strains, a negative con-tribution of fibre inclusion is observed with respect to soil stiffness.However, this does not imply that the use of fibres as a means of soilreinforcement is not encouraged, but the effectiveness of mixing soilswith fibres will depend on the application in question and whether the
improvement targets applications involving smaller or larger de-formation problems. The observations of the study are in agreementwith results presented in the literature for polypropylene fibre-re-inforced soils [14,6]. Based on a comprehensive set of experiments, anexpression for Gmax of fibre-reinforced sand was developed, which ex-pression may be more applicable for materials composed of well-gradedquarry sand as the physical portion, which is a potential fill-backfillmaterial, and polypropylene fibres as the synthetic portion. The Gmax
expression was further validated by conducting additional dynamictests on a new set of specimens. For a limited number of tests, materialdamping was measured. This analysis showed a slight increase ofdamping for increasing contents of fibre. The analysis of the benderelement test results demonstrated that for saturated specimens anequivalent density should be used in order to compute stiffness from themeasured shear wave velocities, instead of using the bulk density. Theuse of the equivalent density has been proposed in the literature [33],but it has been ignored in many research works.
Acknowledgements
The authors would like to thank the anonymous reviewers for theirconstructive comments and detailed suggestions that helped us to im-prove the quality of the manuscript. The first author acknowledges thesupport of a scholarship co-funded by the School of Civil andEnvironmental Engineering and the Faculty of Engineering UNSWAustralia. The second author acknowledges the support of the start-up
Fig. 13. Typical plots of free vibration decay response for: (a) a pure sand sample and (b) for a sample with 1% fibre content at 200 kPa.
Fig. 14. The effect of fibre content on the small-strain damping ratio of the specimens: (a) results at 100 kPa and (b) results at 400 kPa.
H. Li, K. Senetakis Soil Dynamics and Earthquake Engineering 100 (2017) 224–232
231

grant of the College of Science and Engineering City University of HongKong (Code: 7200533-ACE).
References
[1] Anastasiadis A, Senetakis K, Pitilakis K. Small‐strain shear modulus and dampingratio of sand/rubber and gravel/rubber mixtures. Geotech Geol Eng2012;30(2):363–82.
[2] ASTM. Standard test methods for modulus and damping of soils by the resonantcolumn method: D4015-92. Annual book of ASTM standards. ASTM International;1992.
[3] ASTM. Standard test methods for modulus and damping of soils by the resonantcolumn method: D4015-15. Annual book of ASTM standards. ASTM International;2015.
[4] Cascante G, Santamarina C, Yassir N. Flexural excitation in a standard torsional-resonant column. Can Geotech J 1998;35:478–90.
[5] Cho G-C, Dodds J, Santamarina C. Particle shape on packing density, stiffness, andstrength. J Geotech Geoenviron Eng, ASCE 2006;132(5):591–602.
[6] Clariá JJ, Vettorelo P. Modeling of the small strain shear modulus on a fiber re-inforced sand. In: V.A. Rinaldi et al. (Eds.) Proceedings of the conference of de-formation characteristics of geomaterials. At Buenos Aires, Argentina. IOS Press;2015. http://dx.doi.org/10.3233/978-1-61499-601-9-753.
[7] Consoli NC, Casagrande MDT, Coop MR. Effect of fibre reinforcement on the iso-tropic compression behaviour of a sand. J Geotech Geoenviron Eng2005;131(11):1434–6.
[8] Correia AAS, Venda Oliveira PJ, Custodio DG. Effect of polypropylene fibres on thecompressive and tensile strength of a soft soil, artificially stabilised with binders.Geotext Geomembr 2015;2:97–106.
[9] Diambra A, Ibraim E, Russell AR, Muir Wood D. Modelling the undrained responseof fibre reinforced sands. Soils Found 2011;51:625–36.
[10] Drnevich VP. Resonant column test. Lexington, Kentucky, USA: Soil Dynamics Inc;1978.
[11] Dos Santos APS, Consoli NC, Baudet BA. The mechanics of fibre-reinforced sand.Geotechnique 2010;60(10):791–9.
[12] Gray DH, Ohashi H. Mechanics of fibre-reinforcement in sand. J Geotech Eng1983;109(3):335–53.
[13] He H, Senetakis K. A study of wave velocities and Poisson ratio of recycled concreteaggregate. Soils Found 2016;56(4):593–607.
[14] Heineck KS, Coop MR, Consoli NC. Effect of microreinforcement of soils from verysmall to large shear strains. J Geotech Geoenviron Eng 2005;131(8):1024–33.
[15] Ibraim E, Diambra A, Muir Wood D, Russell AR. 'Static liquefaction of fibre re-inforced sand under monotonic loading'. Geotext Geomembr 2010;28:374–85.
[16] Krumbein WC, Sloss LL. Stratigraphy and sedimentation. 2nd ed W. H Freeman and
Company; 1963.[17] Liu J, Wang G, Kamai T, Zhang F, Yang J, Shi B. Static liquefaction behavior of
saturated fiber-reinforced sand in undrained ring-shear tests. Geotext Geomembr2011;29(5):462–71.
[18] Lopera Perez JC, Kwok CY, Senetakis K. Investigation of the micro-mechanics ofsand-rubber mixtures at very small strains. Geosynth Int 2017;24(1):30–44.
[19] Madhusudhan BN, Senetakis K. Evaluating use of resonant column in flexural modefor dynamic characterisation of Bangalore sand. Soils Found 2016;56(3):574–80.
[20] Maher MH, Gray DH. Static response of sands reinforced with randomly distributedfibres. J Geotech Eng 1990;116(11):1661–77.
[21] Menq F-Y. Dynamic properties of sandy and gravelly soils [Ph.D. dissertation]. USA:University of Texas at Austin; 2003.
[22] Michalowski RL, Čermák J. Triaxial compression of sand reinforced with fibers. JGeotech Geoenviron Eng 2003;129(2):125–36.
[23] Miranda Pino LF, Baudet BA. The effect of the particle size distribution on themechanics of fibre-reinforced sands under one-dimensional compression. GeotextGeomembr 2015;43:250–8.
[24] Payan M, Khoshghalb A, Senetakis K, Khalili N. Effect of particle shape and validityof Gmax models for sand: a critical review and a new model. Comput Geotech2016;72:28–41.
[25] Santamarina C, Klein K, Fam M. Soils and waves. New York: John Wiley and Sons;2001.
[26] Senetakis K, Anastasiadis A, Pitilakis K. The small-strain shear modulus anddamping ratio of quartz and volcanic sands. Geotech Test J 2012;35(6). http://dx.doi.org/10.1520/GTJ20120073.
[27] Senetakis K, Anastasiadis A. Effects of state of test sample, specimen geometry andsample preparation on dynamic properties of rubber-sand mixtures. Geosynth Int2015;22(4):301–10.
[28] Senetakis K, Madhusudhan BN. Dynamics of potential fill-backfill material at verysmall-strains. Soils Found 2015;55(5):1196–210.
[29] Senetakis K, Anastasiadis A, Pitilakis K. A comparison of material damping mea-surements in resonant column using the steady-state and free-vibration decaymethods. Soil Dyn Earthq Eng 2015;74:10–3.
[30] Senetakis K, He H. Dynamic characterization of a biogenic sand with a resonantcolumn of fixed-partly fixed boundary conditions. Soil Dyn Earthq Eng2017;95:180–7.
[31] Stokoe K, Darendeli M, Andrus R, Brown LT. Dynamic soil properties: laboratory,field and correlation studies. In: Proceedings of the 2nd international conference onearthquake geotechnical engineering. Lisbon; 1999.
[32] Stoll RD. Experimental studies of attenuation in sediments. J Acoust Soc Am1979;63(2):607–13.
[33] Youn J-U, Choo Y-W, Kim D-S. Measurement of small-strain shear modulus Gmax ofdry and saturated sands by bender element, resonant column and torsional sheartests. Can Geotech J 2008;45:1426–38.
H. Li, K. Senetakis Soil Dynamics and Earthquake Engineering 100 (2017) 224–232
232