soil dynamics and earthquake engineering - core.ac.uk · formulate seismic zoning and microzoning...
TRANSCRIPT

Contents lists available at ScienceDirect
Soil Dynamics and Earthquake Engineering
journal homepage: www.elsevier.com/locate/soildyn
Seismic microzoning of Štip in Macedonia
V.W. Leea, M.D. Trifunaca,⁎, B.Đ. Bulajićb, M.I. Manićc,1, D. Herakd, M. Herakd, G. Dimove,V. Gičevea Dept. of Civil Eng., Univ. of Southern California, Los Angeles, CA 90089, USAb Dept. of Civil Eng. and Geodesy, Univ. of Novi Sad, 21000 Novi Sad, Republic of Serbiac Crvena skopska opština 4/1-1, Skopje, Macedoniad Dept. of Geophysics, Faculty of Science, Univ. of Zagreb, Horvatovac bb, 10000 Zagreb, Croatiae Univ. Goce Delčev, 2000 Štip, Macedonia
A R T I C L E I N F O
Keywords:Microzonation maps, which includedescriptions of site geology and site soilpropertiesContribution of a large distant earthquake tothe design strong motion amplitudesComputation of seismic hazard for earthquakesources, which follow different attenuationlaws
A B S T R A C T
Seismic microzonation maps for Štip (Macedonia) and its surroundings are presented based on the uniform-hazard-spectrum (UHS) methodology. Such mapping satisfies the guidelines for performance-based design(PBD), which requires specification of two sets of spectral amplitudes—one for which the structure will remainessentially linear, and the other for which it will undergo a nonlinear response. The UHS method also enables usto include contributions from excitation by large distant earthquakes as well as the simultaneous effects of sitegeology and site soils. Thus, the maps we present include, in a balanced way, the effects of near and distant largeearthquakes, spatial distribution of seismic activity, the site geology, and the site soil properties.
1. Introduction
Investigations and observations of damage caused by earthquakesand, in particular, of the irregular distribution of such damage, haveshown that the observed variations are related to the properties ofgeologic and soil site conditions. Microzoning maps have been devel-oped, with coefficients that describe these variations in the amplitudesof shaking, and hence, in the design forces [17,40,46]. The equivalenthorizontal earthquake forces, and the response-spectrum amplitudes fordesign, are then increased or decreased according to the values of theamplification coefficients defined in the microzoning maps.
The early development of seismic microzoning maps dates back tothe former Soviet Union [1] and Japan [17] in the 1930s. On the basisof many observations following earthquakes, guidelines were devel-oped for the prediction of a relative increase or decrease of siteintensities (and therefore of the associated peaks of strong motionamplitudes) based on the nature of site geology and surface soil [9,40].Many published seismic microzonation maps from that time resembledthe spatial distribution of geological and soil deposits in the area[18,38,40,46]. The local spatial variations were first based primarily onsite geology [40,46], and later expanded to include the effects ofshallow sediment and local soils. Theoretical and observational studiesin Japan eventually also included the properties of local site character-
istics that were determined through microtremor measurement. Aftermany years of research and development of probabilistic methods forthe evaluation of seismic design forces, we are finding that indeed theseold methods—which emphasized the site soil and geology—correctlyinterpreted the important factors influencing the spatial variations inseismic hazard. In this paper, we will show that site geology is indeedimportant for mapping seismic hazard, and hence should be included inthe empirical scaling equations of strong ground motion.
Since the mid-1970s, after the first direct empirical scaling equa-tions of spectral amplitudes started to appear, it became possible toformulate seismic zoning and microzoning in ways that consider theprobabilities of earthquake occurrence, the spatial distributions ofearthquake sources, the frequency-dependent attenuation of strongmotion amplitudes, and the site geologic and soil conditions[22–25,27,33,35,49–59,68–70]. All of this information was expressedin terms of the response spectrum amplitudes [10,60,71]. The advan-tage of this approach has been that it simultaneously considers all of thefactors that contribute to the end result in a balanced way, andcomparisons with earthquake occurrence in southern California haveconfirmed the merits of this approach. For example, the seismicmicrozonation maps based on the uniform hazard method (UHM)[2,3,26] that were calculated and published in 1987 [27] for the LosAngeles metropolitan area, have not been contradicted by any strong
http://dx.doi.org/10.1016/j.soildyn.2017.04.003Received 17 February 2017; Accepted 1 April 2017
⁎ Corresponding author.
1 Retired ProfessorE-mail address: [email protected] (M.D. Trifunac).
Soil Dynamics and Earthquake Engineering 98 (2017) 54–66
0267-7261/ © 2017 Elsevier Ltd. All rights reserved.
MARK
motion shaking from the earthquakes that occurred in the area since1985 [58,62].
The purpose of this paper is to show, with a specific example, how amodel of seismic activity in the region, and including geological sitecharacterization as in Trifunac and Brady [65], can be used toformulate microzoning maps of Štip, Macedonia. The methodology,scaling equations, and descriptions of seismicity used are the same asthose described by Lee et al. [33-37], and Lee and Trifunac [31,32] andwill not be repeated here. Useful features in this work include (1) thatthe detailed spatial variations of the geologic site conditions can beintegrated directly into the calculation of spectral amplitudes, and as
will be shown, are one of the significant factors influencing the finalresult; and (2) that the consequences of contributions from large distantearthquakes (from Vrancea in Romania) can also be included. Thedifferences in the results of such an analysis from the old approachbased on probabilistic mapping of only peak ground acceleration willbecome apparent from what follows.
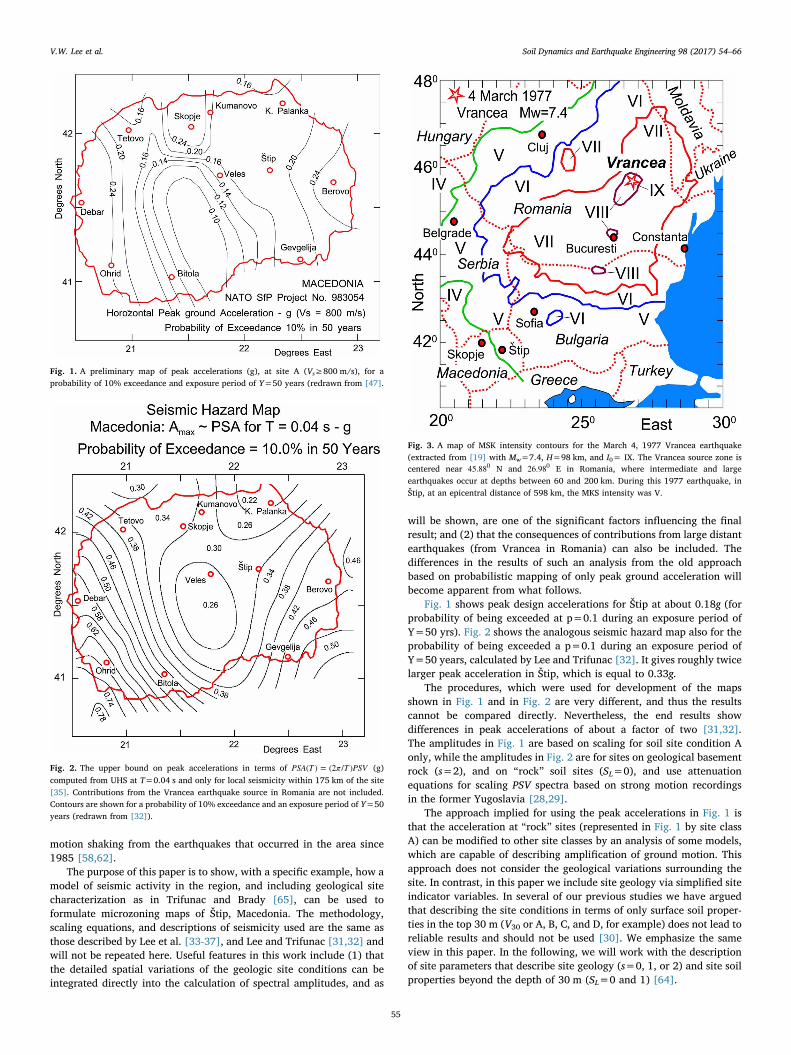
Fig. 1 shows peak design accelerations for Štip at about 0.18g (forprobability of being exceeded at p=0.1 during an exposure period ofY=50 yrs). Fig. 2 shows the analogous seismic hazard map also for theprobability of being exceeded a p=0.1 during an exposure period ofY=50 years, calculated by Lee and Trifunac [32]. It gives roughly twicelarger peak acceleration in Štip, which is equal to 0.33g.
The procedures, which were used for development of the mapsshown in Fig. 1 and in Fig. 2 are very different, and thus the resultscannot be compared directly. Nevertheless, the end results showdifferences in peak accelerations of about a factor of two [31,32].The amplitudes in Fig. 1 are based on scaling for soil site condition Aonly, while the amplitudes in Fig. 2 are for sites on geological basementrock (s=2), and on “rock” soil sites (SL=0), and use attenuationequations for scaling PSV spectra based on strong motion recordingsin the former Yugoslavia [28,29].
The approach implied for using the peak accelerations in Fig. 1 isthat the acceleration at “rock” sites (represented in Fig. 1 by site classA) can be modified to other site classes by an analysis of some models,which are capable of describing amplification of ground motion. Thisapproach does not consider the geological variations surrounding thesite. In contrast, in this paper we include site geology via simplified siteindicator variables. In several of our previous studies we have arguedthat describing the site conditions in terms of only surface soil proper-ties in the top 30 m (V30 or A, B, C, and D, for example) does not lead toreliable results and should not be used [30]. We emphasize the sameview in this paper. In the following, we will work with the descriptionof site parameters that describe site geology (s=0, 1, or 2) and site soilproperties beyond the depth of 30 m (SL=0 and 1) [64].
Fig. 1. A preliminary map of peak accelerations (g), at site A (Vs≥800 m/s), for aprobability of 10% exceedance and exposure period of Y=50 years (redrawn from [47].
Fig. 2. The upper bound on peak accelerations in terms of PSA T π T PSV( ) = (2 / ) (g)computed from UHS at T=0.04 s and only for local seismicity within 175 km of the site[35]. Contributions from the Vrancea earthquake source in Romania are not included.Contours are shown for a probability of 10% exceedance and an exposure period of Y=50years (redrawn from [32]).
Fig. 3. A map of MSK intensity contours for the March 4, 1977 Vrancea earthquake(extracted from [19] with Mw=7.4, H=98 km, and I0= IX. The Vrancea source zone iscentered near 45.880 N and 26.980 E in Romania, where intermediate and largeearthquakes occur at depths between 60 and 200 km. During this 1977 earthquake, inŠtip, at an epicentral distance of 598 km, the MKS intensity was V.
V.W. Lee et al. Soil Dynamics and Earthquake Engineering 98 (2017) 54–66
55

The development of hazard maps begins with the definition ofspatial distribution of seismic sources and their activity in time. Thedescription of this activity, as used in this paper, is briefly outlined inAppendix A. The next step involves the selection of attenuationequations that describe how the desired quantity representing strongground motion attenuates with distance. The last step combines thecontribution of all earthquake sources surrounding the site to computethe distribution functions of the quantity being evaluated and plottingmaps showing its spatial distribution.
The performance-based design guidelines in EC8 [6,63] are ex-pressed by the no-collapse and damage limitation requirements. The no-
collapse requirement is associated with a large and hence a nonlinearresponse and the soil-structure system period Tnonlinear, while the damagelimitation requirement is associated with an essentially linear responseand hence a shorter equivalent system period Tlinear. However, becauseTnonlinear and Tlinear are associated with different exceedance probabilities,their respective spectral amplitudes cannot be specified with the samefixed shape spectrum and two corresponding peak accelerations. This isbecause the spectral shape is different for different exceedance prob-abilities.
Beyond this, we have other concerns that point against using maps,such as that shown in Fig. 1, because the contributions to hazard from
Fig. 4. An example of a seismic zoning map for Macedonia for the ratio of pseudo spectral acceleration, relative to seismicity without contributions from the Vrancea earthquakes, for a5% fraction of critical damping, computed with UHS method, for the basement rock sites (s=2) and rock soil sites (SL=0) at 12 periods ranging from 0.04 to 2.00 s, for a probability ofp=0.10 exceedance and an exposure time of Y=50 years (redrawn from [32]).
Fig. 5. The general plan of Štip (left) and the geological site parameters (s=0, 1 or 2) in the same area (right).
V.W. Lee et al. Soil Dynamics and Earthquake Engineering 98 (2017) 54–66
56
the large Vrancea earthquakes (Fig. 3) are not included when scaling ofdesign motions is performed via peak accelerations. The reader will findfurther discussion about these concerns in Lee and Trifunac [31,32]. Wehave shown, for example, that the Vrancea earthquakes dominateseismic hazard in eastern Serbia. This domination diminishes withincreasing epicentral distance, so that in northern Macedonia it is downto several tens of percents (Fig. 4). In eastern Macedonia, thiscontribution is even smaller due to active seismicity in nearby Bulgaria[32].
Fig. 4 shows the ratio of spectral accelerations computed with andwithout contributions of the Vrancea earthquakes. It is seen that in thehigh-frequency range (higher than about 2 Hz), the contribution tospectral accelerations from the Vrancea earthquakes can be neglectedfor all sites in Macedonia for p=0.1 and Y=50 years. However, as
oscillator periods become longer, the contribution of the Vranceaearthquakes increases. At a frequency of 0.5 Hz, in Štip, the Vranceaearthquakes increase spectral accelerations by about 8%.
2. Štip and its surroundings - Geological site classification
The central city region (CCR) of the city of Štip covers a region thatis within the following borders: the Kemer locality and the Otinja Riverdam on the east, the High Medical School on the south, the spaKežovica on the west, and the Babi settlement on the north. Thegeologic deposits in the eastern and northern parts of CCR aresediments predominantly consisting of Eocene sandstone, marl, andconglomerates with layer thicknesses of about 350 m. Precambriangranite is present in the western part of CCR that covers the Novo Selo
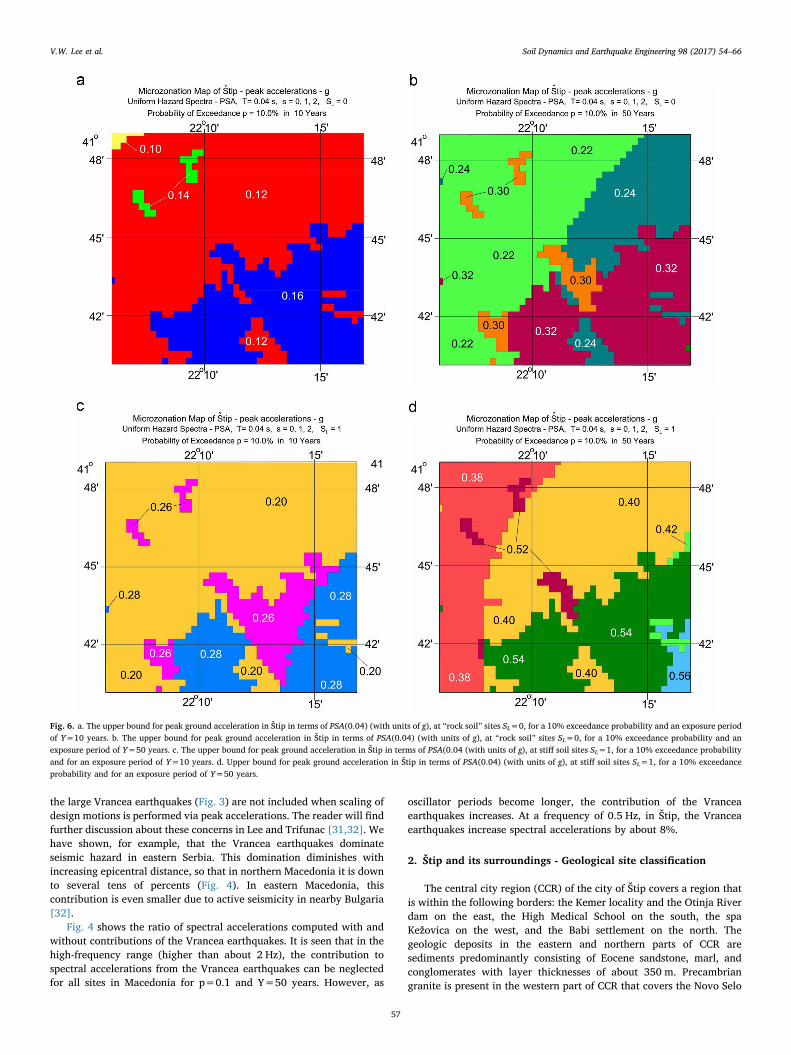
Fig. 6. a. The upper bound for peak ground acceleration in Štip in terms of PSA(0.04) (with units of g), at “rock soil” sites SL=0, for a 10% exceedance probability and an exposure periodof Y=10 years. b. The upper bound for peak ground acceleration in Štip in terms of PSA(0.04) (with units of g), at “rock soil” sites SL=0, for a 10% exceedance probability and anexposure period of Y=50 years. c. The upper bound for peak ground acceleration in Štip in terms of PSA(0.04 (with units of g), at stiff soil sites SL=1, for a 10% exceedance probabilityand for an exposure period of Y=10 years. d. Upper bound for peak ground acceleration in Štip in terms of PSA(0.04) (with units of g), at stiff soil sites SL=1, for a 10% exceedanceprobability and for an exposure period of Y=50 years.
V.W. Lee et al. Soil Dynamics and Earthquake Engineering 98 (2017) 54–66
57

settlement and the Isar and Merite hills in the southwestern part. Thethickness of the granite layers is more than five kilometers. Along theBregalnica River are river terraces, alluviums, and deluviums withrelatively small thicknesses. North of the CCR, up to the villages ofKaraorman and Čardaklija, the sediments consists of sandstone, marl,and conglomerates, except along the Bregalnica River.
East of the CCR and one-to-one-and-a-half kilometers east fromKemer along the Otinja River, the geology consists of sediments thatcontinue beyond the CCR. Two-to-three kilometers further east, graniteprevails, and further east, in the region of the villages of Šašavarlija andKalapetrovci, we can find mostly Precambrian gneiss with large layerthicknesses and fans of marbles and schists. In the north, smallerregions of limestone and sediments that were formed in the Cretaceousgeological period, with a layer thickness of 400–700 m, are present.
South of the village of Lipov Dol, and along the upper course of theOtinja River, there are Pliocene sandstone, gravel, and clay layers, withabout 200 m thickness. Precambrian granite is dominant south of theCCR with large thicknesses, and west, at the confluence of the KrivaLakavica River into Bregalnica is Pliocene gravel and clay with 200-meter thicknesses. West of CCR and north from the Bregalnica River areEocene sedimentary deposits, with the lower zone comprised of flysch,and the upper zone of the flysch consisting of sandstone, clay, andconglomerates. The thickness of the layers is 400–700 m. West from thevillage of Suševo, between the Suševo and the Bregalnica River, isPliocene sandstone, gravel, and clay with thicknesses of 200 m.Northwest of the CCR, along the regional road from Štip to Veles, upto the village of Krivi Dol, are sediments with an upper zone consistingof flysch, limestone, clay, sandstone, and marl, with layer thicknesses of
Fig. 7. a. Uniform hazard acceleration spectra, PSA T( ), with units in g, at T=1 s, at “rock” soil sites, SL=0, for 10% probability of exceedance and exposure interval Y=10 yrs. b. Uniformhazard acceleration spectra, PSA T( ), with units in g, at T=1 s at “rock” soil sites, SL=0, for a 10% exceedance probability and an exposure interval of Y=50 yrs. c. Uniform hazardacceleration spectra, PSA T( ), with units in g, at T=1 s, at stiff soil sites, SL=1, for 10% probability of exceedance and exposure interval Y=10 years. d. Uniform hazard accelerationspectra, PSA T( ), with units in g, at T=1 s, at stiff soil sites, SL=1, for a 10% exceedance probability and an exposure interval of Y=50 years.
V.W. Lee et al. Soil Dynamics and Earthquake Engineering 98 (2017) 54–66
58

one-and-a-half kilometers. On the western side of the road from Štip toVeles, is quaternary diluvium that extends to the village of Suševo onthe west, the village of Krivi Dol on the north and the Bregalnica Riveron the south.
Geological site classification for computations of Uniform HazardSpectra for the area surrounding Štip was based on the interpretation ofthe geological maps of the Štip region. The geological map that coversmost of the area defined by the General Urban Plan of Štip is: “Basicgeological map – Štip” [4].
The area that covers most of the “General Urban Plan of Štip”(Fig. 5, left) was divided into cells of 15×15 s in geographic coordi-nates between 40' N and 41° 49' N; that is, between 22° 06' E and 22° 17'E. For each of the 1584 analyzed cells, the site geology was described bythe predominant lithostratigraphic formations and their depths.
To determine the site condition parameter, s, for the city of Štip, weinterpreted the description of the site geology by using the classificationmethodology proposed by Trifunac and Brady [65]. We then classifiedthe site geology for each cell as either basement rock (s=2), alluvialand sedimentary deposits (s=0), or intermediate sites (s=1). The resultis shown in the right half of Fig. 5.
3. Mapping seismic hazard via uniform hazard spectra
Mapping the amplitudes of PSA T πPSV T T( ) = 2 ( )/ where PSA T( ) isthe pseudo absolute acceleration spectrum, PSV T( ) is the pseudorelative velocity spectrum, and T is the oscillator period, forT=0.04 s gives an upper bound for peak ground acceleration, since inthe limit as T tends to zero, PSA T( ) tends to peak ground acceleration.
Fig. 6a through d show this upper bound for peak ground accelera-tion for a 10% exceedance probability, exposure periods of Y=10 and50 years, and for “rock” (SL=0) and stiff (SL=1) soil site conditions.Geological site parameters s are included in the hazard calculations.The spatial variations seen in these figures are dominated by thedistance to seismic activity east of Štip and by the geological sitecondition parameters s=0, 1, and 2 (see Fig. 5, right). For a 10%exceedance probability and an exposure time of Y=50 years, the peakaccelerations in Fig. 6b are consistent with our overall regional estimateof about 0.3g (shown in Fig. 2). For sites on SL=1 (stiff soil) (Fig. 6d),peak accelerations are from 1.3 to 2 times larger.
We note that the amplitudes of peak accelerations shown in
Fig. 6a–d are not sensitive to the occurrence of distant earthquakes inthe Vrancea source zone in Romania. Fig. 6a–d further show that peakaccelerations are larger on basement rock (s=2) than on intermediaterock sites (s=1) by about 30–45%, for both “rock” soil sites (SL=0) andfor stiff soil sites (SL=1).
4. Vrancea earthquake contributions to seismic hazard
The Vrancea earthquakes occur at large epicentral distances fromŠtip (Fig. 3). This results in attenuation of high-frequency spectralamplitudes [36,37] so that the UHS for peak accelerations in Štip(Fig. 4), for a typical range of exceedance probabilities, are dominatedonly by local seismicity. Consequently, for typical hazard mapping ofpeak accelerations in Štip, the Vrancea earthquakes can be ignored.However, this is different for intermediate- and long-period spectralamplitudes, in which the Vrancea earthquakes (M>6.5) contributeprogressively as periods of ground motion become longer.
Fig. 7a–d show the contours of PSA T s( = 1.0 ), with contributionsfrom the Vrancea earthquakes. The Vrancea earthquakes contributeappreciably at T s= 1.0 , which progressively increases in Macedonia asone moves northeast [32]. The contribution of Vrancea sources is alsolarger where the local seismicity is relatively low (see Appendix A andFig. 4).
A detailed comparison of Fig. 7a–d with Fig. 6a–d shows that thespatial distribution of short- and long-period amplitudes is different.This is caused by variable shapes of UHS and by the contribution tospectral amplitudes from the Vrancea sources with strong motion wavesarriving from the northeast. Fig. 8a and b show this in terms of theratios of spectral amplitudes computed relative to the spectral ampli-tudes without contribution from the Vrancea sources. While thecontribution of the Vrancea earthquakes does increase with a decreas-ing epicentral distance, the ratios in these figures are still dominated bythe northwest and south and southeast sources from Štip (see Fig. A1).
The relative increase of spectral amplitudes due to the contributionsfrom Vrancea earthquakes, shown in Fig. 8a and b, is the same for allcomparisons among the same geological site conditions (s=0, 1 and 2)and for the oscillator period shown (T=1.00 s). However, the ampli-tudes of PSA T π T PSV( ) = (2 / ) for UHS at T=1.00 s at sites onintermediate rocks (s=1) will be larger than at the basement rock sites(s=2). In this paper, we show many results for the sites on geological
Fig. 8. a. The ratio of uniform hazard acceleration spectra, PSA T( ), with and PSA T( ) computed without contributions from the Vrancea earthquakes at T=1 s, at “rock” soil sites, SL=0,for a 10% exceedance probability and an exposure interval of Y=10 years. b. The ratio of uniform hazard acceleration spectra PSA T( ), with and PSA T( ) computed without contributionsfrom the Vrancea earthquakes at T=1 s, at “rock” soil sites, SL=0, for a 10% exceedance probability and an exposure interval of Y=50 years.
V.W. Lee et al. Soil Dynamics and Earthquake Engineering 98 (2017) 54–66
59

basement rock (s=2) to facilitate qualitative comparisons with pre-viously published results by others, which are all shown only for type Asites.
5. Practical determination of UHS
UHS at a site can be calculated for each site-specific condition, butthese calculations are time consuming and require detailed knowledgeto select the required scaling parameters. A simple alternative forengineering applications, which we introduced in the mid-1980s, is toprepare maps of UHS for given response periods, site conditions,probabilities of exceedance, and exposure time, and then to read thespectral amplitudes from the contours in the maps. Our report entitled,“Microzonation of a Metropolitan Area,” describes this procedure andpresents examples of how it can be carried out [27]. Fig. 9a–d showexamples of such maps for PSV Tlog ( )10 amplitudes, at 12 periodsranging from 0.04 s to 2.00 s, for a 5% damping, horizontal motions,at “rock” and stiff soil sites (SL=0 and 1), for a 10% probability of beingexceeded and exposure periods of Y=10 and 50 years. By reading thespectral amplitudes at the given location, the UHS of PSV can beconstructed by interpolating the values read from 12 periods. Examples
of such an outcome are illustrated in Figs. 10a–11b, at two sites withdifferent geological site parameters (Stadion Suitlak, with s=2 andSL=0 and Stip City Center, with s=1 and SL=1).
A perusal of Fig. 9a–d shows that, in the contoured areas, there aremany jumps from one level to an adjacent one that do not have agradual transition (we will illustrate the reasons for this at T=0.2 s).This can be understood by looking at the spectral scaling equation inLee [21] that describes PSV T( ) versus magnitude, and geological andsoil site conditions:
PSV T M Att Δ M T b T M
b T S b T S
log ( ( )) = + ( , , ) + ( )
+ ( ) + ( ) + ....,10 1
21 (1)
22 (2)
where PSV T( ) takes on discrete values for s S= 1 ( = 1)(1) ands S= 2 ( = 1)(2) , and for damping 0.05. From Table IIIc in Lee [21] atT=0.2 s, for example, b = 0.0072
1 and b = − 0.22022 , which is a con-
siderable change. Next, looking at the figures where s=2 changes tos=1, PSV T( ) levels jump 2 steps. We do not smooth the contour levers,because every point is considered as a discrete estimate. Hence, thetransitions across the borders of two different s values are not smooth,but sudden.
Fig. 9. a. An example of seismic microzoning map for Štip, for pseudo spectral velocity (PSV), for a 5% fraction of critical damping, computed with UHS method, for local seismicity andcontributions from the Vrancea earthquakes combined. This is shown at the “rock” soil sites (SL=0), at 12 periods ranging from 0.04 to 2.00 s, for a probability of exceedance of p=0.10and an exposure time of Y=10 years. b. An example of a seismic microzoning map for Štip, for pseudo spectral velocity (PSV), for a 5% fraction of critical damping, computed with UHSmethod, for local seismicity and contributions from the Vrancea earthquakes combined, at the “rock” soil sites (SL=0), at 12 periods ranging from 0.04 to 2.00 s, for the probability ofexceedance of p=0.10 and an exposure time of Y=50 years. c. An example of a seismic microzoning map for Štip, for pseudo spectral velocity (PSV), for a 5% fraction of critical damping,computed with the UHS method, for local seismicity and contributions from the Vrancea earthquakes combined, at the stiff soil sites (SL=1), at 12 periods ranging from 0.04 to 2.00 s, foran exceedance probability of p=0.10 and an exposure time of Y =10 years. d. An example of a seismic microzoning map for Štip, for pseudo spectral velocity (PSV), for a 5% fraction ofcritical damping, computed with UHS method, for local seismicity and contributions from the Vrancea earthquakes combined, at the stiff soil sites (SL=1), at 12 periods ranging from 0.04to 2.00 s, for an exceedance probability p=0.10 and an exposure time of Y =50 years.
V.W. Lee et al. Soil Dynamics and Earthquake Engineering 98 (2017) 54–66
60

Figs. 10a–11b all show monotonically increasing contributions fromthe Vrancea sources as the oscillator periods become longer. At T=2 sand average spectral amplitudes, these increases range from 31% to37% for the Štip City Center, and from 38% to 40% for Stadion Suitlak,for p=0.5 and Y=10 and 50 years, for example. Overall, long-periodspectral amplitudes tend to be larger on s=1 and SL=1 (Štip – CityCenter, Fig. 10a,b) than on s=2 and SL=0 (Stadion Suitlak – Fig. 11a,b)provided the sites are at comparable distances from the large Vranceasources, as shown in these examples.
6. Conclusions
We have shown that the regional variations of UHS amplitudes overan area of a large city can be considerable. In the examples shown forŠtip, three sources of these variations include: (1) the geological andsoil site conditions, (2) the local seismicity that is mainly east of Štip,and (3) the contributions from the large Vrancea earthquakes, at adistance of about 600 km northeast, in Romania. The relative contribu-tions from these sources will differ between cities, depending on thedegree to which geologic and soil site conditions vary, as well as on the
Fig. 10. a. A comparison of uniform hazard spectra of PSV at Štip City Center, for seismic activity with (dashed lines) and without (solid lines) contributions from the Vrancea earthquakesin Romania, for an exposure time of Y=10 years. b. A comparison of uniform hazard spectra of PSV at Štip City Center, for seismic activity with (dashed lines) and without (solid lines)contributions from the Vrancea earthquakes in Romania, for exposure time of Y=50 years.
Fig. 11. a. A comparison of uniform hazard spectra of PSV at Stadion Suitlak, for seismic activity with (dashed lines) and without (solid lines) contributions from the Vrancea earthquakesin Romania, for an exposure time of Y=10 years. b. A comparison of uniform hazard spectra of PSV at Stadion Suitlak, for seismic activity with (dashed lines) and without (solid lines)contributions from the Vrancea earthquakes in Romania, for an exposure time of Y=50 years.
V.W. Lee et al. Soil Dynamics and Earthquake Engineering 98 (2017) 54–66
61

relative strength of local versus distant earthquakes.Almost everywhere in Macedonia peak accelerations will be domi-
nated by the local seismic activity, and contributions from the Vranceaearthquakes can be neglected. However, in many areas of the country,the intermediate- and long-period spectral amplitudes are affected bycontributions from large Vrancea earthquakes. These contributions areweakest in southwestern and southeastern Macedonia and strongest inthe northcentral parts of the country [32].
Throughout this paper, we have used empirical scaling equations inall calculations that were developed from strong motion data recordedin the former Yugoslavia [28,29,37]. As this data had only a fewrecordings on deep soil sites (SL=2, [59,61]), our empirical scalingequations for PSV amplitudes do not include the scaling in terms ofSL=2. Therefore examples including SL=2 are not included in thispaper. For future engineering designs, and to approximate the expectedamplitudes, at SL=2 sites, additional analyses will be required tomodify the UHS presented in this paper. This can be based on severalother scaling equations that include SL=2 scaling factors in Californiaand elsewhere [24].
Finally, it is noted that all results presented in this paper are only ofa preliminary nature. Our scaling models for strong ground motion inthe former Yugoslavia are more than 20 years old and based on strong
motion data that was recorded up to the early 1980s [16,66,67].Although our model for the scaling of PSV spectra in Serbia forearthquakes in the Vrancea source zone was published recently (andwhich we are also using in this paper for Štip), it only includes the datafor large Vrancea earthquakes.
More detailed and comprehensive analyses of this kind will bepossible when new and abundant recordings of local and Vranceaearthquakes become available. It is hoped that the current analysis willhelp motivate and guide observational programs that will contributesuch needed data. Last but not least, it is hoped that our profession willabandon outdated and ill-founded methods of scaling strong motionamplitudes, as in using the site classification in terms of V30 or A, B, C,and D, for example, and will finally realize that scaling the designspectra by peak acceleration and fixed shape spectra is not conserva-tive.
Acknowledgments
Research work of the third author was supported in part by theSerbian Ministry of Education, Science, and Technology DevelopmentGrant No. 36043.
Appendix A. Seismic activity and seismicity model
To illustrate computations for the strong motion earthquake hazard, we briefly summarize the data on seismic activity surrounding investigatedlocations and procedures for deriving the relevant seismicity model. The earthquake activity in the region is assumed to be well represented by acatalog compiled by merging records listed in the following catalogs:
– the BSHAP2 catalog (510 BCE–2012) compiled during the BSHAP2 NATO-funded project by seismologists from Albania, Croatia, Macedonia,Montenegro, Serbia, and Turkey [39];
– the ISC-catalog (2013–2014) (http://www.isc.ac.uk).
If not reported as such, all magnitudes were converted to moment magnitudes (Mw) using regionally adjusted regressions betweenMw on one sideand MS, ML, or mb on the other [39]. The catalog was declustered using time-space windows the size of which depend on the mainshock’s magnitudeas described, for example, in Herak et al. [12], thus removing dependent events (foreshocks and aftershocks). In estimating recurrence parameters,only mainshocks with magnitudes exceeding 3.4 were considered. Fig. A1 shows the geographical distribution of earthquake epicenters.
Fig. A1. Earthquake epicenters (main shocks only, M≥3.4). The colors indicate the focal depths according to the colorscale on the right. The size of the symbols scales are according tomagnitude.
V.W. Lee et al. Soil Dynamics and Earthquake Engineering 98 (2017) 54–66
62

Seismic activity is described by the earthquake occurrence rate in terms of moment magnitude (M = Mw), assuming the validity of the truncatedGutenberg-Richter recurrence relation:
⎧⎨⎩N M M M M( ) = 10 ≤ ≤0 otherwise
,a bM−
min max
(A1)
where N(M) is the number of events with magnitudes greater than or equal to M, and M M M≤ ≤min max is the allowable range of magnitudes. Mmin
varies in space and time according to the completeness of the contributing catalog(s), and the distribution ofMmax (Fig. A2) is assumed by taking intoaccount the magnitudes and intensities of the largest historical earthquakes and the lengths of the known major fault segments. The spatial andtemporal completeness of the catalog (see Fig. A3 for examples) was estimated as proposed by Herak et al. [12] (for details, see also [13]).
The seismicity of the region was modeled using a variant of the distributed smoothed seismicity approach [e.g., Frankel [7] and Frankel et al. [8];see also Lapajne et al. [20] who applied it to model the seismicity of Slovenia]. This method was also used to compile the earthquake hazard maps forCroatia [11] that are adopted as base maps in the National Annex to EC8 [14]. For computations, the region is divided into a mosaic of rectangularcells (0.1° ×0.1°, or approximately 11.1×11.1=123 km2). For each cell, parameters a and b in Eq. (A.1), along with their uncertainties, arecalculated, taking the magnitude completeness thresholds into account. Parameter b is estimated using the maximum-likelihood algorithm ofWeichert [73], which considers only earthquakes above their respective completeness thresholds within the smallest circle centered in each of thecells that holds at least 40 such events. The resulting spatial distribution of the b-value is shown in Fig. A2. a is assessed by counting the number of
Fig. A2. Parameter spatial distributions of the seismicity model. Top left: the a-value in the Gutenberg-Richter relation (normalized to 10,000 km2 and one year); Top right: the b-value inthe Gutenberg-Richter relation; Bottom left: the activity rate for M≥3.5 (number of events normalized to one year and 10,000 km2); Bottom right: maximum magnitude, Mmax.
V.W. Lee et al. Soil Dynamics and Earthquake Engineering 98 (2017) 54–66
63

events N1=N(M≥3.5), N2=N(M≥3.8), N3=N(M≥4.2) within the circle that occurred after the corresponding onset of complete reporting. For eachNi, N0i(b)=10a is estimated using Eq. (A.1), and representative a is obtained by taking the logarithm of the average. The seismicity rates thusobtained are normalized to one year and to an area of 10,000 km2. After a-values were assigned to each of the grid-cells, the resulting spatialdistribution is smoothed using a bivariate, normal-elliptical smoothing kernel (for an example, see e.g., [20], with the major axis directed along thepredominant strike of faults within the corresponding source zone whenever it is known. We extracted such information here from the database ofseismogenic faults, which is one of the products of the SHARE-project [5], http://diss.rm.ingv.it/share-edsf/), and also lists the correspondingpredominant style of faulting (normal, reverse, strike-slip). If the predominant strike was unknown, circular Gaussian smoothing was applied. Thewidths of Gaussian distribution (standard deviations) along the major and minor axes are scaled to the expected maximum fault length and to thewidth of the surface projection of the fault plane, respectively, estimated for the corresponding Mmax in the cell by relations of Wells andCoppersmith [74]. In this way, the seismogenic potential estimated on the basis of past earthquakes that occurred in the neighborhood of each of thegrid-cells, is distributed along the known faults systems. The seismicity model is then defined for each of the cells by the following parameters:
– geographical coordinates of the cell center,– a-value, and its standard deviation,– b-value, and its standard deviation,– maximum moment magnitude, Mmax
– average focal depth (km), and its standard deviation,– predominant strike of the seismogenic faults (°), and its standard deviation,– predominant style of faulting (unknown, normal, reverse, strike-slip).
Our seismicity model is mostly based on the past seismicity record. The model does not explicitly consider fault-sources, as we feel that necessarydata on positions of seismogenic faults, their segmentation, geometry, Quaternary activity rates, and so forth, are still far from reliably known andcomplete. Nevertheless, as noted above, the model includes some of the fault-specific data (predominant strike, the style of faulting, lengths of someknown segments) when such data were available.
Appendix B. Seismicity of the Vrancea source zone
The Vrancea earthquakes in Romania occur near a sharp bend of the southeastern Carpathians [15]. The seismicity is concentrated in a high-velocity focal volume in the depth range from about 60–200 km [48]. At shallower depths (0–60 km), earthquakes occur sporadically and are notlarge, with magnitudes typically below 5.5. Source properties of large Vrancea earthquakes and the geology of the surrounding areas generally leadto elongation of the intensity contours toward the southwest and Serbia and Macedonia. This is illustrated in Fig. 3 by the intensity contours of the1977 earthquake [19]. The cities in Macedonia were at considerable epicentral distances from this Vrancea earthquake, from 550 to 730 km (Stip –598; Skopje – 619; Ohrid – 726 km). In regards to the earthquake of March 4, 1977, Stip was in zone V (MSK scale), while Skopje and Ohrid were inzone IV.
Historical data on earthquake occurrences in Vrancea have been compiled by Radu [45] and Purcaru [43]. The corresponding Gittenberg-Richtertrend N a bMlog = −10 , which describes the number of earthquakes N per year greater or equal to a magnitude M, has been studied by many authors.Here we mention Radulian et al. [44] who give a=4.77±0.24 and b=0.89±0.04; Wenzel et al. [72] and Oncescu et al. [41] who give a=4.10 andb=0.78; and Paskaleva [42] who gave a=4.21 and b=0.80. The associated estimates of the largest possible magnitude for Vrancea events rangefrom 7.8 to 8.1. In Fig. B1 we also reproduce the observed values of N versus M for the period between 1980 and 1997 (redrawn from [41]. For thecalculations in this paper we assumed a=4.10± 0.24, b=0.78±0.04 and that Mmax is uniformly distributed between 7.9 and 8.1.
Fig. A3. Examples of the catalog’s completeness analyses. Left: the magnitude completeness threshold for the year 1980; Right: the beginning year of complete reporting for magnitudes≥3.9.
V.W. Lee et al. Soil Dynamics and Earthquake Engineering 98 (2017) 54–66
64

References2,3
[1] Akademia Nauk, SSSR. Seismicheskoe Reionirovanie Teritorii SSSR. Moskva:Izdatelstvo Nauka; 1980.
[2] Anderson JG, Trifunac MD. Uniform risk functionals for characterization of strongearthquake ground motion. Bull, Seism Soc Am 1978;68:205–18.
[3] Anderson JG, Trifunac MD. Application of Seismic Risk Procedures to Problems inMicrozonation, In: Proceedings of the Second International Conference onMicrozonation, San Francisco, 559–569; 1978b.
[4] Basic geological map – Štip. Basic geological map – Štip, K34-K81, GeologicalInstitute, Skopje, editorial and publication of the Federal Geological Institute ofBelgrade; 1976.
[5] Basili R, Kastelic V, Demircioglu MB, Garcia Moreno D, Nemser ES, Petricca P,Sboras SP, Besana-Ostman GM, Cabral J, Camelbeeck T, Caputo R, Danciu L, DomacH, Fonseca J, García-Mayordomo J, Giardini D, Glavatovic B, Gulen L, Ince Y,Pavlides S, Sesetyan K, Tarabusi G, Tiberti MM, Utkucu M, Valensise G, Vanneste K,Vilanova S, Wössner J. The European Database of Seismogenic Faults (EDSF)compiled in the framework of the Project Share.⟨http://diss.rm.ingv.it/share-edsf/⟩, doi: 10.6092/INGV.IT-SHARE-EDSF; 2013.
[6] Eurocode 8. Design provisions of structures for earthquake resistance – Part 1:General rules, seismic actions and rules for buildings (EN1998-1)/CEN Techn.Comm. 250 - SC8, CEN, Brussels; 2005.
[7] Frankel A. Mapping seismic hazard in the central and eastern United States. SeismRes Lett 1995;66:8–21.
[8] Frankel A, Mueller C, Barnhard T, Leyendecker E, Wesson R, Harmsen S, Klein F,Perkins D, Dickamn N, Hanson S, Hopper M. USGS national seismic hazard maps.Earthq Spectra 2000;16:1–20.
[9] Gubin IE. On some questions of seismic regionalization. Akad Nauk SSSR, Tr GeofizInst 1954;25(152):36–73.
[10] Gupta ID, Trifunac MD. Order statistics of peaks in earthquake response. J EngMech, ASCE, EMD 1988;114(10):1605–27.
[11] Herak M. Republika Hrvatska, Karta potresnih područja, ⟨http://seizkarta.gfz.hr⟩et al., 2011.
[12] Herak D, Herak M, Tomljenović B. Seismicity and focal mechanisms in North-Western Croatia. Tectonophysics 2009;465:212–20. http://dx.doi.org/10.1016/j.tect.2008.12.005.
[13] Herak M, Herak D. Analyses of seismicity as input for earthquake hazard studies inBosnia and Herzegovina, Chapter 1, in Selected Topics in Earthquake Engineering –from earthquake source to seismic design and hazard mitigation, published by ZIBL,Banja Luka, Republic of Srpska, Oct. 2009, 1–24; 2009.
[14] Hrvatski zavod za norme. HRN EN 1998-1:2011/NA: 2011, Eurokod 8:Projektiranje potresne otpornosti konstrukcija – 1. dio: Opća pravila, potresnadjelovanja i pravila za zgrade – Nacionalni dodatak (Eurocode 8: Design ofstructures for earthquake resistance – Part 1: General rules, seismic actions andrules for buildings – National Annex); 2011.
[15] Ismail-Zadeh AT, Panza GF, Naimark BM. Stress in the descending relic slab beneaththe vrancea region, Romania. Pure Appl Geophys 2000;157:111–30.
[16] Jordanovski LR, Lee VW, Manić MI, Olumčeva T, Sinadinovski C, Todorovska MI,Trifunac MD. * Strong earthquake ground motion data in EQINFOS: yugoslavia, PartI, Civil Eng. Report CE 87-05. Los Angeles, CA: Univ. of Southern California; 1987.
[17] Kanai K. Engineering Seismology. Tokyo, Japan: Univ. of Tokyo Press; 1983.[18] Karnik V. Microzoning Programme within the UNDP-UNESCO Survey of Seismicity
of Balkan Region, Proceedings Microzonation Conference, Seattle, Washington, I,213–215, 1972.
[19] Kronrod T, Radulian M, Panza G, Popa M, Paskaleva I, Radovanovich S, GribovszkiK, Sandu I, Pekevski L. Integrated transnational macroseismic data set for thestrongest earthquakes of Vrancea (Romania). Tectonophysics 2013;590:1–23.
[20] Lapajne J, Šket Motnikar B, Zupančič P. Probabilistic seismic hazard assessmentmethodology for distributed seismicity. Bull Seism Soc Am 2003;93:2502–15.
[21] Lee VW. Pseudo relative velocity spectra in former Yugoslavia. Eur J Earthq Eng1995;VII(1):12–22.
[22] Lee VW. Discussion: prediction of horizontal response spectra in Europe. Int JEarthq Eng Struct Dyn 1997;26(2):289–93.
[23] Lee VW. 1Empirical scaling of strong earthquake ground motion: part I: attenuationand scaling of response spectra. ISET J Earthq Technol 2002;39(4):219–54.
[24] Lee VW. 1Empirical scaling and regression methods for earthquake strong-motionspectra—A review. ISET J 2007;44(1):39–69.
[25] Lee VW, Manić MI. Empirical scaling and regression methods for strong earthquakeground motions in Yugoslavia—A review. Izgradnja 2009;2009(5–6):234–57.
[26] Lee VW, Trifunac MD. *Uniform Risk Spectra of Strong Earthquake Ground Motion.Los Angeles, California: Department of Civil Engineering, Report CE85-05,University of Southern Calif.; 1985.
[27] Lee VW, Trifunac MD. *Microzonation of a Metropolitan Area. Los Angeles,California: Department of Civil Engineering, Report CE 87-02, University ofSouthern California; 1987.
[28] Lee VW, Trifunac MD. Frequency dependent attenuation of strong earthquakeground motion in Yugoslavia. Eur Earthq Eng 1992;VI(1):3–13.
[29] Lee VW, Trifunac MD. Empirical scaling of fourier amplitude spectra in formerYugoslavia. Eur Earthq Eng 1993;VII(2):47–61.
[30] Lee VW, Trifunac MD. Should average shear wave velocity in the top 30 m of soil bethe only local site parameter used to describe seismic amplification? Soil DynEarthq Eng 2010;30(11):1250–8.
[31] Lee VW, Trifunac MD. Seismic hazard maps in Serbia, submitted for publication;2017a.
[32] Lee VW, Trifunac MD. Seismic hazard maps in Macedonia, submitted for publica-tion; 2017b.
[33] Lee VW, Herak M, Herak D, Trifunac MD. Uniform hazard spectra in NorthwesternBosna and Hercegovina. Izgradnja 2010;64(5–6):282–304.
[34] Lee VW, Trifunac MD, Herak M, Herak D. Uniform hazard earthquake accelerationspectra in Kraljevo – contributions from local seismicity. Izgradnja2011;65(5–6):227–35.
[35] Lee VW, Trifunac MD, Herak M, Herak D. Minimum radius of seismic activity forearthquake hazard analyses. Izgradnja 2011;65(5–6):219–26.
[36] Lee VW, Trifunac MD, Bulajić B, Manić M. A preliminary empirical model forfrequency-dependent attenuation of Fourier amplitude spectra in Serbia from theVrancea earthquakes. Soil Dyn Earthq Eng 2016;83:167–79.
Fig. B1. The number of earthquakes greater or equal to M, per year, in the Vrancea source zone in Romania.
2 Can be downloaded from http://www.usc.edu/dept/civil_eng/Earthquake_eng/.3 Can be downloaded from http://home.iitk.ac.in/~vinaykg/iset.html.
V.W. Lee et al. Soil Dynamics and Earthquake Engineering 98 (2017) 54–66
65

[37] Lee VW, Trifunac MD, Bulajić B, Manić M. Preliminary empirical scaling of pseudo-relative velocity spectra in serbia from the vrancea earthquakes. Soil Dyn EarthqEng 2016;86:41–54.
[38] Liao ZP. Seismic Microzonation in China, Instt. of Engineering Mechanics, StateSeismological Bureau, Research Report, 1-37; 1985.
[39] Markušić S, Gülerce Z, Kuka N, Duni L, Ivančić I, Radovanović S, Glavatović B,Milutinović Z, Akkar S, Kovačević S, Mihaljević J iR Šalić. An updated and unifiedearthquake catalogue for the western balkan region. Bull Earthq Eng2016;14(2):321–43.
[40] Medvedev SV. Inzenernaya Seizmologiya, Akademia Nauk SSSR. Inst. Fiziki Zemli,Moskva; 1962.
[41] Oncescu MC, Marza VI, Rizescu M, Popa M. The Romanian earthquake cataloguebetween 1984–1997. In: Wenzel F, Lungu D, Novak O, editors. VranceaEarthquakes: Tectonics, Hazard and Risk Mitigation. Dordrecht: Kluwer; 1999. p.43–7.
[42] Paskaleva I. Personal communication; 2016.[43] Purcaru G. He Vrancea, Romania, earthquake of march 4, 1977 – a quite successful
prediction. Phys Earth Planet Inter 1979;18:274–87.[44] Radulian M, Mandrescu N, Panza GF, Popescu E, Utale A. Characterization of
seismic zones in Romania. Pure Appl Geophys 2000;157:57–77.[45] Radu C. Contribution a l′etude de la seismicite de la Romanie at comparaison avec
la seismicite de sud-est de la France [Ph.D. Thesis]. Universite de Strasbourg; 1974.p. 404.
[46] Richter CF. Seismic Regionalization. Bull Seismol Soc Am 1959;49:123–62.[47] Šalić B, Milutinović ZV, Garevski MD. Results achieved and improvements needed
in the field of seismic hazard assessment of Republic of Macedonia, Proceedings 15World Conference On Earthquake Enginering, Lisboa, Portugal; 2012.
[48] Telesca L, Alcaz V, Sandu I. Analysis of 1978–2008 crustal and sub-crustalearthquake catalog of Vrancea region. Nat Hazards Earth Syst Sci 2013;12:1321–5.
[49] Todorovska MI, Trifunac MD. The role of earthquake hazard maps in lossestimation: a Study of the Northridge Earthquake, discussion of paper by R.B.Olshansky. Earthq Spectra 1998;14(3):557–63.
[50] Todorovska MI, Trifunac MD. A Seismic Hazard Model for Peak Strains in SoilsDuring Strong Earthquake Shaking. Earthq Eng Eng Vib1996;16(Supplement):1–12.
[51] Todorovska MI, Trifunac MD. Hazard mapping of normalized peak strain in soilduring earthquakes - microzonation of a metropolitan area. Soil Dyn Earthq Eng1996;15(5):321–9.
[52] Todorovska MI, Trifunac MD. Liquefaction opportunity mapping via seismic waveenergy. Geotech Geoenviron Eng ASCE 1999;125(12):1032–42.
[53] Todorovska MI, Gupta ID, Gupta VK, Lee VW, Trifunac MD. *Selected Topics inProbabilistic Seismic Hazard Analysis. Los Angeles, California: Dept. of Civil Eng.Report No. CE95-08, Univ. of Southern California; 1995.
[54] Todorovska MI, Lee VW, Trifunac MD. Shaking hazard compatible methodology forprobabilistic assessment of permanent ground displacement across earthquakefaults. Soil Dyn Earthq Eng 2007;27(6):586–97.
[55] Todorovska MI, Trifunac MD, Lee VW. Probabilistic Assessment of PermanentGround Displacement Across Earthquake Faults, Proceedings of EarthquakeEngineering in the 21st Century to mark 40th anniversary of IZIIS - Skopje, August28-Sptember 1, 2005, Skopje and Ohrid, Macedonia; 2005.
[56] Todorovska MI, Trifunac MD, Ding H, Orbović N. Coherency of dispersed syntheticearthquake ground motion at small separation distances: dependence on sitecondition. Soil Dyn Earthq Eng 2015;79:253–64.
[57] Trifunac MD. Seismic Microzonation Mapping Via Uniform Risk Spectra, In:Proceedings of the 9th World Conference Earthquake Engineering, VII, 75–80,Tokyo-Kyoto, Japan; 1988.
[58] Trifunac MD. Threshold magnitudes, which exceed the expected ground motionduring the next 50 years in a metropolitan area. Geofizika 1989;6:1–12.
[59] Trifunac MD. How to model amplification of strong earthquake ground motions bylocal soil & geologic site conditions. Earthq Eng Struct Dyn 1990;19(6):833–46.
[60] Trifunac MD. 75th Anniversary of the Response Spectrum Method – A HistoricalReview. Soil Dyn Earthq Eng 2008;28(9):676–85. [2008].
[61] Trifunac MD. Schantz T, Iankov R, editors. The Nature of Site Response DuringEarthquakes, Proc. NATO ARW workshop in Borovec, 30 August – 3 September2008, Bulgaria, published in Coupled Site and Soil-Structure Interaction effects withApplications to Seismic Risk Mitigation. B. V.: NATO Science for Piece and SecuritySeries C: Environmental Security, 3-31, Springer Science + Business Media; 2008.[2009].
[62] Trifunac MD. Seismic Microzonation and Near-Field Effects, In: Proceedings of the9th International Workshop on Seismic Microzoning and Risk Reduction(9IWSMRR), Cuernavaca, Morelos, Mexico, 21–24 February 2010.
[63] Trifunac MD. Earthquake response spectra for performance based design – ACritical Review. Soil Dyn Earthq Eng 2012;37(6):73–83.
[64] Trifunac MD. Site conditions and earthquake ground motion – a review. Soil DynEarthq Eng 2016;11(4):229–41.
[65] Trifunac MD, Brady AG. On the correlation of seismic intensity scales with the peaksof recording strong ground motion. Bull Seismol Soc Am 1975;90:88–100.
[66] Trifunac MD, Ivanović SS. Reocurrence of site specific response in FormerYugoslavia –part I: montenegro. Soil Dyn Earthq Eng 2003;23(8):637–61.
[67] Trifunac MD, Ivanović SS. Reoccurrence of site specific response in formerYugoslavia – Part II: friuli, Banja Luka and Kopaonik. Soil Dyn Earthq Eng2003;23(8):663–81.
[68] Trifunac MD, Todorovska MI. Can aftershock studies predict site amplification?Northridge, CA, earthquake of 17 January 1994. Soil Dyn Earthq Eng2000;19(4):233–51.
[69] Trifunac MD, Todorovska MI. Long period microtremors, microseisms and earth-quake damage: northridge, CA, earthquake of 17 January 1994. Soil Dyn EarthqEngrg 2000;19(4):253–67.
[70] Trifunac MD, Hao TY, Todorovska MI. On reoccurrence of site specific response.Soil Dyn Earthq Engrg 1999;18(8):569–92.
[71] Udwadia FE, Trifunac MD. Characterization of response spectra through thestatistics of oscillator response. Bull Seism Soc Am 1974;64(1):205–19.
[72] Wenzel F, Lorenz FP, Sperner B, Oncescu MC. Seismotectonics of the RomanianVrancea Area, in Vrancea Earthquakes:Tectonics, Hazard and Risk Mitigation,(edited by Wenzel et al.), 15–25; 1999.
[73] Weichert DH. Estimation of the earthquake recurrence parameters for unequalobservation periods for different magnitudes. Bull Seism Soc Am 1980;70:1337–46.
[74] Wells DL, Coppersmith JK. New empirical relations among magnitude, rupturewidth, rupture area, and surface displacement. Bull Seism Soc Am1994;84:974–1002.
V.W. Lee et al. Soil Dynamics and Earthquake Engineering 98 (2017) 54–66
66