soil characteristics and crop suitability of sandy soils ... · hainan island is located in the...
TRANSCRIPT

49
Session 1 “Global extent of tropical sandy soils and their pedogenesis”
Soil characteristics and crop suitability of sandy soils in Hainan, China
Zhao, Y. G.1, G. L. Zhang, 1, Z. Wen-Jun1, and Z. T. Gong1
Keywords: HaiSOTER, sandy soil, crop suitability
Abstract
Sandy soils in Hainan Island are mainly distributed on marine sediments which cover nearly 10% of theisland according to a recently established Hainan Soil and Terrain Digital Database (HaiSOTER). There isalso a secondary, very small area of sandy soils associated with granitic parent material. Crop production insandy soils is mainly limited by nutrient conditions. The main nutrient attributes, such as soil organic matter,cation exchange capacity (CEC), and N content, are significantly lower for sandy soils than for most othersoils. Most sandy soils are covered by natural or crop plants, such as Casuarina equisetifolia, coconut,eucalypt, peanut and cassava, in the meteorologically favourable parts of the island in the east and northeast,where rainfall is abundant. However, in the west and southwest part of the island, vegetation is sparse due tolow rainfall and the very low water-holding capacity of these coarsely-textured soils. Crop suitability forparticular regions of sandy soils is evaluated based on land quality classifications. For most sandy soils,nutrient availability is the most limiting factor. However, in the southwest part of this island, aridity becomesthe most important limiting factor, and in the northeast, typhoon is another limiting factor. In such areas,wind-resistant trees and crops are suitable for planting. According to the Automated Land Evaluation System(ALES) land evaluation system, the sandy soils can play a more important role in tropical crop cultivation. Itis concluded that when the technological and financial conditions are improved, the sandy soils in Hainancan be used for tropical crops more efficiently.
Introduction
Hainan Island is located in the northern fringe ofthe tropics, and therefore enjoys advantageoushydrothermal conditions and rich plant resources.Agriculture is the dominant economic sector. HainanIsland is an important base for developing tropicalcrops in China, and therefore exports tropical fruits andwinter vegetables throughout China. The sustainableand efficient use of land resources is an important issuefor agricultural development of the island. Sandy soilscover a large area of the island. Much of these areasare cultivated, but often at a low production level.Using the HaiSOTER database, which was constructedfrom 1999 to 2003, soil quality and crop suitabilitywere evaluated as a method of identifying limitationsand potential uses of sandy soils on the island.
Climate
Mean annual temperature on Hainan Islandranges between 23ºC and 25ºC, and mean annualprecipitation from 900 mm to 2,600 mm. Precipitation
1 State Key Laboratory of Soil and SustainableAgriculture, Institute of Soil Science, Chinese Academy ofSciences East Beijing Road 71, Nanjing 210008, China
is unevenly distributed, with less received in winterand spring and more in summer and fall. During thesummer and fall, typhoons are frequent, bringing aboutone-third of the year’s precipitation. As shown inFigure 1, there are regional differences in precipitationon the island. In the eastern parts, such as nearWanning and Qiongzhong, precipitation may reach2,000 mm or more, while in the southwestern part,precipitation is less than 1,200 mm. Most soils ofHainan Island have a Hyperthermic soil temperatureregime. With respect to soil moisture, soils in the broadcentral northern part have an aridity <1 and belong to
Figure 1. Soil moisture regimes of the Hainan Island

50
Session 1 “Global extent of tropical sandy soils and their pedogenesis”
the Udic moisture regime; those in the southwesternpart have an aridity >1 and belong to the Usticmoisture regime; and those in the central mountainousregion, where precipitation increases with elevation,belong to the Udic and Perudic moisture regimes(Gong et al., 2003).
Landform
The Hainan Island landform is characterized byhigh elevation in the centre surrounded by a low andflat circumference. With Wuzhishan (1,867 m) andYinggeling (1,811 m) mountains at the centre, threeconcentric zones can be defined (Figure 2). The centrezone accounts for 25.5% of the island’s territory andconsists of mountains and hills with elevations >400 m.It has steep slopes and mostly young soils seriouslyaffected by erosion. The zone makes up 45.8% of theterritory, and contains hills and plateaus with elevationsranging from 20 m to 400 m that are predominantlymature soils. The outer zone contains 28.7% of theisland’s area, and has mostly flat coastal plains below20 m in elevation. It is in this outer zone that humanactivities are the concentrated and is dominated bymostly anthropogenic soils.
There are two types of data in a SOTERdatabase: geometric data and attribute data. Thegeometric component indicates the location andtopology of SOTER units, while the attribute partdescribes the non-spatial characteristics. The geometricdata is stored and handled by GIS software, while theattribute data is stored separately in a set of files,managed by a relational database system. A uniquecode is set up in both the geometric and attributedatabases to link these two types of information foreach SOTER unit.
A SOTER database at a scale of 1:200,000 wascompiled for Hainan Island (HaiSOTER). Figure 3shows the procedure of HaiSOTER (Zhao et al., 2005).The database consists of spatial and attribute data ofthe soil and terrain conditions, and associated data suchas climate and land use. HaiSOTER database collected153 soil profiles accoss the island. Each SOTER unithas its representative soil profiles.
Figure 2. A schematic map of the general pattern of theannular distribution of the soils on Hainan Island
Materials and Methods
SOTER Methodology
SOTER (Soil and Terrain Digital Database) hasbeen widely used as a world soil and terrain digitaldatabase (FAO, 1995). Underlying the SOTERmethodology is the identification of areas of land withdistinctive, often repetitive, patterns of landform,lithology, surface form, slope, parent material, andsoils. Tracts of land distinguished in this manner arenamed SOTER units. Each SOTER unit represents oneunique combination of terrain and soil characteristics.
Figure 3. Flow chart of 1:200,000 HaiSOTERestablishment
GIS databaseTerrain unit map,
1:200,000
1:200,000
SOTER unit map
Landform map,
1:100,000
Lithology map,
1:200,000
Soil map,
1:200,000
simplify
classify
classify
digitizing
overlap,
integration
field check
Crop Suitability Evaluation
An expert model for physical land evaluationdeveloped in the Automated Land Evaluation System(ALES) was used to separate potentially suitable AEU(Agricultural Ecological Unit)’s from unsuitable ones.Soil depth, surface horizon depth, texture, structure,bulk density, cation exchange capacity (CEC), pH, totalnitrogen (TN), total phosphorus (TP), exchangeableCa, Mg, K, growing period, rainfall and typhoonoccurrence were considered during the modelingprocesses.
The evaluation model for crops distinguishesbetween management types with different levels(low, medium and high) of input and degree ofmechanization. Such specific types of land use arecalled ‘land utilization types’ (LUT). To illustrate howthe evaluation model works, we take the case ofbanana, which is a common crop in Hainan withfavourable marketing prospects. Four land utilizationtypes of banana growing were defined for this study(Mantel et al., 2003):

51
Session 1 “Global extent of tropical sandy soils and their pedogenesis”
Low input and low technology. This LUTincludes a low application of organic fertilizer andsimple implements for weeding and soil tillage. Noterracing or artificial drainage is practiced.
Medium input and low technology. This LUTincludes modest applications of inorganic or organicfertilizer and agrochemicals. It does not include use ofmechanized tools for weeding and soil tillage. Noterracing is practiced. Artificial drainage is not applied.
Medium input and medium technology. ThisLUT includes modest applications of inorganic ororganic fertilizer and agrochemicals. Mechanized toolsare used for weeding and soil tillage. No terracing ispracticed. Artificial drainage is applied where required.
High input and medium technology. This LUTincludes applications of inorganic or organic fertilizerand agrochemicals and mechanized tools for weedingand soil tillage. No terracing is practiced. Irrigation andartificial drainage is applied where required.
Other levels of input and degree of mechanizationwere not defined in the assessment model for bananain this study.
Results and Discussion
Soil Chemistry Attributes
There are four major parent materials in Hainanisland (GPGSB, 1965): acid igneous rock, which formsCambosols and Ferrosols; marine sediments, whichform Primosols and Cambosols; inner land clasticsediments, which form Cambosols; and basic igneousrocks, which form Ferrolosols. Soils from thesefour parent materials cover 83.2% of the island. 138 of153 soil profiles in HaiSOTER database were takenfrom these four types of parent materials, in which,
65 soil profiles on acid igneous rock, 35 sandy soilprofiles on marine sediments, 23 on clastic sediment,15 on basic igneous. Topsoil chemical attributes ofsandy soils formed from marine sediments and soilsfrom the other three parent materials are listed inTable 1, and illustrated in Figure 4 using standardizedvalues to better compare and contrast the soils (Zhaoet al., 2005).
Exchangeable bases: Because the silt and claycontents were very low for sandy soils, they containedless exchangeable bases. In terms of average values,exchangeable K, Ca, and Mg of sandy soils were lowerthan in soils developed from other parent materials.Exchangeable K content of sandy soils was lower thanthat of soils developed from acid igneous material andclastic sediments, and exchangeable Mg was lowerthan in soils formed from clastic sediments. There wasno significant difference in exchangeable Na contentamong soils developed from four parent materials.
Sandy soils had the highest pH and lowestexchangeable acidity and Al. Normally in tropicalclimates with high precipitation such as those ofHainan, strong desilication and allitization are themain soil forming processes, and exchangeable Aldominates soil pH. However, sandy soils contain fewerweatherable minerals, making desilication andallitization weak. Also, there are shell and coralsediments in sandy soils with high Ca content thatneutralize acid quickly.
Sandy soils in Hainan also had the lowest CEC,total carbon (TC), and TN values compared to the othersoil types, which makes them unfavourable for growingmost types of vegetation. Because of their coarsetexture, many plant-essential nutrients elements can beeasily leached. The TP content for soils developedfrom basic igneous material is lower than that of soils
Figure 4. Topsoil attributes developed from different parent materials (standardized value)
-0.5
0
0.5
1pH
EXAC
EXAl
EXCa
EXMg
EXNaEXCK
CEC
TC
TN
TP
soils on acid igneoussoils on marine sediments
-0.5
0
0.5
1pH
EXAC
EXAl
EXCa
EXMg
EXNaEXCK
CEC
TC
TN
TP
soils on inner clastic sedimentssoils on basic igneous
52
Session 1 “Global extent of tropical sandy soils and their pedogenesis”
developed from clastic sediments. P content in clasticsediment maybe higher because of the erosion processbrings P sediments from upper reaches.
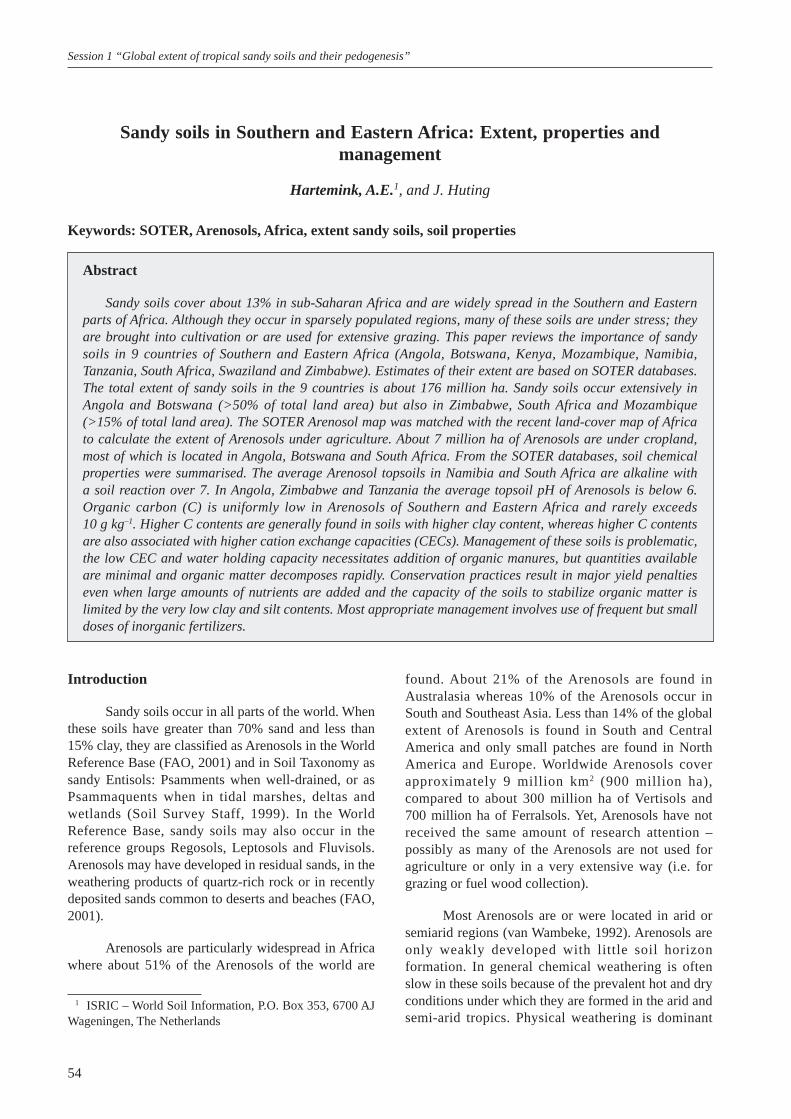
Land use:
Figure 5 shows the land use distribution forsandy soils in Hainan, as interpreted from the TMsatellite in the year 2000. As the data indicate,agriculture is the most important economic resource forHainan. Nearly 70% of the area of sandy soils is undercultivation. The main crops include vegetables,cassava, coconut and peanut. In the eastern part of theIsland, where water supply is abundant, rice iscultivated on sandy soils.
Agricultural exploitation on sandy soils mainlyoccurs in the middle circle (Figure 2) and not in thenewly formed, unsuitable sand areas in the outer circle,where Casuarina equisetifolia, coconut and salt-tolerant grasses are the main vegetation types.
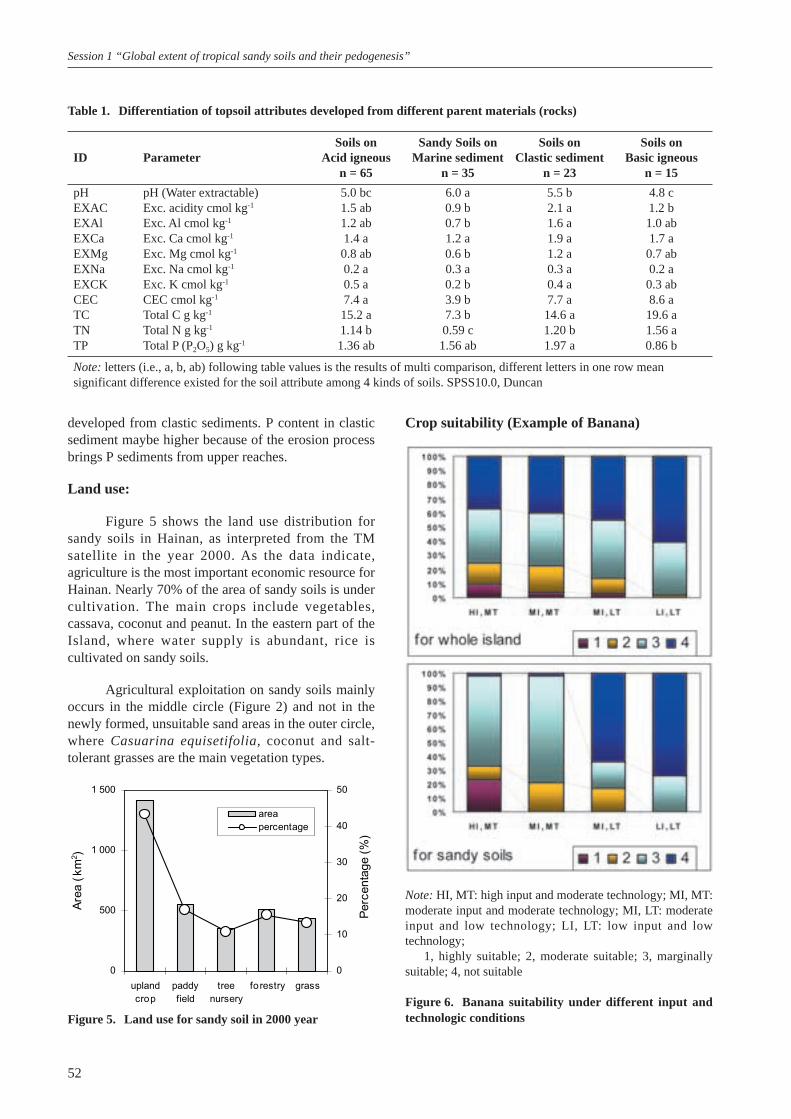
Crop suitability (Example of Banana)
Table 1. Differentiation of topsoil attributes developed from different parent materials (rocks)
Soils on Sandy Soils on Soils on Soils onID Parameter Acid igneous Marine sediment Clastic sediment Basic igneous
n = 65 n = 35 n = 23 n = 15
pH pH (Water extractable) 5.0 bc 6.0 a 5.5 b 4.8 cEXAC Exc. acidity cmol kg-1 1.5 ab 0.9 b 2.1 a 1.2 bEXAl Exc. Al cmol kg-1 1.2 ab 0.7 b 1.6 a 1.0 abEXCa Exc. Ca cmol kg-1 1.4 a 1.2 a 1.9 a 1.7 aEXMg Exc. Mg cmol kg-1 0.8 ab 0.6 b 1.2 a 0.7 abEXNa Exc. Na cmol kg-1 0.2 a 0.3 a 0.3 a 0.2 aEXCK Exc. K cmol kg-1 0.5 a 0.2 b 0.4 a 0.3 abCEC CEC cmol kg-1 7.4 a 3.9 b 7.7 a 8.6 aTC Total C g kg-1 15.2 a 7.3 b 14.6 a 19.6 aTN Total N g kg-1 1.14 b 0.59 c 1.20 b 1.56 aTP Total P (P2O5) g kg-1 1.36 ab 1.56 ab 1.97 a 0.86 b
Note: letters (i.e., a, b, ab) following table values is the results of multi comparison, different letters in one row meansignificant difference existed for the soil attribute among 4 kinds of soils. SPSS10.0, Duncan
Figure 5. Land use for sandy soil in 2000 year
0
500
1 000
1 500
upland
crop
paddy
field
tree
nursery
forestry grass
Are
a (
km
2)
0
10
20
30
40
50
Perc
enta
ge
(%)
area
percentage
Note: HI, MT: high input and moderate technology; MI, MT:moderate input and moderate technology; MI, LT: moderateinput and low technology; LI, LT: low input and lowtechnology;
1, highly suitable; 2, moderate suitable; 3, marginallysuitable; 4, not suitable
Figure 6. Banana suitability under different input andtechnologic conditions

53
Session 1 “Global extent of tropical sandy soils and their pedogenesis”
We use the example of banana in this paper toillustrate how crop suitability was evaluated fordifferent soil and terrain types in Hainan. Bananasuitability at four different input and technologicalconditions was demonstrated by Mantel et al. (2003).Poor native soil productivity is reflected by lowsuitability values under low input and lowtechnological conditions. Because banana has highrequirements for water and nutrients, and for low windclimates, almost none of the island’s land was found tobe suitable for banana production under conditions oflow input and technology (Figure 6). When the inputand technological conditions were improved, the areasuitable for production increased gradually for thewhole island. For sandy soils, however, the increase issteeper (Figure 6). More than 30% of sandy soils canbe used for banana planting at high input and moderatetechnological conditions. The sharper increase insuitability demonstrates that some sandy soils can beimproved easily, because poor nutrient availability,their most limiting production factor, can be addressedby fertilizer input.
The sandy soils suitable for banana productionare mainly distributed in the west and northern part ofthe island. Almost none of the sandy soils in the eastpart can be used for banana planting because of thetyphoon risk. The prevailing direction of typhoon isfrom the south and southeast towards the north andnortheast. Nutrient deficiencies are similar for sandysoils in both the western and eastern parts of the island.Water limitation is especially critical for sandy soils ofthe west part, because annual precipitation is less than1,000 mm and evaporation is very high. However, withfinancial support to construct irrigation systems, thisconstraint can be removed in some areas.
Soils suitable for banana planting are mainlydistributed on the old marine sediments towardsthe interior of the outer concentric zone shown inFigure 2, where soil texture and nutrient conditions ofthese soils have been improved by longer weatheringand a longer history of cultivation.
Conclusions
Sandy soils play an important role for Hainan’sagriculture. Nearly 70% of the area of sandy soils isunder cultivation. But sandy soils in Hainan are limitedby poor nutrient conditions. The main nutrient
attributes such as soil organic matter, CEC, and Ncontent are significantly lower than those in other soils.However, they have the highest pH and lowestexchangeable acidity and Al.
Some sandy soils can be improved easily,because poor nutrient availability, their most limitingproduction factor, can easily be addressed by fertilizerinput. More than 30% of sandy soils can be used forbanana production at high input and moderatetechnological conditions.
Acknowledgement
The construction of HaiSOTER database wascooperatively done by Chinese Academy of TropicalAgricultural Sciences. Methodology was supported bythe International Soil Reference Information Center.Mr. VWP. van Engelen, Mr. S. Mantel and Dr. X.L.Zhang completed the main work on assessment of cropsuitability.
References
Doran J.W., Parkin T.B. 1994. Defining and assessing soilquality. In: Doran J.W., et al. ed. Defining soil qualityfor a sustainable environment. Soil Science Societyof American Publication No. 35. Inc., Madison,Wisconsin, USA, 3-21.
FAO. Global and national soil and terrain digital database(SOTER).world-soil-resources-report.1995.
Gong, Z.T., Zhang, G.L., Zhao, W.J., Zhao, Y.G. and Chen,Z.C. 2003. Land use-related changes in soils ofHainan Island during the past half century.Pedosphere. 13(1): 11-22.
GPGSB (Guangdong Provincial Geologic SurveyingBureau). Geologic map of Hainan Island (1:200,000).State Printery No. 543, Tianjin, 1965.
Mantel, S., Zhang, X.L. and Zhang, G.L. 2003. Identificationof potential for banana in Hainan Island, China.Pedosphere. 13(2): 147-155.
Zhao Yu-Guo, Zhang Gan-Lin, Gong Zi-Tong, 2004,Systematic Assessment and Regional Features of SoilQuality in Hainan Island, Chinese Journal of Eco-Agriculture. 12(3): 13-15.
Zhao Yuguo, Zhang Ganlin, Gong Zitong, Deng Wangang,2005, Soil type, soil quality and crop suitability ofsoils developed from different geology environmentin Hainan Island, Quaternary Science, 25(3):389-395.
54
Session 1 “Global extent of tropical sandy soils and their pedogenesis”
Sandy soils in Southern and Eastern Africa: Extent, properties andmanagement
Hartemink, A.E.1, and J. Huting
Keywords: SOTER, Arenosols, Africa, extent sandy soils, soil properties
Abstract
Sandy soils cover about 13% in sub-Saharan Africa and are widely spread in the Southern and Easternparts of Africa. Although they occur in sparsely populated regions, many of these soils are under stress; theyare brought into cultivation or are used for extensive grazing. This paper reviews the importance of sandysoils in 9 countries of Southern and Eastern Africa (Angola, Botswana, Kenya, Mozambique, Namibia,Tanzania, South Africa, Swaziland and Zimbabwe). Estimates of their extent are based on SOTER databases.The total extent of sandy soils in the 9 countries is about 176 million ha. Sandy soils occur extensively inAngola and Botswana (>50% of total land area) but also in Zimbabwe, South Africa and Mozambique(>15% of total land area). The SOTER Arenosol map was matched with the recent land-cover map of Africato calculate the extent of Arenosols under agriculture. About 7 million ha of Arenosols are under cropland,most of which is located in Angola, Botswana and South Africa. From the SOTER databases, soil chemicalproperties were summarised. The average Arenosol topsoils in Namibia and South Africa are alkaline witha soil reaction over 7. In Angola, Zimbabwe and Tanzania the average topsoil pH of Arenosols is below 6.Organic carbon (C) is uniformly low in Arenosols of Southern and Eastern Africa and rarely exceeds10 g kg–1. Higher C contents are generally found in soils with higher clay content, whereas higher C contentsare also associated with higher cation exchange capacities (CECs). Management of these soils is problematic,the low CEC and water holding capacity necessitates addition of organic manures, but quantities availableare minimal and organic matter decomposes rapidly. Conservation practices result in major yield penaltieseven when large amounts of nutrients are added and the capacity of the soils to stabilize organic matter islimited by the very low clay and silt contents. Most appropriate management involves use of frequent but smalldoses of inorganic fertilizers.
1 ISRIC – World Soil Information, P.O. Box 353, 6700 AJWageningen, The Netherlands
Introduction
Sandy soils occur in all parts of the world. Whenthese soils have greater than 70% sand and less than15% clay, they are classified as Arenosols in the WorldReference Base (FAO, 2001) and in Soil Taxonomy assandy Entisols: Psamments when well-drained, or asPsammaquents when in tidal marshes, deltas andwetlands (Soil Survey Staff, 1999). In the WorldReference Base, sandy soils may also occur in thereference groups Regosols, Leptosols and Fluvisols.Arenosols may have developed in residual sands, in theweathering products of quartz-rich rock or in recentlydeposited sands common to deserts and beaches (FAO,2001).
Arenosols are particularly widespread in Africawhere about 51% of the Arenosols of the world are
found. About 21% of the Arenosols are found inAustralasia whereas 10% of the Arenosols occur inSouth and Southeast Asia. Less than 14% of the globalextent of Arenosols is found in South and CentralAmerica and only small patches are found in NorthAmerica and Europe. Worldwide Arenosols coverapproximately 9 million km2 (900 million ha),compared to about 300 million ha of Vertisols and700 million ha of Ferralsols. Yet, Arenosols have notreceived the same amount of research attention –possibly as many of the Arenosols are not used foragriculture or only in a very extensive way (i.e. forgrazing or fuel wood collection).
Most Arenosols are or were located in arid orsemiarid regions (van Wambeke, 1992). Arenosols areonly weakly developed with little soil horizonformation. In general chemical weathering is oftenslow in these soils because of the prevalent hot and dryconditions under which they are formed in the arid andsemi-arid tropics. Physical weathering is dominant

55
Session 1 “Global extent of tropical sandy soils and their pedogenesis”
resulting from extreme changes in diurnal temperaturesand seasons. Wind erosion may be a problem in manyareas dominated by Arenosols because of the lack ofsoil cover and weak soil structure (FAO, 2001).Characteristic properties of Arenosols are high waterpermeability, low water-holding capacity, low specificheat, and often minimal nutrient contents. In summary:Arenosols have a large number of unfavourableattributes for sustainable agriculture (van Wambeke,1992). They are best kept covered by vegetation. Alsounder natural conditions it is difficult to establish denseplant communities on Arenosols due to the exploitationfor firewood, grazing or the destructive effects on thetree layer by large vertebrates and periodic burning(Almendros et al., 2003). In many parts of Southernand Eastern Africa, Arenosols are increasingly used forarable farming because of pressure on the land forcingthe cultivation of such unfavourable soils. Extensiverainfed production of annual crops is possible andgroundnuts and cassava are often considered bestadapted to Arenosols but also tobacco is grown onArenosols. Perennial crops on Arenosols includecashew, coconuts, citrus, eucalyptus and pinus (vanWambeke, 1992).
In Africa, Arenosols cover about 273 million haor almost 13% of the total land mass (Eswaran et al.,1997). They occur widely in the western part of thecontinent where much soil fertility research on sandysoils takes place (e.g. Mokwunye, 1991; Pieri, 1989;Sanginga et al., 1995; Vanlauwe et al., 2002). Thiswork has greatly contributed to the sustainablemanagement of Arenosols which – in essence – sufferfrom both poor soil chemical and physical properties.Relatively little work has been conducted on Arenosolsin the southern and eastern part of the continentpossibly as the extent of Arenosols is smaller, and theirimportance lower.
This paper focuses on Arenosols in Southernand Eastern Africa. The extent and properties aresummarised. The objectives of this paper are toestimate the extent and properties of sandy soils inSouthern and Eastern Africa based on SOTERdatabases, followed by a brief discussion on soilmanagement strategies for sustainable crop production.
Databases and experimental data
Soil databases
Since the mid 1980s, a global soil and terraindatabase has been developed at a scale of 1:1 million.The scale independent database, named SOTER(Global SOils and TERrain Digital Database), holds
information of a maximum of 118 soil and terrainattributes (Oldeman and van Engelen, 1993). SOTERis to replace the 1:5 million FAO-Unesco soil map ofthe world (van Engelen and Hartemink, 2000).Continental scale SOTER databases are available forLatin America and the Caribbean, Central and EasternEurope and Southern Africa. The SOTER methodologyhas been applied at scales ranging from 1:250,000 to1:5 M (Batjes, 2004) and a range of single value mapsor data and interpretative products can be extracted.SOTER has been used in studies on vulnerabilityassessment to pollution mapping in Central and EasternEurope, the impact of erosion on crop productivity invarious tropical countries, global environmental changestudies and agro-ecological zoning (Batjes, 2002;Batjes, 2004). SOTER databases can also be combinedwith remote sense imagery to investigate links betweenland use and soils.
SOTER consists of units that contain adistinctive, often repetitive, pattern of landform,lithology, surface form, slope, parent material and soil.SOTER puts emphasis on the relationships betweenlandform, parent material and soils, integrating theseinto one unit: the SOTER unit. Each SOTER unitrepresents a unique combination of terrain and soilcharacteristics and a maximum of 118 attributes. AsSOTER units consist of a combination of a terrain andsoil component, they may contain several soilcomponents. For example, a SOTER unit may consistof 60% Ferralsols, 20% Vertisols and 20% Acrisols, ora unit may have 80% Vertisols and 20% Fluvisols.
Southern Africa
The 1:5 M soil map of Africa was published in1973. Early 2000, FAO and ISRIC – World SoilInformation started to compile a SOTER database forSouthern Africa. It included the compilation andharmonisation of a soil and terrain digital database for8 countries in Southern Africa: Angola, Botswana,Mozambique, Namibia, South Africa, Swaziland,Tanzania and Zimbabwe (Dijkshoorn, 2003; FAO-ISRIC, 2003). The database was compiled fromnational SOTER databases combined with availablesoil maps and soil and terrain data including digitalelevation models. The database has a generalisedscale of 1:2 M but the detail and quality or informationvaries widely between and within countries(Dijkshoorn, 2003). For example, in South AfricaSOTER units are based on a scale of 1:250,000whereas in several other countries soils have beenmapped at 1:1 M or smaller. SOTER units in SouthernAfrica are comprised of up to 7 soil components, withan average of 2. In total there are 941 soil profiles in

56
Session 1 “Global extent of tropical sandy soils and their pedogenesis”
the SOTER databases of Southern Africa, whereasthe SOTER database for Kenya contains 366 soilprofiles. Of these 1,307 soil profiles 165 are Arenosols(Table 1). From the databases, SOTER units wereselected in which Arenosols were dominant and theirextent exceeded 75%. These queries were made withArcView 3.3. Successively, the total extent ofArenosols was calculated for each country and a mapwas produced showing the distribution of Arenosols inthe 9 countries.
(Figure 1). The Arenosols in large areas of Botswanaand in surrounding countries are derived from theKalahari sands. In Zambia and the western part ofAngola many soils are buried under the Kalahari sands(Eswaran et al., 1997). In Zimbabwe the Arenosolshave been mostly derived from the weathering of theunderlying granitic rocks that contain large amounts ofquartz (Burt et al., 2001). In Eastern Africa, Arenosolsare mainly found along the coast and althoughArenosols occur in Tanzania they are not shown sincethey are not dominant (<75%) in the SOTER units.
Table 1. SOTER units and soil profiles for the 9 countriesin Southern Africa, based on the SOTER database forSouthern Africa and Kenya
SOTERTerrain Soil Number Number
Countryunits
com- com- of soil ofponents ponents Profiles Arenosols
Angola 238 322 887 150 60Botswana 94 145 404 60 6Kenya 39 ? ? 366 11Mozambique 225 325 641 127 30Namibia 92 118 269 52 3Tanzania 169 297 687 54 4South Africa 3,039 7,006 11,822 328 39Swaziland 19 32 72 14 ?Zimbabwe 143 200 294 156 12
Total 4,019 8,445 15,076 1,307 165
Land cover map
The land cover map of Africa has been used toidentify land cover classes in Southern and EasternAfrica (Mayaux et al., 2003). The map (grid map,spatial resolution 1 km) shows the major vegetationformations of the continent with an improved thematiccontent over previous land cover maps. The majorityof the data were acquired in 2000. The map identifies24 land cover classes, but for this paper, we reducedthe number of land cover classes to 5 (forest, grass andshrub land, crop land, stony desert, salt hard pans) bycombining several individual classes. From this landcover map, the total area of cropland was calculated foreach of the 9 countries. The SOTER Arenosol map wasthe matched with the land cover map (Mayaux et al.,2003). For each of the Arenosol polygons, zonalstatistics of the grid were used to calculate the extentof Arenosols for the 5 land cover classes. These weresummed up per country to arrive at the area underagriculture.
Extent and land-cover of sandy soils
Arenosols occupy large areas from Central andEast Angola and Namibia to Zimbabwe and Botswana
Figure 1. Distribution of Arenosols in Eastern andSouthern Africa. Map shows the SOTER units in whichArenosols are dominant (>75% of the SOTER unit)
Total area of Arenosols in the 9 countries isestimated to be 176 million ha. The largest extent isfound in Angola (63 million ha) where Arenosols coverabout 51% of the total land area. In Botswana,Arenosols occupy 38 million ha or almost two-third ofthe whole country. Arenosols are also widespread inNamibia where they cover 26 million ha or 31% of thetotal land mass. Arenosols are also important inMozambique, South Africa and Zimbabwe where theyoccupy million of hectares.
Of the total 176 million ha of Arenosols inSouthern and Eastern Africa, about 7 million hectareare under cropland (Table 2). The largest extent is

57
Session 1 “Global extent of tropical sandy soils and their pedogenesis”
found in the south central part of Angola where about2 million ha of Arenosols are cultivated. Considerableareas of Arenosols in Zimbabwe and South Africa arealso under cropland (Figure 2). From the land covermap it was calculated that most of the Arenosols in theSouthern and Eastern of Africa are under grassland –with or without shrubs (85 million ha) and varioustypes of forest and woody vegetation (49 million ha).
Properties of sandy soils
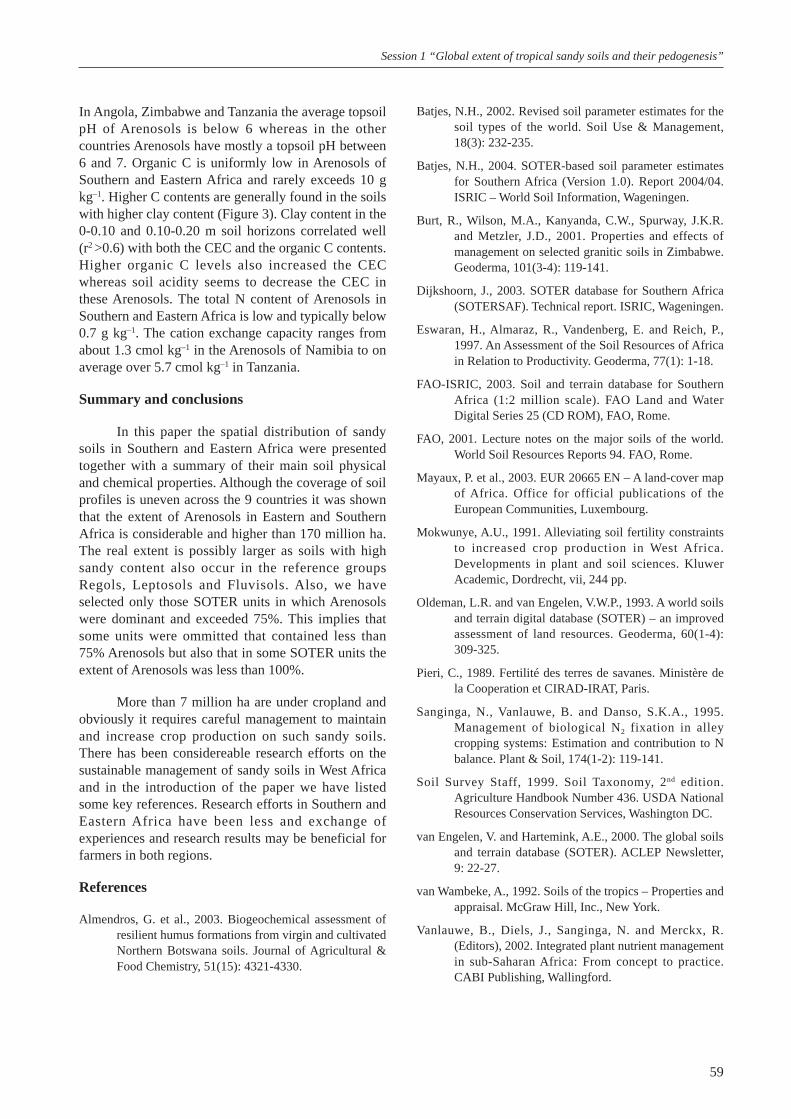
A summary of some key soil physical andchemical properties is given in Tables 3 and 4. Theaverage sand content is highest in the topsoils ofArenosols in Angola, Zimbabwe, Namibia andBotswana (>92%) and lowest in the Arenosols ofKenya, Mozambique and Tanzania (<90%). Although
this may appear an insignificant difference, the lowersand content (and thus higher silt and clay content)influences important characteristics such as waterholding capacity and nutrient retention (Figure 3). Fewbulk density data were available and most of theArenosols have fairly high bulk densities, which iscommon for sandy soils.
The average Arenosol topsoils in Namibia andSouth Africa are alkaline with a soil reaction over 7.These soils have also base saturations of almost 100%.
Table 2. Extent of Arenosols, total area under croplandand total area Arenosols under cropland in 9 countries inSouthern and Eastern Africa
Arenosols Total area Arenosolsunder cropland
million % million % of % ofCountry ha ha total total
extent areaArenosols under
cropland
Angola 125 64 51 1.9 2 39Botswana 58 38 66 1.1 2 23Kenya 59 3 6 0.1 <0.5 3Mozambique 79 17 21 0.4 <0.5 5Namibia 83 26 31 0 <0.5 1Tanzania 95 4 4 0 0 0South Africa 125 18 15 2.6 2 10Swaziland 2 0 0 0 <0.5 0Zimbabwe 39 6 16 0.9 2 8
Total 665 176 7.0
Landarea
millionha
Figure 2. Simplified land-cover map of Arenosols inEastern and Southern Africa, based on SOTER and landcover map of Mayaux et al. (2003)
Table 3. Summary of soil physical properties of Arenosols in Southern and Eastern Africa (mean ±1 SD). Number of profiles onwhich this summary is presented in parentheses
Angola Botswana Kenya Mozambique Namibia Tanzania South Africa Zimbabwem
(60) (6) (11) (30) (3) (4) (39) (12)
Sand 0-0.10 93 ±3 94 ±2 87 ±7 89 ±7 94 ±2 88 ±5 91 ±8 93 ±4(%) 0.10-0.20 93 ±3 94 ±2 80 ±27 89 ±7 94 ±2 88 ±5 91 ±8 92 ±5
0.20-0.30 93 ±3 92 ±2 86 ±6 90 ±5 93 ±2 88 ±4 90 ±9 93 ±4
Clay 0-0.10 5 ±2 3 ±2 6 ±3 6 ±3 3 ±1 6 ±2 5 ±4 4 ±2(%) 0.10-0.20 5 ±2 3 ±2 6 ±3 6 ±3 3 ±1 7 ±2 5 ±3 4 ±2
0.20-0.30 6 ±3 4 ±3 6 ±4 6 ±3 4 ±1 6 ±2 5 ±4 5 ±3
BulkDensity 0-0.10 n.d. 1.65 ±0.11 1.41 ±0.30 1.47 ±0.10 n.d. n.d. n.d. n.d.(kg m-3) 0.10-0.20 n.d. 1.65 ±0.11 1.41 ±0.30 1.47 ±0.10 n.d. n.d. n.d. n.d.
0.20-0.30 n.d. 1.67 ±0.09 1.42 ±0.20 1.45 ±0.07 n.d. n.d. n.d. n.d.
n.d. = no data
58
Session 1 “Global extent of tropical sandy soils and their pedogenesis”
Table 4. Summary of soil physical properties of Arenosols in Southern and Eastern Africa (mean ±1 SD). Number of profiles onwhich this summary is based in parentheses
Angola Botswana Kenya Mozambique Namibia Tanzania South Africa Zimbabwe
m (60) (6) (11) (30) (3) (4) (39) (12)
pH water 0-0.10 5.8 ±0.7 6.6 ±1.5 6.9 ±1.3 6.0 ±0.6 7.9 ±0.4 5.4 ±0.5 7.1 ±1.1 5.2(1:2.5) 0.10-0.20 5.7 ±0.8 6.6 ±1.5 6.3 ±2.5 5.9 ±0.5 7.9 ±0.3 5.4 ±0.4 7.1 ±1.2 5.2
0.20-0.30 5.7 ±0.8 6.6 ±1.6 6.8 ±1.5 6.0 ±0.5 7.5 ±0.6 5.3 ±0.3 6.8 ±1.8 4.8
Organic C 0-0.10 6.2 ±4.2 2.9 ±1.1 3.10 ±2.29 7.0 ±4.1 2.6 ±0.7 9.23 ±8.78 3.32 ±4.60 3.58 ±0.36(g kg-1) 0.10-0.20 4.4 ±4.0 2.8 ±0.9 2.13 ±2.37 5.9 ±4.2 2.5 ±0.7 8.88 ±7.62 3.13 ±4.72 2.21 ±0.52
0.20-0.30 3.1 ±2.4 2.2 ±1.0 1.17 ±1.47 4.1 ±3.2 1.7 ±0.6 8.11 ±7.97 2.87 ±4.75 3.16 ±0.77
Total N 0-0.10 0.44 ±0.28 n.d. 0.21 ±0.27 0.67 ±0.48 0.25 ±0.01 0.60 ±0.28 n.d. n.d.(g kg-1) 0.10-0.20 0.33 ±0.26 n.d. 0.15 ±0.23 0.51 ±0.27 0.22 ±0.04 0.60 ±0.28 n.d. n.d.
0.20-0.30 0.24 ±0.18 n.d. 0.05 ±0.11 0.36 ±0.20 0.08 ±0.11 0.50 ±0.14 n.d. n.d.
CEC 0-0.10 3.4 ±1.5 3.3 ±2.0 3.8 ±2.4 4.1 ±2.9 1.5 ±1.3 5.7 ±6.2 3.0 ±2.0 1.7 ±0.8(cmol kg-1) 0.10-0.20 2.9 ±1.3 3.2 ±2.0 3.6 ±2.6 3.8 ±3.1 1.5 ±1.4 5.2 ±6.6 3.0 ±2.1 1.5 ±0.7
0.20-0.30 2.5 ±1.2 3.1 ±1.9 3.3 ±2.7 3.8 ±3.1 1.6 ±1.9 5.0 ±6.7 2.9 ±2.0 1.4 ±1.0
Base 0-0.10 40 ±30 80 ±19 91 ±49 86 ±71 100 0 25 ±15 80 ±27 80 ±22saturation 0.10-0.20 35 ±31 79 ±19 84 ±45 77 ±80 100 0 17 ±16 80 ±27 80 ±24(%) 0.20-0.30 32 ±31 75 ±25 92 ±41 68 ±81 100 0 14 ±14 96 ±48 100 ±15
ESP 0-0.10 1 ±1 1 ±2 6 ±9 2 ±4 3 ±1 2 ±2 5 ±7 5 ±8(%) 0.10-0.20 2 ±1 2 ±2 6 ±9 2 ±4 2 ±1 3 ±4 5 ±6 5 ±8
0.20-0.30 2 ±1 2 ±3 10 ±11 3 ±3 2 ±0.2 3 ±4 5 ±8 3 ±4
n.d. = no data
Figure 3. Relationships between clay content, CEC, organic C and pH in the topsoils (0-0.10 m and 0.10-0.20 m)of 166 Arenosols in Southern and Eastern Africa
0
2
4
6
8
10
12
14
16
0 5 10 15 20 25 30
Organic C content g
CEC cmol kg–10-0.10 m
0
2
4
6
8
10
12
14
16
0 5 10 15 20 25 30
Organic C content g kg–1
CEC cmol kg–10.10-0.20 m
0
2
4
6
8
10
12
14
16
4 5 6 7 8 9 10
CEC cmol kg–10-0.10 m
pH
0
2
4
6
8
10
12
14
16
4 5 6 7 8 9 10
CEC cmol kg–10.10-0.20 m
pH
0
2
4
6
8
10
12
14
16
0 3 6 9 12 15
CEC cmol kg–10-0.10 m
Clay %
0
2
4
6
8
10
12
14
16
0 3 6 9 12 15
CEC cmol kg–10.10-0.20 m
Clay %
0
3
6
9
12
15
0 3 6 9 12 15
0-0.10 m
Clay %
Organic C content g
0
3
6
9
12
15
0 3 6 9 12 15
0.10-0.20 m
Clay %
Organic C content g
–1
–1
–1
59
Session 1 “Global extent of tropical sandy soils and their pedogenesis”
In Angola, Zimbabwe and Tanzania the average topsoilpH of Arenosols is below 6 whereas in the othercountries Arenosols have mostly a topsoil pH between6 and 7. Organic C is uniformly low in Arenosols ofSouthern and Eastern Africa and rarely exceeds 10 gkg–1. Higher C contents are generally found in the soilswith higher clay content (Figure 3). Clay content in the0-0.10 and 0.10-0.20 m soil horizons correlated well(r2 >0.6) with both the CEC and the organic C contents.Higher organic C levels also increased the CECwhereas soil acidity seems to decrease the CEC inthese Arenosols. The total N content of Arenosols inSouthern and Eastern Africa is low and typically below0.7 g kg–1. The cation exchange capacity ranges fromabout 1.3 cmol kg–1 in the Arenosols of Namibia to onaverage over 5.7 cmol kg–1 in Tanzania.
Summary and conclusions
In this paper the spatial distribution of sandysoils in Southern and Eastern Africa were presentedtogether with a summary of their main soil physicaland chemical properties. Although the coverage of soilprofiles is uneven across the 9 countries it was shownthat the extent of Arenosols in Eastern and SouthernAfrica is considerable and higher than 170 million ha.The real extent is possibly larger as soils with highsandy content also occur in the reference groupsRegols, Leptosols and Fluvisols. Also, we haveselected only those SOTER units in which Arenosolswere dominant and exceeded 75%. This implies thatsome units were ommitted that contained less than75% Arenosols but also that in some SOTER units theextent of Arenosols was less than 100%.
More than 7 million ha are under cropland andobviously it requires careful management to maintainand increase crop production on such sandy soils.There has been considereable research efforts on thesustainable management of sandy soils in West Africaand in the introduction of the paper we have listedsome key references. Research efforts in Southern andEastern Africa have been less and exchange ofexperiences and research results may be beneficial forfarmers in both regions.
References
Almendros, G. et al., 2003. Biogeochemical assessment ofresilient humus formations from virgin and cultivatedNorthern Botswana soils. Journal of Agricultural &Food Chemistry, 51(15): 4321-4330.
Batjes, N.H., 2002. Revised soil parameter estimates for thesoil types of the world. Soil Use & Management,18(3): 232-235.
Batjes, N.H., 2004. SOTER-based soil parameter estimatesfor Southern Africa (Version 1.0). Report 2004/04.ISRIC – World Soil Information, Wageningen.
Burt, R., Wilson, M.A., Kanyanda, C.W., Spurway, J.K.R.and Metzler, J.D., 2001. Properties and effects ofmanagement on selected granitic soils in Zimbabwe.Geoderma, 101(3-4): 119-141.
Dijkshoorn, J., 2003. SOTER database for Southern Africa(SOTERSAF). Technical report. ISRIC, Wageningen.
Eswaran, H., Almaraz, R., Vandenberg, E. and Reich, P.,1997. An Assessment of the Soil Resources of Africain Relation to Productivity. Geoderma, 77(1): 1-18.
FAO-ISRIC, 2003. Soil and terrain database for SouthernAfrica (1:2 million scale). FAO Land and WaterDigital Series 25 (CD ROM), FAO, Rome.
FAO, 2001. Lecture notes on the major soils of the world.World Soil Resources Reports 94. FAO, Rome.
Mayaux, P. et al., 2003. EUR 20665 EN – A land-cover mapof Africa. Office for official publications of theEuropean Communities, Luxembourg.
Mokwunye, A.U., 1991. Alleviating soil fertility constraintsto increased crop production in West Africa.Developments in plant and soil sciences. KluwerAcademic, Dordrecht, vii, 244 pp.
Oldeman, L.R. and van Engelen, V.W.P., 1993. A world soilsand terrain digital database (SOTER) – an improvedassessment of land resources. Geoderma, 60(1-4):309-325.
Pieri, C., 1989. Fertilité des terres de savanes. Ministère dela Cooperation et CIRAD-IRAT, Paris.
Sanginga, N., Vanlauwe, B. and Danso, S.K.A., 1995.Management of biological N2 fixation in alleycropping systems: Estimation and contribution to Nbalance. Plant & Soil, 174(1-2): 119-141.
Soil Survey Staff, 1999. Soil Taxonomy, 2nd edition.Agriculture Handbook Number 436. USDA NationalResources Conservation Services, Washington DC.
van Engelen, V. and Hartemink, A.E., 2000. The global soilsand terrain database (SOTER). ACLEP Newsletter,9: 22-27.
van Wambeke, A., 1992. Soils of the tropics – Properties andappraisal. McGraw Hill, Inc., New York.
Vanlauwe, B., Diels, J., Sanginga, N. and Merckx, R.(Editors), 2002. Integrated plant nutrient managementin sub-Saharan Africa: From concept to practice.CABI Publishing, Wallingford.
60
Session 1 “Global extent of tropical sandy soils and their pedogenesis”
Coastal sandy soils and constraints for crops in Binh Thuan Province,Southern Central Vietnam
Nguyen Cong Vinh1
Keywords: sandy soils, Central Vietnam, nutrient limitations
Abstract
Vietnam is a humid tropical country, covered by large areas of soils of light texture classified as Acrisolsand Arenosols (marine sands). These soils are distributed in Thanh Hoa, Nghe An, Quang Binh, Thua ThienHue, Ninh Thuan, Binh Thuan, Dong Nai, Vinh Phuc, and Phu Tho Provinces. The total area of light texturedsoils is estimated to be 20,504,076 ha, of which Arenosols comprise 533,434 ha and Acrisols, 19,970,642 ha.In Binh Thuan Province in the central coastal area of Vietnam there are 12,935 ha of Arenosols and 154,210 haof Acrisols. This coastal region is characterized by very hot and dry weather, and low soil fertility, makingagricultural production problematic.
With the aim of helping farmers to get more income and developing sustainable land use practices, a fieldstudy was carried out in Bac Binh District, Binh Thuan Province from 2001-2003. Two types of sandy soilsrepresentative of the cultivated lands in the district were described and tested to identify the nutrientlimitations for crop production. Acidity, low organic matter, and multiple deficiencies of nutrient elementsfor crop growth are limiting factors for crops growing on these soils. Omission trials in the glasshouseidentified that the limitations of nutrient elements for crop growth can be ranked as follows on these sandysoils: N > P > K and B > Mo > Zn; in the white sandy soil: P > N > K and B > Mo > Zn.
Field trials demonstrated that amendments with farmyard manure (FYM), lime and phosphate wereremarkably effective in improving crop yields on these sandy coastal soils.
Introduction
Vietnam is a humid tropical country, covered bylarge areas of soils of light texture classified as Acrisolsand Arenosols (marine sands). These soils aredistributed in Thanh Hoa, Nghe An, Quang Binh, ThuaThien Hue, Ninh Thuan, Binh Thuan, Dong Nai, VinhPhuc, and Phu Tho Provinces. The total area of lighttextured soils is estimated to be 20,504,076 ha, ofwhich Arenosols comprise 533,434 ha and Acrisols,19,970,642 ha. In Binh Thuan Province in the centralcoastal area of Vietnam there are 12,935 ha ofArenosols and 154,210 ha of Acrisols. This coastalregion is characterized by very hot and dry weather,and low soil fertility, making agricultural productionproblematic.
Facilitating management practices that enablefarmers to improve soil fertility is essential for
economic development of the coastal zones. Aparticipatory study with farmers was carried out in BacBinh District, Binh Thuan Province to find out thelimiting nutrient factors and to develop appropriatestrategies for sustainable crop production. This studyaims to: evaluate the soil fertility status of the drycoastal land and to identify the main limiting factorsfor crop growth; increase farmer understanding of soilcharacteristics and fertility of their fields for bettercrops; and facilitate farmer adoption of soil ameliorationpractices and soil environmental protection.
Materials and methods
Field survey
A field survey was carried out of the agriculturalland of 4 communes (Luong Son, Song Luy, SongBinh and Binh Tan). Seventy six soil samples from14 profiles were taken for analysis. The followinganalyses were undertaken: pH (1:2.5 water), WalkleyBlack organic C, Kjeldahl total N, total P2O5 and totalK2O using a concentrated H2SO4+ HClO3 digest,
1 National Institute for Soils and Fertilizers, Tu Liem,Hanoi, Vietnam: [email protected], [email protected]
61
Session 1 “Global extent of tropical sandy soils and their pedogenesis”
available P2O5 using the Bray 2 extractant, andexchangeable Ca2+ , Mg2+ and CEC using NH4COOH,1 M, pH 7.
Omission Trials
Glasshouse trials were undertaken following theguidelines for rate trails and omission trailsrecommended in “Diagnosis of nutritional limitation toplant growth by nutrient omission pot trials” (Asherand Grundon, 1998). The methodology comprises twomain steps. The first defines suitable nutrient rates forthe crop. This is done with rate trials of nutrientsapplied at rates ranging from 0 (control) to 4 times.Results indicate the most suitable rate of appliednutrients for crop growth in each soil. The second stepin the methodology, based on the results of the firststep, comprises an omission trail for 14 nutrientelements (Table 1). This step aims to find out the mostlimiting nutrients to the growth of the plant. If anyelement omitted, while other elements are applied atthe most suitable rates, and plants grow weakly, thenthe tested element is a limiting factor for crop growth.Conversely, if any element is omitted, but plants arehealthy, then that element is not a limiting factor forcrop production. Pot trails were carried out in thegreenhouse at the National Institute for Soils andFertilizers. In this report, only the results of theomission trials are presented.
Results and discussion
Site characterization
There are 4 soil types in Bac Binh District:Arenosols (sandy coastal soil) (53,670 ha = 29.1%), riveralluvial soils (16,000 ha = 8.7%), Acrisols (21,900 ha= 11.9%) and Ferralsols (87,290 ha = 47.4%).Agricultural land comprises 38,000 ha. In general, soilsin Bac Binh are light textured in the surface, have loosestructure and non sticky plasticity. Soil is compact andhas a low water holding capacity. Water and winderosion occurs throughout the year. Climate data forthe district are as follows: mean air temperature:26-27ºC; difference between mean air temperaturesday and night: 5-7ºC; mean relative humidity: 78.9%;rainy days in year: 50-60; annual precipitation:750-1,200 mm; highest monthly rainfall (month):157 mm (July); lowest monthly rainfall (month):3.4 mm (March). The dry season lasts from October tonext April with an average rainfall of 5 mm/month,although monthly rainfall can be less than 1 mm/monthfor 3 consecutive months. In addition, during thedry season there is very strong wind, causing sandmovement.
Current farmer practice
Farmer awareness of environmental degradationand desertification is limited. Findings from a surveyof the local indigenous knowledge in Binh Thuanfound that farmers have a low understanding of soilfertility and fertilization, especially organic fertilizers.Farmyard manure (FYM) is not applied to the field butsent to others off-site. Moreover, farmers have nounderstanding of the role of phosphate fertilizer andlime, so neither of these is applied to the crop. Asa consequence, cultivated soils are very poor in organicmatter and phosphate, and are strongly acidic.
Table 1. Treatments applied in the omission trial in theglasshouse
1 All 6 All-Mg 11 All-Zn
2 All-N 7 All-S 12 All-Cu
3 All-P 8 All-Fe 13 All-Mo
4 All-K 9 All-B 14 All-Ni
5 All-Ca 10 All-Mn 15 All-Co
Nutrients were applied in solution form to thesoil in pots. Soil moisture was maintained at fieldcapacity with distilled water during 7 days aftergermination. Maize (Zea mays) seedlings were thinnedto 3 plants/pot. Distilled water was added as often asnecessary to keep the soil moisture around 80-85% offield capacity. This moisture content is considered to bethe most effective for plant growth.
Field trials on fertilization for peanut
Field trials were laid out in a completelyrandomized block design with 4 replications.Treatments are indicated in Table 2.
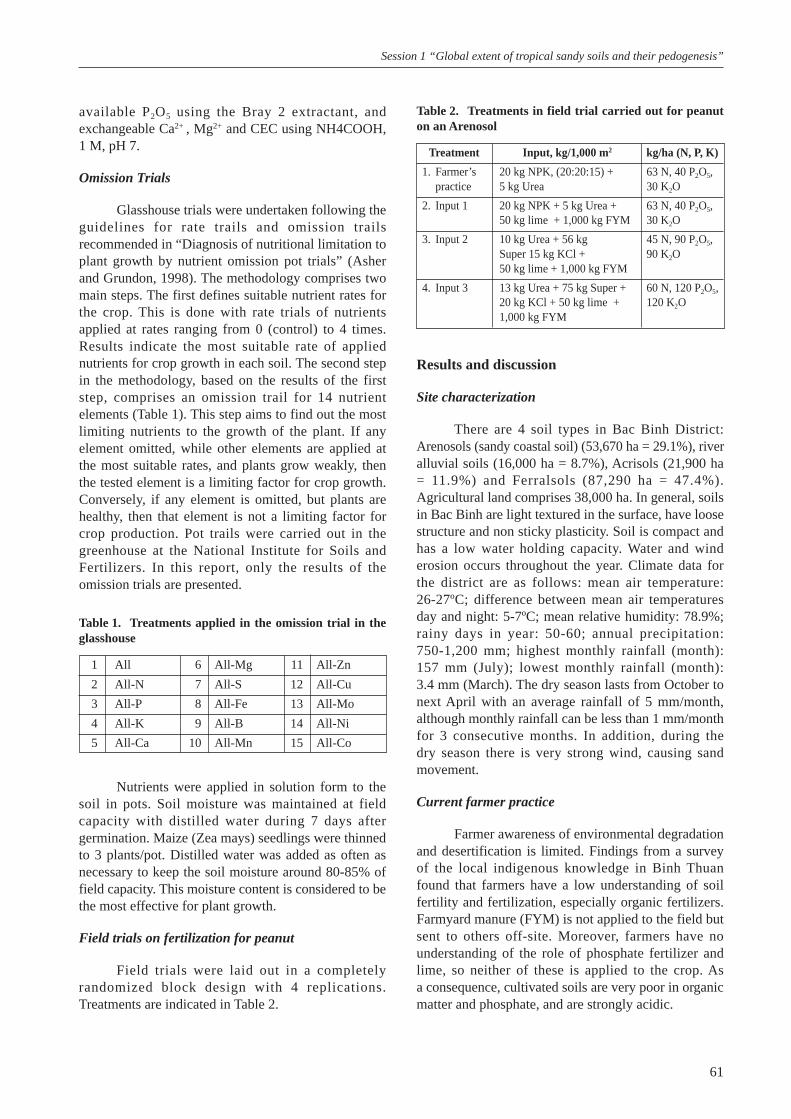
Table 2. Treatments in field trial carried out for peanuton an Arenosol
Treatment Input, kg/1,000 m2 kg/ha (N, P, K)
1. Farmer’s 20 kg NPK, (20:20:15) + 63 N, 40 P2O5,practice 5 kg Urea 30 K2O
2. Input 1 20 kg NPK + 5 kg Urea + 63 N, 40 P2O5,50 kg lime + 1,000 kg FYM 30 K2O
3. Input 2 10 kg Urea + 56 kg 45 N, 90 P2O5,Super 15 kg KCl + 90 K2O50 kg lime + 1,000 kg FYM
4. Input 3 13 kg Urea + 75 kg Super + 60 N, 120 P2O5,20 kg KCl + 50 kg lime + 120 K2O1,000 kg FYM
62
Session 1 “Global extent of tropical sandy soils and their pedogenesis”
Soil chemical characteristics
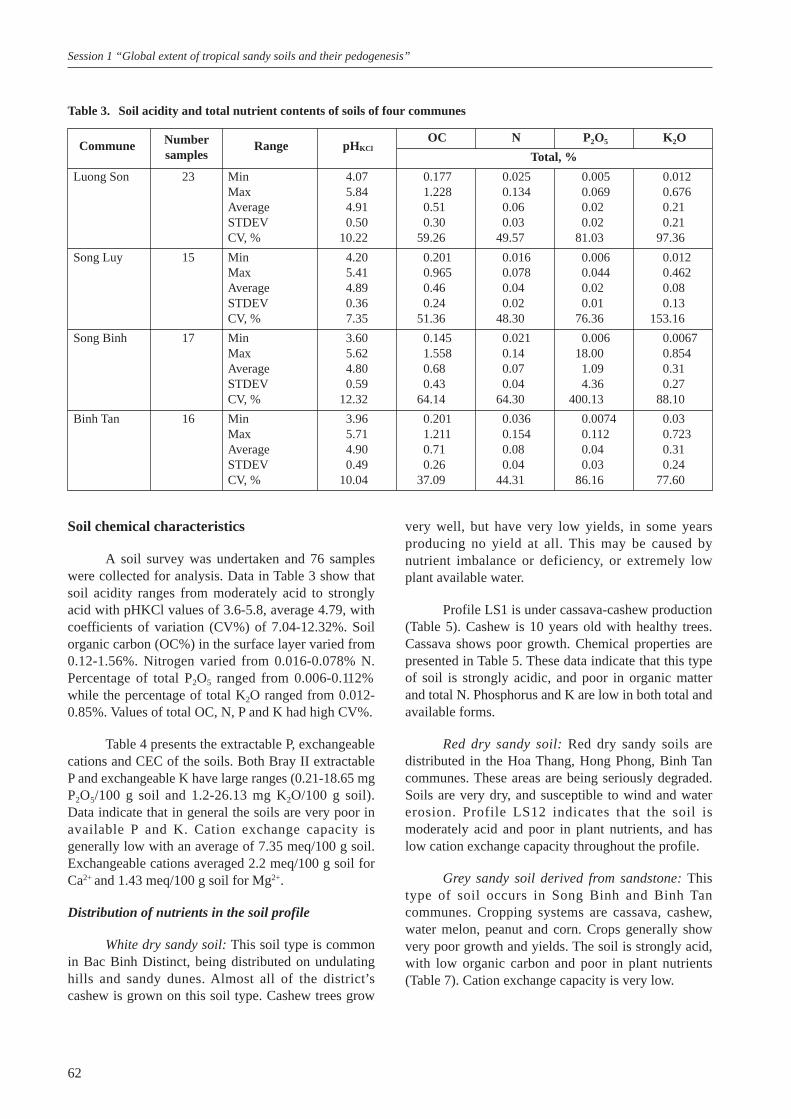
A soil survey was undertaken and 76 sampleswere collected for analysis. Data in Table 3 show thatsoil acidity ranges from moderately acid to stronglyacid with pHKCl values of 3.6-5.8, average 4.79, withcoefficients of variation (CV%) of 7.04-12.32%. Soilorganic carbon (OC%) in the surface layer varied from0.12-1.56%. Nitrogen varied from 0.016-0.078% N.Percentage of total P2O5 ranged from 0.006-0.112%while the percentage of total K2O ranged from 0.012-0.85%. Values of total OC, N, P and K had high CV%.
Table 4 presents the extractable P, exchangeablecations and CEC of the soils. Both Bray II extractableP and exchangeable K have large ranges (0.21-18.65 mgP2O5/100 g soil and 1.2-26.13 mg K2O/100 g soil).Data indicate that in general the soils are very poor inavailable P and K. Cation exchange capacity isgenerally low with an average of 7.35 meq/100 g soil.Exchangeable cations averaged 2.2 meq/100 g soil forCa2+ and 1.43 meq/100 g soil for Mg2+.
Distribution of nutrients in the soil profile
White dry sandy soil: This soil type is commonin Bac Binh Distinct, being distributed on undulatinghills and sandy dunes. Almost all of the district’scashew is grown on this soil type. Cashew trees grow
very well, but have very low yields, in some yearsproducing no yield at all. This may be caused bynutrient imbalance or deficiency, or extremely lowplant available water.
Profile LS1 is under cassava-cashew production(Table 5). Cashew is 10 years old with healthy trees.Cassava shows poor growth. Chemical properties arepresented in Table 5. These data indicate that this typeof soil is strongly acidic, and poor in organic matterand total N. Phosphorus and K are low in both total andavailable forms.
Red dry sandy soil: Red dry sandy soils aredistributed in the Hoa Thang, Hong Phong, Binh Tancommunes. These areas are being seriously degraded.Soils are very dry, and susceptible to wind and watererosion. Profile LS12 indicates that the soil ismoderately acid and poor in plant nutrients, and haslow cation exchange capacity throughout the profile.
Grey sandy soil derived from sandstone: Thistype of soil occurs in Song Binh and Binh Tancommunes. Cropping systems are cassava, cashew,water melon, peanut and corn. Crops generally showvery poor growth and yields. The soil is strongly acid,with low organic carbon and poor in plant nutrients(Table 7). Cation exchange capacity is very low.
Numbersamples
Table 3. Soil acidity and total nutrient contents of soils of four communes
Commune Range pHKClOC N P2O5 K2O
Total, %
Luong Son 23 Min 4.07 0.177 0.025 0.005 0.012Max 5.84 1.228 0.134 0.069 0.676Average 4.91 0.51 0.06 0.02 0.21STDEV 0.50 0.30 0.03 0.02 0.21CV, % 10.22 59.26 49.57 81.03 97.36
Song Luy 15 Min 4.20 0.201 0.016 0.006 0.012Max 5.41 0.965 0.078 0.044 0.462Average 4.89 0.46 0.04 0.02 0.08STDEV 0.36 0.24 0.02 0.01 0.13CV, % 7.35 51.36 48.30 76.36 153.16
Song Binh 17 Min 3.60 0.145 0.021 0.006 0.0067Max 5.62 1.558 0.14 18.00 0.854Average 4.80 0.68 0.07 1.09 0.31STDEV 0.59 0.43 0.04 4.36 0.27CV, % 12.32 64.14 64.30 400.13 88.10
Binh Tan 16 Min 3.96 0.201 0.036 0.0074 0.03Max 5.71 1.211 0.154 0.112 0.723Average 4.90 0.71 0.08 0.04 0.31STDEV 0.49 0.26 0.04 0.03 0.24CV, % 10.04 37.09 44.31 86.16 77.60

63
Session 1 “Global extent of tropical sandy soils and their pedogenesis”
Numbersamples
Table 4. Available contents of P2O5 and K2O and exchangeable cations in the soils of four communes
Commune RangeP2O5 K2O Ca2+ Mg2+ CEC
mg/100 g soil meq/100 g soil
Luong Son 23 Min 0.25 1.12 0.23 0.23 3.40Max 13.13 30.01 7.44 5.21 9.60Average 2.57 6.97 3.02 2.39 5.33STDEV 3.84 8.46 2.00 1.46 2.32CV, % 149.47 121.27 66.23 61.10 43.58
Song Luy 15 Min 0.36 1.12 0.72 0.52 2.00Max 4.88 9.03 5.58 4.09 8.00Average 1.49 3.23 2.86 2.13 4.36STDEV 1.42 2.79 1.65 1.33 2.91CV, % 95.33 86.35 57.78 62.31 66.68
Song Binh 17 Min 0.22 1.51 1.35 0.67 9.20Max 31.89 51.92 10.79 7.80 14.20Average 4.67 7.73 4.13 3.38 11.70STDEV 8.26 11.58 2.48 2.37 3.54CV, % 177.06 149.85 59.98 70.00 30.22
Binh Tan 16 Min 0.133 1.51 0.23 0.23 3.00Max 27.90 16.56 7.44 6.32 12.00Average 7.01 5.42 3.42 2.36 8.53STDEV 7.83 4.66 2.28 1.70 4.84CV, % 111.76 86.02 66.79 72.29 56.75
Table 5. Soil chemical properties of a white dry sandy soil profile (Profile LS1)
Depth, cm pHKClC N P2O5 K2O P2O5 K2O Ca2+ Mg2+ CEC
% mg/100 g meq/100 g
0-18 4.67 0.398 0.020 0.007 0.018 0.47 1.51 0.103 1.80 2.0018-30 4.60 0.402 0.020 0.017 0.018 0.52 1.12 0.74 0.58 2.0330-50 4.60 0.387 0.016 0.011 0.019 0.46 1.21 1.04 0.83
50-100 4.82 0.293 0.028 0.007 0.024 0.89 1.51 1.04 0.83
Table 6. Soil chemical properties of a dry red sandy soil profile in Hong Phong (Profile LS12)
Depth, cm pHKClC N P2O5 K2O P2O5 K2O Ca2+ Mg2+
% mg/100 g meq/100 g
0-15 5.62 0.717 0.062 0.015 0.036 1.39 4.52 1.35 0.8215-45 5.04 0.294 0.039 0.014 0.030 0.64 1.51 1.35 0.67>45 4.98 0.220 0.032 0.011 0.031 0.53 1.23 0.82 0.52
Table 7. Soil chemical properties in the profile of a grey sandy soil in Binh Tan (Profile BT5)
Depth, cm pHKClC N P2O5 K2O P2O5 K2O Ca2+ Mg2+ CEC
% mg/100 g meq/100 g
0-15 4.95 0.468 0.054 0.012 0.012 0.53 1.51 0.92 0.61 4.0015-30 4.52 0.389 0.036 0.007 0.012 0.32 1.51 1.25 0.93 –30-55 4.25 0.300 0.027 0.006 0.012 0.27 1.35 0.81 0.56 –

64
Session 1 “Global extent of tropical sandy soils and their pedogenesis”
Nutrients limiting growth in the soils in omissiontrials
Red dry sandy soils: Plant growth was markedlyhindered by omission of macroelements. Compared tothe control treatment, omission of P reduced plantheight by 53%, omission of N caused a 45% reduction,and omission of K reduced height by 36%. Plant dryweight was reduced by 18-48% when macroelementswere not added (Table 8). The lowest weight wasrecorded in Treatment 2, in which N was omitted. Thesecond greatest macroelement deficiency factor was P,followed by K.
than the control treatment when N, P, and K wereomitted (Table 9). These results show that N, P, and Kare deficient in white sandy soil.
Omission of S only reduced plant height by14%, but omission of Ca reduced height by 36% andomission of Mg caused a 41% reduction (Table 9). Dryweight was reduced 34-58% when mesoelements werenot added. The lowest weight was recorded when Mgwas omitted, followed by Ca and S. For themicronutrients, plant height and weight were greatlyreduced when Zn and B were omitted (Table 9). Plantdry weight was reduced by over 50% when either ofthese nutrients was omitted. Plant height was the sameas the control treatment when Cu and Mn wereomitted. The plant dry weights were reduced by 24%in the -Cu treatment and by 29% in the -Mn treatmentcompared to the control treatment.
Appropriate fertilization to improve soil fertility andcrop yields
A field trial on fertilization for peanut wascarried out on a white sandy soil inter-cropped undera cashew nut plantation more than 10 years old. Thisfield experimentation aims to help the farmer geta better understanding of soil fertility/fertilization andeconomic returns from intercropped annual crop withperennial crops on white sandy soils.
Field trial results are presented in Table 10.Farmer practice applied 20 kg NPK (20:20:25) and5 kg urea per sao (100 m2). Lime and organic manure
Table 8. Nutrient effects on corn growth on a red sandysoil, Hoa Thang
TreatmentPlant height Plant fresh weight Plant dry weight
cm % g/plant % g/plant %
All 54.3 100.0 23.1 100.0 3.3 100.0-N 30.0 55.2 10.1 43.7 1.7 51.5-P 25.8 47.5 13.9 60.2 2.0 60.6-K 34.8 64.1 18.1 78.4 2.7 81.8-Ca 34.8 64.1 19.6 84.8 2.9 87.9-Mg 31.5 58.0 23.9 103.5 3.1 93.9-S 46.8 86.2 20.3 87.9 3.1 93.9-Fe 49.5 91.2 18.8 81.4 2.5 75.8-Cu 53.0 97.6 22.8 98.7 2.8 84.8-Zn 41.5 76.4 16.5 71.4 2.1 63.6-B 36.3 66.9 5.1 22.1 0.9 27.3-Mo 38.8 71.5 7.3 31.6 1.0 30.3-Mn 51.0 93.9 23.2 100.4 3.3 100.0-Ni 50.5 93.0 20.8 90.0 2.9 87.9-Co 53.3 98.2 21.9 94.8 3.1 93.9
LSD, 0.05 5.3 9.4 0.78
Omission of Ca and Mg impaired corn growthmore than the omission of S. Compared to the controltreatment, omission of Ca reduced plant height by 36%and omission of Mg reduced height by 42%. Plant dryweight was reduced 6-12% when mesoelements werenot added. The lowest weight was recorded inTreatment 7, in which Ca was omitted. The next mostdeficient element was Mg, then S. In the case of themicronutrients, plant height and dry weights werelowest when B and Mo were omitted, followed by Zn.However, when Mn was omitted, plant height and dryweight were similar to the control treatment. Thisindicates that Mn may be in surplus supply in the soil.
White dry sandy soils: The effects of nutrientomission on the white sandy soil are presented inTable 9. Plant heights were 42.5 cm (77%) when N wasomitted, 44.3 cm (81%) without P, and 45.3 cm (82%)without K (Table 9). Plant weight was 50-55% less
Table 9. Nutrient effects on corn growth on white sandysoil, Hoa Thang
TreatmentPlant height Dry weight of plant
cm % g/plant %
All 55.0 100.0 3.8 100.0-N 42.5 77.3 1.9 50.0-P 44.3 80.5 1.7 44.7-K 45.3 82.4 1.8 47.4-Ca 35.5 64.5 2.4 63.2-Mg 32.5 59.1 1.6 42.1-S 47.3 86.0 2.5 65.8-Fe 48.3 87.8 3.2 84.2-Cu 56.5 102.7 2.9 76.3-Zn 39.8 72.4 1.6 42.1-B 34.3 62.4 1.8 47.4-Mo 49.0 89.1 2.3 60.5-Mn 50.5 91.8 2.7 71.1-Ni 48.5 88.2 2.0 52.6-Co 39.8 72.4 1.9 50.0
LSD, 0.05 3.67 0.23

65
Session 1 “Global extent of tropical sandy soils and their pedogenesis”
were not applied. This type of soil is acid and low inorganic matter. Peanut in farmer practice can give podyields of 2,505.6 kg/ha. At the same rate of inorganicfertilizers as farmer practice, but with liming andapplication of organic fertilizer (T2) pod yieldincreased to 2,791 kg/ha, 11.4% higher than farmerpractice.
With balanced NPK at the rates of 45 N, 90 P2O5,and 90 K2O/ha, liming and FYM (T3), pod yield ofpeanut increased to 3,812.8 kg/ha, 52.2% higher thanfarmer practice. White dry sandy soil is very poor inorganic manure, and NPK. It has low cation exchangecapacity and consequently increasing high inorganicfertilizer may not increase pod yield because of thelimited capacity of the soil to hold nutrient cations. InTreatment 4, increasing the rates of NPK up to 60 N,120 P2O5, 120 K2O/ha gave pod yield of 2,753 kg/ha,only 9.9% higher than farmer practice.
Economic effect of fertilizer for peanut
Investment in farmer fertilizer practice forpeanut production is estimated to be 3,410 thousandVND/ha (Table 11). Improved treatments increased theoutlays to 8,660-11,756 thousand VND/ha. Estimatedeconomic returns were calculated as 15,033.6 thousandVND/ha for farmer practice. However at the higherfertilizer application rates, incomes can reach 16,746thousand VND/ha in T2, 22,876 thousand VND/ha inT3 and 16,521 thousand VND/ha in T4. Improvedfertilization increased returns from 1,712.4 to 7,843.2thousand VND/ha/crop more than farmer practice(Table 11). This represents an increase in economicreturns from 11.4-52.2%, compared to farmer practice.
White sandy soil is acid and poor in organicmatter and available plant nutrients. Farmer practice iscultivation without organic manure, no liming andimbalanced low fertilization. In order to transfer thetechnologies on soil fertility and fertilization, fielddemonstrations were implemented with 4 treatments in4 farmers fields (Table 12).
Fertilizer and liming for autumn peanut on whitesandy soils increased plant growth and yieldsremarkably (Table 13). Balanced application andliming for peanut increased branches by 16%, plantheight by 29%, number of pod/plant by 67% and filledpods/plant by 111% compared to farmer practice. FYMaddition in combination with fertilizer and liming,increased branches/plant, plant height, pods/plant andfilled pods/plant over farmer practice by 32%, 49%,147% and 228% respectively.
Table 10. The effect of balanced fertilization on peanutyields (Mr. Hue’s field)
Plant height Dry pod yield Dry stem yield
cm % kg/ha % kg/ha %
T1 45.0 100.0 2,505.6 100.0 2,586.7 100.0 0.48T2 45.3 100.7 2,791.0 111.4 2,700.9 104.4 0.52T3 52.0 115.6 3,812.8 152.2 3,559.7 137.6 0.52T4 47.0 104.4 2,753.5 109.9 3,077.3 119.0 0.47
LSD, 0.46 172.5 221.40.05
Harvestindex
Treat-ment
Table 11. Economic return (thousands of VND) in peanutexperiment
Input ItemsT1 T2 T3 T4
1,000 VND/ha
NPK 1,000 1,000 0 0Urea 210 210 420 546Super 0 0 2,240 3,000KCl 0 0 570 760FYM 0 5,000 5,000 5,000Lime 0 250 250 250Variety 2,200 2,200 2,200 2,200
Total cost 3,410 8,660 10,680 11,756(C)
Benefit (B) 1,000 VND/ha
Income 15,033.6 16,746.0 22,876.8 16,521B/C ratio 4.41 1.93 2.14 1.41
Compared 1,712.4 7,843.2 1,487.4to T1
Table 12. Treatments for field demonstrations offertilization for peanut in Hoa Thang commune
TreatmentFertilizer rate (kg/ha)
FYM N P2O5 K2O Lime
1. Farmer practice 0 18.4 12.8 0 02. NPK + lime 0 36.8 75.2 60 5003. NPK + lime + 5,000 36.8 75.2 60 500
FYM
Table 13. Yield components and yields of peanut in fieldtrails (mean of 4 field demonstration trials)
Branches/Plant
Pods/Filled
Treatmentplant
height,plant
pods/(cm) plant
1. Farmer practice 19 35 30 182. NPK + lime 22 45 50 383. NPK + lime + 25 52 74 59
FYM
LSD, 0.05 1.76 8.94 12.90 12.71

66
Session 1 “Global extent of tropical sandy soils and their pedogenesis”
In the second peanut crop (next spring), furtherdemonstration trials were carried out on 10 farms.Results are shown in Table 14. Balanced fertilization(N, P, K, lime) treatments increased peanut yields by55% for stover and 66% for pod, compared to farmerpractice. Combination of NPK, lime and FYMincreased stover yield by 122%, and pod yield by149%, compared with farmer practice.
Conclusion
In general, coastal sandy soils in Bac BinhDistrict, Binh Thuan Province are strongly acid, low inorganic matter and poor in plant nutrients. Sandy landis suffering from serious wind and water soil erosion,and these are constraints for agricultural production.Pot trials indicated that the corn grown on two differentsoil types of Hoa Thang and Phan Hoa have differentresponses to the nutrient rates and elements. Omissiontrials indicated that deficiencies of nutrient elementsfor crop growth were arranged as follows:
� Red sandy soil: N > P > K and B > Mo >Zn.
� White sandy soil: P > N > K and B > Mo > Zn.
In both soils, omission of Mn increased yields.Balanced fertilizer, liming, and soil organic man-agement could increase peanut yields by 66-149%,compared with farmer practice.
Table 14. Peanut yields in participatory study in Hoa Thang. Values are means for 10 farms
TreatmentDry weight (kg/m2) Dry yields
Stem & leaves Pod Tonne/ha % Tonne/ha %
1. Farmer practice 247.5 82.5 2.48 100 0.83 1002. NPK + lime 384.5 136.9 3.85 155 1.37 1663. NPK + lime + FYM 549.5 207.2 5.49 222 2.07 249
LSD, 0.05 55.8 33.7 0.78 0.31
References
Asher, C.J. and. Grundon, N.J. 1998. Diagnosis of nutritionallimitation to plant growth by nutrient omissions pottrials.
Vinh, N.C. and Phien, T. 1997. Limiting factors on plantnutrition and fertilizer effect on plants grown on acidupland soil.
Vinh, N.C. and Trinh, M.V. 2001. Result of surveying onland use and local knowledge at Bac Binh District.Project report.
Figure 1. Bac Binh Province and project sites in the BacBinh District