soil and water conservation engineering...soil and water conservation engineering asep sapei edisi...
TRANSCRIPT

SOIL AND WATER
CONSERVATION ENGINEERING
ASEP SAPEI
FATETA – IPB
BOGOR
2006

Soil and Water Conservation Engineering Asep Sapei
Edisi 2006 i
KATA PENGANTAR
Buku ini merupakan kumpulan dari bahan transparansi kuliah Soil and
Water Conservation Engineering yang diperuntukan bagi mahasiswa/i
program studi Teknik Pertanian dan program studi lainnya yang berkaitan.
Walaupun buku ini disusun dalam bahasa Inggris, diharapkan tidak
mempersulit mahasiswa/i untuk mempelajarinya.
Tentu saja masih terdapat banyak kekurangan didalam penyusunan
buku ini. Untuk itu segala kritik dan saran akan diterima oleh penyusun
dengan tangan terbuka.
Desember 2006
Penyusun

Soil and Water Conservation Engineering Asep Sapei
Edisi 2006 ii
DAFTAR ISI
Halaman
KATA PENGANTAR i
DAFTAR ISI ii
I. INTRODUCTION 1
II. EROSION 2
III. FACTORS INFLUENCING EROSION 13
IV. PREDICTION OF EROSION RATE 24
V. MEASUREMENT OF SOIL EROSION 33
VI. CONTROL OF EROSION 38
VII. CONSERVATION STRUCTURES 62
VIII. WATER CONSERVATION 70
IX. WATER CONVEYANCE AND CANA DESIGN 81

Soil and Water Conservation Engineering Asep Sapei
Edisi 2006 1
I. INTRODUCTION
Soil and water two of natural resources Conservation of natural resources Sustainable : • Utilization without waste • To make possible a continuous high level of crop production
• Improving environmental quality Soil and Water Conservation Engineering: • Is the application of engineering and biological principles to the solution of soil and water management problem
• Is based on the full integration of engineering, atmospheric, plant and soil sciences
Problems involved in soil and water conservation, i.e: • Erosion control • Irrigation and drainage • Flood control • Water resource development and conservation This course focuses on erosion, erosion control, and soil and water conservation

Soil and Water Conservation Engineering Asep Sapei
Edisi 2006 2
II. EROSION EROSION
Is the detachment and transport of soil from the land by the action of erosive agents
EROSIVE AGENTS:
1. Water (including runoff from melted snow and ice) 2. Wind
Important erosive agent in humid area (like Malaysia) is WATER WATER EROSION
TWO MAJOR TYPES OF SOIL EROSION: (1) Natural or Geological Erosion
Under normal climate conditions, and with natural ground cover, soil erosion can often balance out with the rate of soil formation (about 1 mt/ha/year).
(2) Accelerated Erosion
Erosion can be accelerated through the activities of human beings such as: deforestation, agricultural cultivation, surface mining, structures construction etc . More population need more land for producing food, staying and other purposes (residential, industrial, commercial, recreational etc) Soil loss become 10, 20, 50, 100 times or more

Soil and Water Conservation Engineering Asep Sapei
Edisi 2006 3
Erosion losses were not serious until population multiplied and the cultivated acreage increased to meet the need for food. CONSEQUENCES OF SOIL EROSION :
1. On site : Soil deterioration reduce soil fertility - the loss of soil (topsoil) - the breakdown of soil structures - the decline in organic matter and nutrient - reduce available soil moisture and infiltration capacity
2. Off site : - sedimentation at downstream : o reduce the capacity of rivers, ditches, cannals o shortern the design life of reservoirs - sediment is also a water pollutant :
o can foul fish gills o inhibit light penetration and photosynthesis o increase costs of water treatment o detract aesthetics EROSION DISTRIBUTION 1. Spatial variation
• Annual rates of erosion (t/ha) Natural Cultivated Bare
China USA Australia Ivory coast Nigeria India Ethiopia
0.1-2 0.03-3 0-64 0.03-0.2 0.5-1 0.5-5 1-5
150-200 5-170 0.1-150 0.1-90 0.1-35 0.3-40 8-42
280-360 4-9 44-87 10-750 3-150 10-185 5-70

Soil and Water Conservation Engineering Asep Sapei
Edisi 2006 4
Belgium UK
0.1-0.5 0.1-0.5
3-30 0.1-20
7-82 10-200
• Land affected by water erosion Land area (106 ha)
Africa Asia South America Central America North America Europe Oceania World
227 441 123 46 60 114 83 1094
• Variation in suspended sediment yield

Soil and Water Conservation Engineering Asep Sapei
Edisi 2006 5
2. Temporal Variation

Soil and Water Conservation Engineering Asep Sapei
Edisi 2006 6
PROCESSES AND MECHANICS OF EROSION
Phases of Erosion
1. Particle detachment
- Soil particles are detached from the parent soil mass by the forces exerted by falling raindrops or the shear forces of runoff
- Energy available for erosion o Potential energy : PE = mhg (joules) where m : mass (kg), h : height difference (m) and g : accelerated due to gravity (m/s2)
o Kinetic energy, KE = ½ mv2 (joules) where v : velocity (m/s) Only 0.2 % of falling raindrops and 3 to 4 % of running water are expended in erosion
- The soil is also broken up by weathering processes (mechanical: wetting and drying, freezing and thawing; and biochemical), tillage operation, and trampling of people and livestock

Soil and Water Conservation Engineering Asep Sapei
Edisi 2006 7
2. Sediment transport
- Particles are moved down slope. - This down slope movement is by the splash action of falling raindrops and by the runoff itself.
- The ability of the runoff to transport the detached particles is a function of the velocity of runoff
3. Sedimentation or sediment deposition.
- Occurs when the velocity of the runoff is reduced and the load-carrying capacity decreases, causing some or all the sediment to deposit.
- Generally, the larger, heavier particles deposit first with the finer, smaller particles depositing further down slope.

Soil and Water Conservation Engineering Asep Sapei
Edisi 2006 8
Form of Erosion
The forms/types of soil erosion caused by water are:
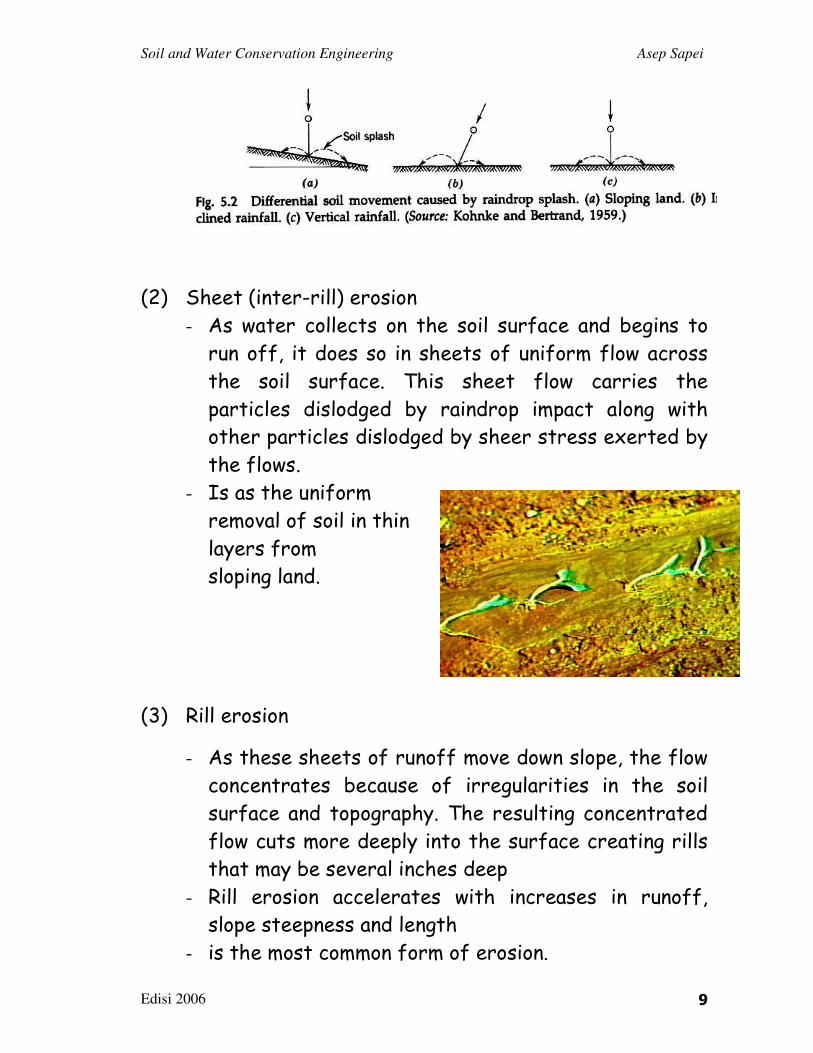
(1) Splash erosion
- Soil detachment and transport resulting from the impact of water drops directly on soil particles or on thin water surfaces
- On bare soil, it is estimated that 200 Mg/ha is splashed into the air by heavy rains
- Depends on : raindrop mass, size distribution, shape, terminal velocity and direction
Soil and Water Conservation Engineering Asep Sapei
Edisi 2006 9
(2) Sheet (inter-rill) erosion
- As water collects on the soil surface and begins to run off, it does so in sheets of uniform flow across the soil surface. This sheet flow carries the particles dislodged by raindrop impact along with other particles dislodged by sheer stress exerted by the flows.
- Is as the uniform removal of soil in thin layers from sloping land.
(3) Rill erosion
- As these sheets of runoff move down slope, the flow concentrates because of irregularities in the soil surface and topography. The resulting concentrated flow cuts more deeply into the surface creating rills that may be several inches deep
- Rill erosion accelerates with increases in runoff, slope steepness and length
- is the most common form of erosion.

Soil and Water Conservation Engineering Asep Sapei
Edisi 2006 10
- its effects can be easily removed by tillage, but most often overlooked.
- rills can often be found in between crop rows
(4) Gully erosion
- If rill development is allowed to progress, it will form very deep cuts in the soil surface and become a gully
- Because of the high velocities of flow in the gullies, massive removal of soil is possible
- Gullies may be several feet or more deep and generally cannot be repaired with simple tilling of the soil surface

Soil and Water Conservation Engineering Asep Sapei
Edisi 2006 11

Soil and Water Conservation Engineering Asep Sapei
Edisi 2006 12
(5) Stream and channel erosion
- Erosion can also occur along channel and stream banks and streambeds because of the shear forces exerted on those surfaces by flowing water
- The rate of channel erosion is related to the quantity and velocity of flow.

Soil and Water Conservation Engineering Asep Sapei
Edisi 2006 13
III. FACTOR INFLUENCING EROSION
� THE FACTOR INFLUENCING SOIL EROSION:
1. Climate 2. Soil 3. Vegetation 4. Topography
� CLIMATE
- Climate factors affecting erosion: o Rainfall o Temperature o Wind o Humidity o Solar radiation
- Soil loss is closely related to rainfall o partly through the detaching power of raindrops o partly through the contribution of rain to runoff
- Rainfall parameters related to erosion o Rainfall intensity
- the quantity of rainfall for a certain time period. i.e: mm/hr

Soil and Water Conservation Engineering Asep Sapei
Edisi 2006 14
o Rainfall duration
o Raindrop size and distribution

Soil and Water Conservation Engineering Asep Sapei
Edisi 2006 15
o Terminal velocity
- Rainfall Erosivity o Is the potential ability of rain to cause erosion o Closely related to energy of rainfall (kinetic energy) o Formulas for kinetic energy of rainfall: 1. Wischmeier and Smith (1958)
IKE log73.887.11 ++++====
KE is kinetic energy in J/m2.mm and I is rainfall intensity in mm/h
In metric unit: IKE log89210 ++++====
Where KE in ton.m/ha.cm and I in cm/h
2. Other equivalent formula : IKE log44.895.9 ++++====
3. Hudson (1965) for tropical area:
I
KE5.127
8.29 −−−−====
4. Zanchi and Torri (1980): IKE log25.1181.9 ++++====
5. Onaga, Shirai and Yoshinaga (1988)

Soil and Water Conservation Engineering Asep Sapei
Edisi 2006 16
IKE log6.1081.9 ++++====
o Wischmeier and Smith (1958) : soil loss by splash, overland flow and rill erosion is related to a compound index of kinetic energy and maximum 30-minute intensity (I30) called EI30 index
o Hudson (1965) : erosion is almost entirely caused by rain falling at intensity greater than 25 mm/h
called KE>25 index
o Lal (1976): from small plots, soil loss have high correlation with the amount of rain (A) and maximum intensity over 7.5 minute period
called AIm index

Soil and Water Conservation Engineering Asep Sapei
Edisi 2006 17
o Example:
Hudson

Soil and Water Conservation Engineering Asep Sapei
Edisi 2006 18
� SOIL
o Correspond to soil detachability and soil transportability Erodibility : the resistance of the soil to erosion
o Erodibility ↑ will suffer more erosion o Erodibility varies with :
- Soil texture - Aggregate stability - Organic matters - Shear strength - Infiltration capacity - Chemical content
o Erodibility indices

Soil and Water Conservation Engineering Asep Sapei
Edisi 2006 19

Soil and Water Conservation Engineering Asep Sapei
Edisi 2006 20
Wischmeier and Mannering (1969)
)3(103.3)2(103.4)12(108.2 3314.17 −−−−++++−−−−++++−−−−====−−−−−−−−−−−− cxbxaMxK
K : particle size parameter (% silt+% very fine sand)x(100-100% clay) a : percent organic matter
b : soil structure code (1. very fine granular; 2. fine granular; 3. medium or coarse granular; and 4. blocky, platy or massive
c : profile permeability class ( 1. rapid; 2. moderate to rapid; 3. moderate; 4. slow to moderate; 5. slow; and 6. very slow)
� VEGETATION
o Vegetation acts as a protective layer or buffer between the atmosphere and the soil
o The major effects of vegetation in reducing erosion :

Soil and Water Conservation Engineering Asep Sapei
Edisi 2006 21
- Interception of rainfall by adsorbing the energy of the raindrops canopy cover, and thus reducing surface sealing and runoff
- Retardation of erosion by decreased surface velocity
- Physical restraint of soil movement - Improvement of aggregation and porosity of the soil by roots and plant residue
- Increase biological activity in the soil - Transpiration, which decrease soil water resulting in increased storage capacity and less runoff
o Varies with: - Season - Crop - Degree of maturity of vegetation - Soil - Climates
o The mean annual soil loss was 43 t/ha for bare plot, and 3.8 t/ha for the covered plot (Zanchi, 1983)
� TOPOGRAFI
o Topographic features that influence erosion: - Degree of slope On steep slope runoff water is more erosive and can more easily transport detached sediment downslope Mc Cool et al (1987) : slope steepness factor
for slope < 4 m 56.0)(sin0.3 8.0 ++++==== θθθθS
for slope > 4 m and s < 9 % 03.0sin8.10 ++++==== θθθθS for slope > 4 m and s ≥ 9 % 50.0sin8.16 −−−−==== θθθθS where θ : field slope steepness in degrees = tan-1(s/100) s = field slope in percent
Soil and Water Conservation Engineering Asep Sapei
Edisi 2006 22
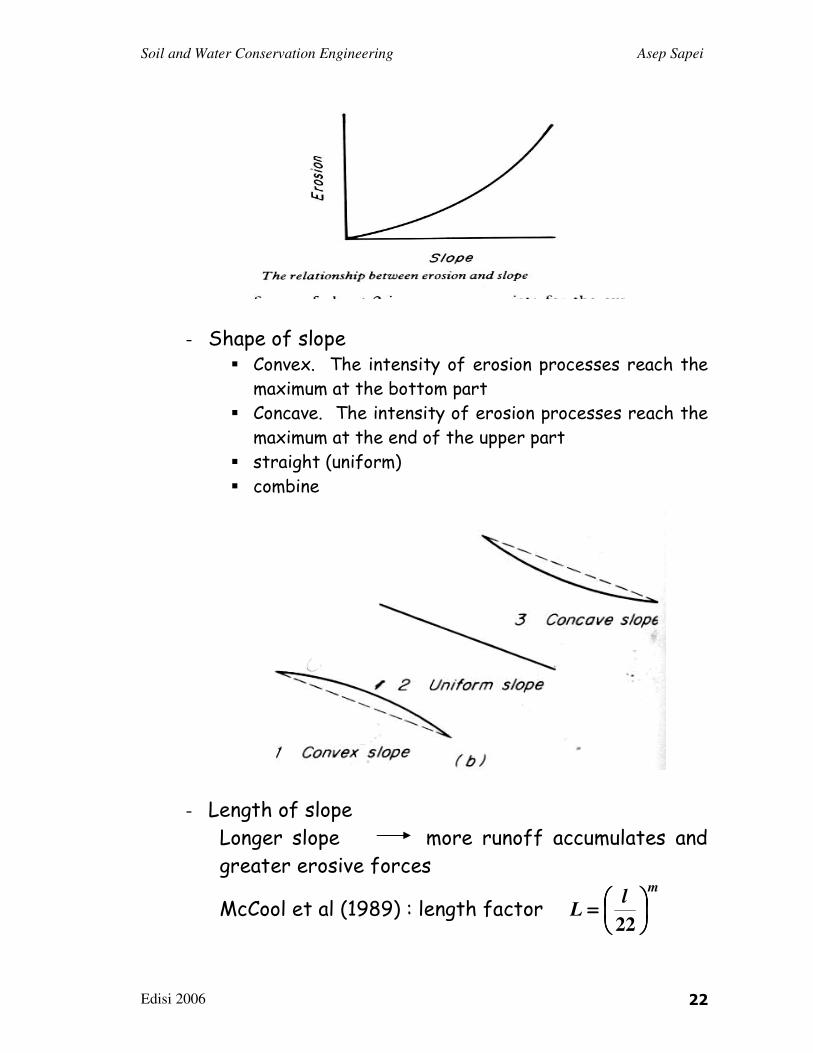
- Shape of slope � Convex. The intensity of erosion processes reach the maximum at the bottom part
� Concave. The intensity of erosion processes reach the maximum at the end of the upper part
� straight (uniform) � combine
- Length of slope Longer slope more runoff accumulates and greater erosive forces
McCool et al (1989) : length factor m
lL
====
22
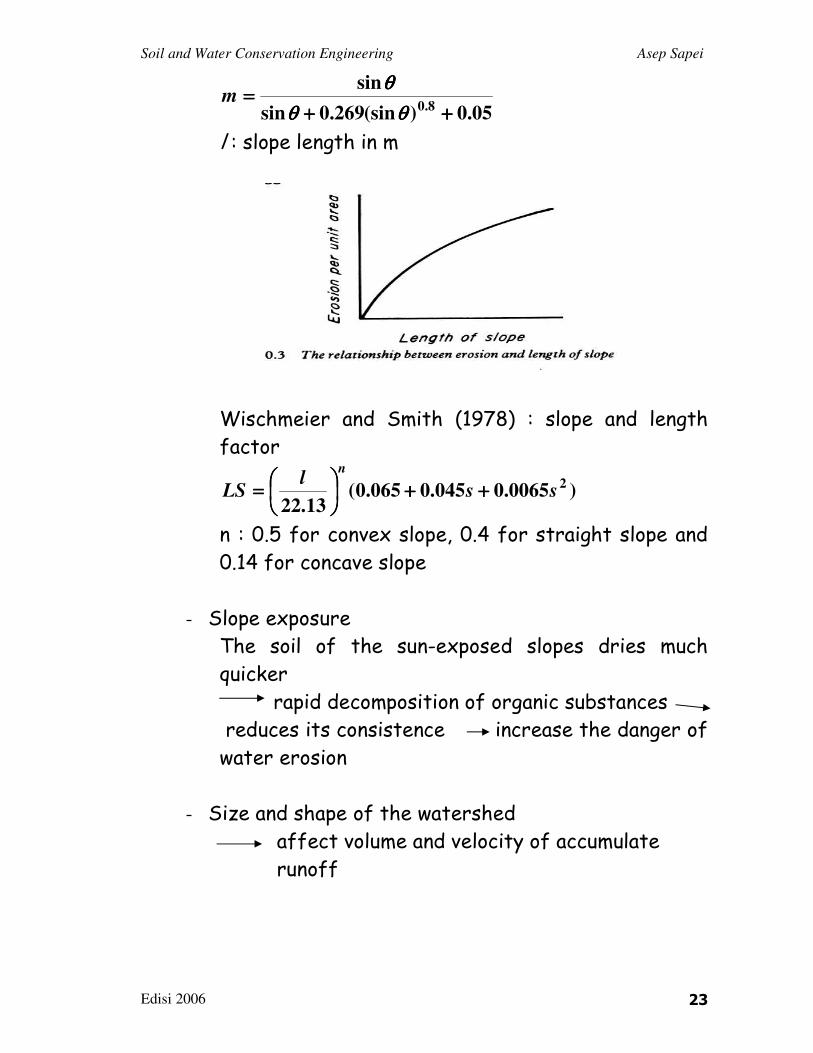
Soil and Water Conservation Engineering Asep Sapei
Edisi 2006 23
05.0)(sin269.0sin
sin8.0 ++++++++
====θθθθθθθθ
θθθθm
l : slope length in m
Wischmeier and Smith (1978) : slope and length factor
)0065.0045.0065.0(13.22
2ssl
LS
n
++++++++
====
n : 0.5 for convex slope, 0.4 for straight slope and 0.14 for concave slope
- Slope exposure The soil of the sun-exposed slopes dries much quicker rapid decomposition of organic substances reduces its consistence increase the danger of water erosion
- Size and shape of the watershed affect volume and velocity of accumulate runoff

Soil and Water Conservation Engineering Asep Sapei
Edisi 2006 24
IV. PREDICTION OF EROSION RATE
Soil Loss Equation
1. Zingg (1940) - The first soil loss equation
- For hillslopes : nmLE θθθθαααα tan
Where E : soil loss per unit area θ : the slope angle L : the slope length m and n : constants, generally m=1.4 and n=0.6
2. Universal soil loss equation, USLE (Wischmeier and Smith, 1978) - Is as widely accepted method - For estimating sediment loss from upland
- PCSLKRE .....====
E : average annual soil loss, Mg/ha In American unit, t/a R : Rainfall and runoff erosivity factor
- Unit : o American unit o Metric unit : MJ-mm/ha-h-y o Conversion: 1 metric unit = 1.73 x American unit
- Based on mean annual EI30 o If E in foot-tons/acre and I30 in in/h, R in American unit: 100/30EIR ====
o If E in J/m2 and I30 in mm/h, R in metric unit 1000/30EIR ====
- Based on mean annual precipitation o Roose (1975) : PR 5.0====
R in American units and P in mm

Soil and Water Conservation Engineering Asep Sapei
Edisi 2006 25
o Morgan (1974) : 883828.9)25( −−−−====>>>> PKE 1000/)25( 30xIKER >>>>====
KE>25 in J/m2, P in mm, I30 in mm/h an R in metric unit o Foster et al (1981) : 100/276.0 30PxIR ====
R in metric unit, P in mm and I30 in mm/h
- Based on geographic location
I30 = 75 mm/h
(max I30 recommended by
Wischmeier and Smith,
1978)
Then: 1 kJ/m2 (erosivity) =
1 kJ/m2 x 10
4 m
2/h x 1/10
3
MJ/kJ x 75 mm/h = 750 MJ-
mm/ha-h-y (erosivity index)

Soil and Water Conservation Engineering Asep Sapei
Edisi 2006 26
K : Soil erodibility index - Is as mean annual soil loss per unit of R for standard condition of bare soil, recently tilled up and down slope with no conservation practice and on a slope of 90 and 22 m length.
- Wischmeier and Mannering (1969)
)3(103.3)2(103.4)12(108.2 3314.17 −−−−++++−−−−++++−−−−====−−−−−−−−−−−− cxbxaMxK
- Nomograph
Divided values by 1.3 to obtain K values in the American unit
LS : the factor of slope length (L) and slope steepness (S)

Soil and Water Conservation Engineering Asep Sapei
Edisi 2006 27
- Expressed the ratio of soil loss under a given slope steepness and slope length to soil loss from the standard condition of a 90 slope, 22 m length, for which LS=1
- Wischmeier and Smith (1978) : slope and length factor
)0065.0045.0065.0(13.22
2ssl
LS
n
++++++++
====
n : 0.5 for convex slope, 0.4 for straight slope and 0.14 for concave slope
- Mc Cool et al (1987) : slope steepness factor
for slope < 4 m 56.0)(sin0.3 8.0 ++++==== θθθθS
for slope > 4 m and s < 9 % 03.0sin8.10 ++++==== θθθθS for slope > 4 m and s ≥ 9 % 50.0sin8.16 −−−−==== θθθθS where θ : field slope steepness in degrees = tan-1(s/100) s = field slope in percent length factor
m
lL
====
22;
05.0)(sin269.0sin
sin8.0 ++++++++
====θθθθθθθθ
θθθθm
C: The crop management factor - The ratio of soil loss under a given crop that from bare soil
- In US, depend on crop rotation and management practices. For other country, it is more appropriate to use average annual values

Soil and Water Conservation Engineering Asep Sapei
Edisi 2006 28

Soil and Water Conservation Engineering Asep Sapei
Edisi 2006 29
P: The erosion control practice factor - The ratio of soil loss where the practice is applied to the soil loss where it is not
- If no erosion control practice, P=1.0
- Also can be calculated by using :
tsc xPxPPP ==== Where P: contouring factor based on slope Pc: strip cropping factor for strip recommended
(1.0 for contouring only or alternating strips of corn and small grain; 0.75 for 4-year rotation with 2 year of row crop; and 0.50 with 1 year of row crop)
Pt : terrace sediment factor (1.0 for no terrace; 0.2 for terraces with graded channel sod outlet; and 0.1 for terraces with underground outlets)

Soil and Water Conservation Engineering Asep Sapei
Edisi 2006 30

Soil and Water Conservation Engineering Asep Sapei
Edisi 2006 31

Soil and Water Conservation Engineering Asep Sapei
Edisi 2006 32
Determine the soil loss for the following condition : location Memphis-Tennessee, K=0.01 Mg/ha-year, l=120 m, s=10 % (5.70), C=0.18 and field is to be contoured. Corn-corn-meadow rotation with good management Answer From erosivity map : R=5000
05.0)7.5(sin269.07.5sin
7.5sin
05.0)(sin269.0sin
sin8.08.0 ++++++++
====++++++++
====θθθθθθθθ
θθθθm
= 0.52
41.222
120
22
52.0
====
====
====
ml
L
17.150.07.5sin8.1650.0sin8.16 ====−−−−====−−−−==== θθθθS From table Pc=0.6, so 45.0175.06.0 ============ xxxPxPPP tsc Then: 45.018.017.141.201.05000..... xxxxxPCSLKRE ======== = 11.4 Mg/ha-year

Soil and Water Conservation Engineering Asep Sapei
Edisi 2006 33
V. MEASUREMENT OF SOIL EROSION
� Data on soil erosion and its controlling factor can be collected in the field or in the laboratory
� Field experiment :
o Results realistic and reliable data o Conditions is vary both in time and space difficult
o May classified into two groups: � Small sample area or erosion plots � Over a large area (as a drainage basin)
� Erosion plots
o Bounded plots � Employed at permanent research experimental stations
� Each plot is physically isolated piece of land of known size, slope steepness, slope length and soil type
� The standard plot: • 22 m (72.6 ft) long • 1.8 m (6 ft) wide • Area = 39.6 m2 ≈ 0.01 acre ≈ 0.004 ha
• 9 % slope • The edges should extend 15 – 20 cm above the soil surface and embedded in the soil to a sufficient depth

Soil and Water Conservation Engineering Asep Sapei
Edisi 2006 34
• At the downslope end is positioned a collecting tank for sediment and runoff
• Runoff discharge can be monitored automatically by using flume (such as H flume) completed with level recorder
Soil and Water Conservation Engineering Asep Sapei
Edisi 2006 35
� Large plot • Would contain interill areas, rills and small ephemeral channels
• Other erosion control practice may be included
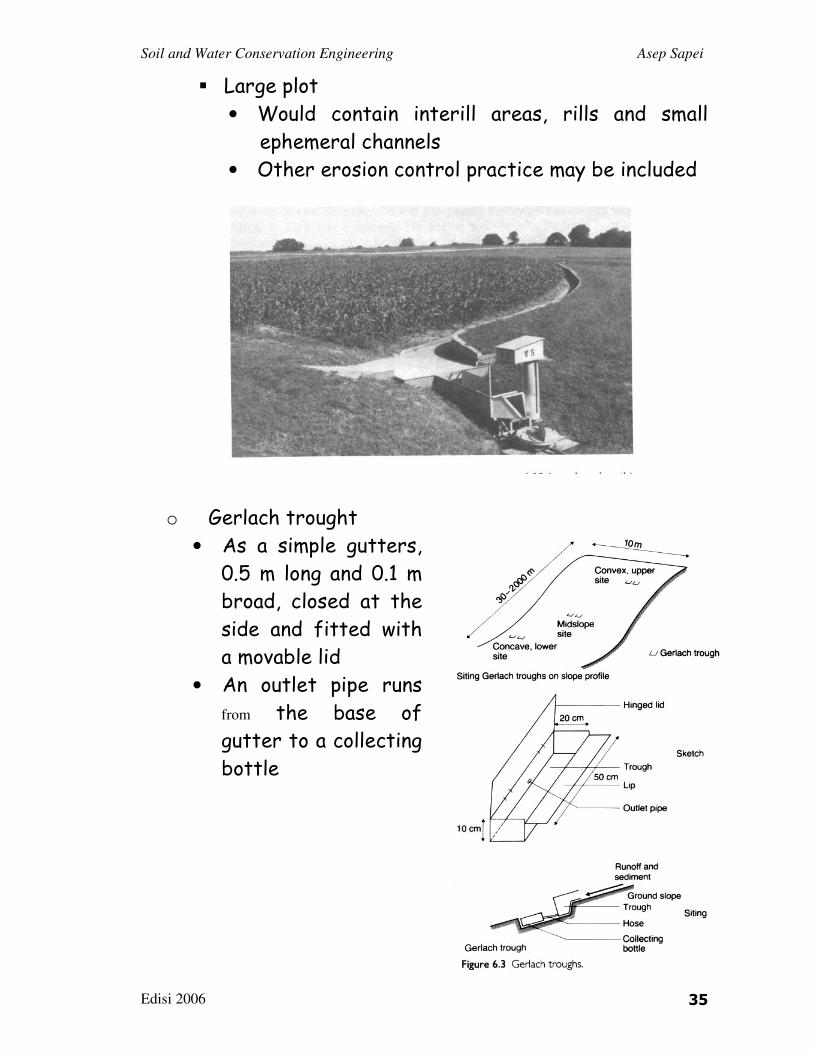
o Gerlach trought
• As a simple gutters, 0.5 m long and 0.1 m broad, closed at the side and fitted with a movable lid
• An outlet pipe runs from the base of gutter to a collecting bottle

Soil and Water Conservation Engineering Asep Sapei
Edisi 2006 36
� River basin o The rate of erosion and soil loss in the watershed upstream is determined by measuring sediment yield at the outlet of a river basin
� Rainfall simulator o Many studies use rainfall simulator which is design to produce a storm of know energy and drop size characteristic can be repeated on demand
o Rainfall classification: base on the drop former use � Tubing tips � Nozles

Soil and Water Conservation Engineering Asep Sapei
Edisi 2006 37
� Laboratory experiment Conducted as follows:
� Filling container with soil � Weighing them dry � Subjecting them to a simulated rain storm of preselected intensity (rainfall simulator)
� Measuring the weight loss from the containers on dryng
Soil and Water Conservation Engineering Asep Sapei
Edisi 2006 38
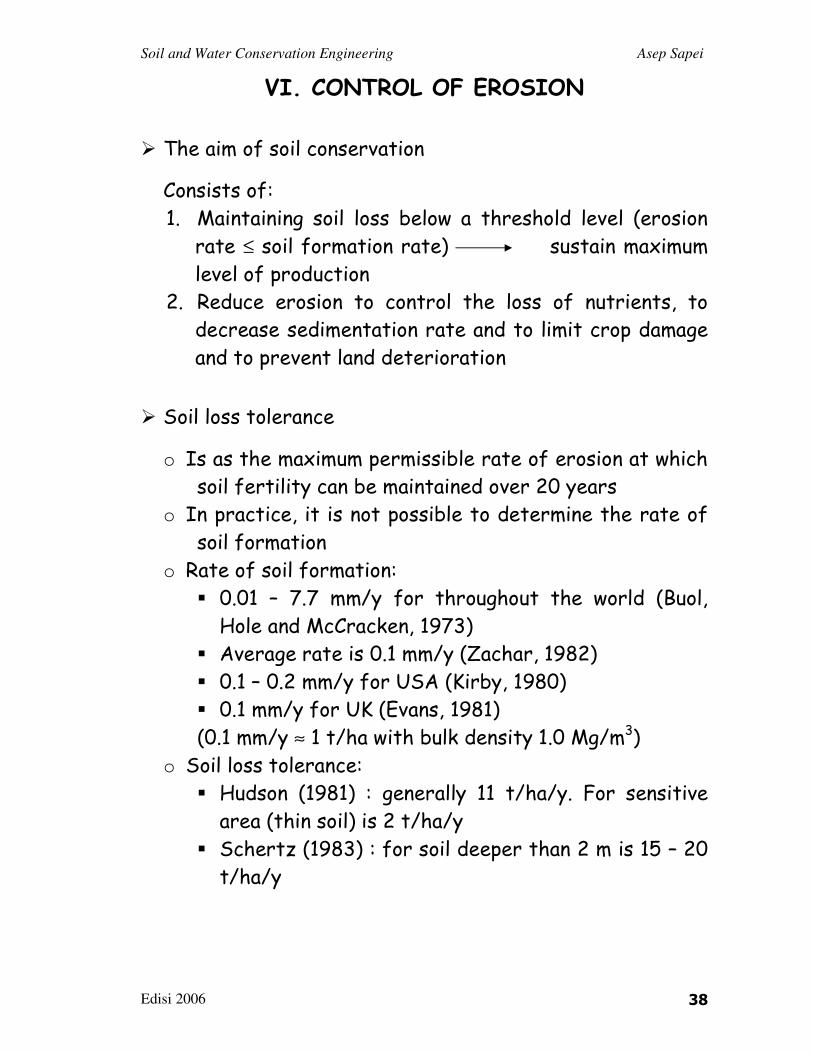
VI. CONTROL OF EROSION
� The aim of soil conservation
Consists of: 1. Maintaining soil loss below a threshold level (erosion rate ≤ soil formation rate) sustain maximum level of production
2. Reduce erosion to control the loss of nutrients, to decrease sedimentation rate and to limit crop damage and to prevent land deterioration
� Soil loss tolerance
o Is as the maximum permissible rate of erosion at which soil fertility can be maintained over 20 years
o In practice, it is not possible to determine the rate of soil formation
o Rate of soil formation: � 0.01 – 7.7 mm/y for throughout the world (Buol, Hole and McCracken, 1973)
� Average rate is 0.1 mm/y (Zachar, 1982) � 0.1 – 0.2 mm/y for USA (Kirby, 1980) � 0.1 mm/y for UK (Evans, 1981) (0.1 mm/y ≈ 1 t/ha with bulk density 1.0 Mg/m3)
o Soil loss tolerance: � Hudson (1981) : generally 11 t/ha/y. For sensitive area (thin soil) is 2 t/ha/y
� Schertz (1983) : for soil deeper than 2 m is 15 – 20 t/ha/y

Soil and Water Conservation Engineering Asep Sapei
Edisi 2006 39
� Principle of soil conservation
o Protecting the soil from raindrop impact o Increasing the infiltration capacity of the soil to reduce runoff
o Improving aggregate stability of the soil to reduce soil detachment
o Increasing surface roughness to reduce the runoff velocity
� Soil conservation method
o Agronomic measures. It utilize the role of vegetation to protect the soil against erosion
o Soil management. It is concerned with ways of preparing the soil to promote plant growth and improve its structure so that it is more resistant to erosion
o Mechanical or Physical method. Involving engineering structures, depend upon manipulating the surface topography

Soil and Water Conservation Engineering Asep Sapei
Edisi 2006 40
� Approach to soil conservation
o Cultivated land Relies strongly on agronomic methods combined with sound soil management, whilst mechanical measures play only a supporting role
o Non cultivated land Consist of pasture land, forest and rough land
o Urban area

Soil and Water Conservation Engineering Asep Sapei
Edisi 2006 41

Soil and Water Conservation Engineering Asep Sapei
Edisi 2006 42
CROP AND VEGETATION MANAGEMENT � Use the protective effect of plant covers and plant residue (mulch) to reduce erosion
� Depends on: o Type of plant o Plant density o Planting pattern
� Management methods: o Rotation
� Crop rotation: to plant different crops on the same field consecutively in rotation
� Main crop – rotation crop – main crop – rotation crop
� Suitable crops for use in rotations are: - Legumes and grass (good ground cover, improve organic matter) reduce erosion and increase fertility
- Crops that have ability to reduce soil loss such as cowpeas, soya beans, etc
� Hudson (1981) tobacco-grass-tobacco-grass-grass is more effective than tobacco-tobacco-grass-grass-grass
� Location rotation shifting cultivation Can be practiced at low ratio of population and land area
o Cover crops

Soil and Water Conservation Engineering Asep Sapei
Edisi 2006 43
� Cover crops are grown as a conservation measure either during the off season or as ground protection under trees - It reduce erosion to less than 0.05 t/ha/y (Maene et al., 1979)
- Permanent grass cover in vine yard reduce erosion to less than 7 % of that in vine yard with bare soil (Gril et al., 1989)
� Good cover crops: - Quick to establish - Provide an early canopy cover - Aggressive enough to suppress weeds - Posses a deep-root system to improve macroporosity
� Disadvantage of cover crops: - A satisfactory cover will not be attained - Need cost which may outweigh the benefits - Compete for available moisture. It reduce the available water in the top of 40 cm of top soil in the summer (Husse, 1991)
� Coomons cover crops : Pueraria phaseoloides, Calapogonium mucunoides, Centrosema pubescens and grass
� Grass commonly planted : axonopus compressus, digitaria didactyla, cynodon dactylon (Bermuda grass), zoysia japonica, etc.
o Strip cropping
� Is the practice of growing alternate strips of different crops in the same field
� For controlling water erosion, the strips are on the contour Strip cropping of maize with soybean on 20 slope gave an annual soil loss of 9.5 t/ha compare with 15.7 t/ha for maize alone (Singh et al., 1979)

Soil and Water Conservation Engineering Asep Sapei
Edisi 2006 44
� Rotations that provide strips of close growing perennial grasses and legumes alternating with grain and row crops
� Three general types of strip cropping: a. Contour strip cropping. Lay out and tillage are held closely to the contour and the crops follow a definite rotational sequence
b. Field strip cropping. Strip of uniform width are place across the general slope
c. Buffer strip cropping. It has strips of a grass or legume crop between contour strips of crops in the regular rotations

Soil and Water Conservation Engineering Asep Sapei
Edisi 2006 45
� Recommended strip widths 2 – 5 % slope 30 m 6 – 9 % slope 25 m 10 – 14 % slope 20 m 15 – 20 % slope 15 m
o Multiple cropping
� Involves either sequential cropping, growing two or more crops a year in sequence (intercropping) and growing two or more crops on the same piece of land at the same time multi-storey canopy
� Mixed maize-cassava reduced annual soil loss to 86 t/ha compare with 125 t/ha for cassava as a monoculture (Lal, 1977)

Soil and Water Conservation Engineering Asep Sapei
Edisi 2006 46
o High density planting
� Increase canopy coverage � Increasing density of maize from 25,000 to 37,000 plants/ha, reduced the annual soil loss from 12.3 to 0.7 t/ha (Mohammad and Gumbs, 1982)
o Mulching
� Is the covering of the soil with crop residues, such as straw, maize stalks, palm fronds or standing stubble
� Mulch application: • Spreading crop residues on the surface of the soil
• Incorporate the mulch in the soil � A mulch should cover 70 – 75 % of the soil surface � Lalang grass at a rate 3 t/ha to maize grown reduced soil loss between October 1978 – July 1979 to 0.5 t/ha

Soil and Water Conservation Engineering Asep Sapei
Edisi 2006 47
compare to 7.5 t/ha without mulch (Mokhtaruddin and Maene, 1979) Annual soil loss was 24.6 t/ha from uncultivated bare land, but only 1.1 t/ha from land covered with straw mulch applied 5 t/ha (Woodburn, 1942)
� The relationship between Manning’s n and mulch rate (kg/m2) for maize straw (Foster et al., 1982) :
nm = 0.071M1.12 for interrill erosion
nm = 0.105M0.84 for rill erosion
� Disadvantage: • Tillage tools become clogged with the residue • Weed and pest control become difficult • Planting under residue is not always successful

Soil and Water Conservation Engineering Asep Sapei
Edisi 2006 48
SOIL MANAGEMENT
� The aim : to maintained the fertility and structure of the soil
� High fertility soil: o Produce high yield o Good plant cover o Have stable structure o High infiltration capacity As the key top soil conservation
� Management methods: o Organic Matter
� Effects: - Improves the coheviness of the soil - Increase water retention capacity - Promote a stable aggregate structure
� Types of organic matter: - As green manure. They are usually leguminous crops ploughed in, have a high rate of fermentation
- As straw. Take time to decompose. Have longer effect
- As a manure which has already undergone a high degree of fermentation
� Bonsu (1985) : combination of cow dung at 5 t/ha and wheat straw mulch at 4 t/ha gave lowest soil loss and highest yield compare to other practices in Ghana
o Tillage practice � Its provides a suitable seed bed for plant growth and helps to control weeds

Soil and Water Conservation Engineering Asep Sapei
Edisi 2006 49
� Tillage tools pulled by the tractor are design to apply an upward force to cut and loosen the compacted soil, to invert it and to smooth and shape the surface
increase roughness � Soil loss (SL) and roughness (R) relationship:
ReSL
5.0
−−−−αααα � The effect of tillage on erosion depends on: surface residue, aggregation, surface sealing, infiltration and water movement
� Tillage practice used for soil conservation
o Soil Stabilizers � To improve soil structure � Soil stabilizers:

Soil and Water Conservation Engineering Asep Sapei
Edisi 2006 50
- Organic by-products. They bind soil particles into aggregate
- Polyvalent slats. � Such as gypsum � They make clay particle to flocculate
- Various synthetic polymers. They bind soil particles into aggregate
� Soil stabilizer groups: - Hydrophobic. � Base on bitumen � Such as propylene oxide � Decrease infiltration and increase runoff � Effective for only short time
- Hydrophyllic � Increase infiltration and decrease runoff � Such as polyacrylamide, ethylene oxide
CONTOURING
� This practice is performing of field operations, such as plowing, planting, cultivating and harvesting, approximately on the contour
� The effectiveness varies with the length and steepness of the slope
� Only effective during storm of low rainfall intensity � It reduces runoff by impounding water in small depressions and the development of rills. But depression storage is reduced after consolidation take placed
� Harrold (1947) : contour cultivation together with good waterways reduce watershed runoff by 75 to 80 % at the

Soil and Water Conservation Engineering Asep Sapei
Edisi 2006 51
beginning season, and dropped to as low as 20 % at the end of the year
� In a field with nonuniform slopes, all crops cannot be on the true contour
� To establishes row directions, a guideline (true contour) is laid out at one or more elevation in the field
Contour Bunds
� Contour bunds are earth banks, 1.5 to 2 m wide, thrown across the slope: o to act as a barrier to runoff o to form a water storage area on their upslope side, and
o to break up a slope into segments shorter in length than is required to generate overland flow
� Suitable for slope of 1 to 7 o � The bank spaced at 10 to 20 m intervals � The effectiveness of contour bunds
� As an alternative technique:
� Contour stone bunds

Soil and Water Conservation Engineering Asep Sapei
Edisi 2006 52
o Small stone structures o 25 – 30 cm high o Set in a shallow trench
� Permeable rock dams o Long low structures o Over 100 m in length o 50 – 70 cm in high o Made from stones laid across valley floors

Soil and Water Conservation Engineering Asep Sapei
Edisi 2006 53
TERRACING � Terracing is a method of erosion control accomplished by constructing earth embankments and or channel across the slope
� Terrace function: a. To intercept surface runoff and convey it to a stable outlet at a non-erosive velocity b. To shorten slope length
� Terrace classification a. Construction method :
- Mangum terrace - Nichols terrace
b. Width : - Broad-base terrace - Narrow-base terrace
c. Shape : - Broad-base :Three segment section broad-base and conservation bench broad-base

Soil and Water Conservation Engineering Asep Sapei
Edisi 2006 54
- Bench
d. Alignment - Non-parallel. They follow the contour regardless of alignment
- Parallel e. Grade
- Graded or channel terrace. They are designed to removed excess water in such way as to minimized erosion
- Level terrace. They are constructed to conserved water and control erosion
f. Outlet - Blocked outlets. All water infiltrates the terrace channel - Permanently vegetated outlets (Grassed waterway or a vegetated area)
- Underground outlets. Water is removed through subsurface drains

Soil and Water Conservation Engineering Asep Sapei
Edisi 2006 55
� Type of bench terraces
If the soil is to shallow, or the land slope too step, where bench terracing may not be practical Intermittent terrace (small level or reverse slope terrace each carrying one line of trees)

Soil and Water Conservation Engineering Asep Sapei
Edisi 2006 56
� Terrace system o should be coordinated with the water management system for the farm, giving adequate consideration for proper land use
o should be planned by watershed area and should include all terrace that may be constructed later
� Terrace design It involves: a. specifying the proper spacing b. location of terrace

Soil and Water Conservation Engineering Asep Sapei
Edisi 2006 57
c. channel with adequate capacity d. development of a farmable cross section
a. Terrace spacing - Spacing is express as the vertical distance between the channels of successive terraces.
- Commonly known as vertical interval (VI) - The horizontal interval (HI) is found by dividing VI by the slope (m/m).
- HI for parallel terrace is usually selected as even number of rounds for row crop equipment
- Empirical formula 1. USSCS : VI (m) = aS + b A varies from 0.12 in the south of US to 0.24 in the north. b varies between 0.3 and 1.2 according to the erodibility of the soil. S is the average land slope in %
2. Zimbabwe : VI (ft) = (S + f)/2 F varies from 3 to 6 according to the erodibility of soil
3. Algeria : VI (m) = S/10 + 2 4. Israel : VI (m) = XS + Y X varies from 0.25 to 0.3 according to rainfall. Y is 1.5 or 2.0 according to the erodibility
5. Kenya : VI (m) = (0.3(S+2))/4 6. New Soth Wales : HI (m) = KS -0.5 K varies from 1.0 to 1.4 according to the erodibility
- Theoretical approach Where soil loss data are available, spacing should be base on slope lengths using contouring and the appropriate cover management factor
PCSLKRE .....==== L=E/(RKSCP) calculate l calculate VI (VI=slope in percentxl)

Soil and Water Conservation Engineering Asep Sapei
Edisi 2006 58
b. Terrace location - Factors that influence terrace location:
o Outlet o Land slope o Soil condition o Proposed land use o Boulders, trees, gullies and other impediments o Farm roads o Fences o Row layout o Type of terrace
- General rules for the location of top terrace o The drainage area above the top terrace should not exceed 1 ha
o If the top of the hill comes to a point, the spacing may increase to 1.5 the regular spacing
o On long ridges, where the terrace approximately parallel the ridge, the regular spacing should be specified
o If short, abrupt changes in slope occur, the terrace should be placed just above the break
- Typical layout

Soil and Water Conservation Engineering Asep Sapei
Edisi 2006 59
c. Terrace grades
- The gradient of the channel must be sufficient to provide adequate drainage, while removing the runoff at non-erosive velocity
- May range from 0.1 to 0.6 % depending on soil and climate
- ASAE (1989) recommends maximum velocity of 0.5 m/s for extremely erosive soils and 0.6 m/s for other soils
d. Terrace Length
- Depends on: o Size and shape of field o Outlet possibility o Rate of runoff o Channel capacity
- Extremely long graded terraces are to be avoided. Generally between 300 – 500 m.
- There is no maximum length for level terraces, particularly where blocks or dams are placed in the channel every 150 m

Soil and Water Conservation Engineering Asep Sapei
Edisi 2006 60
e. Terrace cross section
- Should : o Provide adequate capacity o Have broad farmable side slope o Be economical to construct
- Design criteria: o The front slope width, Wf is specified to be equal to the machinery width
o The depth of flow is determined from the runoff rate for 10 year return period storm or for the required runoff volume for storage type terrace
o When Wc=Wf=Wb=W, then sWhfc ++++====++++ .
For balanced cross section, c = f o The terrace is generally constructed with a 5:1 backslope and planted with grass
o For practical reasons, terrace cross section is uniform
Example: For a channel depth h of 0.33 m and for eigh-row equipment 6 m wide on 7 % land slope, compute the cut and fill heights and the frontslope and the backslope assuming a balanced cross section c = f = (h+sW)/2 = (0.33+0.07x6)/2 = 0.38 m front slope : Sf = W/h = 6/0.33 = 18.2 18 : 1 slope ratio backslope or cutslope : Sb = W/(h+sW) = 6/(0.33+0.07x6) = 8.0 8 : 1 slope ratio

Soil and Water Conservation Engineering Asep Sapei
Edisi 2006 61
f. Terrace channel capacity
- The channel will carry the design runoff. - Recommended roughness coefficient is 0.06 and maximum velocity is 0.6 m/s
- Freeboard about 20 % of the total depth after allowing for settlement of the fill
g. Construction equipment
- Small equipment : moldboard and disk plows for slope less than 8 %.
- Heavy equipment : bulldozer, pan or elevating scraper, motor patrol or blade grader
h. Settlement of terrace ridge
- Depends on: o soil and water conditions o type of equipment o construction procedure o amount of vegetation and crop residue
- The percentage of settlement: o 10 – 20 % if use moldboard plow or bulldozer o 10 – 25 % if use elevating grader o 0 – 5 % if use blade grader

Soil and Water Conservation Engineering Asep Sapei
Edisi 2006 62
VII. CONSERVATION STRUCTURE � Stabilization structure for gully control
o Temporary structures � It is needed if the establishment of vegetation is difficult
� Usually as small dams - 0.4 to 2.0 m height - Made from locally materials such as earth, wooden planks, brushwood, bricks or loose rock
- Are built across gullies to trap sediment and thereby reduce channel depth and slope
- They must be quick and easy to construct
- The spacing of dams (Heede, 1976)
θθθθθθθθ costanK
HEspacing ====

Soil and Water Conservation Engineering Asep Sapei
Edisi 2006 63
HE : dam height (from the gully floor to the crest of spillway), θ : slope angle, K : constant (K=0.3 for tanθ ≤ 0.2, K = 0.5 for tan θ > 0.2)
- An effective composition of rock fill dam: 25 % between 100 – 140 mm, 20 % between 150 – 190 mm, 25 % between 200 – 300 mm and 30 % between 310 – 450 mm (Heede, 1976)
o Permanent structure � Are required on large gullies to control the overall of water on the headwall (dam), such as: - Silt trap dam. Excessive sediment load will be trapped in this dam type
- Regulating dams. Completed with permanently open pipe outlet that allows the water to drain away
- Gully head dams. To control the erosive force of the runoff over the gully head by submerging the head of gully
� Are design to deal safely with the peak runoff of 10 years return period
� Completed with energy dissipation to protect both the structure and the channel downstream - For structure < 3 m height, completed with a drop spillway
- For structure 3 – 6 m, completed with a chute or pipe spillway

Soil and Water Conservation Engineering Asep Sapei
Edisi 2006 64
� Stabilization structure to control erosion on steep slope
o Brush matting - For a short period - Live willow stakes are driven into the soil to a depth of 200 mm
- The stakes are placed 1 m apart to form a row along the contour with a distance of 10 – 20 m
- Sprouting brushwood is spread over the top of the slope, and tied to the stakes with galvanized wire
o Wattling - Placing fascines or bundles of woody plant stems (salix, Leucaena, Baccharis and Tamarix) in shallow trenches on the contour
- Row spaced 1 – 6 m - The wattling is tied to stakes on downslope side
o Permanent protection can be achieve by facing them with a resistant material such as concrete or gabion (these are rectangular steel wire mesh baskets, packed tightly with stones 125 – 200 mm in diameter)

Soil and Water Conservation Engineering Asep Sapei
Edisi 2006 65
� Stabilization structures to control channels
o Function : to dissipate kinetic energy of the discharge to a degree that will protect both the structure and the downstream channel from damage or erosion
o Types of structures: a. Drop spillway
- Scheme
- It control the stream grade not only at the spillway crest itself, but also through the ponded reach upstream
- It placed at intervals along channel a continuous steep channel a series of more gently slope
- Limited up to 3 m drop
- Capacity : 2/355.0 CLhq ====

Soil and Water Conservation Engineering Asep Sapei
Edisi 2006 66
q : discharge, m3/s C : coefficient, recommended C = 3.2 L : weir length, m h : depth of flow over crest, m
- The kinetic energy must be dissipated or converted to potential energy before the flow is discharging the structure use stilling basin as apron protection
b. Chute spillway
- Scheme

Soil and Water Conservation Engineering Asep Sapei
Edisi 2006 67
- It is design to carry flow down steep slope through a lined channel
- For controlling elevation changes up to 6 m - Capacity is controlled by the inlet section and similar with drop spillway
- Outlet protection: straight apron or Saint Anthony falls (SAF) stilling basin
c. Drop inlet - Scheme
- This application is usually made where water may pond behind the inlet
- Possible conditions

Soil and Water Conservation Engineering Asep Sapei
Edisi 2006 68
- The neutral slope
gVKLHS cfn 2//sintan 2================ θθθθθθθθ
Kc : friction loss coefficient Hf : friction loss in conduit length L : length of conduit θ : slope angle of conduit
- Capacity for full pipe flow : KcLKbKe
gHAq
++++++++++++====
1
2
A : conduit cross sectional area Ke : entrance loss coefficient Kb : loss coefficient for bends
- Capacity for the conduit at greater than neutral slope and the outlet is not submerged :
ghACq 2====
C : coefficient = 0.6 for sharp edged orifice

Soil and Water Conservation Engineering Asep Sapei
Edisi 2006 69
o Example of the application

Soil and Water Conservation Engineering Asep Sapei
Edisi 2006 70
VIII. WATER CONSERVATION -PONDS, RESERVOIRS AND EARTH EMBANKMENTS-
PONDS AND RESERVOIRS
� Meaning
o As a structure for collecting and keeping excessive water
o Ponds have size usually smaller than reservoir � Types of ponds and reservoir
o Dugout reservoir - Fed by ground water - Limited to area having slopes < 4 % and water table depth within 1 m depth
o On-stream reservoir - Fed by surface runoff, stream or spring - Might be as :
• An excavated basin below a spring • A reservoir formed by a dam across a stream valley or depression below spring
o Off-stream reservoir - It is constructed adjacent to a continuously flowing stream
� Ponds and reservoirs site selection
General rule for choice of reservoir sites: � A suitable dam site must exist. The cost of dam is often controlling factor

Soil and Water Conservation Engineering Asep Sapei
Edisi 2006 71
� The cost of real estate for the reservoir (road, railroad, dwelling location, etc.) must not be excessive
� Must have adequate capacity � A deep reservoir is preferable than a shallow one � Tributary area that are unusually productive of sediment should be avoided
� The quality of the stored water must be satisfactory
� No or less environmental impact � Water may be use with a minimum of pumping and piping
� Storage capacity of reservoir
- Capacity of reservoir on natural sites must usually determined from topographic survey
- The increment of storage between two elevation is
computed by : ZAAVolume ∆∆∆∆++++==== )(2
121

Soil and Water Conservation Engineering Asep Sapei
Edisi 2006 72
� Zones of storage in a reservoir
� Water storage requirement
Depend on : o Water needs (domestic uses, livestock, spraying, irrigation and fire protection)
o Evaporation from the water surface o Seepage into the soil through the dam o Storage allowed for sedimentation o Amount of carry-over from one year to the next

Soil and Water Conservation Engineering Asep Sapei
Edisi 2006 73
� Selection of capacity for a river reservoir
o May be performed with annual, monthly or daily time interval. Monthly data are most commonly used
o Methods: � Sequent peak algorithm
- Calculate the cumulative sum of inflow minus withdrawals (including average evaporation and seepage)
- Identify the first peak and the sequent peak (next following peak that is greater than the first
- The required storage for the interval is the difference between initial peak and the lowest through in the interval

Soil and Water Conservation Engineering Asep Sapei
Edisi 2006 74
� Mass curve (Rippl diagram) - Plot the cumulative net reservoir inflow. The slope of the mass curve at any time is a measure of the inflow at that time
- Demands curve representing a uniform rate of demand are straight lines
- Draw tangent lines parallel to the demand curve at the high points of the mass curve (at A , B) represent rate of withdrawal
- The maximum departure between the demand line and the mass curve represents the reservoir capacity required to satisfy the demand
Soil and Water Conservation Engineering Asep Sapei
Edisi 2006 75
� Reservoir sedimentation
o The ultimate destiny of all reservoir is to be filled with sediment
o Important data : � specific weight of the settled sediments
)log(100
%
)log(100
%)log(
100
%
33
2211
TBWclay
TBWsilt
TBWsand
W
++++++++
++++++++++++====
W: the specific weight (dry) of a deposit with an age of T years The percent of sand, silt and clay is on weight basis W1,W2 and W3 : represent the specific weight of sand, silt and clay B1,B2 and B3 : constants

Soil and Water Conservation Engineering Asep Sapei
Edisi 2006 76
o the percentage of entering sediment that is deposited in the reservoir/retained in reservoir (trap efficiency)
• = a function of the ratio of reservoir capacity to total inflow
• The trap efficiency decrease with age o Reservoir sedimentation cannot be prevented, but can be control by reduction in sediment inflow (through soil conservation)
EARTH EMBANKMENTS
� Meaning :
o Is as a type of dams o Made of earth (soil) earth-fill dam o Utilize natural materials with a minimum of processing o May be built with primitive equipment o Adapted to earth foundations o Total height above ground level ≤ 15 m
� Types of earth-fill embankment dams:
o Simple type. It is constructed of relatively homogenous soil material and either is keyed into a impervious foundation stratum

Soil and Water Conservation Engineering Asep Sapei
Edisi 2006 77
o Core or Zone type. A central section (core) of highly impermeable soil is placed within the dam
o Diaphragm type. It uses a thin wall of plastic, butyl, concrete, steel or wood to form a barrier against seepage through the fill
� General requirements for earth embankment
1. The topographic condition at dam site must allow economical construction
2. Soil material must be available to provide a stable, impervious fill
3. Must have adequate mechanical and flood spillway 4. Large storage embankment should be equipped with a
bottom drain pipe for maintenance and fish management
5. Should be provided by safety equipment 6. Provided by maintenance program
� Height of dam

Soil and Water Conservation Engineering Asep Sapei
Edisi 2006 78
- Is the distance from the foundation to the water surface in the reservoir when the spillway is discharging, plus freeboard
- Gross freeboard is the distance between the crest of the mechanical spillway and the top of the dam
- Net freeboard is the distance between the maximum designed high water level or flood peak and the top of settled dam
- Net freeboard should sufficient to prevent wave
- Wave height for moderate reservoir : 2/1)(014.0 fDh ====
H : height of wave, m and Df : length of exposure, m. - The height of dam should be 5 to 10 % higher than the design to allow settlement
� Top width
- Should be sufficient to keep phreatic line when the reservoir full 1. For dams height ≤ 3.5 m, minimum top width is 2.4 m
2. For dam height > 3.5 m, 14.0 ++++==== HW W : top width in m, H : maximum height of dam in m
� Side slope
- Depend on the height, the shearing resistance of the foundation and the duration of inundation
- On structure < 15 m height with average material, side slope ≤ 3 : 1 on the upstream face and 2 : 1 on the downstream face
- Coarse, uncompactable soil, side slope 3 : 1 or 4 : 1 - For structure > 15 m height complete analysis

Soil and Water Conservation Engineering Asep Sapei
Edisi 2006 79
� Seepage
- No earth fill dam can be considered impervious seepage
- If rate of seepage height enough soil particles are moved called piping dam failure
- Seepage through earth fill dam reduced by: o Placing impervious blanket on upstream face o Using a clay core or diaphragm o Placing drain blanket and filters at the toe
- Seepage through permeable foundation reduced by extending blanket to upstream

Soil and Water Conservation Engineering Asep Sapei
Edisi 2006 80
- Can be analyzed by flownet
Total head lost: H=∆H x no. of equipotential drops =∆HxNd Total seepage flow: q=∆q x no. of flow intervals=∆qxNf
Darcy: total flow, q = k∆HNf =d
f
N
NkH
� Construction
1. All tree, stumps and major roots should be removed from the site
2. Top soil should be removed and stockpiled for later spreading
3. The fill should be compacted at optimum water content.
4. The thickness of layers : - 0.25 m for pervious soil - 0.15 m for plastic and cohesive soil
5. The material should be placed nearly horizontal 6. The degree of compaction to be achieved 85 – 100 % of maximum Proctor density

Soil and Water Conservation Engineering Asep Sapei
Edisi 2006 81
IX. WATER CONVEYANCE AND CANAL DESIGN Water conveyance related to soil and water conservation, i.e: 1. Vegetated waterways. o It is water conveyance (channels) that protected from erosion by using vegetation
2. Open ditches o Provide outlets for pipe and surface drains o Remove surface water directly o Generally drain large area
VEGETATED WATERWAYS
o It is used to handle natural concentration of runoff or to carry the discharge from terrace systems, contour furrows, diversion channels or emergency spillway
o It should not be use for continuous flow
o Capacity
� Be based on the estimated runoff from the contributing area
� Use 10 year return period storm (except in flood spillway)

Soil and Water Conservation Engineering Asep Sapei
Edisi 2006 82
� For long waterways, capacity may be changed due to the changing drainage area
� For short waterways, capacity estimated base on the flow at the waterways outlet
o Shape
� May be : - parabolic the shape of natural channel - Trapezoidal, or - Triangular
� Channels built with a blade equipment may be trapezoidal or triangular
� Side slope 4 : 1 or flatter to facilitate mowing and crossing of farm equipment
� Trapezoidal channels required less depth
o Vegetation
� Depend on : - Soil and climatic conditions - Duration, quantity and velocity of runoff

Soil and Water Conservation Engineering Asep Sapei
Edisi 2006 83
- Ease of establishment - Time required to develop a good protective cover - Suitability to the farmer for utilization as a seed or hay
- Cost and seed availability - Retardance to shallow flows
� Recommended vegetation (USA)
o Velocity
� Depend on : - type, condition and density of vegetation - Erosive characteristic of soil
� Based on Manning formula : 2/13/21SR
nv ====
V : average velocity of flow, m/s n : roughness coefficient R : hydraulic radius = cross area/wetted perimeter = (A/P) S : hydraulic gradient, m/m

Soil and Water Conservation Engineering Asep Sapei
Edisi 2006 84
� Permissible average velocity
� Velocity distribution

Soil and Water Conservation Engineering Asep Sapei
Edisi 2006 85
o Roughness coefficient
� Difficult to evaluate � Varies with the depth of flow
� vR is as index of channel retardance � vegetation retardance classification

Soil and Water Conservation Engineering Asep Sapei
Edisi 2006 86

Soil and Water Conservation Engineering Asep Sapei
Edisi 2006 87
� roughness coefficient
For small channel n = 0.04
Soil and Water Conservation Engineering Asep Sapei
Edisi 2006 88
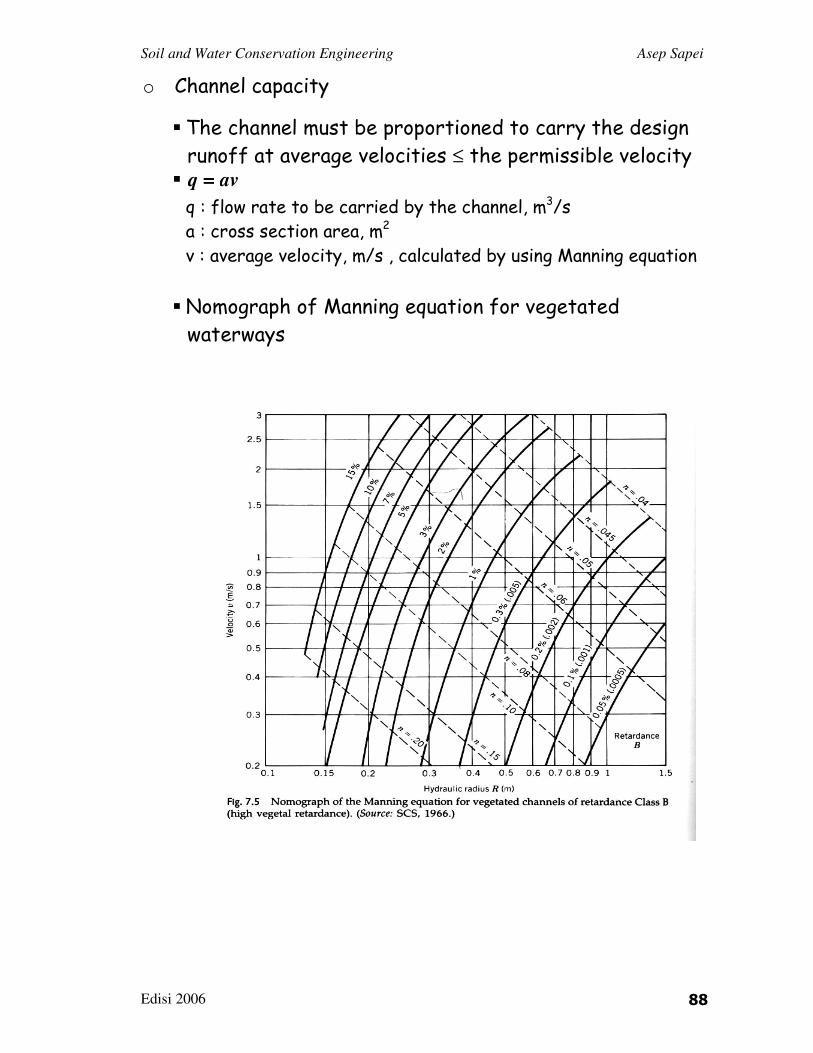
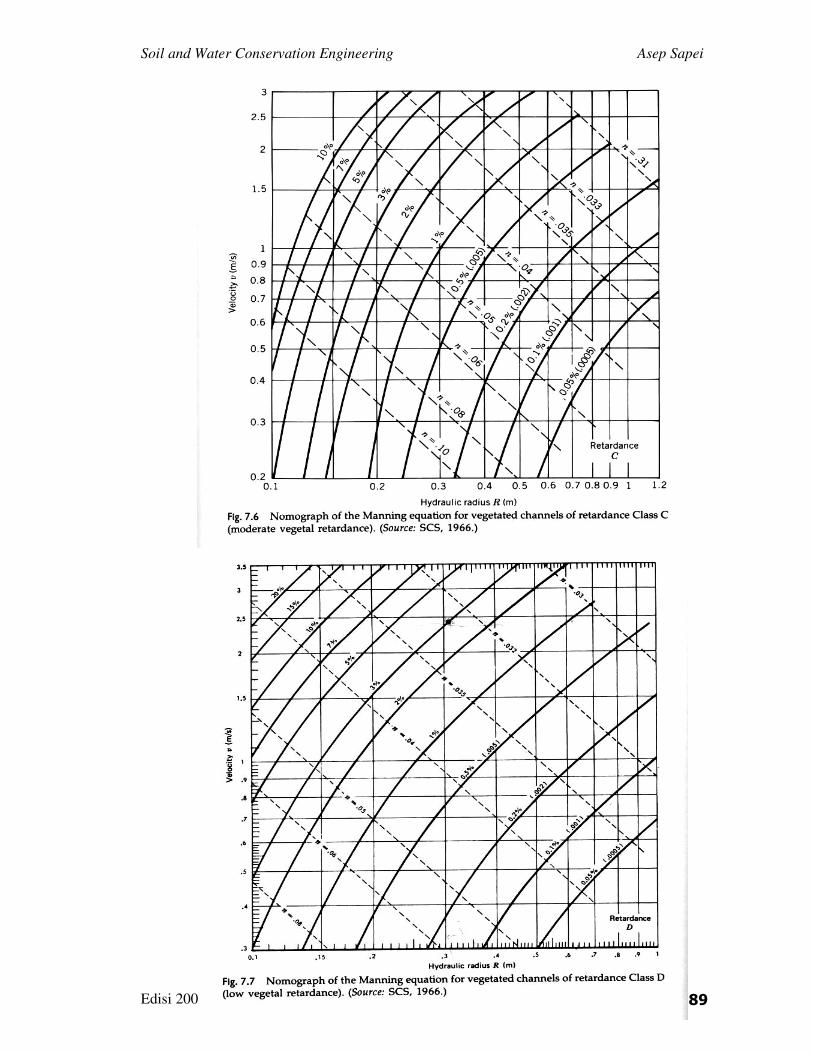
o Channel capacity
� The channel must be proportioned to carry the design runoff at average velocities ≤ the permissible velocity
� avq ==== q : flow rate to be carried by the channel, m3/s a : cross section area, m2 v : average velocity, m/s , calculated by using Manning equation
� Nomograph of Manning equation for vegetated waterways
Soil and Water Conservation Engineering Asep Sapei
Edisi 2006 89

Soil and Water Conservation Engineering Asep Sapei
Edisi 2006 90
� Depth flow of trapezoidal vegetated waterways
A freeboard of 0.1 to 0.15 should be added to the design depth � The channel should be design to carry runoff at a permissible velocity under conditions of minimum retardance (short grass) b determination
� Additional depth should be added to the channel to provided adequate capacity under maximum retardance (long grass) d determination

Soil and Water Conservation Engineering Asep Sapei
Edisi 2006 91
Example: Design a trapezoidal grass waterway to carry 5 m3/s on a 3 % slope on erosion-resistant soil. The vegetation is to be Bermuda grass, and the channel should have 4:1 slope. From table permissible velocity, the permissible velocity is 2.4 m/s From retardance classification table, Bermuda grass is in retardance class D when mowed and in class B when long. For soil conservation, the mowed condition is more critical By using nomograph Manning for D class, with v=2.4 m/s, slope 3 % read R = 0.31 m The cross sectional area : a = q/v = 5/2.4 = 2.08 m2 By using nomograph for trapezoidal dimension, with R = 0.31 m and a = 2.08 m2, read bottom width b = 4 m and depth of flow d = 0.41 m To determined depth of flow in long condition (class B) The bottom width b = 4 m must be retained By trial and error, select a depth of 0.5 m, so a become 0.3 m2 and R = 0.37 m. By using nomograph for Manning, with R=0.37 and slope 3 %, read v = 1.7 m/s q become 3.0 x 1.7 = 5.1 m3/s to hight Try again for the depth < 0.5 m, and the calculation is repeated until q ≈ 5 m3/s.

Soil and Water Conservation Engineering Asep Sapei
Edisi 2006 92
The other alternate solution is to select the appropriate additional depth increment as shown in the following table
The depth increment is 0.13 + 0.03 = 0.16 m The depth of flow d become 0.41 + 0.16 = 0.57 m Freeboard should be include, so the depth d = 0.57 + 0.1 = 0.67 m So, the dimension of vegetated waterways is : bottom width b = 4 m, depth d = 0.67 m, side slope 4:1

Soil and Water Conservation Engineering Asep Sapei
Edisi 2006 93
OPEN CHANNEL � Open channel refers to open ditches for drainage
� Open ditch : o Provide outlets for pipe and surface drains o Remove surface water directly o May be earth or lined channel
� Earth-lined open channel o Discharge capacity
- It is computed from the Manning formula 2/13/21
SRn
v ====
- q = a v - Sufficient to carry the design flow

Soil and Water Conservation Engineering Asep Sapei
Edisi 2006 94

Soil and Water Conservation Engineering Asep Sapei
Edisi 2006 95
o Cross section
- Normally with trapezoidal cross section
- Side slope • Depend on soil texture and stability • Recommend side slope

Soil and Water Conservation Engineering Asep Sapei
Edisi 2006 96
- Bottom width
• Calculated by : 2/12
)1(
22/tan2
++++++++========
zz
ddb θθθθ
b : bottom width, L d : design depth, L θ : side slope angle, degree z : side slope ratio (horizontal/vertical)
• The minimum bottom width should be 1.2 m, except in small channel
- Depth • Should include freeboard of 20 % of the total depth
- Spoil bank • The excavated soil may be placed on one or both sides of the channel
• For the ditch with side slope 1:1 berm width = 2xdepth
• For the ditch with side slope 2:1 Berm width = depth
• The minimum berm width is 3 m
o Velocities - Optimum velocities are base on:

Soil and Water Conservation Engineering Asep Sapei
Edisi 2006 97
• Selection of limiting velocities, or • Computed values of critical tractive force (the hydraulic shearing force per unit area on the periphery of the channel)
- Velocity should be low enough to prevent scour, but high enough to prevent sedimentation
- Usually an average velocity of 0.5 – 1.0 m/s for shallow channel is sufficient to prevent sedimentation
- Recommended limiting velocity
- Tractive force wdsKT ==== T : tractive force, F/L2 w : unit weight of water (9800 N/m3), F/L3 d : depth of flow, L s : slope (hydraulic gradient), L/L

Soil and Water Conservation Engineering Asep Sapei
Edisi 2006 98
K : ratio of the tractive force for noncohesive material necessary to start motion on the sloping side of the channel to that required to start motion for the same material on a level channel K = 1 for an infinitely wide channel of uniform depth
Example: Design a stable channel with a side slope ratio of 1:1 to carry a flow of 4.42 m3/s on a slope of 0.25 %. The soil is stiff clay, very colloidal, n=0.025, and the water is transporting colloidal silts From table, the critical tractive force is 22.0 Pa The maximum depth with K = 1 is
wdsKT ==== d =22.0/(9800x0.0025) = 0.9 m By trial and error Assuming b=2.44, compute a = 3.01 m2 and p = 4.99 m manning equation, result v = 1.43 m/s and q = 4.30 m3/s which is close enough to the required capacity

Soil and Water Conservation Engineering Asep Sapei
Edisi 2006 99
SPILLWAY � Meaning:
o It is the safety valve for a dam o It must have the capacity to discharge major floods without damage to the dam, and at the same time keeping the reservoir level below some predetermined maximum level
o May be controlled (provided with crest gates or other facilities so that the outflow rate can be adjusted) or uncontrolled
� Design capacity Depends on:
- the spillway design flood - the discharge capacity of the outlet - the available storage
� Overflow spillway
o It is a section of dam designed to permit water to pass over its crest
o It is widely use on gravity, arch and buttress dams

Soil and Water Conservation Engineering Asep Sapei
Edisi 2006 100
o Ogee Spillway
- Separation and cavitation occur when flow velocity exceed design capacity cause reduce pressure
- Cavities filled with vapor air and other gasses - May cause the surface a spongy appearance pitting
- Protected by using ramps or corbel - The discharge of an overflow spillway:
2/3LhCQ w==== Q : discharge, m3/s Cw : coefficient L : length of the crest, m h : head on the spillway, m

Soil and Water Conservation Engineering Asep Sapei
Edisi 2006 101
- Approach velocity : if the cross sectional area of the reservoir just upstream from the spillway is < 5 x the area of flow over the spillway, so
2/32
0 )2
(g
VhLCQ w ++++====
Example : An ogee spillway 16 ft long is designed to pass 420 cfs when the water surface elevation upstream of spillway is 23.0 ft. The reservoir bottom is horizontal and at elevation 0.0 ft upstream the spillway. Find the flow when the water-surface elevation upstream of the spillway is 21.5 ft. Assume there are no end contraction and neglect velocity approach
Assume h’/Hd ≈ 0 and let h/h’ = 1.0, so Cw = 4.03
2/3LhCQ w==== 420 = 4.03(16)h 3/2 h = 3.5 ft When the upstream water elevation is 21.5 ft: h = 21.5 -19.5 = 2.0 ft; and h’ = 3.5 ft h/h’ = 2.0/3.5 = 0.57 and h’/Hd ≈ 0 Cw = 3.68 Q = 3.68 (16)(2) 3/2 = 167 cfs

Soil and Water Conservation Engineering Asep Sapei
Edisi 2006 102
o Chute spillway - Use chute (a steep sloped open channel) as conduit - Usually constructed of reinforced concrete slabs 0.25 – 0.5 m thick
o Side channel spillway
- After passing over the crest, water is carried away in a channel (chute or tunnel) running parallel to the crest
- Usually use in narrow canyon

Soil and Water Conservation Engineering Asep Sapei
Edisi 2006 103
o Shaft spillway - The water drops through a vertical shaft to a horizontal conduit
- Three possible conditions

Soil and Water Conservation Engineering Asep Sapei
Edisi 2006 104
o Siphon spillway
- For low capacity and space is limited - Discharge given by ghACQ d 2==== Cd is usually 0.9
Soil and Water Conservation Engineering Asep Sapei
Edisi 2006 105
DAFTAR PUSTAKA Holy, M. 1980, Erosion and Environment, Pergamon Press,
Oxpord Lal, R. (ed.), 1994, Soil Erosion Research Methods, Soil and
Water Conservation Society, Ankeny Morgan, R.P.C., 1996, Soil Erosiomn and Conservation,
Longman, Harlow Schwab, G.O., D.D. Fangmeier, W.J. Elliot and R.K. Frevert,
1993, Soil and Water Conservation Engineering, John Wiley & Sons, New York