soil and the environment
TRANSCRIPT
BUL 795
Soil and the EnvironmentA Land and Homesite Evaluation Handbook and Training Guide
Issued in furtherance of cooperative extension work in agriculture and home economics, Acts of May 8 and June 30, 1914, in cooperation with the U.S. Department of Agriculture, Barbara Petty, Interim Director of University of Idaho Extension, University of Idaho, Moscow, Idaho 83844. The University of Idaho provides equal opportunity in education and employment on the basis of race, color, national origin, religion, sex, sexual orienta-tion, age, disability, or status as a disabled veteran or Vietnam-era veteran, as required by state and federal laws.
9-00 (revised); 7-12 (revised); 8-15 (reprinted) $4.00 ©2012 by the University of Idaho

2—Soil and the Environment
Contentsmination of Texture 15, Texture by Feel 16, Clues to the Feel of Textural Classes 18, Permeability 19, Soil Structure 20, Soil Depth 20, Slope 20, Erosion—Wind and Water 21, Surface Runoff or Surface Drainage 21, Subsoil or Internal Drainage 22, Climate 22, Major Factors 22, Land Capability Classes 22, General Guide for Selecting Land Capability Classes 23
Part II. Recommended Land Treatments ............. 23 Vegetative 23, Mechanical—Irrigated/Dryland
Only 24, Mechanical—Irrigated and Dryland 24, Fertilizers and Soil Amendments 24
Homesite Evaluation .....................................................25 Limitations for Nonagricultural Use 25 Factors Affecting Suitability ...........................26 Texture 26, Permeability 27, Soil Depth 27,
Slope 27, Erosion 28, Surface Runoff 28, Shrink-Swell 28, Water Table 28, Flooding 29
How To Use the Scorecards ..........................................29 Land Evaluation Scorecard—Part I 29, Land
Evaluation Scorecard—Part II 29, Homesite Evaluation Scorecard 29
Idaho Land Evaluation Scorecard .................................30Homesite Evaluation Scorecard ....................................31
Program Background ................................................... 2Introduction ....................................................................3 What Is Land and Homesite Evaluation? 3Organization ....................................................................4 State Event 4, Regional Field Days 5, Local
or Practice Events 5, Setting Up an Event 5, National Event Eligibility 5
How Land Evaluation Works ..........................................6Scoring the Event ............................................................7 DefinitionofaTeam7,InCaseofTies7,
Learning More About Soils 7Study of Soils ..................................................................8 FactorsofSoilFormation8,SoilProfile9,
Processes of Soil Formation 9, Rock to Soil 10, Kinds of Soil Horizons 11, Master Horizons 11, Special Kinds of A, B, and C Horizons 12, Transition Horizons 13, Subdivisions of Thick Horizons 13, More Than One Kind of Parent Material 13
DefinitionsofTermsandCriteria for Land Evaluation ........................................14 Part I. Soil and Land Characteristics ................... 14 Soil Texture (Surface Soil and Subsoil) 14,
DefinitionofTermsUsed14,FieldDeter-
Program BackgroundDepartment of Plant, Soil and Entomological Sciences provide technical support and assist with the overall state program, including scheduling, organizing, and conducting the regional andstateevents.Theymaintaintheofficialhandbook,Soil and the Environment: A Land and Homesite Evaluation Handbook and Training Guide (Bulletin 795). Faculty in the Department of Agricultural Education and 4-H Youth Development assist in the development and coordination of regional and state events.
• University of IdahoExtension—Extension educators in countyofficesofUniversityofIdahoExtensionworkwith4-Hleaders and FFA advisors as well as their members. They assist in preparing and participating in the regional and state events.
• IdahoAssociationofSoilConservationDistricts—IASCD Auxiliary and individual soil conservation districts support the program through planning, conducting events, and contributing funding. The East and West Cassia soil conservation districts have for years been major sponsors of the state event in Burley.
Ordering this publicationEducational Publications Warehouse, University of Idaho, P. O.
Box 442240, Moscow, ID 83844-2240, 208-885-7982, [email protected].
Editors and AcknowledgmentsPaul A. McDaniel is professor of soil science, Anita L. Falen is
research associate, and Maynard A. Fosberg is professor emeritus of soil science, all in the UI Department of Plant, Soil, and Entomologi-cal Sciences, Moscow.
Terry A. Tindall, former extension soil scientist at the UI Twin Falls Research and Extension Center, wrote most of the contents. The editors are grateful to Chad McGrath and Hal Swenson, USDA Natural Resources Conservation Service, for their involvement in preparing this handbook.
The Idaho State Land and Soil Evaluation Program is a cooperative effort among many individuals and organizations. It involves youths from both FFA and 4-H. The program was initiated at Burley in 1971 when Soil Conservation Service Soil Scientist Glen Logan worked with a group of Future Farmers of America (now known as FFA) at a state event. He also went with them to Oklahoma City and participated in the national event. Since that time the program has grown to include several thousand FFA and 4-H youths participating in regional events throughoutIdahoandthestateeventatBurley,Idaho.Fourorfiveregionallandandsoiljudgingfielddaysandthestateeventareheldduring the months of September and October each year.
In 1985, the Maynard Fosberg Land Judging Endowment was establishedtohelpsupporttheprogramfinancially.Partialsupportforthe Land and Soil Evaluation Events comes from the endowment inter-est. Individuals and organizations make donations to the endowment.
CooperatorsThe following agencies and organizations are involved in the
Idaho State Land and Soil Evaluation Program. In addition, Idaho agricultural science and technology instructors, the State FFA, and district FFA organizations support the program. • U.S.DepartmentofAgriculture,NaturalResourcesCon-
servationService (USDA-NRCS)—Soil scientists and soil conservationists work to organize, provide technical support, and assist in conducting the regional and state events.
• IdahoDivisionofProfessional-TechnicalEducation—The State FFA as housed at the Idaho Division of Professional-Tech-nicalEducationprovidesofficeandtechnicalsupportassociatedwith the state event. The Division of Professional-Technical Education also hosts an annual steering committee meeting and oversees scheduling of the state and regional events.
• UniversityofIdahoCollegeofAgriculturalandLifeSci-ences—Extension soil specialists and soil scientists in the

Soil and the Environment—3
Soil and the EnvironmentA Land and Homesite Evaluation Handbook
and Training GuideEdited by: P. A. McDaniel, A. L. Falen, and M. A. Fosberg
Fig. 1. Former UI soils specialist Terry Tindall, right, gives instructions to students in a soils event.
What Is Land and Homesite Evaluation?
Land and homesite evaluation is an event designed to “evaluate” a soil or set of soils. The purpose of land and homesite evaluation is to teach an individual to rec-ognize soil factors and to evaluate soil characteristics. This will allow the individual to make wise decisions in managing and in using the soil or the land. Wise decisions in land use will help conserve Idaho’s most valuable natural resource—our soils. Land evaluation can help individuals understand:1. Basic soil differences. 2. How physical and chemical soil properties affect crop
growth. 3. Why various soils respond differently to management
practices. 4.Theinfluenceoflandtopographicfeaturesonproduc-
tion, land protection, geology, and native vegetation. 5. Soil and water conservation practices. 6. Proper land use and treatment. 7. How soil properties may be used as a basis for making
a better selection of homesites.
Idaho has approximately 53 million acres of land area. Only about 10 percent of the entire area is suitable for crop production. All soil and land, including that suitable for cultivation, is subject to one or more natural limita-tions such as adverse soil texture or permeability, erosion hazard, wetness, restricted rooting depth, and climate. Climatic factors are important in Idaho because some areaslacksufficientnaturalprecipitation(mostlysouth-ern Idaho) and some areas, because of elevation and latitude (eastern Idaho and portions of northern Idaho), lacksufficientheatunitinputforgoodcropproduction.Soilmay be defined as a natural body developed
from a mixture of broken and weathered mineral mate-rial (rocks) and decaying organic material (remains of living organisms). Soil covers the earth in a relatively thin layer. It supplies air, water, and nutrients for plant growth. Soil also provides mechanical support for plants, buildings, and other types of construction.
Plants and animals derive support and nutrients directly or indirectly from the soil. As plants and ani-mals live and die, their waste products and remains are returned to the earth to form the organic fraction of the soil. Development of 1 inch of “soil” may require many hundreds of years under natural conditions.Soilsdifferintheirpotentialtoproducefoodandfiber
and in their usefulness for construction sites and other nonagricultural uses. These differences are contained inthesoilprofilewithspecificcharacteristicsindicatedin each soil horizon. The best use and management of any given plot of land is based upon characteristics of the soil comprising that plot of land. Knowledge of soil characteristics is necessary to determine potential land value, select adapted crops, recommend proper manage-ment, and determine necessary conservation measures to ensure proper land use.
Based on soil characteristics and potential manage-ment problems, soils are grouped into eight land capabil-ity classes. These classes are used by many agricultural workers and others to plan and practice wise use of the land.
Soil engineering properties and interpretations may also be determined using the soil characteristics and potential problems as a basis. These properties and interpretations may be used for selecting suitable sites for building houses and septic tank drainage systems, lo-cating roads and streets, planning parks and playground areas, and many other construction uses of soil.

4—Soil and the Environment
Fig. 2. FFA and 4-H participants evaluate a soil profile in an exposed cut below at left, and review soil characteristics in an urban setting below at right.
(IASCD), the state 4-H director, and others appointed by the chair. Members of the state committee work closely with individuals at University of Idaho Exten-sioncountyofficesandindividualsatNRCS,SCD,andFFAresponsibleforconductingtheregionalfielddaysand the state event.
State Event Rules1. Clip boards are allowed (recommend clear boards). 2. No calculators, no cell phones, or personal water
bottles.3. Evaluation cards will be handed out after the prac-
tice site has been completed.4. Notalkingwithinthefielddescriptionsite.5. Theareabetweentheflagginginthesoilpitsshould
not be disturbed by participants.6. Awhitenailwillmarkthetopofthesoilprofilein
theflaggedarea.Otherwhitenailsmaybeusedintheflaggedareafortopsoilpresentorthedepthofthe soil.
7. If site information is reviewed, it will be done at the end of the state event, not at the end of each site.
8. Thethree-personteamwillchecktheofficialplac-ings at each site before the contest begins. Any errors ontheofficialscorecardswillbecorrectedonlyafterconsultation with the state coordinator. However, the slope, texture, soil depth, and topsoil depth determinationsmadebycontestofficialsarefinal.
The Idaho Land and Soil Evaluation Program includes regionalfielddaysandastateevent.Thestateeventisrestricted to FFA and 4-H members who have competed andqualifiedatregionalfielddays.
State EventThe state event is held in October each year. The site
and date of the event are determined by the State Land and Soil Evaluation Committee.
The two top teams from each FFA district and the top two 4-H teams at the Regional Field Days qualify for the state event. Additionally, the highest-placing chapter or 4-H club at each regional event (that did not qualify as one of the top two teams in their respective district) will be invited to attend. The teams in the state event,bothFFAand4-H,havethreetofivemembers,with no alternates.
State Land and Soil Evaluation Committee
The State Land and Soil Evaluation Committee in-cludes a University of Idaho Extension soil specialist or soil scientist, a Natural Resources Conservation Service (NRCS)soilscientistfromthestateoffice,NRCSareasoil scientists, the Idaho Division of Professional-Technical Education program manager, a representative of the University of Idaho Department of Agricultural Education and 4-H Youth Development, a representative of the Idaho Association of Soil Conservation Districts
Organization

Soil and the Environment—5
Regional Field DaysThe regionalfielddays are held in the fall before
thestateevent.RegionalfielddaysareheldinnorthernIdaho, southwestern Idaho, southcentral Idaho, and once or twice in eastern Idaho. Efforts are made to ensure thatlocationsoftheareafielddaysarerotatedwithinthe region to take advantage of assistance from local representatives of NRCS, SCD, University of Idaho Extension, FFA, and other organizations.
The number of participants making up a team at regionalfielddayswillbeaminimumofthreewithamaximumoffive.Winningteamsaredeterminedbyto-taling the scores of the three highest individuals for each team. The number of alternates (nonteam members) who mayparticipateintheregionalfielddaysisnotlimited.Officialscorersmaygradethescorecardsofalternatesor may leave the grading to advisors and 4-H leaders.
Local or Practice EventsLocal events may be held for practice. These can be
arranged by the team advisor or coach if they feel there is a need. Help in conducting such events for training team advisors or participants can be obtained from NRCS, SCD, UI, or other soil scientists.
Local advisors should attempt to involve local orga-nizations such as a Chamber of Commerce, Soil Con-servation Districts, Irrigation Districts, or individuals representing agribusiness. They should be involved in obtaining and presenting awards, supporting banquets, etc.
Setting Up an Event 1. The event date should be set at the annual steering
committee meeting (usually held in February). 2. Estimate the expected participation, if possible. 3. Locate a farm or adjacent farms that have different
soil and landscape conditions that can provide a variety of sites for evaluation.
4. Secure permission from the owner(s) to use the selected site(s).
5. Several days before the event, select sites and pre-parepitsorothersoilprofileexposures.Roadcuts,streambanks,andothersuchsoilprofileexposurescanbeused.Makeofficialscoringsandevaluationsof each site. Prepare extra copies of the officialscorecards for use by scorers and others to explain the scoring to participants after the contest.
6. Obtain scorecards and prepare packets consisting of a practice card, three land evaluation cards, and one homesite card (two homesite cards at the state event) for each participant. A tabulation card to serve as a registration card should be prepared for each team.
7. Prepare extra packets for alternates at the regional fielddayswhowishtoparticipate.
8. Arrange for transportation of participants to the fieldsandbetweensitesasnecessary.(Duringtheevent allow 20 minutes at each event site.)
9. When possible, break participants into groups so that no two members of the same team are in the same group. Prohibit talking between participants. Assigned group leaders will supervise each group and lead participants to the sites.
10. Where possible, provide an individual at each site (pit monitor) to answer questions, collect scorecards, keepwaterbottlesfilled,andmonitorparticipants.At the regionalfielddaysand thestateevent theofficialscoringforeachsitewillnotbegivenbythe pit monitor at the end of the timed period for evaluating the site. Advisors and/or coaches or soil scientists can enhance the educational experience at theregionalfielddaysandstateeventbygoingovertheofficialplacingofeachsiteattheirdiscretion.
11. If it has not been done beforehand, select leaders and tabulators (graders) the morning of the event.
12. Arrange for a place to conduct the grading and designate someone to collect the scorecards as participantsfinishthedifferentfieldstospeedthegrading process as much as possible.
National Event EligibilityState and national soils events are restricted to in-
dividualsandteamsthathavepreviouslyqualifiedbywinningregionalfielddaysandstateevents.Studentswho have previously participated in a national soils event are not eligible to participate in state soils events in subsequent years. Regional field day coordinatorscould allow participants in previous national soil events toparticipateattheregionalfielddaysifadequatehelpersare available to grade their cards. It is very important for individuals to continue their education in soils.ThetopfiveFFAand4-Hteamsareeligibletopar-
ticipate in the National Land and Range Judging Contest held in the spring in Oklahoma City, Oklahoma. Sup-port monies are provided by Idaho local sponsors and bytheMaynardFosbergEndowmentforthefirst-andsecond-place teams recognized at the state event. If they choose not to participate, support monies would go to a lower-standingteam(third-,thenfourth-,thenfifth-placeteams). Eligible teams are informed of the details of the support at the state event.

6—Soil and the Environment
Fig. 4. Some type of container, such as a plastic pan, will be used at each site to hold samples of surface soil and subsoil material. This ensures that all participants will be considering the same horizon of the exposed soil profile.
Fig. 3. A uniform area 100 x 100 feet will represent the “field” to be evaluated. Samples of surface soil and subsoil will be placed in containers for evaluation. Generally only features occurring within the boundaries of the field will be considered in evaluating the site.
How Land Evaluation WorksLand and homesite evaluation is a training method
similartolivestockevaluation,usingclassesof“fields”instead of classes of animals. “Fields” are evaluated ac-cording to established criteria for their suitability and limitationsforvarioususes.Theterm“field”referstoa plot of land 100 feet square selected from a uniform portion of a farm or other area (Fig. 3). Land and home-site evaluation consists of four “fields.”Participantsevaluate “fields” using the criteria in this handbookand by recording their evaluations and interpretations on the scorecards.
Only those features within the boundaries of the “fields”will be considered in evaluating eachfield.Surfacerunoff, floodinghazard, and wetnesshazard mayrequireconsiderationbeyondthefieldboundariestoproperlyevaluatethehomesitefieldandthisinformationwill be provided on the site placard.Thesoilprofileisexposedtoallowparticipants to
examine soil depth, topsoil depth, and soil structure. Fig. 4 shows samples of the topsoil and subsoil placed in containers for determination of textures and perme-ability.Official scoringof thefields isbyaqualifiedevaluator(s). Qualifiedevaluatorsmay includeoneormoresoil
scientists, extension educators, agricultural science and technology instructors, soil conservationists, or any other individuals who understand the criteria in the handbook.
The evaluators set climatic conditions, soil test in-formation, and other factors that are not obvious. The conditions are given on a placard located at each site (Fig. 5).
A sample placard may look like this:
Field number 1.Original depth of Ahorizon22 inches1
Present depth of Ahorizon10 inches2
Climate Annual precipitation 8 inches Frost-free days ...................................125Soil analysis pH .......................................................7.5
Nitrogen (NO3N) .................................30 ppm Phosphorus (P2O5) .................................9 ppm Potassium (K2O) ................................300 ppm Zinc (Zn) ............................................1.5 ppmOther factors3
1Since variation will occur from area to area and with evaluator’s interpretation, the original depth given here shouldbespecifiedas“...depthof topsoil22 inches,” “...depth of Ahorizon22 inches,” or other designation to prevent confusion for the participant.
2If not obvious to the participant, the present depth of the designatedportionoftheprofilezonecanalsobegivenandthus only a simple calculation is necessary to determine erosion losses.
3Factors given to the participant where information is not obvious.Examplesareirrigationwateravailability,floodingfrequency, water table depth, and manure availability.

Soil and the Environment—7
Scoring the EventThegraderswilldeterminetheofficialscoresforeach
entry on the scorecard. The following is an example of howafieldcouldbescored.
PARTISoilandLandCharacteristics
Factors PointsA. Surface texture 4B. Subsoil texture 4C. Subsoil permeability 4D. Depth of soil 3E. Slope 3F. Erosion loss 3G. Surface runoff 3H. Drainage 3I. Climate 3J. Major factors 101
Total points, Part I 40
PARTIILandCapabilityClassand
RecommendedLandTreatmentsTreatments PointsK. Land capability class 5L. Vegetative 131
M. Mechanical 91
N. Fertilizer/soil amendment 81
Total points, Part II 35 Total points, both parts 751One point given for each item (correctly marked or not marked).
Definition of a TeamThree to five participants comprise a team in the
regional field days, and additional participants are encouraged to take part as alternates. At the state event, threetofivemembersareallowedforanyparticipatingchapter or club with no alternates. The scores of the high three members comprise the team score.
In Case of TiesIn the case of a tie between individuals, the individual
having the highest total score in Field 1 would be de-clared the winner. If the total score at Field 1 is the same for each individual, the evaluation will continue with Field 2 and so on through Field 3 and Field 4 until the tie is broken. Using Part I and Part II scores from Field 1 to break the ties is not feasible because only total scores are recorded and the original cards are often unavailable.
In case of a tie in a team score (using the top three scores), the score of the fourth individual will be used as the tiebreaker. If a team having only three members is tied with a team of four members, a composite score from the top three team members will be used in a man-ner similar to that used to break a tie for individuals.
Learning More About SoilsThe primary purpose of a soil and land evaluation
event is to provide an educational experience in the area of soil science. Advisors and/or coaches can en-hance the educational experience by going over the officialplacingofeachsite.Soiland landevaluationeducational guides are available online from previous regional and state events (http://www.uidaho.edu/cals/pses/research-and-extension/pedology-laboratory/land-and-soil-evaluation-program). Allowing participants to practicefillingoutcards,tradingcards,andgradingcardsalso helps them learn.
Fig. 5. A land and homesite evaluation set-up looks much like the one below, with some type of container, such as a plastic pan, used to hold a sample of surface soil or subsoil material, a placard on which is written site conditions, and an exposed soil profile.

8—Soil and the Environment
Since many agricultural science and technology teachers use this handbook as a student text for teaching soils, this section has been added. This information can be used to enhance the understanding of basic soils and the Idaho Land and Soil Evaluation Event.Thestudyofsoilsiscomplex.Oneofthebetterdefini-
tions of “soil” indicates some of the important aspects of this valuable resource.
SOIL: A living, dynamicsystemat the interfacebetween air and rock. Soil forms in response to forces of climateandorganisms that act on parentmaterialinaspecificlandscapeover a long period of time.
Thisdefinitionisespeciallygoodbecauseeachkeyword says something important about the soil. Why living? Because the soil is full of living organisms: roots large and small, animals and insects, millions of microscopic fungi and bacteria, etc.
Equally important are the decaying remains of dead plants and animals. They form soil organic matter, or humus, which is vitally important for good soil tilth and productivity.Dynamicsays that the soil is constantly changing.
Idaho soils change from very wet and cold in the winter to very dry and hot in the summer. Even under irrigation, the amount of water in the soil and soil temperature can vary widely.
Soil organic matter and nutrients increase when crop residues are worked into the soil, and decrease as fresh plant materials decay. Soil nutrients increase as soil min-erals break down and decrease as water moving through the soil carries certain nutrients away. Even soil acidity or alkalinity (soil pH) changes seasonally.
The word systemsays that all parts of the soil work together to make up the dynamic whole. A change in one part may cause changes in many other parts.
Suppose, for example, we add water until the soil is very wet. That reduces the amount of air available to plant roots. It makes the soil colder, and the activity of roots and soil microbes (very small plants and animals) slows down. The wet soil is sticky and cannot bear as much weight as when it is dry.
When the excess water is removed by drainage, the whole system changes to a warmer and drier soil. This is better for plant growth, and the soil is easier for farmers to till and plant.
The word interfacestresses the idea that soil is indeed a very thin “skin” at the earth’s surface. When air meets rock, especially if the air is warm and the rock is moist, the rock begins to change. Some changes are physical. Physical changes are obvious when rocks are broken down into smaller pieces. Other changes are chemical.
Chemical changes can destroy some of the original minerals and create new ones.
These physical and chemical changes are called weathering.Weatheringoccursonlyinthefirstfewfeetof the earth’s surface. Examples of strongly weathered soils can be found in the Idaho Soils Atlas.1 Soil 26 is a remnant of a highly weathered soil that has been nearly lost by erosion. Soil 51 is also a highly weathered soil that has developed in volcanic ash material.
Now consider the size of the earth. The distance from the surface to the center of the earth is about 4,000 miles. Thus, 10 feet of weathered rock out of 4,000 miles is something less than 0.00005 percent. Soil does occur at the point of contact between earth and atmosphere!
Factors of Soil FormationTherestofthekeywordsinthisdefinitionofsoiltell
somethingabouthowsoil forms.Therearefivesoil-formation factors. Two factors—climate and organ-isms—are called active. They provide the forces that cause soil to form. The other three—parent material, topography, and time—are called passivefactors. They respond to the forces exerted by climate and organisms.
Together, the interactions between the forces (active factors) and the responses (passive factors) result in a new product, a unique natural resource, called soil.
ClimateClimate affects soil most directly through temperature
and precipitation. In warm, moist climates, rocks and minerals weather very quickly. The soil that forms often has a reddish color. This reddish color is due to the form that iron takes in the weathering process.
High precipitation or irrigation also causes leach-ing—the removal of soil materials (including chemicals andnutrients)bywaterflowingthroughthesoil.Freelime is completely leached from most northern Idaho soils. These soils are acid (pH less than 7.0). Free lime is still present in most southern Idaho soils because precipitation is needed to move this relatively insoluble material out of the soil. Leaching also moves NO3-N out of the soil system and may contribute to degradation of groundwater quality.
Warm, moist climates encourage lush plant growth, which means large amounts of soil organic matter. The opposite is true in hot, dry climates. Soils in northern Idaho are generally dark-colored because they have a high content of organic matter. Soils in southern Idaho are generally light-colored because they have little organic matter.
OrganismsOrganisms come in several different forms and types:
Study of Soils
1Barker, R. J., R. E. McDole, and G. Logan, Univ. of Idaho, Mos-cow, ID, 1983.

Soil and the Environment—9
large plants, large animals, and tiny plants and animals (microorganisms). Roots of large plants help break apart rocks and mix soil materials. Root channels provide pathways for water and air movement through the soil. When plants die, the above-ground plant parts decay, thereby building up the organic matter in the soil.
Microscopic organisms, or microorganisms, are an extremely important part of the soil. They are the primary decomposers of organic material added to the soil. They change raw plant material into a complex, black substance called “humus.” At the same time they release nitrogen from proteins in the organic material. Nitrogen is an essential nutrient that plants need in large quantities. Thus, rich, fertile topsoils are rich and fertile because they are well supplied with humus. Some soils are composed almost entirely of organic material. Even the earthy smell of moist, rich topsoil is caused by a microorganism.
Microorganisms and the humus they produce also act as a kind of glue to hold soil particles together in clumps or “aggregates.” Well-aggregated soil is ideal for provid-ing the right combination of air and water to plant roots.
Without microorganisms, therefore, soil would be a virtually inert (lifeless) body. With microbes, soil is truly a living, dynamic system.
Animals, including large burrowing animals, small earthworms, and insects, are important because they help mix the soil. Undoubtedly man is the most im-portanthumananimalinfluencingsoildevelopmentin areas where he tills and manages the soil. Mixing by animals carries raw plant debris from the soil surface down into the topsoil. Only then can the microorgan-isms do their job of changing plant material to humus.
Parent MaterialParent material is the original geologic material that
has been changed into the existing soil. Parent material is passive because it simply responds to the changes brought about by weathering and biological activity.
Parent materials can be a bedrock (residuum) like sandstone, basalt, or granite. Other parent materials are transported deposits of sediments carried by water, wind, or ice. Volcanic ash, lake-laid silts, stream deposits, loessal silts, dune sand, glacial till, and glacial gravels are all examples of transported parent materials.
TimeTime from the standpoint of soil formation may be
measured in centuries rather than years. The years of man’s lifetime are rather brief when compared to the age of soil. Many soils are thousands and even tens of thou-sands of years old. Time is the great equalizer. Young soils inherit the properties of their parent materials. They tend to have the same color, texture, and chemical com-position as their parent materials. The older the soil the less impact parent material has on soil characteristics.
As soils age, many original minerals are destroyed. Many new ones are formed. Soils become more leached, more acid, and more clayey with advancing age. In short, the soil becomes more strongly developed with the passage of time.
TopographyTopography, or landscape position, causes localized
changes in such factors as parent material, moisture, and temperature. When rain falls on a hillslope, for ex-ample, water runs away from the top of the hill. Excess water collects at the bottom of the hill. The drier soils at the top are quite different from the wetter soils at the bottom, even though both soils formed under the same overall conditions of climate, organisms, parent mate-rial, and time.
Another effect of topography is affected by the direc-tion that a slope faces. Soils on north-facing slopes, for example, tend to be cooler and wetter than soils on south-facing slopes. The drier and warmer south-facing slopes usually produce less vegetation and thus have lower organic matter content and are more subject to erosion.
Soil ProfileA soil has unique and distinctive layers called soil
horizons. The various horizons or sequence of horizons makeupasoilprofile.Thesoilprofiledevelopedistheresultoftheinteractionofthefivesoil-formingfactors.Thesoilprofileisusuallynotover5feetthickasthisis usually as deep as weathering processes go. Further discussion on horizons follows in a later section.
Processes of Soil FormationThedefinitionofsoilhasidentifiedfivefactorsof
soil formation. We can also think in terms of four major processesthat change parent material into life-sustaining soil. They are additions, losses, translocations, and transformations.
AdditionsThe most obvious addition of materials to the soil
is the addition of organic matter. As soon as plant life begins to grow in fresh parent material, organic matter begins to accumulate. Organic matter gives a black or dark brown color to surface soils. Therefore, even very young soils often have a dark-colored surface layer.
Other additions come with precipitation. On the average, precipitation adds about 5 pounds of nitrogen each year to every acre of soil. Precipitation can also be acid, as it dissolves various natural or man-made chemicals. Precipitation, by causing soils to erode and rivers toflood, isresponsiblefor theadditionofnewsediments to the soil at the bottoms of slopes and on streamfloodplains.

10—Soil and the Environment
LossesMost losses occur by leaching. Water moving through
the soil dissolves certain minerals and carries them out of thesoilprofile.Somemineralsorsaltsarereadilysolubleandarecompletelyremovedfromtheprofileeven inareas of relatively low precipitation. Other minerals, such as lime, are only slightly soluble, so moderate to high amounts of precipitation are necessary to remove themcompletelyfromtheprofile.Man’sinfluencecanbe a big factor as his use of irrigation can change a sparsely vegetated and low-producing desert (with 8 to 10 inches of annual precipitation) to a lush-growing, highly productive cropland when 24 to 36 inches of ir-rigation water are applied each summer.
Many fertilizers, especially nitrogen and sulfur fertil-izers, are highly soluble in water. They, too, are read-ily lost by leaching, either by natural rainfall or from irrigation water. These materials can also drastically alter chemical properties of soils by altering soil pH (increasing acidity).
Other minerals, such as iron and aluminum oxides and silica grains, dissolve very slowly. These minerals remain in very old and highly weathered soils.
Losses also occur as gases or solids. Oxygen and water vapor are lost from soil as fresh organic mat-ter decays. When soils are very wet, nitrogen can be changed to a gas and lost to the atmosphere. Solids are lost by erosion that removes mineral soil particles and organic materials as well as dissolved and undissolved salts. Such losses are very serious, for the soil lost by erosion is usually the most productive part of the soil profile.Erosionlossesalsoreducethethicknessordepthoftheprofile.
TranslocationsTranslocation means movement from one place to
another. Usually we think of movement out of a horizon near the soil surface and into another horizon that is deeper in the soil.
In low rainfall areas, leaching often is incomplete. Waterstartsmovingdownthroughthesoilprofile,dis-solving soluble minerals (salts) as it goes. But there isn’t enough water to move the minerals all the way through thesoilprofile.Whenthewaterstopsmoving,duetosurface evaporation losses or plant use, salts are left behind. That is how subsoil accumulations of free lime are formed. These layers are often referred to as caliche layer in southern Idaho. When these layers become cemented with lime and/or silica, they are hardpans or duripans. Hardpans are often similar to concrete, limiting the useful depth of the soil.
Upward translocation is also possible. Even in the dry areas of southern Idaho, some soils have high water tables. This means that plant roots are adversely affected bythewaterintheprofile,andonlycertainplantswillgrow. In some cases the water may be at the surface
for extended periods of time, creating a “marsh” or “swamp.” Evaporation at the surface causes water to move upward continually. Salts are dissolved on the way upthroughtheprofileandareleftbehindasthewaterevaporates.Saltysoilsaredifficulttomanageandareusually not productive.Anotherkindoftranslocationinvolvesextremelyfine
sized (less than 0.002 mm) clay particles. Water moving through the soil can physically carry these particles from one horizon to another, or from place to place within a horizon. When the water stops moving, the clay particles are deposited on the surface of soil aggregates. These coatings of clay particles are called clay skins. Clay skins have a dark, waxy appearance.
TransformationsTransformations are changes that take place in the
soil. Microorganisms that live in the soil feed on fresh organic matter and change it into humus. Chemical weathering changes the original minerals of the parent materials. Some minerals may be destroyed completely while others are changed into new minerals. Many of the clay particles in soils are actually new minerals that form during soil development.
Still other transformations change the form of certain elements. Highly oxidized forms of iron (iron oxides) usually give soils a yellowish-brown or reddish- brown color. In water-logged soils, however, iron oxides be-come reduced. The reduced forms of iron give soils bluish, greenish, or grayish colors. Reduced forms of iron are quite easily lost from the soil through leaching.
Repeated cycles of wetting and drying create a multi-colored soil material or “mottling.” Part of the soil is grayish because of the loss of iron, and part where the iron oxides are not reduced remains yellow-brown. Mottling is an important clue when identifying soils on associated riparian zones, which occur along streams, ponds, or other areas of free or unbound water.
Rock to SoilHow do all these processes work together to form
soil? Let’s start with a fresh parent material. Climate starts acting on it immediately. Weathering begins to change minerals. Leaching removes the more soluble salts, then the less soluble free lime. As soon as plants begin growing in the soil, they add organic matter and organic acids. Biological activity increases, and humus forms. After several years a dark-colored surface horizon is present.
Weathering and leaching continue to change soil min-erals and remove soluble components. More horizons develop beneath the surface. The soil becomes more acid. Clay minerals begin to form. Clay is translocated and clay skins become evident.
As the amount of clay in subsoil horizons increases, the rate of water movement through the soil decreases.
Soil and the Environment—11
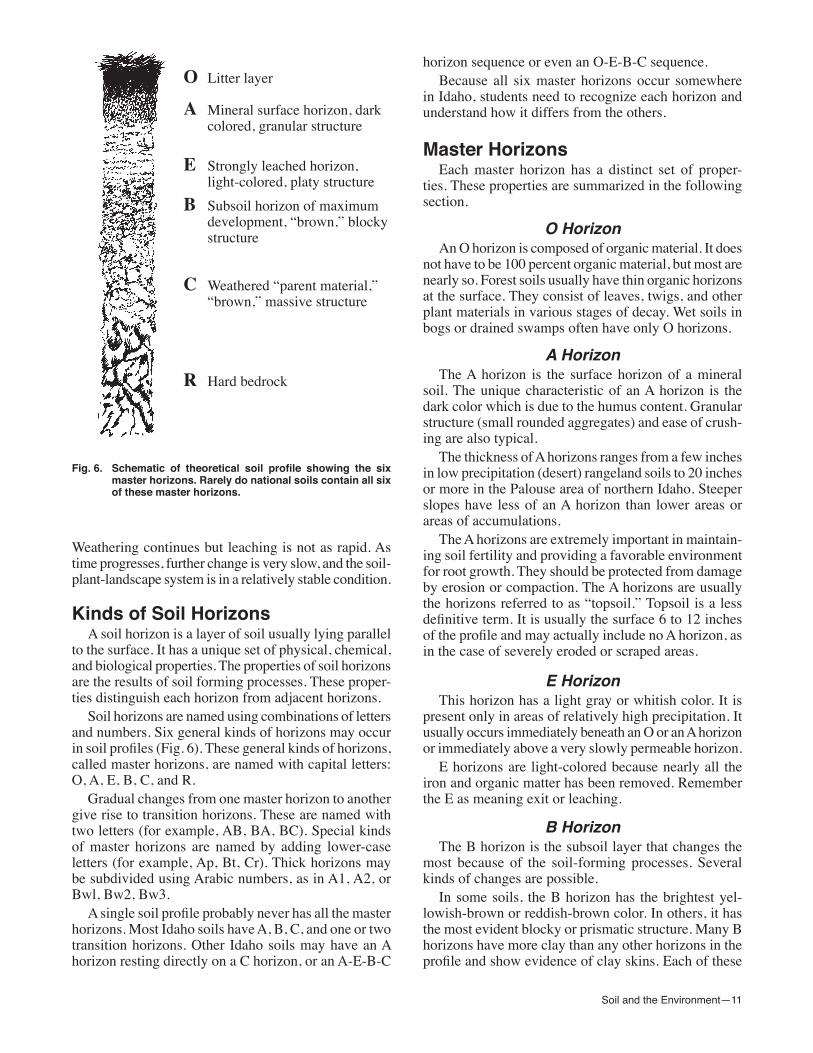
O Litter layer
A Mineral surface horizon, dark colored, granular structure
E Strongly leached horizon, light-colored, platy structure
B Subsoil horizon of maximum development, “brown,” blocky structure
C Weathered “parent material,” “brown,” massive structure
R Hard bedrock
Fig. 6. Schematic of theoretical soil profile showing the six master horizons. Rarely do national soils contain all six of these master horizons.
Weathering continues but leaching is not as rapid. As time progresses, further change is very slow, and the soil-plant-landscape system is in a relatively stable condition.
Kinds of Soil HorizonsA soil horizon is a layer of soil usually lying parallel
to the surface. It has a unique set of physical, chemical, and biological properties. The properties of soil horizons are the results of soil forming processes. These proper-ties distinguish each horizon from adjacent horizons.
Soil horizons are named using combinations of letters and numbers. Six general kinds of horizons may occur insoilprofiles(Fig.6).Thesegeneralkindsofhorizons,called master horizons, are named with capital letters: O, A, E, B, C, and R.
Gradual changes from one master horizon to another give rise to transition horizons. These are named with two letters (for example, AB, BA, BC). Special kinds of master horizons are named by adding lower-case letters (for example, Ap, Bt, Cr). Thick horizons may be subdivided using Arabic numbers, as in A1, A2, or Bwl, Bw2, Bw3.Asinglesoilprofileprobablyneverhasallthemaster
horizons. Most Idaho soils have A, B, C, and one or two transition horizons. Other Idaho soils may have an A horizon resting directly on a C horizon, or an A-E-B-C
horizon sequence or even an O-E-B-C sequence.Because all six master horizons occur somewhere
in Idaho, students need to recognize each horizon and understand how it differs from the others.
Master HorizonsEach master horizon has a distinct set of proper-
ties. These properties are summarized in the following section.
O HorizonAn O horizon is composed of organic material. It does
not have to be 100 percent organic material, but most are nearly so. Forest soils usually have thin organic horizons at the surface. They consist of leaves, twigs, and other plant materials in various stages of decay. Wet soils in bogs or drained swamps often have only O horizons.
A HorizonThe A horizon is the surface horizon of a mineral
soil. The unique characteristic of an A horizon is the dark color which is due to the humus content. Granular structure (small rounded aggregates) and ease of crush-ing are also typical.
The thickness of A horizons ranges from a few inches in low precipitation (desert) rangeland soils to 20 inches or more in the Palouse area of northern Idaho. Steeper slopes have less of an A horizon than lower areas or areas of accumulations.
The A horizons are extremely important in maintain-ing soil fertility and providing a favorable environment for root growth. They should be protected from damage by erosion or compaction. The A horizons are usually the horizons referred to as “topsoil.” Topsoil is a less definitiveterm.Itisusuallythesurface6to12inchesoftheprofileandmayactuallyincludenoAhorizon,asin the case of severely eroded or scraped areas.
E HorizonThis horizon has a light gray or whitish color. It is
present only in areas of relatively high precipitation. It usually occurs immediately beneath an O or an A horizon or immediately above a very slowly permeable horizon.
E horizons are light-colored because nearly all the iron and organic matter has been removed. Remember the E as meaning exit or leaching.
B HorizonThe B horizon is the subsoil layer that changes the
most because of the soil-forming processes. Several kinds of changes are possible.
In some soils, the B horizon has the brightest yel-lowish-brown or reddish-brown color. In others, it has the most evident blocky or prismatic structure. Many B horizons have more clay than any other horizons in the profileandshowevidenceofclayskins.Eachofthese

12—Soil and the Environment
major kinds of B horizons is discussed more fully in the next section, “Special Kinds of A, B, and C Horizons.”
The B horizons are part of the subsoil. In cases where the A horizons have been completely lost by erosion or other man-caused reason, the B horizon may be at the surface and thus constitutes the “topsoil.”
C HorizonThe C horizon is weathered geologic or parent ma-
terial below the A or B horizon. Any material that can be dug with a shovel but which has not been changed appreciably by soil forming processes is considered C horizon. The C horizon is also considered part of the subsoil.
R HorizonThe R horizon designation is used for bedrock. Bed-
rock is relatively unweathered rock material. Depend-ing on the depth to bedrock, the R horizon may occur directly beneath any of the other master horizons.
Special Kinds of A, B, and C Horizons
Many horizons are the result of unique processes that leave a distinct mark on the horizon. These horizons are identifiedwithalower-caseletterimmediatelyfollow-ing the master horizon symbol. More than 25 letters and combinations of letters are possible. This discussion will only cover the nine most commonly used symbols in Idaho.
Ap HorizonThe surface horizon of any soil that has been plowed
or cultivated is called the plow layer. This is designated with the small letter p. Cultivation thoroughly mixes the upper 8 to 12 inches of the soil and destroys any natural horizons that may have been present.
If the original A horizon was very thick (more than 8 to 12 inches), plowing converts the upper part of the horizon into an Ap horizon, and the lower part remains an A horizon. If the original A horizon was very thin, the Ap could rest on a B, C, or transition horizon. In areas where the A horizon was less than plow depth, the term “topsoil” will be synonymous with Ap horizon.
Even when a soil has been so severely eroded that all the original A is gone, plowing an exposed B or C horizon would automatically make the surface horizon an Ap.
Bt HorizonThe t designation indicates that the B horizon has
been enriched with clay and is a “textural” B horizon. Textural B horizons have distinctly more clay than the horizons above or below. The “feel” method of texture determination should show this difference.
Some of the clay comes from the horizons above
the Bt horizon. Water moving down through the soil carrieswithitsomeveryfineclayparticles.Whenthedownward movement stops, the clays are deposited, building up the waxy coatings of clay skins. Some of the clay may also come from the weathering of original minerals in the Bt. The Bt horizons are quite common in soils of high precipitation. They usually have well developed blocky or prismatic structure.
Bg HorizonThe g designation indicates that a horizon is strongly
gleyed. Gleying occurs when iron in the soil is chemi-cally reduced, and much of it has been leached out of the soil. As a result, gleyed horizons are usually dark gray, bluish, or greenish in color. They may also be mottled.
Gleyed horizons indicate that the soil is poorly or very poorly drained for long periods of time each year. Gleying is not restricted to the Bg; other gleyed horizons include Ag, BAg, BCg, and Cg. These horizons are associated with wetlands and may be restricted from being drained.
Bs HorizonThe s designation indicates a distinctive, bright
yellowish-brown or reddish-brown color that fades with depth. The Bs horizon forms when iron, aluminum, and organic matter all are leached out of surface horizons, carried downward, and deposited in the subsoil.
Bw HorizonThewreflectsaweatheredhorizon.TheBwhorizons
have been changed by weathering, but not enough to form a Bt, Bg, or Bs. The Bw horizon differs from the C horizons by having weak or moderate blocky structure. The Bw may also have a brighter color and be more leached than the C horizon. The Bw horizons are com-mon in soils of moderate precipitation or in young soils in high precipitation areas.
Bx HorizonThis designation reflects a special feature called a
fragipan. A fragipan is a massive, dense soil horizon thatisnotsufficientlycementedtobecalledahardpan.The fragipan is often mottled and has streaks of gray silt scattered throughout. It is often overlain by an E horizon. The fragipan is so dense that neither plant roots nor water can penetrate, except in cracks or root chan-nels. Soils with these horizons occur primarily in high precipitation areas under timber.
Bk HorizonThis horizon has an accumulation of calcium or other
carbonates, or free lime. Carbonates leached from upper horizons have been redeposited in the Bk horizon. White streaks, seams, or nodules of lime should be evident. These will bubble violently when a drop of hydrochloric acid (HCl) is placed on them.

Soil and the Environment—13
Some soil parent materials originally contained free lime and would react to the acid. The k is used only to indicate a horizon enriched in carbonates by transloca-tion. A Bk horizon may have an ordinary C horizon beneath that contains only its original amount of lime.
Bkqm HorizonThishorizoniscalledahardpanor,inmorescientific
language, a duripan. It is enriched with calcium carbon-ate (k) and silica (q) and is strongly cemented (m).
Duripans are common in many soils in southern Idaho. Limited rainfall leaches lime and silica from the upper10to15inchesofthesoilprofileandredepositsit in the Bkqm horizon. Thin, pinkish coatings may be present on the upper surfaces of duripan fragments. The duripan can be as thin as 1/8 inch but is usually 6 to 10 inches thick. It is so cemented that plant roots cannot penetrate.
A dense mat of roots, spreading horizontally, is a good indicator of a duripan. Sometimes, however, there are fractures in the duripan that will allow some plant roots tofindawaydownintoandthroughthehorizon.Ifthepan is shallow enough it can be broken by ripping, but this requires heavy equipment.
Cr HorizonWeathered bedrock, or rock that is soft enough to
slice with a knife or a shovel, is designated as a Cr horizon. It is rock material, with evidence of the original rock structure, but it is not hard enough to be designated R.
Transition HorizonsMaster horizons rarely change abruptly from one to
another. Instead, the changes occur gradually throughout a zone that may be 5 or 10 inches thick. These zones are called transition horizons. Three transition horizons are commonly seen.
AB HorizonThis transition horizon occurs between the A and B
horizons. It is dominated by properties of the A horizon, but some of the properties of the B horizon are evident. Dark colors associated with organic matter are fading because organic matter is decreasing. The structure often changes from granular to subangular blocky.
BA HorizonThis horizon also occurs between the A and B ho-
rizons, but it has more of the characteristics of the B horizon. Generally, the structure will be the same type as the B horizon, but less strongly expressed. The color may be a little darker than the B horizon, or the clay content may be less than the maximum in the B horizon.
BC HorizonThis is a transition from the B horizon to the C hori-
zon. Properties of the B horizon are dominant, but some influenceoftheChorizonisevident.Oftentheclaycon-tent will be less than the maximum in the B horizon but more than in the C horizon, or the color will be fading. If the C horizon is massive (no evidence of structure) andtheBChorizonhasdefiniteevidenceofstructure,the transitional BC horizon should have larger units and be more weakly expressed than in the B horizon.
Subdivisions of Thick HorizonsSometimes one or two of the horizons in a soil are so
thick that they need to be subdivided. Small changes in texture, color, or structure are commonly used to make the subdivision.
Subdivisions, or vertical sequences within any single kind of horizon, are always indicated by a number im-mediately following the letter symbol(s). Here are a few examples of how some thick soil horizons can be subdivided:
Thick A horizon—A1, A2Thick Bg horizon—Bg1, Bg2Thick Bt horizon—Bt1, Bt2Thick Bw horizon—Bw1, Bw2Thick C horizon—C1, C2
More Than One Kindof Parent Material
Parent material is the geologic materials from which soils form. It may be a river deposit, volcanic ash, clays weathered from rock in place, or one of many other kinds of materials. When all the horizons of a soil have formed in a single kind of parent material, the master horizon designations are simply A, B, C, and R.
Some soils, however, have formed in more than one kind of parent material with one overlying the other. As examples, wind-deposited silts (loess) can be laid down overbedrock;finealluvium(water-depositedmaterial)over coarse alluvium or over bedrock, and volcanic ash may be deposited on top of glacial deposits.
If soil horizons are developed in more than one parent material, the number 2 is placed in front of the master horizon designation of the second parent material. The geologic material at the surface is always assumed to be thefirstone,andthenumber1isneverused.
A third parent material is designated 3, and so on. Thus, a soil developed in silt loam over gravel could have the following set of horizons: A-AB-B-2BC-2C.

14—Soil and the Environment
Texture is an important soil property because it is closely related to many aspects of soil behavior. The ease of tilling the soil and the ease of plant root de-velopmentwithin thesoilareboth influencedbysoiltexture. Texture affects the amounts of air and water a soil will hold and the rate of water movement into and through the soil.
Plant nutrient supplies are also related to soil texture. Tiny silt and clay particles provide more mineral nutri-ents to plants than large sand grains. Sandy soils can be managed to improve their productivity, but they require more fertilizer and more frequent irrigation than soils with higher amounts of silts and clays.
Sand, silt, and clay are the three size classes of soil particles. Gravel or coarse fragments greater than 2 mm, however, are not included in texture. Sand particles range in size from 0.05 to 2 mm. They are large enough to see each grain with the naked eye, and they feel gritty.
Silt particles cannot be seen without a hand lens or
Definitions of Terms and Criteria for Land EvaluationThe following is an interpretation of the terms and
criteria used on the land evaluation scorecard.
Part I. Soil and Land Characteristics
Soil Texture (Surface Soil and Subsoil)
Texture is the proportion of sand-, silt-, and clay-sized soil particles (Fig. 7) making up the soil minerals. (In events,asampleofsoilmaterialtakenfromtheprofilewill be placed in a container at the event site to be used for estimating textures as in Fig. 5.)
Definition of Terms UsedDepending on how much sand, silt, and clay are pres-
ent, we give the texture a name like sandy loam, clay loam, or silty clay loam (Fig. 7).
Fig. 7. Soil texture triangle with 12 textural classes. For land evaluation purposes, the 12 textural classes are grouped into five categories—coarse, moderately coarse, medium, moderately fine, and fine.

Soil and the Environment—15
microscope.Silthasasmoothfeeling,likeflourorcornstarch. It is not sticky.
Clay particles are less than 0.002 mm in size. They can be seen only with extremely high-powered micro-scopes. When wet, clay feels sticky and can be molded into “ribbons” or “wires” or other forms much like modeling clay used in grade school.
Every soil contains a mixture of various amounts of sand, silt, and clay. Since there are three size classes of particles, a three-sided texturaltriangle is used to show all the possible combinations (Fig. 7). We also use the triangle to form groups, or classes of soil texture, which areidentifiedwithatexturalclassname.
A soil that is primarily sand-sized particles would lie very close to the sand corner of the triangle. Its textural class name would simply be sand.
Similarly, a soil dominated by clay would lie near the clay corner of the triangle and is called clay.
Now consider a mixtureof sand, silt, and clay. All three separates are present, though not in exactly equal proportions. (Actually, it takes less clay to balance the mixture than either sand or silt.) These soils lie in the lower center portion of the triangle and are called loams.
Now suppose we were to alter a mixture of sand, silt, and clay by adding more sand (Fig. 8). As sand begins to dominate, the texture class moves away from the center of the triangle toward the sand corner. The texture would change from loam to sandy loam and ultimately to a sand.
If we were to add clay to a loam, the textural class willmovefirsttoaclayloam,thenaclay.Ifweweretoadd both silt and clay to a loam, the textural class moves away from the center toward something intermediate between silt and clay. The textural class becomes a silty clay loam.
Precise boundaries between textural classes are shown in Fig. 7. Each side of the triangle is a base
line, or zero point, for the particle size in the opposite corner. If we know how much sand, silt, and clay a soil contains, we can easily plot its location on the triangle and determine the textural class.
Here’s a simple example. Suppose we have a soil that contains 40 percent sand, 45 percent silt, and 15 percent clay. Start with the clay content. Go to the midpoint of the baseline running from sand to silt. Then go verti-cally up to the third horizontal line. Every soil along this horizontal line contains 15 percent clay.
Next, along with the baseline between silt and sand, locate the 40 percent sand line, which runs diagonally up and to the left. Follow this line up until it intersects the 15 percent clay line. Mark that point.If youwish, you canfind the 45 percent silt line
(along the baseline between silt and clay) and follow it diagonally down and to the left to the same point. Note, however, that it only takes twopoints to determine the texture. This sample is a loam.
Field Determination of TextureDeterminesoiltextureinthefieldbywettingatable-
spoon size portion of soil with water and working the soil betweenthumbandfingers.The“feel”ofthedifferentsized soil particles, excluding gravel, is used in estimat-ing the amounts of sand, silt, and clay. Estimate sand by the gritty feeling. Estimate clay by the length of the ribbon formed (see Figs. 9, 10, and 11). The procedure for doing this is highlighted on page 16 in the next sec-tion, “Texture by Feel.”
Four key points on the textural triangle provide guidelines to classify textures. These include: 27 percent clay, 40 percent clay, 20 percent sand, and 50 percent sand. These points don’t exactly match the textural class boundaries on Fig. 7, but they’re close enough to make good estimates.
Fig. 9. A sandy loam textured soil, with 73 percent sand, 23 percent silt, and 4 percent clay, forms only a short, easily broken ribbon when squeezed between the thumb and fingers.
Fig. 8. Generalized texture triangle showing how theoretical additions of sand, clay, and silt move textural classes away from the centrally located loam textural class.

Texture by Feel1. Fill the palm of your hand with dry soil.2. Moisten the soil enough so that it sticks together and canbeworkedwiththefingers.Don’t saturate it to runny mud.Ifthesoilstickstoyourfingers,it’stoowet to feel texture. Add more dry soil.
3.Kneadthesoilbetweenyourthumbandfingers.Takeout the pebbles and crush all the soil aggregates. You may need to add a little more water.
4. Continue working the soil until you crush all the ag-gregates.
5. Estimate the sand content by the amount of textural grittiness you feel. (Continued on page 19.)
16—Soil and the Environment
Fig. 10. A silty clay loam textured soil, with 3 percent sand, 68 percent silt, and 29 percent clay, forms a smooth ribbon about an inch in length before it breaks off.
Fig. 11. A silty clay textured soil, with 2 percent sand, 54 percent silt, and 44 percent clay, can be squeezed up and between thumb and fingers to form a ribbon 2 to 3 inches long before it breaks.
Table1.Structuralandtexturalcharacteristicscommonlyassociatedwitheachoftheclassesofpermeability.Permeabilityclass Soilcharacteristics Typeofstructure Textureclass1. Rapid Many large pores, no Subangular blocky, Loamy sand, sand over 6.0 inches/hr hardpan, low percentage single grain of silt, very small amount of “sticky” clays2. Moderate High percentage of silt, Prismatic, platy, Silt, silt loam, 0.2 to 6.0 inches/hr weakly cemented hardpan, angular and subangular loam, sandy clay moderate amount of blocky, granular loam, sandy loam “sticky” clays3. Slow High bulk density, few Prismatic, platy, Silty clay loam, 0.06 to 0.2 inch/hr pores, high amount of angular blocky clay loam, “sticky” clays sandy clay4. Very slow Cemented hardpan, high Massive, columnar Clay, silty clay less than 0.06 bulk density, few pores, angular blocky inch/hr very high amount of “sticky” clay
Study the locations of these key values carefully. Note that none of the texture names below 27 percent clay contains the word clay. Texture names between 27 and 40 percent clay contain both the words clayand loam. Textural class names above 40 percent clay contain the word clay, but not the word loam.
Similarly, soils having more than 50 percent sand all have names that include the words sandor sandy. If there is less than 20 percent sand, siltor silty is usually part of the name. If soil contains between 20 and 50 percent sand, neither silt nor sand is part of the name.
Other clues to the way each kind of soil texture feels are highlighted in the following section and in Table 1.

Soil and the Environment—17
Fig. 12. Flow chart for determining soil texture by feel. Adapted from Thien, S. J., 1979, “A Flow Diagram for Teaching Texture-by-Feel Analysis,” Journal of Agronomic Education, Vol. 8:54-55 by permission of the American Society of Agronomy.

18—Soil and the Environment
Clues to the Feel of Textural ClassesSand— Moist sample collapses after squeezing.— Your hands don’t get dry working the
sample.
LoamySand— Sample has very little body.— Moist soil barely stays together after
squeezing.— Just enough silt and clay to dirty your
hands.
SandyLoam— Sand dominates noticeably.— Enough silt and clay to give the sample
body.— Moist soil stays together after squeezing.— Hardly forms any ribbon at all.
SandyClayLoam— Feels gritty and sticky.— Forms ribbon 1 to 2 inches (2.5 to 5 cm)
long.
SandyClay— Feelsdefinitelysandy.— Forms ribbon 2 to 3 inches (5 to 7.5 cm)
long.
Loam— Sand noticeably present, but does not
dominate.— Sample works easily between thumb and
fingers.
— Contains enough silt and clay to give sam-ple good body.
— Sample only forms short, broken ribbons.
SiltLoam— Feelssmooth,likeflourorcornstarch.— Tends to be nonsticky.— Only forms short, broken ribbons.
ClayLoam— Noticeably gritty, but sand doesn’t domi-
nate.— Noticeably sticky.— Noticeably hard to work between thumb
andfingers.— Forms ribbons 1 to 2.5 inches (2.5 to 6 cm)
long.
SiltyClayLoam— Feels smooth and sticky.— Contains very little sand.— Forms ribbons 1 to 2.5 inches (2.5 to 6 cm)
long.
ClayandSiltyClay— Dry sample absorbs a lot of water before it
is moist enough to work.— Sample very hard to work between thumb
andfinger.— Forms ribbon 2.5 to 4 inches (6 to 10 cm)
long.
Fig. 13. Diagrammatic representations of various soil structure types.
Subangularblocky

Soil and the Environment—19
Fig. 14. Using the tops of the two slope stakes and ignoring the irregularities of the ground surface between the stakes, the fall from the top of stake A to the top of stake B is 5 feet. This translates into a 5 percent slope.
a. More than 50 percent—Sand dominates. The tex-tural name contains the word sandy.
b. 20 to 50 percent—Sand is noticeably present but not dominant. The texture is most likely loamor clayloam, though siltloam or clayare possible.
c. Less than 20 percent—Silt and clay dominate. The textural name is siltloam, siltyclayloam, or clay.
6. Estimate the clay content by pushing the sample up be-tweenyourthumbandindexfingertoformaribbon.
a. Less than 27 percent (Fig. 9)—The ribbon is less than 1 inch (2.5 cm) long. Textural names contain the word loambut not the word clay.
b. 27 to 40 percent (Fig. 10)—The ribbon is 1 to 2 or 2.5 inches (2.5 to 5 or 6 cm) long. Textural names contain both the words clayand loam.
c. More than 40 percent (Fig. 11)—Clay dominates. The ribbon is more than 2.5 inches (6 cm) long. The textural name contains the word claybut not the word loam.
7. Combine your estimates of sand and clay. Fig. 12 shows the Thien texture-by-feel soil analysis method.
Soil scientists recognize 12 soil textural classes (Fig. 7). For the purpose of Land Evaluation Events, soilsaregroupedintofivebroadtexturalcategories.Asyou will see later, only three categories are used in the
homesite evaluation. The moderately coarse, medium, andmoderatelyfinesoilsarecombinedintotheloamytextured category.
1. Coarse-textured soils Sands Loamy sands2. Moderately coarse-textured Sandy loam soils Fine sandy loam Veryfinesandy
loam3. Medium-textured soils Loam Silt loam Silt4.Moderatelyfine-texturedsoils Clayloam Sandy clay loam Silty clay loam5. Fine-textured soils Sandy clay Silty clay Clay
Permeability Soil permeability is the ability of the soil to transmit
water or air. The soil permeability is based on the most limiting horizon, that is, the topsoil or the subsoil. Soils are placed into relative permeability classes based on soil texture and degree of cementation found in the topsoil or subsoil horizons and based on the most limiting of these properties. Soil structure (Fig. 13), bulk density (relationship between air and mineral volume), organic matter content, and other characteristics relating to pore space are also considered to a lesser extent. As the soil compaction increases, bulk density increases. Water infiltration, a termused to express the rate ofwatermovement into a soil’s surface, is related to soil perme-ability.Lowinfiltrationrateofasoil,accompaniedbyslow permeability subsoil horizon(s), may result in water runoff, erosion, and limited root development.
Sand(%)Clay(%) >50% 20to50% <20%>40 Sandy clay Clay Clay Silty clay27 to 40 Sandy clay Clay loam Silty clay loam loam<27 Sandy loam Loam Silt loam Loamy sand Sand

20—Soil and the Environment
Soil StructureSoil structure forms when individual grains of sand,
silt, and clay are bound together in larger units called pedsor aggregates. Plant roots, soil organic matter, and clay particles all provide physical and chemical binding agents. The shape of the peds formed determines the type of structure. The extent of ped formation and how distinctly the peds can be recognized together determine the gradeof the structure.Soilstructureisimportantbecauseitmodifiessome
of the undesirable effects of texture on soil behavior. Strong granular structure creates relatively large pores that favor water entry into the soil and water movement within the soil. Even clayey soils, which tend to have very small pores, can have good rates of water move-ment if they have strong granular structure.
Good granular soil structure also means good aeration and a favorable balance between pores that contain air and pores that store water for plant use. Soils with good structure are easy to work and provide ideal environ-ments for plant root growth. In short, good structure means good tilth.
Organic matter is vital to the formation and mainte-nance of good soil structure. The horizon of northern Idaho soils are naturally high in organic matter. Soil structure in these horizons tends to be well-developed, and peds resist breakdown from tillage and raindrop impact.
The horizons of southern Idaho soils are naturally low in organic matter. Soil structure tends to be weakly formed and unstable. These soils have slower entry of water(infiltration)andhaveahighererosionhazard.
Keeping up the organic matter level is essential if you want to maintain good soil structure. Incorpora-tion of animal wastes and crop residues into the soil is an excellent way to increase soil tilth. One of the real benefitsof conservation tillageprograms is that cropresidues are used to form stable soil structure. You can determine both the type and the grade of soil structure by carefully observing the soil and by gently breaking itapart.Thefirststepistoexaminethesubsoilsamplein the container to see if structural peds are evident. If you can detect the shapes of individual peds, then the grade is probably strong.Thenextstepistofillyourhandwithalargechunkof
soil. Observe how easily the soil breaks and falls apart. The easier it breaks, the stronger the structure. Observe also the shapes of the peds that lie in your hand.
Then hold a large piece of the soil in both hands and gently apply pressure to break the soil apart. If the soil breaks easily along a natural plane of weakness, you’ve separated it into distinct peds. If the soil fractures ran-domly leaving an irregular, dull surface, you’ve simply forced a break through a ped.
The ease with which the soil mass breaks into peds and the amount of unaggregated soil that remains in
your hand together indicate the structural grade. The shapes of the peds you broke out of the soil indicate the structural type.
Common types (or shapes) of soil structure include granular, platy, blocky, and prismatic(Fig. 13). Soils lacking peds are said to be either massiveor singlegrain and represent the lack of structure.
Soil DepthThe depth of the soil includes the total thickness of the
soil horizons readily penetrated by plant roots, water, and air. A restrictive layer may be dense clay (if it restricts roots), hardpan, or bedrock. Water, however, is not a restrictivelayer.Awhitenailmaybeusedintheflaggedarea to mark the depth of the soil. Information concern-ing the total depth may also be placed on the placard.1. VeryShallow—Soils less than 10 inches deep. 2. Shallow—Soils 10 to 20 inches deep. 3. ModeratelyDeep—Soils 20 to 40 inches deep. 4. Deep—Soils 40 to 60 inches deep. 5. VeryDeep—Soils over 60 inches deep.
SlopeSlope, given in percent, is the number of feet of rise
(or fall) in 100 feet of horizontal distance (run). This is one of the most important factors to be considered in good land management. Runoff increases with slope, which contributes to an increase in the erosion hazard for most uses of the land.
Slope can be measured by several methods. A transit or other surveying instrument gives the most precise measurement. Hand-held devices such as a clinometer or an Abney level are faster and usually precise enough for most purposes. Participants and advisors should practice with a clinometer before the event.Slope-measuring devices of any kind are not
permitted inanevent. The slope must be estimated byvisualobservation.Thismaybedifficult,especiallyin areas of rolling topography. Looking up a slope or down a slope can sometimes create an illusion of excess steepness or lack of steepness.
To estimate a slope (Fig. 14), stand at one end of the slope line (Point A) and project a horizontal line to the other end of the slope line (Point B). The theoretical horizontal line can be determined with the aid of the horizon or by selecting a distant point on the horizon that appears to be at an equal elevation. Estimate the distance from the top of stake B to the point on the theoretical horizontal line immediately above stake B. This is the feet of fall, and since the two slope stakes are 100 feet apart, the feet of rise (or fall) is the same as percent slope.
Move to point B, look back at point A, and use the same method to estimate the distance from the top of stake A to the theoretical horizontal line. If the estimated slopes obtained from point A and point B are the same, this is probably a good estimate of the slope. If they are

x 100 = % slope
Soil and the Environment—21
not the same, take the average of the two values.If the two slope stakes are not 100 feet apart, this
formula is used to calculate the percent slope:Rise (or fall) in feet Run in feet
Note: When the horizontal run is 100 feet, the two 100s cancel so that the feet or rise (or fall) is the same as percent slope.A further check of the estimated slope can be obtained
by standing to the side of the slope line (perpendicular) and trying to establish a theoretical horizontal line from the top of one of the two slope stakes. Again the distance from the theoretical horizontal line to the top of the other stake will give the feet of rise (or fall) from the top of one stake to the other. Establishing the theoretical horizontal line can be aided by the earth’s horizon that can be observed behind the two stakes. Averaging the three estimates may give the closest approximation of the actual slope. If a big discrepancy exists, rechecking one or more of the estimates may be warranted.
There are two possible slope groupings: (1) grouping for nonirrigated cropland, rangeland, and woodland, and (2) grouping for irrigated cropland. All irrigated crop-land is considered to be surface-irrigated. Irrigated crop-land is much more likely to have erosion problems so the permitted slopes are necessarily much more gentle. Nonirrigated cropland,range, Irrigated andwoodland cropland1. Nearly level 0 to 3% 0 to 1%2. Gently sloping 3 to 8% 1 to 3%3. Moderately sloping 8 to 12% 3 to 5%4. Strongly sloping 12 to 20% 5 to 8%5. Steep 20 to 45% 8 to 12%6. Very steep more than 45% more than 12%
Erosion—Wind and WaterErosion is the loss of soil by wind and water. Loss of
soil can be highly detrimental to crop production. The surface soil, which is usually the soil material lost, is the most productive portion of the soil. It is a fact that less productive soils are usually more erosive, thus the more a soil is eroded the more susceptible it becomes to erosion.
Soils in the land evaluation event will be evaluated on erosion that has occurred in the past. Determining the amount of erosion will be a simple calculation based on original depth of soil material and the depth of soil material existing at present. The original depth of soil material will be given on the placard. When the existing topsoildepthisdifficulttodetermine,evaluatorsmaymark the present depth of the topsoil with a white nail intheflaggedarea.Informationconcerningthepresenttopsoil depth may also be placed on the placard.
Note: Since soil horizons will vary from area to area andtheofficialevaluatorsmayinterpretthedepthsof soil material differently, the information given on the placard may vary from event to event.As an example, the original depth of topsoil given
on the placard may be given as “. . .depth of topsoil 22 inches,” which represents the soil layers readily pen-etrated by plant roots, water, and air. This is the most productiveportionofthesoilprofile.Thisinformationwill help the participant decide what part of the existing profileneeds tobemeasured (estimated) tocalculatethe soil loss. When determining the existing depth of thetopsoil,useasharpobjectoutsidetheflaggedareatofeeland/orseethefirstchangeinsoil texture,soilstructure, or soil color.
If for an example the remaining depth is 10 inches and the original depth given on the placard is 22 inches, then the formula for calculations is 12/22 x 100 = 55 percent soil loss from erosion. The following categories will be used in evaluating:1. NonetoSlight—Less than 25 percent of the soil has
been removed.2. Moderate—25 to 75 percent of the soil removed. 3. Severe—More than 75 percent of the soil removed.4. VerySevere—More than 75 percent of the soil re-
moved with frequent uncrossable gullies or severe accumulation by wind.
Surface Runoff or Surface DrainageSurface runoff results from a combination of natural
factorsincludinglandslopeandwaterinfiltrationrateof the soils. Surface runoff refers to the relative rate at whichwaterisremovedbyflowoverthesurfaceofthesoil when no vegetation is present on the soil.1. Rapid—Surfacewaterflowsrapidly.Aconsiderable
amount of precipitation is lost from the surface, which increases the hazard of erosion and reduces available water for plants. This may be critical under nonir-rigated cropland. Fields with slopes of 3 percent and above (except for coarse-textured and moderately coarse-textured surface soils) would be placed in this category.
2. Moderate—This is considered as “normal” runoff from soils with slopes of 1 to 3 percent (except for coarse-textured and moderately coarse-textured sur-face soils).
3. Slow—Surfacewaterflowsawayslowlyandsurpluswater may be a problem. This category includes nearly level areas (less than 1 percent slope) with medium-andmoderatelyfine-texturedsurfacesoils.Included in this category are all soils with coarse-textured or moderately coarse-textured surfaces with all slopes.
4. VerySlow—Surfacewaterflowsawayveryslowly.Includes soils on nearly level slopes (less than 1 percent)withfine-texturedsurfacesoil.

22—Soil and the Environment
Subsoil or Internal DrainageSubsoil drainage is that quality of a soil that permits
thedownwardflowofexcesswaterthroughtheprofile.Free water (a water table) is sometimes present in a soilprofile.Wherenotobvious,thedepthofthewatertablewillbegivenontheplacard.Thedefinitionsbelowconsiderbothmovementofwaterthroughthesoilprofileand the presence of a water table:1. Excessively—Rarely saturated with water and excess
amounts drain away quickly, causing droughty condi-tions. Includes only rapidly permeable soils.
2. Well—Saturation with water is limited to only a few days, and plant roots are not injured.
3. SomewhatPoorly—Saturation with water (water table)inrootzone(upper4feetofprofile)islimitedto 1 or 2 weeks each year during the growing season. This will injure plant roots.
4. Poorly—Saturation with water (water table) in root zone(upper4feetofprofile)for2to12weekseachyear during the growing season. This severely injures plant roots so that crop yield is appreciably reduced or the crop is destroyed. Few visible mottles.
5. VeryPoorly—Saturation with water (water table) in root zone during most of growing season (more than 12 weeks). Suitable only for grazing and hay production. These soils have many visible mottles.
ClimateClimatic limitations affect crop production and thus
areconsideredinlandcapabilityclassification.Ashortgrowing season and low natural precipitation where irrigation water is unavailable are limitations in many parts of Idaho. Availability of irrigation water will be given on the placard. 1. Good—More than 140 frost-free days along with 14
or more inches of average annual precipitation. If less than 14 inches of average annual precipitation occurs, irrigation water must be available.
2. Fair—100 to 140 frost-free days and/or 10 to 13 inches of average annual precipitation. If less than 10 inches of average annual precipitation occurs, irrigation water must be available.
3. Poor—Less than 100 frost-free days and/or less than 10 inches of average annual precipitation with irriga-tion water not available.
Major FactorsThe following major factors are considered in select-
ing the land capability class. Any one or more factors that would keep the area out of Class I land will be checked. 1. SurfaceTexture—Surface soil texture is a major
factor for coarse-textured, moderately coarse-textured, andfine-textured soils.Coarse-texturedsoils can be no better than Class III because of wind erosion hazard.
2. SubsoilTexture—Subsoil texture is a major factor forcoarse-texturedandfine-texturedsoilsonly.
3. Permeability—Only rapid and very slow per-meabilities will be major factors.
4. Depth—Only moderately deep, shallow, and very shallow soils will be major factors.
5. Slope—Any slopes more than nearly level will be major factors.
6. Erosion—All conditions except none to slight will be major factors.
7. SurfaceRunoff—Only rapid or very slow will be major factors.
8. SubsoilorInternalDrainage—Excessive, some-what poor, poor, and very poor drainage conditions will all be major factors.
9. Climate—Fair and poor climates are major factors. 10. None—Class I land, with no major factors.
Land Capability ClassesThe following are broaddefinitions. See “General
Guide for Selecting Land Capability Classes” (page 23).Land suited for cultivation and other uses
such as grassland, forestry, wildlife, and recreation.ClassI—These soils have few limitations that restrict
their use.ClassII—These soils have some limitations that reduce
the choice of plants, or require special conservation practices, or both.
Class III—These soils have severe limitations that reduce the choice of plants, or require special con-servation practices, or both.
Class IV—These soils have very severe limitations that restrict the choice of plants, or require careful management, or both.Land suited for grassland, forestry, wildlife, and
recreation. Not suited for cultivation.ClassV—These soils have little or no erosion hazards
(nearly level slopes) but they have very poor drainage, which limits their use largely to grassland, hayland, wildlife habitat, or wetlands area.
ClassVI—These soils have severe limitations that make them generally unsuited for cultivation and limit their use largely to grassland, woodland, or wildlife habi-tat.Theymaybecultivatedsufficientlytoestablishpermanent cover.
ClassVII—These soils have very severe limitations that restrict their use mostly to grassland, wood-land, or wildlife habitat. Use is restricted to pasture grasses, wildlife, recreation, woodland watershed, and aesthetics.
ClassVIII—These soils and land forms have limitations that preclude their use for commercial plant produc-tion and restrict their use to wildlife, recreation, water supply, or aesthetic purposes.

Soil and the Environment—23
General Guide for Selecting Land Capability Classes
Soilfactor BestlandclasspossibleA. Surface Texture Coarse-textured III Moderately coarse-textured II Medium-textured I Moderatelyfine-textured I Fine-textured IIB. Subsoil Texture Coarse-textured II Moderately coarse-textured I Medium-textured I Moderatelyfine-textured I Fine-textured IIC. Permeability Rapid III Moderate I Slow I Very slow IIID. Depth—Surface and Subsoil Very shallow VII Shallow IV Moderately deep III Deep I Very deep IE. Slope Nearly level I Gently sloping II Moderately sloping III Strongly sloping IV Steep VI Very steep VIIF. Erosion Loss None to slight I Moderate II Severe VI Very severe VIIIG. Surface Runoff Rapid III Moderate I Slow I Very slow IIH. Drainage Excessively III Well I Somewhat poorly II Poorly IV Very poorly VI. Climate Good I Fair II Poor III
Part II. Recommended Land Treatments
Recommendations for land treatments are based on the highest and best potential use of the land. Regard-lessofthepresentuseofthe“field,”recommendedlandtreatments should be based on the land capability class. The following are land treatment considerations to be applied in the management of different land capability classes:
Vegetative1 through 4. ConservationCropping Systems—
These practices apply to the use of rotations that contain grasses and legumes (soil conserving and/or improving crops) as well as sequences in which thedesiredbenefitsareachievedwithoutuseofsuchcrops. Soil-conserving crops are close-seeded crops that tend to prevent or retard erosion and maintain organic matter. Soil-improving crops are grasses and legumes that improve soil structure and tilth, organicmatter levels, andwater infiltration.Usesoil conserving and/or improving crops as follows:a. Not necessary—applicable to Class I.b.Everyfourthorfifthyear—applicabletoClass
II.c. Every third or fourth year—applicable to Class
III.d. Every second or third year—applicable to Class
IV.5. CropsResidueUse—Use plant residues in cul-tivatedfields toprevent erosionand improve thesoil. Do not burn residues. Applies only to potential cultivated soils (classes I, II, III, or IV). Even if the “field”isnotpresentlyusedforcultivatedcrops,butthe soil has the potential for cultivated crops, this category should be marked.
6. WeedControl—Could apply to all land classes. In general,fiveormoreweedplantsoranynoxiousweedwithintheboundaryofthefieldbeingevalu-ated would be considered a weed problem. However, because there could be different interpretations of what determines a weed (alive or dead, native or not part of the current crop) in a given area or land evaluation site the weed control box will always be marked for all land classes. No information will be given on the placard concerning noxious weed problems or other weeds.
7. StripCropping—Using alternate strips of land for various crops or fallow conditions to control water and wind erosion. Would apply to land classes III and IV (nonirrigated).
8. BrushandTreeControl—This implies the use of chemical sprays and/or specialized machinery. The purpose is to improve the desirable vegetative cover by removing or killing undesirable brush, trees, or timber so that the land can be farmed as is

24—Soil and the Environment
the case for land classes I to IV. This practice should not be used when brush material can be controlled by normal farm plowing—Sagebrush, rabbitbrush, and similar plants can usually be removed with normal land preparation, so their removal would not be considered to be brush control. For pasture, range, wildlife, or woodland (classes V and VI) normal land preparation will remove undesirable brush, trees, or timber that may inhibit improved grass production, so their removal would not be considered to be brush control. In wetland or riparian areas the planting of brush and trees is encouraged especially in land classes VII and VIII and should not be removed.
9. GrassesandLegumes—This practice is to be used on lands not producing suitable permanent vegeta-tion or on idle or cultivated lands not suitable for cultivated crops. Because of differences in interpre-tation as to what is considered suitable and practical, this practice will be used for all land classes V, VI, and VII except where tree plantings are made.
10. Pasture,Range,HayManagement—Use proper treatments of grasses and legumes to maintain optimum vegetative production. Only apply this practice on Land Classes V and VI, where reseeding is planned. If reseeding is planned, that information will be given on the site placard.
11. TreePlanting—Planting tree seedlings or cuttings to establish a stand of forest trees. Not suitable for Class V lands.
12. WoodlandHarvestCutting—Removing market-able trees from woodland.
13. Wildlife,Recreation, andWatershed—Retain-ing, establishing, or managing wildlife habitats and watersheds and installing needed structures or revegetation for recreation, wetland, and riparian management lands (includes Class V through VIII).
Mechanical—Irrigated/Dryland OnlyFor Classes I, II, III, and IV, Irrigated Land Only
14. SprinklerIrrigation(forslopes>3percent)—On slopes >3 percent, a sprinkler system is recom-mended to reduce potential surface erosion. If this occurs, mark this category.
15. IrrigationWaterManagement—Use and man-agement of irrigation water so that the quantity of water used for each irrigation is determined by the moisture-holding capacity of the soil and the need of the crop (evapotranspiration). This means applying the water at such a rate and in such a manner that the cropscanuseitefficiently,andsignificanterosionand leaching does not occur.
16. WaterControl Structures (for slopes <3 per-cent)—For water management in a surface irrigation system, structures are needed to convey water. They
may include diversions, canals, ditches to control directionorrateofflow,maintainadesiredwatersurface elevation, and remove excess tail-water and sedimentsattheendofthefield.Ifallofthesearenotincludedinthefield,markthiscategory.
For Classes I, II, III, and IV, Dryland Only17. DiversionorTerrace—A channel with a support-
ing ridge on the lower side constructed across the slope, or an earth embankment or ridge and channel constructed across the slope at a suitable spacing and grade. Used on moderately sloping land.
18. GrassWaterway—A natural waterway or outlet shaped or graded with suitable vegetation as needed for the safe disposal of runoff. Used on moderately sloping lands.
19. ContourFarming—Conducting farming opera-tions on sloping land in such a way that plowing, land preparation, planting, and cultivation are done on the contour. Used on moderately or strongly sloping land ranging from 8 to 20 percent.
20. PlowUphill—Severe tillage erosion occurs on mod-erately and strongly sloping land (8 to 20 percent slopes) when the plow furrow-slice is continually thrown downhill. On these lands all moldboard plowing should be limited and done only by throw-ing the furrow slice uphill. In addition to preventing tillage erosion, this also tends to leave more surface residue and a rougher surface, which reduces runoff on moderately and strongly sloping land.
Mechanical—Irrigated and DrylandFor Classes I, II, III, and IV, Both Irrigated and Dryland
21. SubsurfaceDrainageSystem—A graded ditch or buried tile of a designated size for collecting subsur-facewaterwithinafieldorarea.Used on somewhat poorly and poorly drained areas and only where these systems have been used historically. Instal-lation of a drainage system is no longer allowed because of federal wetland regulations. Very poorly drained areas should be restored to their original conditions.
22. MinimumTillage—Limiting the number of cultural operations to those that are properly timed and es-sential to produce a crop and prevent soil erosion, compaction, and structural changes. Minimum till-age is also essential to decreasing soil erosion by increasing the amount of crop residue left on the soil surface.
Fertilizers and Soil AmendmentsUse fertilizer materials and soil amendments as de-
termined by soil tests to achieve economical responses, optimum production, and improve the soil.

Soil and the Environment—25
Soil test information for the “field” pertaining toneedforlimeorgypsumandtocorrectdeficienciesofnitrogen (N), phosphorus (P), potassium (K), and zinc (Zn) will appear on the placard. Information given will include soil pH and concentrations (ppm) of N, P, K, and Zn. Also, the availability of organic materials, such asmanure,whichcanbeappliedtothe“field,”willbegiven on the placard.
No set limits on lime, gypsum, or fertility require-mentswillfitallareasandallcrops.Eachhasitsownlevels. This is to acquaint the participants with present day terminology and provide some practical knowledge about soil amendment and soil fertility needs for Idaho crops and soils.
Levels of nutrients needed in soils (indexes) to pro-duce crops depend on extraction methodology and have tobecorrelatedtofieldresponseinresearchtrials.23. Nitrogen—Low levels of N in Idaho soils are less
than 20 ppm NO3-N in the plant root zone. However, soils up to 40 ppm of NO3-N do require additional N as commercial fertilizers for most crops (other than legumes). When values of less than 40 ppm are shown on the placard, check No. 23 on the scorecard. Excessive N fertilizer should be avoided to decrease the NO3-N leaching potential.
24. Phosphorus—Low levels of P in Idaho vary with the soil characteristics and the crop being grown. In general, apply P fertilizer when a soil test in the sample taken to the 12-inch soil depth is below 6 ppm on acid soils (pH less than 7.0) and 15 ppm on alkaline soils (pH greater than 7.0). A pH of 7.0 will not be used in the contests. When P fertilizer is needed, check No. 24 on the scorecard.
25. Potassium—Low levels of K in Idaho also vary with the soil characteristics and the crop being grown. In general, apply K fertilizer when the soil test in the sample taken to the 12-inch soil depth is below 80 ppm on acid soils (pH less than 7.0) and below
150 ppm on alkaline soils (pH greater than 7.0). A pH of 7.0 will not be used in the contests. Check No. 25 on the scorecard when K is needed.
26. Micronutrients—Zinc is the most common micro-nutrientforwhichdeficiencieshavebeenobservedin Idaho soils. When zinc levels are shown below 0.6 ppm in the soil sample taken from the 0- to 12-inch soil depth, check No. 26 on the scorecard.
27. Lime—Soils with pH values of 4 to 5 usually re-quire lime for maximum crop production. When fieldpHvaluesarelessthan5.7,checkNo.27onthe scorecard.
28. Gypsum—Soils having pH values above 8.5 are called alkali (sodic or sodium-affected) soils and may require a source of calcium to replace the so-dium to allow correction of the problem. Gypsum is a good source of calcium. If the soil pH is greater than 8.5, check No. 28 on the scorecard.
29. OrganicMatter—Livestock manures, composts, or other organic materials are valuable in increas-ing soil organic matter. When any organic material is shown on the placard as being available for use, check No. 29 on the scorecard.
30. FertilizerorAmendmentsNotNeeded—When all nutrients are high in the soil, no organic material is available and pH values are between 5.7 and 8.5, check No. 30 on the scorecard.
Example—Information on the placard shows: Soil pH 7.5 ppm Nitrogen (NO3N) 20 ppm Phosphorus (P2O5) 8 ppm Potassium (K2O) 300 ppm Zinc 2 ppm
No statement that manure or compost is available. On the scorecard, check No.’s 23 (nitrogen) and 24 (phosphorus).
Homesite EvaluationThis part of the event is designed to emphasize the
importance of soils and their limitations for non-agricul-tural purposes. Many of the soil and land characteristics used in evaluating soils for agricultural use will also be used in evaluating an area for a homesite. The event is based on use of the site for a single family dwelling without a basement, and related uses.
While this event/activity is limited to homesites, the importance of a soil’s suitability for parks and play-grounds, roads streets, and other nonagricultural uses could also be stressed.
Limitations for Nonagricultural UseThe discussion of individual soil characteristics to be
consideredarerelatedtolimitationsforaspecificuse.Thelimitationsaredefinedasfollows:
Slight—Those soils or locations that have properties favorable for the planned use with little or no problems.Moderate—Those soils or locations that have prop-
erties only moderately favorable for the planned use. Limitationscanbeovercomeormodifiedwithspecialplanning, design, or maintenance. Special treatment of the site for the desired use may be necessary.Severe—Those soils or locations that have one or
more properties unfavorable for the planned use. Limi-tationsaredifficultandcostlytomodifyorovercomefor the use desired.VerySevere—Those soils or locations that have one
or more features so unfavorable for a particular use that overcomingthelimitationisverydifficultandexpen-sive. For the most part, these kinds of soils should not be used for the purpose for which they are being rated.

26—Soil and the Environment
Fig. 15. Soil texture triangle for homesite evaluation with the three textural groupings—sandy, loamy, and clayey.
Factors Affecting SuitabilityTexture
This refers to the texture of the surface soil. (See Land Evaluation section on pages 14-19 for help in determining soil texture.) Surface texture is not a factor for sewage lagoons because lagoons are dug below the surface, and most of the surface soil is used to make the banks around the lagoon. You will notice that the textural groupings for homesite evaluation are different from those used in land evaluation. In homesite evalu-ation, only three soil textural groupings are used (Fig. 15)insteadofthefivesoiltexturalgroupingsusedinland evaluation.1. Sandy soils (coarse-textured Sands soils) Loamy sands2. Loamy soils (moderately Sandy loam coarse-, medium-, and Loam moderatelyfine-texturedsoils) Siltloam Clay loam Sandy clay loam Silty clay loam
3.Clayeysoils(fine-texturedsoils) Sandyclay Silty clay ClaySandySoils—Moderate limitations for all uses. May
require stabilization with organic material and/or loamy topsoil to improve capability of the soil to hold and supply moisture and nutrients for desired plant growth. Water and wind erosion may be a problem during con-struction. Shrink-swell potential is very low.LoamySoils—None to slight limitations for all uses.
Exercise care during construction to be sure the surface soil is not covered by less desirable subsoil material.ClayeySoils—Severe limitations for uses other than
sewage lagoons. Soil is sticky when wet, hard when dry,anddifficulttoworkwhenusedforlawns,flowerbeds, shrubs, and gardens. The soils crack when dry and swell when wet. Clayey soils have a high shrink-swell potential. Special planning and design are required for foundations. May be droughty and need frequent addi-tions of low rates of water for establishing and maintain-ing vegetative growth.

Soil and the Environment—27
Table3.Effectofslopeonlimitationsforahomesite.Site Slope Foundations Lawn,shrubs, Septic Sewagecharacteristic (%) w/obasement andgardens system lagoonNear level 0 to 3 None to slight Moderate None to slight None to slightGently sloping 3 to 5 None to slight None to slight None to slight None to slightModerately sloping 5 to 8 Moderate Moderate None to slight ModerateStrongly sloping 8 to 15 Severe Severe Moderate SevereV. strongly sloping over 15 V. severe V. severe Severe V. severe
Table2.Effectofsoildepthonlimitationsforahomesite.Site Depthin Foundations Lawn,shrubs, Septic Sewagecharacteristic inches w/obasement andgardens system lagoonV. shallow less than 10 Severe V. severe V. severe V. severeShallow 10 to 20 Moderate Severe V. severe V. severeModerately deep 20 to 40 None to slight None to slight Severe SevereDeep 40 to 60 None to slight None to slight Moderate ModerateVery deep over 60 None to slight None to slight None to slight None to slight
PermeabilityThis refers to the rate of movement of water or air
through the subsoil. This is considered internal drainage and is based on soil texture and soil structure. (For help in determining soil permeability, refer to Land Evalua-tion section on pages 16 and 19.)
Laterals for septic systems may be located below the subsoil in some soils. For that reason, this should serve asawarning,andfinaldesignshouldbebasedonade-tailed on-site evaluation to determine suitability where soils are slowly permeable. It is an important factor in deciding between a septic tank system or a sewage lagoon. Soil percolation tests would be required before making further plans.RapidPermeability—Soils generally are sandy loam
or sandy textured throughout. Permeability is greater than 6.0 inches per hour. Moderate limitations exist in useforseptictanksystemdisposalfieldduetothefactthat sewage water may be percolated away too rapidly. (1) Slight limitations also exist for foundations; (2) moderate limitations for lawns, shrubs, and gardens; and (3) very severe limitations for sewage lagoons. Seepage fromlagoonswouldmake itdifficult tomaintainad-equate depth of water and could contribute to pollution of groundwater. Moderate Permeability—Slight to moderate
limitations. Soils are generally medium textured, but also includes silty clay loam or clay loam with strong structure or compacted sandy loam. (1) None to slight limitations for septic tank systems, lawns, shrubs, and gardens. Permeability ranges (0.2 to 6.0 inches per hour) would indicate a need for a percolation test if thought to be on the low side of the range. (2) Moderate limitations for sewage lagoon as leakage may occur. None to slight limitations for foundations.SlowPermeability—Severe limitations for septic
tank systems. Soils generally would include moderately
fine-texturedsoilswithweaktomoderatestructureandfine-texturedsoilswithstrongstructure.Watermove-ment is 0.06 to 0.2 inch per hour. Percolation tests would be required for design of septic tank disposal field.Limitationswouldbe(1)none to slight for sew-age lagoons, (2) moderate for foundations and lawns, shrubs, and gardens.VerySlowPermeability—Very severe limitations
for septic tank systems. Soils arefine-textured (siltyclay, sandy clay, and clay). Soil structure is usually not well developed with tendency toward massive (without structure). Water movement is less than 0.06 inch per hour. Percolation tests would be required for design of septictankdisposalfield.Limitationswouldbe(1)none to slight for sewage lagoon, (2) moderate for founda-tions, and (3) severe for lawns, shrubs, and gardens.
Soil DepthThe depth of the soil includes the total thickness of
soil layers readily excavated for construction purposes. These are also the soil layers that are readily penetrated by plant roots, water, and air. A restrictive layer is clay, hardpan, or bedrock. The degree of limitation due to restricted soil depth will vary greatly for different uses. Use Table 2 as a guide for evaluation of soil depth for desired uses.
SlopeSlope of the land, given in percent, is the number of
feet of rise (or fall) in 100 feet of horizontal distance (run). For further explanation and guides to estimating slope, see discussion of slope under the Land Evaluation section (pages 19 and 20). Broader and different slope groupings are used for homesite consideration than normally apply to agricultural uses of the land. Table 3 will aid in the interpretation of limitations based on the slope of the site.

28—Soil and the Environment
Table4.Depthtowatertable. SepticsystemsDegreeoflimitations Foundationsforbuildings Lawnsandlandscaping absorptionfields Sewagelagoons (inches) (inches) (inches) (inches)Slight more than 36 more than 24 more than 72 more than 60Moderate 24 to 36 12 to 24 48 to 72 36 to 60Severe less than 24 less than 12 less than 48 less than 36
ErosionErosion is the loss of soil material due to the action
of wind and water. Loss of soil can be highly detrimen-tal to homesite and other uses of the land. The surface soil, which is usually the soil material lost, is the most productive portion of the soil. The loss of topsoil or surface soil is not as critical for homesite uses as it is for agricultural uses. This is true because the small area involved in a homesite allows developers to haul in topsoil to replace the loss.
Soils in the event will be evaluated on erosion that has occurred in the past. The determination of the amount of erosion will be a simple calculation based on original depth of soil material (given on the placard) and the amount of soil lost to reach the presently existing depth. For further information on calculating losses, see discus-sion of erosion under Land Evaluation section (page 21).None,Slight,andModerate(less than 75 percent of
soil lost)—None to slight limitations for all uses.Severe(75 to 100 percent of soil lost)—Slight limi-
tations for foundations, severe limitations for lagoons, and moderate limitations for other uses. May require leveling,modificationofsurface,orbringingintopsoilfor lawns, gardens, septic systems, etc. VerySevere(75 to 100 percent soil lost with uncross-
able gullies)—Very severe limitations to all uses.
Surface RunoffThis is generally an important factor in connection
with drainage, permeability, and erosion. Special atten-tion needs to be given to surrounding areas including featuresoutsidethesiteor“field”beingevaluated.Run-off from adjacent areas onto contemplated building site and the possibility of ponding and water accumulations on the homesite need consideration. Surface runoff is not a factor for sewage lagoons because they will be protected from outside water.Rapid—Occurs on slopes greater than 3 percent but
does not include sandy-textured surface soils. Severe limitations require care to maintain and prevent erosion on lawns. None to slight limitations for foundations or septic system. Moderate—None to slight limitations for all uses.
Occurs on slopes of 1 to 3 percent, but does not include sandy surface textures.Slow—Occurs on sandy-textured surface soils on all
slopes. None to slight limitations for all uses.
VerySlow—Occurs on slopes (<1 percent), but does not include sandy-textured surface soils. Severe limita-tionsmayrequirecostlymodificationforfoundationsandspecialdesignofseptictankdisposalfields.Moder-ate limitations for lawns, shrubs, and gardens.
Shrink-SwellShrink-swell is the property of soil to swell when it
is wetted and to shrink when it dries. The tendency to shrink and swell is related to the amount and type of clay present. Because it is important in foundation de-sign, this factor should have special consideration. The mostclayeylayerintheprofileisgenerallyconsideredin relation to shrink-swell. In the event, consider the shrink-swell of the heaviest (most clayey) of the surface soil or subsoil. Shrink-swell is not generally a factor for lawns, shrubs, and gardens.Low—Soil texture classes included in this category
are sands, loamy sands, and all sandy loams. There are none to slight limitations for all uses.Moderate—Soil texture classes included in this
category are silt, silt loam, loam, clay loam, silty clay loam, and sandy clay loam. There are none to slight limitations for sewage lagoons and moderate limitations for other uses.High—Sandy clay, silty clay, and clay texture classes
fall into this category. These have severe limitations for foundations, septic systems, and other uses except none to slight limitations for sewage lagoons.
Water TableTheinternalwetnessofanareaisinfluencedbymost
of the factors previously discussed. Generally, internal drainageisareflectionofpermeabilityandtopographicposition. For example, a very slowly permeable soil ex-hibits poor to very poor internal drainage. The presence anddepthofawatertableisnotnecessarilyareflectionof soil permeability. It must be evaluated on the basis of depth and permanency, frequently requiring study during different seasons of the year. Attention should begiventofeaturesoutsidethe“field”beingevaluatedwith special attention to topographic position, stream channels, and evidence of a water table. Unless obvi-ous,watertabledepthorseasonalfluctuationswillbegiven on the placard. Use Table 4 as a guide for water table depth.Deep—None to slight limitations for all uses. No
evidence of water table above 72 inches.

Soil and the Environment—29
ModeratelyDeep—Temporary or permanent water table present at depth of 48 to 72 inches.Shallow—Temporary or permanent water table at
depths less than 48 inches.
FloodingTheoccurrenceoffloodsisafactorfrequentlyover-
looked. Flooding may not occur on an area for many years;thenaseriousfloodmayoccur.Urbandevelop-ment on a small stream watershed can increase runoff upto75percent,thusgreatlyincreasingfloodinghaz-ard. Soils can give an indication, but records must be studied to determine the true condition. Position on the landscape and proximity to nearby streams are good indicatorsof frequencyofflooding.Attention shouldbegiventofeaturesoutsidethe“field”beingevaluated.Frequencyoffloodingwillbegivenontheplacardatthe site.
None—Noflooding.Limitationsnonetoslightforall uses.Occasional—Flooding occurs infrequently under
usualweatherconditions.Foraperiodofrecord,flood-ing occurs 50% or less of the time. Moderate limitations exist for foundations, lawns, shrubs, and gardens; severe limitationsexistforseptictankdrainfieldsandsewagelagoons. Frequent—Flooding occurs infrequently under usual
weather conditions. For a period of record, floodingoccurs more than 50% of the time. Very severe limita-tions exist for development, i.e., for foundations, lawns, shrubs,gardens,septicsystems(septictankdrainfields),and sewage lagoons. Forexample,iffloodingoccursatasitein5(orfewer)
years out of 10, mark “occasional” on the scorecard. If floodingoccursatasite6ormoreyearsoutof10,mark“frequent” on the scorecard.
Land Evaluation Scorecard—Part I1. Part I (left side) of the scorecard deals with charac-
teristics of the soil and land that the participant must determineaboutthefield.
2. Place an “X” in the appropriate box or boxes to mark your answers.
Land Evaluation Scorecard—Part II1. Part II (right side) of the scorecard deals with selecting
the land capability class and picking appropriate rec-ommended land treatments or conservation practices that you decide are necessary based on characteristics found in Part I.
2. Using the information from major factors, select the Land Capability Class by placing an “X” in the ap-propriate box.
3. In the Vegetative, Mechanical, and Fertilizer/Soil Amendment sections, place an “X” in the box pre-ceding the treatment that should be used. (Note: For scoring, any incorrectly marked or incorrectly not-marked item will be counted wrong.)
How To Use the ScorecardsHomesite Evaluation Scorecard1. Part I of the scorecard deals with soil and land
characteristics that the participant must determine aboutthefield.Placean“X”intheappropriateboxto indicate site characteristics. With the exception of shrink-swell,watertable,andflooding,thefactorsaresimilar to those for land evaluation. Do not make a straight checkoff from the land evaluation to homesite scorecard, however. While the factors are the same, different separations are made.
2. After selecting the site characteristic in Part I, deter-mine the severity of limitations that the characteristic imposes on the planned uses listed in Part II of the scorecard and mark the appropriate box with an “X.”
3. Summarize the limitations for each of the four uses by selecting the worst degree of limitation for a use and carrying it down to the bottom of the column and marking the appropriate box with an “X.”
4.The“finalevaluation”ofthesite, inthelowerleftbox, is a summary of the limitations of the four uses.
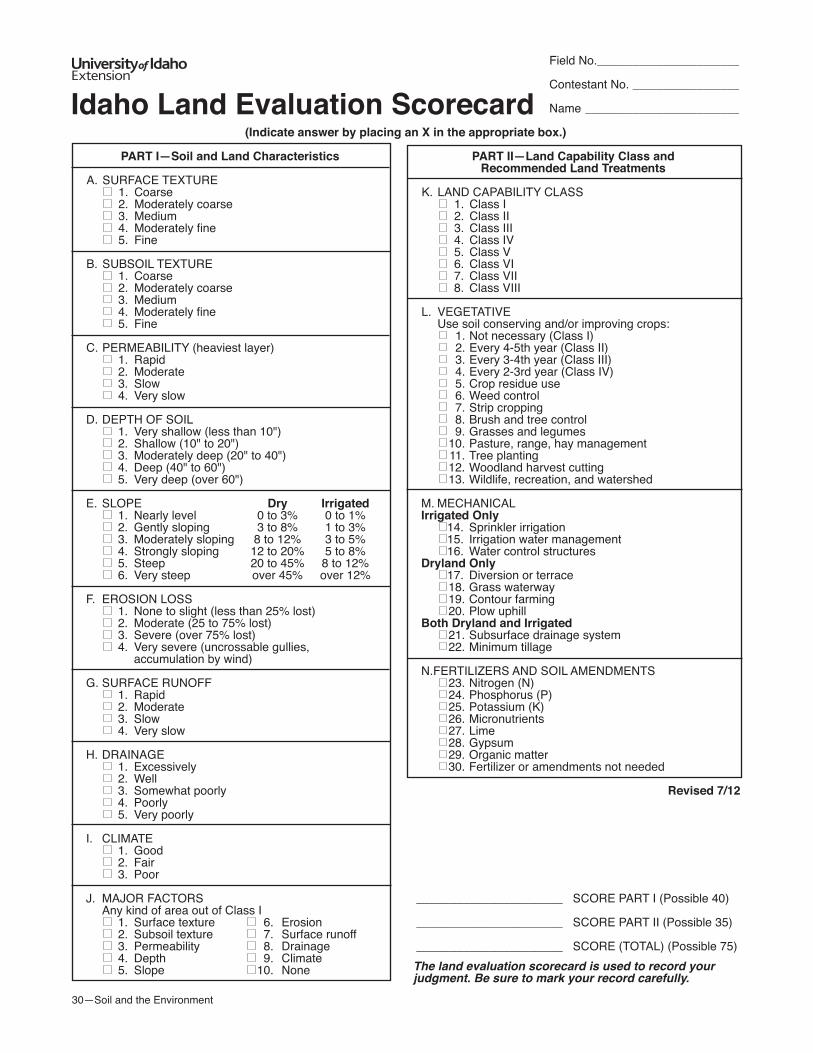
30—Soil and the Environment
Field No.________________________
Contestant No. __________________
Name __________________________
(Indicate answer by placing an X in the appropriate box.)
PART I—Soil and Land Characteristics PART II—Land Capability Class and Recommended Land TreatmentsA. SURFACE TEXTURE 1. Coarse K. LAND CAPABILITY CLASS 2. Moderately coarse 1. Class I 3. Medium 2. Class II 4. Moderatelyfine 3. Class III 5. Fine 4. Class IV 5. Class VB. SUBSOIL TEXTURE 6. Class VI 1. Coarse 7. Class VII 2. Moderately coarse 8. Class VIII 3. Medium 4. Moderatelyfine L. VEGETATIVE 5. Fine Use soil conserving and/or improving crops: 1. Not necessary (Class I)C. PERMEABILITY (heaviest layer) 2. Every 4-5th year (Class II) 1. Rapid 3. Every 3-4th year (Class III) 2. Moderate 4. Every 2-3rd year (Class IV) 3. Slow 5. Crop residue use 4. Very slow 6. Weed control 7. Strip croppingD. DEPTH OF SOIL 8. Brush and tree control 1. Very shallow (less than 10") 9.Grassesandlegumes 2. Shallow (10" to 20") 10. Pasture, range, hay management 3. Moderately deep (20" to 40") 11. Tree planting 4. Deep (40" to 60") 12. Woodland harvest cutting 5. Very deep (over 60") 13. Wildlife, recreation, and watershed
E. SLOPE Dry Irrigated M. MECHANICAL 1. Nearly level 0 to 3% 0 to 1% Irrigated Only 2. Gentlysloping 3to8% 1to3% 14. Sprinklerirrigation 3. Moderately sloping 8 to 12% 3 to 5% 15. Irrigation water management 4. Strongly sloping 12 to 20% 5 to 8% 16. Water control structures 5. Steep 20 to 45% 8 to 12% Dryland Only 6. Very steep over 45% over 12% 17. Diversion or terrace 18.GrasswaterwayF. EROSION LOSS 19. Contour farming 1. None to slight (less than 25% lost) 20. Plow uphill 2. Moderate (25 to 75% lost) Both Dryland and Irrigated 3. Severe (over 75% lost) 21. Subsurface drainage system 4. Very severe (uncrossable gullies, 22. Minimum tillage accumulation by wind) N. FERTILIZERS AND SOIL AMENDMENTS G.SURFACERUNOFF 23.Nitrogen(N) 1. Rapid 24. Phosphorus (P) 2. Moderate 25. Potassium (K) 3. Slow 26. Micronutrients 4. Very slow 27. Lime 28.GypsumH.DRAINAGE 29.Organicmatter 1. Excessively 30. Fertilizer or amendments not needed 2. Well 3. Somewhat poorly Revised 7/12 4. Poorly 5. Very poorly
I. CLIMATE 1. Good 2. Fair 3. Poor
J. MAJOR FACTORS ______________________ SCORE PART I (Possible 40) Any kind of area out of Class I 1. Surface texture 6. Erosion ______________________ SCORE PART II (Possible 35) 2. Subsoil texture 7. Surface runoff 3. Permeability 8. Drainage ______________________ SCORE (TOTAL) (Possible 75) 4. Depth 9. Climate 5. Slope 10. None The land evaluation scorecard is used to record your judgment. Be sure to mark your record carefully.
Idaho Land Evaluation Scorecard
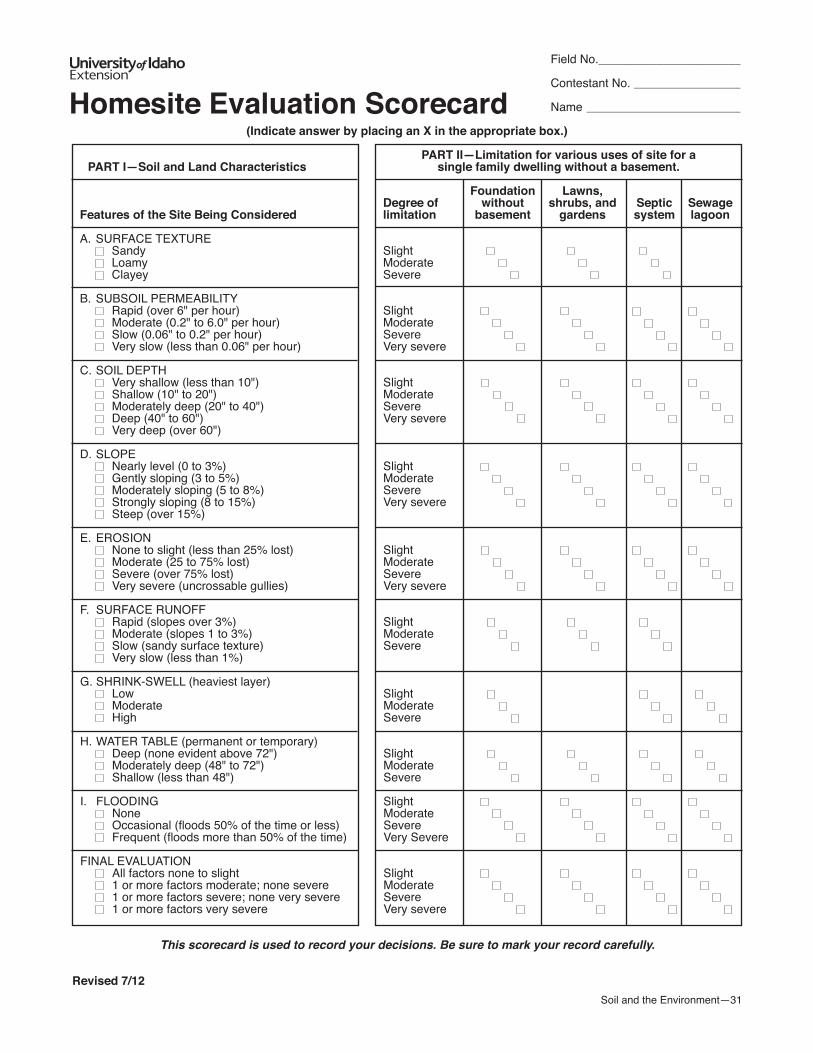
Soil and the Environment—31
Field No.________________________
Contestant No. __________________
Name __________________________
(Indicate answer by placing an X in the appropriate box.)
PART II—Limitation for various uses of site for aPART I—Soil and Land Characteristics single family dwelling without a basement.
Foundation Lawns, Degree of without shrubs, and Septic SewageFeatures of the Site Being Considered limitation basement gardens system lagoon
A. SURFACE TEXTURE Sandy Slight Loamy Moderate Clayey Severe
B. SUBSOIL PERMEABILITY Rapid (over 6" per hour) Slight Moderate (0.2" to 6.0" per hour) Moderate Slow (0.06" to 0.2" per hour) Severe Very slow (less than 0.06" per hour) Very severe
C. SOIL DEPTH Very shallow (less than 10") Slight Shallow (10" to 20") Moderate Moderately deep (20" to 40") Severe Deep (40" to 60") Very severe Very deep (over 60")
D. SLOPE Nearly level (0 to 3%) Slight Gentlysloping(3to5%) Moderate Moderately sloping (5 to 8%) Severe Strongly sloping (8 to 15%) Very severe Steep (over 15%)
E. EROSION None to slight (less than 25% lost) Slight Moderate (25 to 75% lost) Moderate Severe (over 75% lost) Severe Very severe (uncrossable gullies) Very severe
F. SURFACE RUNOFF Rapid (slopes over 3%) Slight Moderate (slopes 1 to 3%) Moderate Slow (sandy surface texture) Severe Very slow (less than 1%)
G.SHRINK-SWELL(heaviestlayer) Low Slight Moderate Moderate High Severe
H. WATER TABLE (permanent or temporary) Deep (none evident above 72") Slight Moderately deep (48" to 72") Moderate Shallow (less than 48") Severe
I. FLOODING Slight None Moderate Occasional(floods50%ofthetimeorless) Severe Frequent(floodsmorethan50%ofthetime) VerySevere
FINAL EVALUATION All factors none to slight Slight 1 or more factors moderate; none severe Moderate 1 or more factors severe; none very severe Severe 1 or more factors very severe Very severe
This scorecard is used to record your decisions. Be sure to mark your record carefully.
Revised 7/12
Homesite Evaluation Scorecard

BUL 795
Soil and the EnvironmentA Land and Homesite Evaluation Handbook and Training Guide
Issued in furtherance of cooperative extension work in agriculture and home economics, Acts of May 8 and June 30, 1914, in cooperation with the U.S. Department of Agriculture, Barbara Petty, Interim Director of University of Idaho Extension, University of Idaho, Moscow, Idaho 83844. The University of Idaho provides equal opportunity in education and employment on the basis of race, color, national origin, religion, sex, sexual orienta-tion, age, disability, or status as a disabled veteran or Vietnam-era veteran, as required by state and federal laws.
9-00 (revised); 7-12 (revised); 8-15 (reprinted) $4.00 ©2012 by the University of Idaho