soil analysis: what vegetable crop will grow best?
TRANSCRIPT

Name: _________________________________ Period: _______ Date: ___________________________
Soil Analysis: What Vegetable Crop Will Grow Best? Introduction What is soil? Gardeners know that soil is more than simply broken up rocks. Rather than being an inert unchanging material, soil is a dynamic living substance in which complex chemical and biological reactions are constantly occurring. According to the Soil Science Society of America, soil is defined as, “…the unconsolidated mineral or organic material on the immediate surface of the earth that serves as a natural medium for the growth of land plants...” Unconsolidated materials are loose materials composed of multiple units (e.g. sand, gravel, etc.) unlike hard, massive materials like rock. Effective gardeners manage soils to produce healthy and resilient plants. Soil can be analyzed to determine the composition (sand, silt, clay, etc), acidity, porosity as well as nutrient content using tests such as permeability, pH, soil texture (by feel and by separation), and N, K, P. Soil Texture/Composition: The relative combination of sand, silt, and clay in a soil defines its texture and is important in determining the nutrient-‐holding abilities of a soil. Along with soil structure (the arrangement of soil particles in aggregates), the texture of soil is also important to water-‐holding capacity, water movement, and the amount and movement of soil air in a given soil. All of this is important to the health and type of plants and other organisms that can exist in a particular soil. Once the percent by weight of sand, silt, and clay are known (or, rather, any two of them), the soil texture can be plotted on the triangular graph known as the soil textural triangle. The region on the graph where the three particle size percentages meet is the soil's texture. Loam has been determined to be the texture best suited to the growth of most agricultural crops, having the optimum combination of heavy and light soil qualities. Soil texture can be tested through physical and chemical separation as well as a texture by feel. Soil Nutrients The three nutrients (N, P, K) all have their own effect on the soil and how it will be able to grow plants. Plants require nitrogen in the form of ammonium or nitrate ions. Atmospheric nitrogen is converted into these forms by soil microbes in reactions that form part of the global nitrogen cycle. The amount of nitrogen introduced into the soil via natural processes is not sufficient to sustain the intensive agriculture upon which you may depend. Therefore, if your levels were low you should add nitrogen to the soil in the form of nitrate salts.
Plants also need phosphorous to grow and in theory, there is enough phosphorus present in the earth’s crust to supply the needs of plants. However, the distribution of phosphorus around the world is not uniform, and even when phosphorus is present, it is not necessarily available to plants. Because phosphorus has a low solubility, its concentration in water at any given time is low. For this reason, the introduction of phosphates into the environment can stimulate rapid algal growth causing eutrophication. Phosphorus availability commonly limits plant growth but if levels are low, it can be found in almost all fertilizers.
The last essential nutrient is potassium. Movement of potassium in soils depends on soil texture. In sandy soils, potassium is quite mobile and can actually leach out of the root zone. Consequently, sandy soils tend to be low in available potassium. Potassium fertilizer recommendations are based on the kinds of plants being grown and the potassium soil test level.
Soil pH Soil pH is important for several reasons; one being that it affects the solubility of soil nutrients. For example, phosphorus (in the form of phosphates) is the most soluble between pH 6 and pH 8. Soil pH also affects the ability of certain microorganisms to fix nitrogen. For example, azotobacteria, a group of free-‐living nitrogen fixers, can survive at pH values below 6 but can no longer fix nitrogen. Soil acidification may occur by addition of hydrogen, due to
decomposition of organic matter, acid-‐forming fertilizers, and exchange of basic cations for H+ by the roots. Soil Permeability A soil's permeability is a measure of the ability of air and water to move through it. Permeability is influenced by the size, shape, and continuity of the pore spaces, which in turn are dependent on the soil bulk density, structure and texture. In most cases, soils with a slow, very slow, rapid or very rapid permeability classification are considered poor for irrigation.
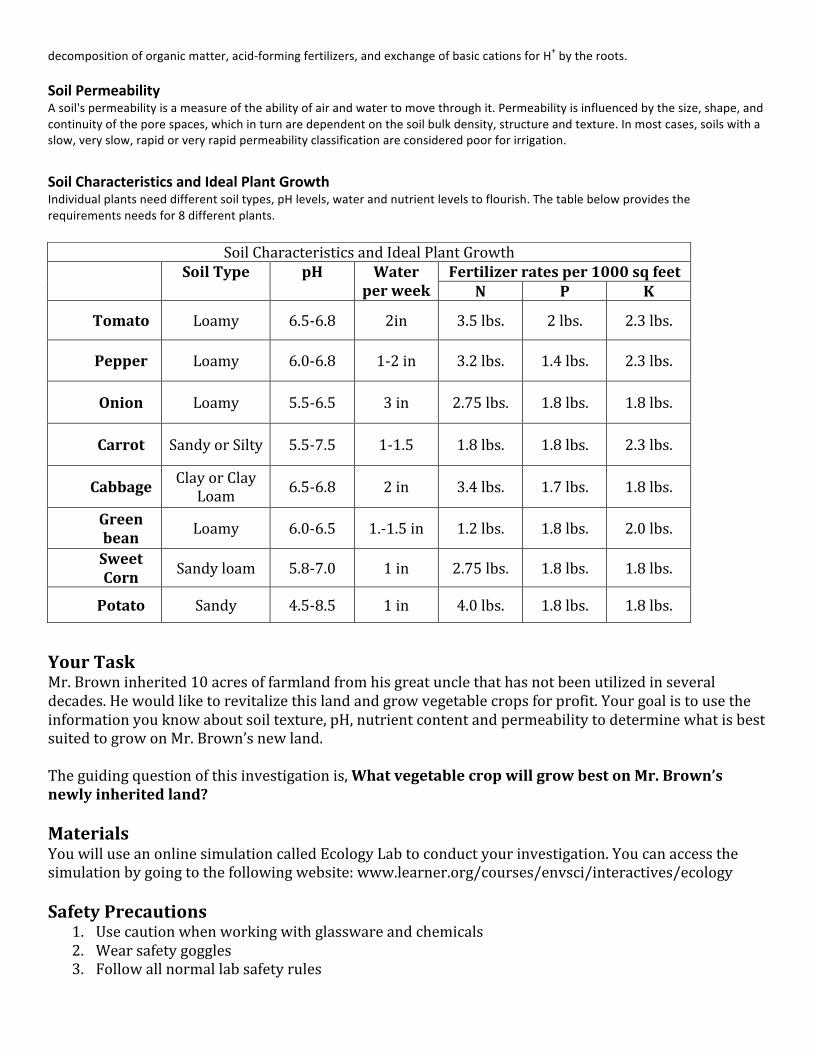
Soil Characteristics and Ideal Plant Growth Individual plants need different soil types, pH levels, water and nutrient levels to flourish. The table below provides the requirements needs for 8 different plants.
Your Task Mr. Brown inherited 10 acres of farmland from his great uncle that has not been utilized in several decades. He would like to revitalize this land and grow vegetable crops for profit. Your goal is to use the information you know about soil texture, pH, nutrient content and permeability to determine what is best suited to grow on Mr. Brown’s new land. The guiding question of this investigation is, What vegetable crop will grow best on Mr. Brown’s newly inherited land? Materials You will use an online simulation called Ecology Lab to conduct your investigation. You can access the simulation by going to the following website: www.learner.org/courses/envsci/interactives/ecology Safety Precautions
1. Use caution when working with glassware and chemicals 2. Wear safety goggles 3. Follow all normal lab safety rules
Soil Characteristics and Ideal Plant Growth Soil Type pH Water
per week Fertilizer rates per 1000 sq feet
N P K
Tomato Loamy 6.5-‐6.8 2in 3.5 lbs. 2 lbs. 2.3 lbs.
Pepper Loamy 6.0-‐6.8 1-‐2 in 3.2 lbs. 1.4 lbs. 2.3 lbs.
Onion Loamy 5.5-‐6.5 3 in 2.75 lbs. 1.8 lbs. 1.8 lbs.
Carrot Sandy or Silty 5.5-‐7.5 1-‐1.5 1.8 lbs. 1.8 lbs. 2.3 lbs.
Cabbage Clay or Clay Loam 6.5-‐6.8 2 in 3.4 lbs. 1.7 lbs. 1.8 lbs.
Green bean Loamy 6.0-‐6.5 1.-‐1.5 in 1.2 lbs. 1.8 lbs. 2.0 lbs.
Sweet Corn Sandy loam 5.8-‐7.0 1 in 2.75 lbs. 1.8 lbs. 1.8 lbs.
Potato Sandy 4.5-‐8.5 1 in 4.0 lbs. 1.8 lbs. 1.8 lbs.
Getting Started To answer the guiding question, you will need to determine and conduct tests to identify the crop best suited to grow in the soil found on Mr. Brown’s farm. To accomplish this task, you must determine what type of data you will need to collect during each experiment, how you will collect it, and how you will analyze it. Please refer to “Testing Procedure” handout for specific instructions for each test. To determine what type of data you will need to collect, think about the following questions:
• Which soil tests will you include in your investigation? • How will you determine the best type of crop using the data you collected? • What type of data will you need to keep a record of during your investigation?
To determine how you will collect your data, think about the following questions: • What will you need to compare? • How often will you collect data and when will you do it? • How will you keep track of the data you collect and how will you organize the data?
To determine how you will analyze your data, think about the following questions: • What type of calculations will you need to make? • What type of table or graph could you create to help make sense of your data?
Investigation Proposal Required? Connections to Crosscutting Concepts and to the Nature of Science and the Nature of Scientific Inquiry As you work through your investigation, be sure to think about:
• How scientists develop and use explanatory models to make sense of their observations • The relationship between structure and function • The difference between data and evidence • The importance of creativity and imagination in science,
and • The factors that influence observations and inferences
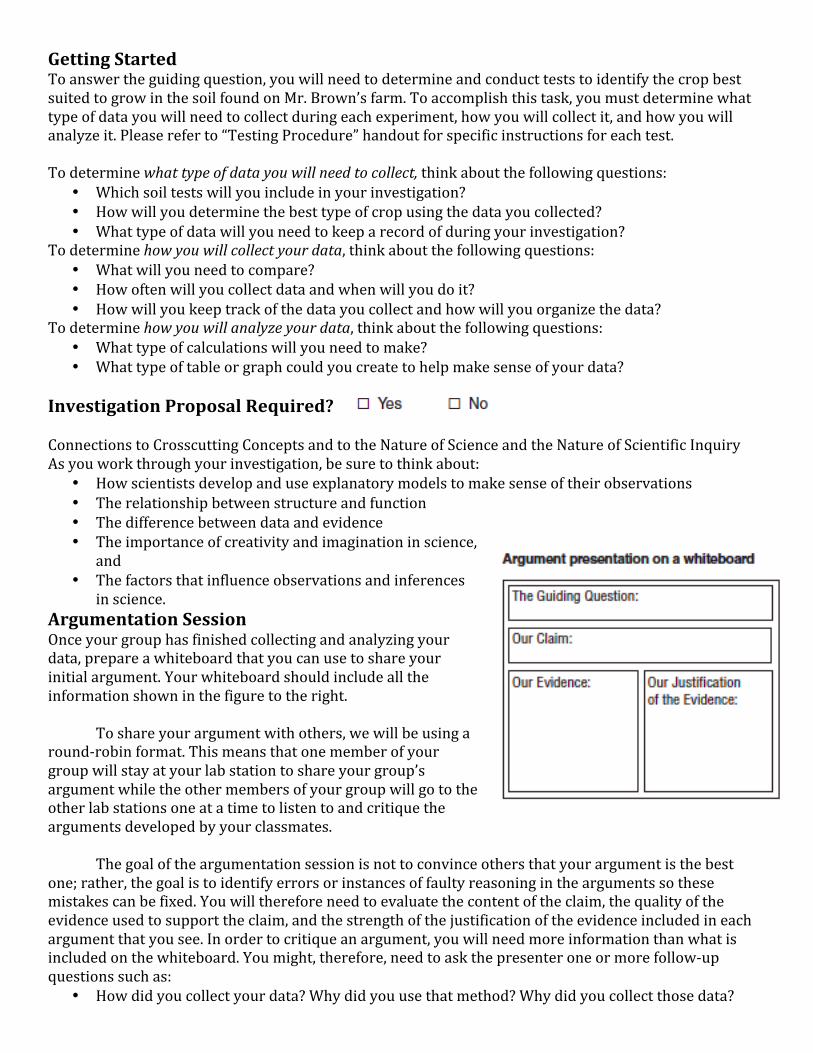
in science. Argumentation Session Once your group has finished collecting and analyzing your data, prepare a whiteboard that you can use to share your initial argument. Your whiteboard should include all the information shown in the figure to the right. To share your argument with others, we will be using a round-‐robin format. This means that one member of your group will stay at your lab station to share your group’s argument while the other members of your group will go to the other lab stations one at a time to listen to and critique the arguments developed by your classmates. The goal of the argumentation session is not to convince others that your argument is the best one; rather, the goal is to identify errors or instances of faulty reasoning in the arguments so these mistakes can be fixed. You will therefore need to evaluate the content of the claim, the quality of the evidence used to support the claim, and the strength of the justification of the evidence included in each argument that you see. In order to critique an argument, you will need more information than what is included on the whiteboard. You might, therefore, need to ask the presenter one or more follow-‐up questions such as:
• How did you collect your data? Why did you use that method? Why did you collect those data?

• What did you do to analyze your data? Why did you decide to do it that way? • What did you do to make sure the data you collected are reliable? What did you do to decrease
measurement error? • Is that the only way to interpret the results of your analysis? How do you know that the
interpretation of your analysis is appropriate? • Why did your group decide to present your evidence in that manner? • What other claims did your group discuss before you decided on that one? Why did your group
abandon those alternative ideas? • How confident are you that your claim is valid? What could you do to increase your confidence?
Once the argumentation session is complete, you will have a chance to meet with your group and revise your original argument. Your group might need to gather more data or design a way to test one or more alternative claims as part of this process. Remember, your goal at this stage of the investigation is to develop the most valid or acceptable answer to the research question!
Report Once you have completed your research, you will need to prepare an investigation report that consists of three sections that provide answers to the following questions:
1. What question were you trying to answer and why? 2. What did you do during your investigation and why did you conduct yourself in this way? 3. What is your argument?
Your report should answer these questions in two pages or less. This report must be typed, and any diagrams, figures, or tables should be embedded into the document. Be sure to write in a persuasive style; you are trying to convince others that your claim is acceptable or valid!

Soil Testing Procedures
Soil Texture physical separation Procedure:
1. Label 50 ml graduated cylinders “A” “B” and “C”. On Cylinder C include class period and names 2. Place 15 ml of soil in Tube A making sure soil is relatively compacted with no air pockets 3. Add water until it reaches 50 ml. Shake for 2 minutes. Allow to stand for 1 minute. 4. Decant the liquid into Tube B; the soil particles in the bottom are sand (measure the depth and record) 5. Add 1 ml of dispersing reagent to the liquid in Tube B. Shake for 2 minutes and allow to stand for 30
minutes. 6. Decant the liquid into Tube C; the soil particles in the bottom are silt (measure the depth and record) 7. Add 1 ml of flocculating reagent to the liquid in Tube C. Shake for 2 minutes. 8. Allow to sit 24 hours; the soil particles in the bottom are clay (measure the
depth and record) 9. Calculate the percent of each using the equation to the right.
10. Use your percentages and soil texture pyramid in the pre-‐lab to determine the soil texture of your soil.
Soil Texture by feel
Use the soil texture by feel chart to determine the texture of your soil just by feeling the sample of soil. Soil Nutrient Procedure:
1. Using a small beaker mix 5 parts water to one part soil mixture (~50ml of water to 10ml of soil) 2. Fill each of the RapiTest vials to the dotted line with the soil/water mixture. 3. The vials have color-‐coordinated capsules that go with each soil test. For each test/color:
a. Carefully separate the capsule to pour the powder inside into the matching colored vial. b. Cap and gently shake until the white powder is completely dissolved-‐ if you are not careful the vial
will EXPLODE! Seriously. Shake it gently. c. Wait until a color develops (about 5 minutes) d. Record the results.
4. Based on your results, determine what type of fertilizer is needed for the soil. The fertilizer nutrient combination is in order of N-‐P-‐K (ex. 10-‐0-‐ 5). Hint: if your soil is sufficient you would want a smaller number than if it were deficient
0-‐ none needed 5-‐ some needed 10-‐ an abundance needed
Soil pH Procedure:
1. See “Soil Nutrients” procedure above.
Soil Permeability Procedure:
1. You can determine your own method of measuring permeability. 2. You will be provided cups with holes, beakers, graduated cylinders, coffee filters, funnels, and a timer. 3. You may also use any other measuring devise with teacher approval. 4. The goal is to determine the permeability and porosity of the soil to establish water holding capacity
Particle (sand, silt or clay) Sand + Silt + Clay


100%clay
Increasingpercentage silt
Increasingpercentage clay
0
20
40
60
80
80
60
40
20
0
100%sand 80 60 40 20 100%silt
Increasing percentage sand
sandyclay
clay
siltyclay
silty clayloam
clayloam
loam siltyloam
silt
sandy clayloam
sandyloam
loamy sandsand

Your actual data
Instructor’s Signature Date
Name:
I apI I approve of this investigation: _______________________________________________________ _____________________________
ADI Laboratory Investigation Proposal- Individual The Guiding Question… What data will you collect?
Your Procedure
Procedure (order/# of people responsible) What safety precautions will you follow?
How will you analyze your data

Your actual data
Instructor’s Signature Date
Names:
I apI I approve of this investigation: _______________________________________________________ _____________________________
ADI Laboratory Investigation Proposal- Group The Guiding Question… What data will you collect?
Your Procedure
Procedure (order/# of people responsible) What safety precautions will you follow?
How will you analyze your
data?


Argumentation Session Notes for Presenter
Critiques of our argument
Ways to improve our argument

Argumentation Session Notes for Reviewers
Interesting ideas from other groups
Questions to take back to my group
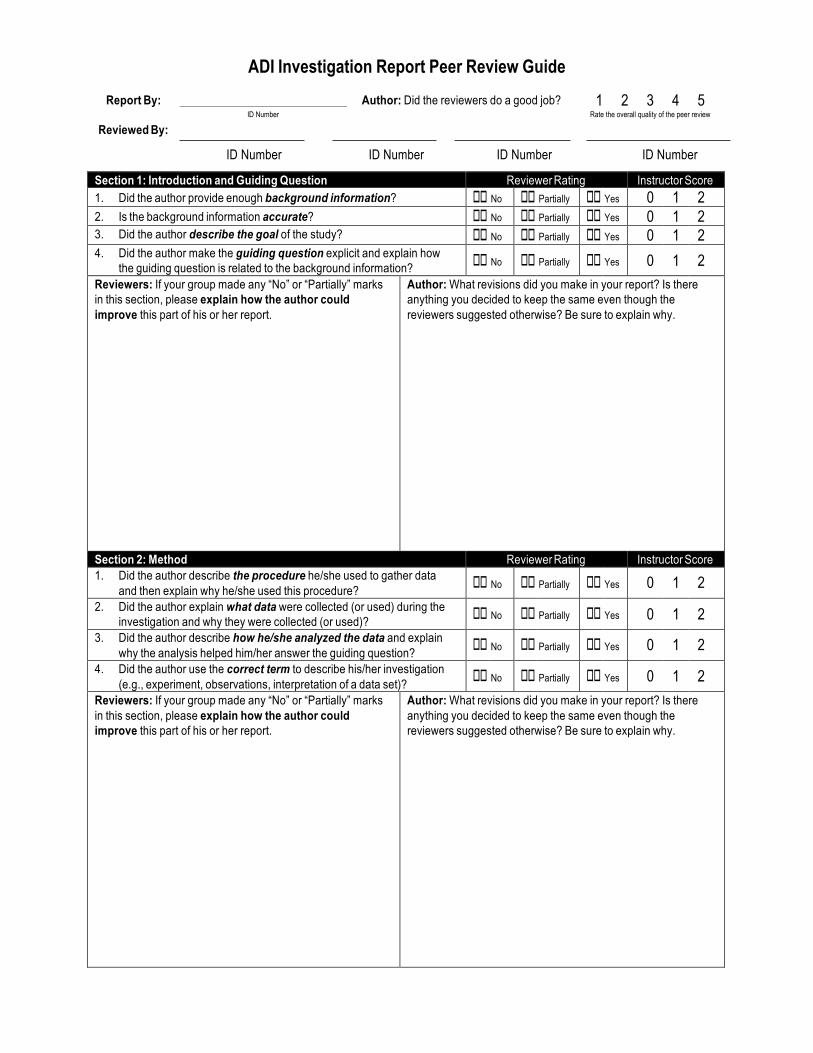
ADI Investigation Report Peer Review Guide
Report By: Author: Did the reviewers do a good job? 1 2 3 4 5 ID Number Rate the overall quality of the peer review
Reviewed By: ID Number ID Number ID Number ID Number
Section 1: Introduction and Guiding Question Reviewer Rating Instructor Score 1. Did the author provide enough background information? oo No oo Partially oo Yes 0 1 2 2. Is the background information accurate? oo No oo Partially oo Yes 0 1 2 3. Did the author describe the goal of the study? oo No oo Partially oo Yes 0 1 2 4. Did the author make the guiding question explicit and explain how
the guiding question is related to the background information? oo No oo
Partially oo
Yes 0 1 2
Reviewers: If your group made any “No” or “Partially” marks in this section, please explain how the author could improve this part of his or her report.
Author: What revisions did you make in your report? Is there anything you decided to keep the same even though the reviewers suggested otherwise? Be sure to explain why.
Section 2: Method Reviewer Rating Instructor Score 1. Did the author describe the procedure he/she used to gather data
and then explain why he/she used this procedure? oo No oo
Partially oo
Yes 0 1 2
2. Did the author explain what data were collected (or used) during the investigation and why they were collected (or used)? oo
No oo
Partially oo
Yes 0 1 2
3. Did the author describe how he/she analyzed the data and explain why the analysis helped him/her answer the guiding question? oo
No oo
Partially oo
Yes 0 1 2
4. Did the author use the correct term to describe his/her investigation (e.g., experiment, observations, interpretation of a data set)? oo
No oo
Partially oo
Yes 0 1 2
Reviewers: If your group made any “No” or “Partially” marks in this section, please explain how the author could improve this part of his or her report.
Author: What revisions did you make in your report? Is there anything you decided to keep the same even though the reviewers suggested otherwise? Be sure to explain why.

Section 3: The Argument Reviewer Rating Instructor Score 1. Did the author provide a claim that answers the guiding question? oo No oo Partially oo Yes 0 1 2 2. Did the author include high quality evidence in his/her argument?
§§ Were the data collected in an appropriate manner? §§ Is the analysis of the data appropriate and free from errors? §§ Is the author’s interpretation of the analysis (what it means) valid?
oo No oo No oo No
oo Partially oo Partially oo Partially
oo Yes oo Yes oo Yes
0 1 2 0 1 2 0 1 2
3. Did the author present the evidence in an appropriate manner by: §§ using a correctly formatted and labeled graph (or table); §§ including correct metric units (e.g., m/s, g, ml, etc.); and, §§ referencing the graph or table in the body of the text?
oo No oo No oo No
oo Partially oo Partially oo Partially
oo Yes oo Yes oo Yes
0 1 2 0 1 2 0 1 2
4. Is the claim consistent with the evidence? oo No oo Partially oo Yes 0 1 2 5. Did the author include a justification of the evidence that:
§§ explains why the evidence is important (why it matters) and §§ defends the inclusion of the evidence with a specific science
concept or by discussing his/her underlying assumptions?
oo No oo No
oo Partially oo Partially
oo Yes oo Yes
0 1 2 0 1 2
6. Is the justification of the evidence acceptable? oo No oo Partially oo Yes 0 1 2 7. Did the author discuss how well his/her claim agrees with the
claims made by other groups and explain any disagreements? oo No oo Partially oo Yes 0 1 2 8. Did the author use scientific terms correctly (e.g., hypothesis vs.
prediction, data vs. evidence) and reference the evidence in an appropriate manner (e.g., supports or suggests vs. proves)?
oo No
oo Partially
oo Yes
0 1 2
Reviewers: If your group made any “No” or “Partially” marks in this section, please explain how the author could improve this part of his or her report.
Author: What revisions did you make in your report? Is there anything you decided to keep the same even though the reviewers suggested otherwise? Be sure to explain why.
Mechanics Reviewer Rating Instructor Score 1. Organization: Is each section easy to follow? Do paragraphs include
multiple sentences? Do paragraphs begin with a topic sentence? oo No oo Partially oo Yes 0 1 2 2. Grammar: Are the sentences complete? Is there proper subject-verb
agreement in each sentence? Are there run-on sentences? oo No oo Partially oo Yes 0 1 2 3. Conventions: Did the author use appropriate spelling, punctuation,
paragraphing and capitalization? oo No oo Partially oo Yes 0 1 2 4. Word Choice: Did the author use the appropriate word (e.g., there vs.
their, to vs. too, than vs. then, etc.)? oo No oo Partially oo Yes 0 1 2 Instructor Comments:
Total: /50

ADI Investigation Student Performance Report Name:___________________________________________
• Staple your final paper, completed peer review and draft paper (in that order) behind the ADI Investigation Student Performance Report
• Clip together the ADI Investigation Student Performance packet to the Ecosystem and Biodiversity lab packet before turning in
Investigation Proposal / 10
Original brainstorming proposal (5 points)
Finalized group proposal (5 points)
Lab Activities /40
Annotating text (2 points)
Argument presentation on white board/butcher paper/manila folder (10 points)
Round robin notes -‐presenter/reviewer depending on your role (3 points)
Homework check: -‐ Four copies of investigative lab report turned in on time
(5 points) Homework check:
-‐ Completed peer review guide from classmates (5 points)
Peer review scoring guide completed for other classmates (10 points)
Group participation (5 points)
Lab Report /50
Introduction and Guiding Questions (8 points)
Method (8 points)
The Argument (26 points)
Mechanics (8 points)
Total: /100