soil acidification - montana state...
TRANSCRIPT
SOIL ACIDIFICATION
MSU Soil Fertility Extension
Clain [email protected] 994-6076
Chouteau CountyJanuary 11, 2016
Objectives
• Illustrate consequences of acidic soils to crop production
• Present soil and agronomic conditions that lead to acidic soils
• Explain how to recognize and test acidic soil• Present management options to slow further
acidification and increase productivity of acidic soil
Questions for you
• How many think you have seen yield losses from acidic soils?
• How many of you have soil pH levels below 5.5?
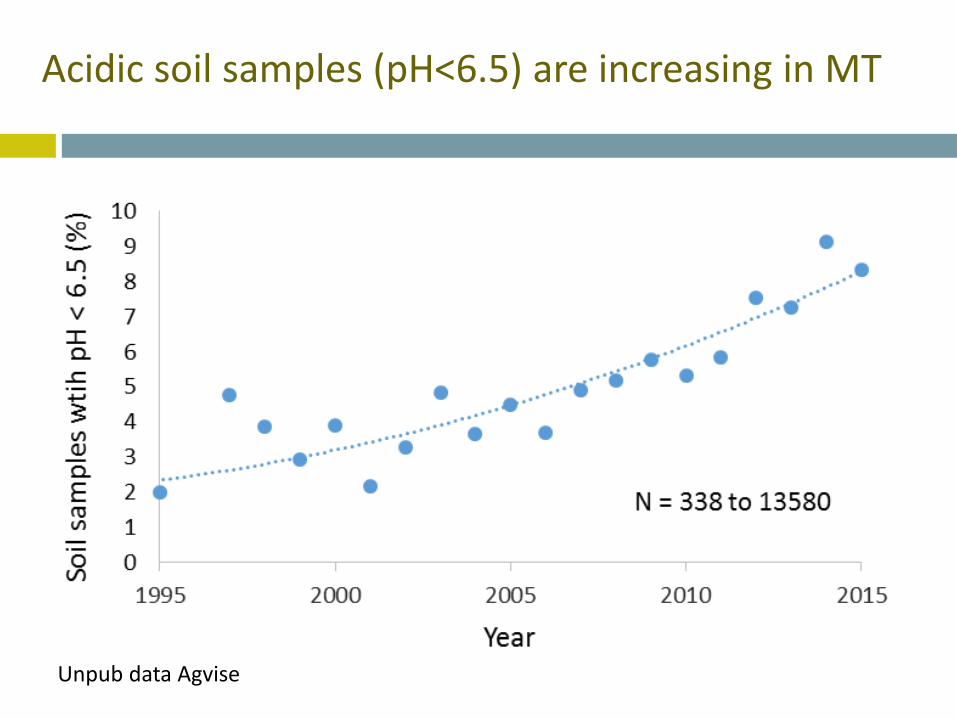
Acidic soil samples (pH<6.5) are increasing in MT
Unpub data Agvise
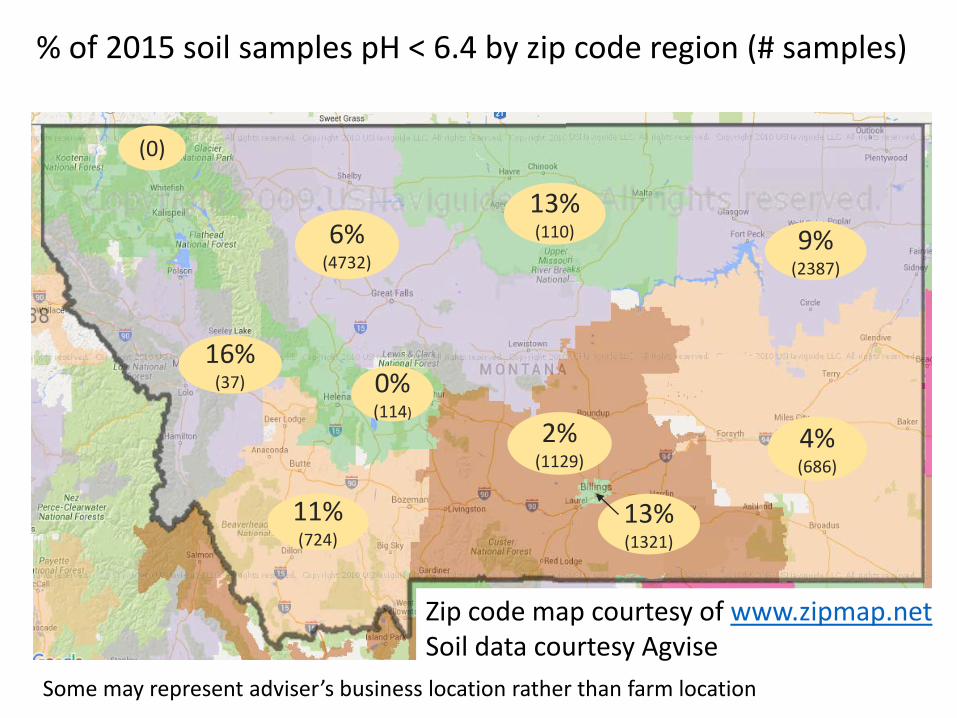
% of 2015 soil samples pH < 6.4 by zip code region (# samples)
2%(1129)
9%(2387)
4% (686)
6%(4732)
0%(114)
11% (724)
13%(110)
16%(37)
(0)
13% (1321)
Zip code map courtesy of www.zipmap.netSoil data courtesy Agvise
Some may represent adviser’s business location rather than farm location
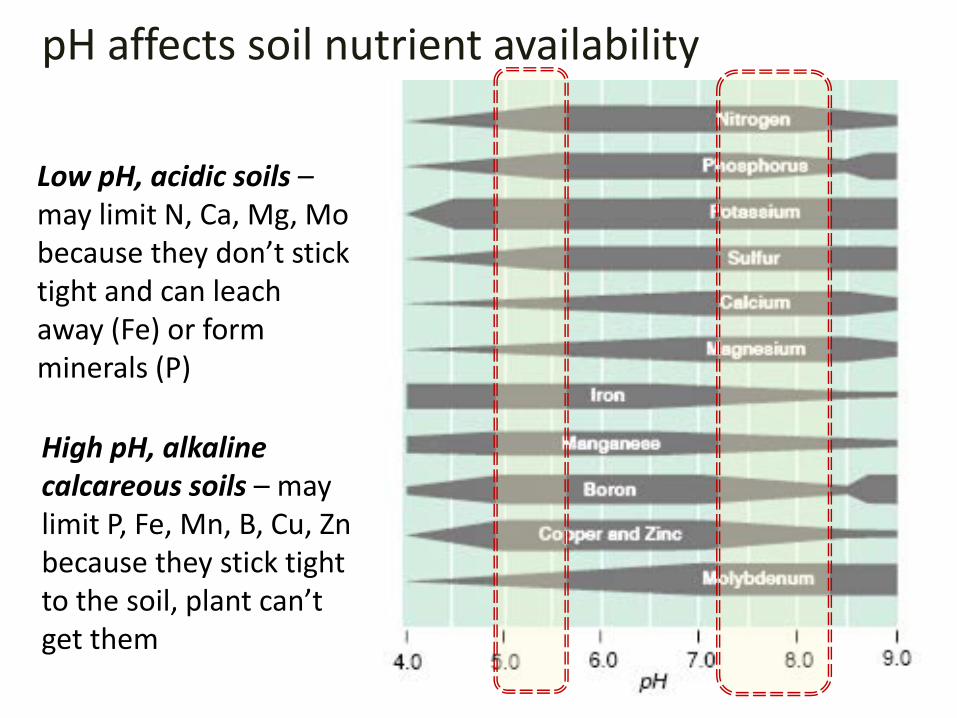
pH affects soil nutrient availability
High pH, alkaline calcareous soils – may limit P, Fe, Mn, B, Cu, Zn because they stick tight to the soil, plant can’t get them
Low pH, acidic soils –may limit N, Ca, Mg, Mo because they don’t stick tight and can leach away (Fe) or form minerals (P)
-1 or +1
-1 or -2
+1
-2
+2
+2
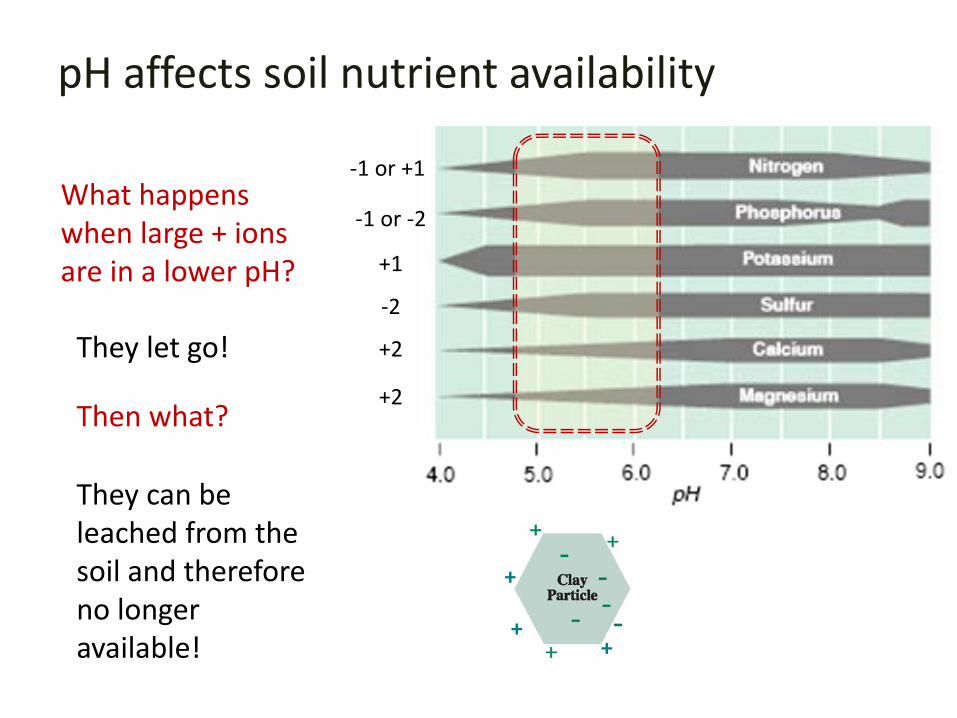
What happens when large + ions are in a lower pH?
+
++
They let go!
Then what?
They can be leached from the soil and therefore no longer available!
pH affects soil nutrient availability
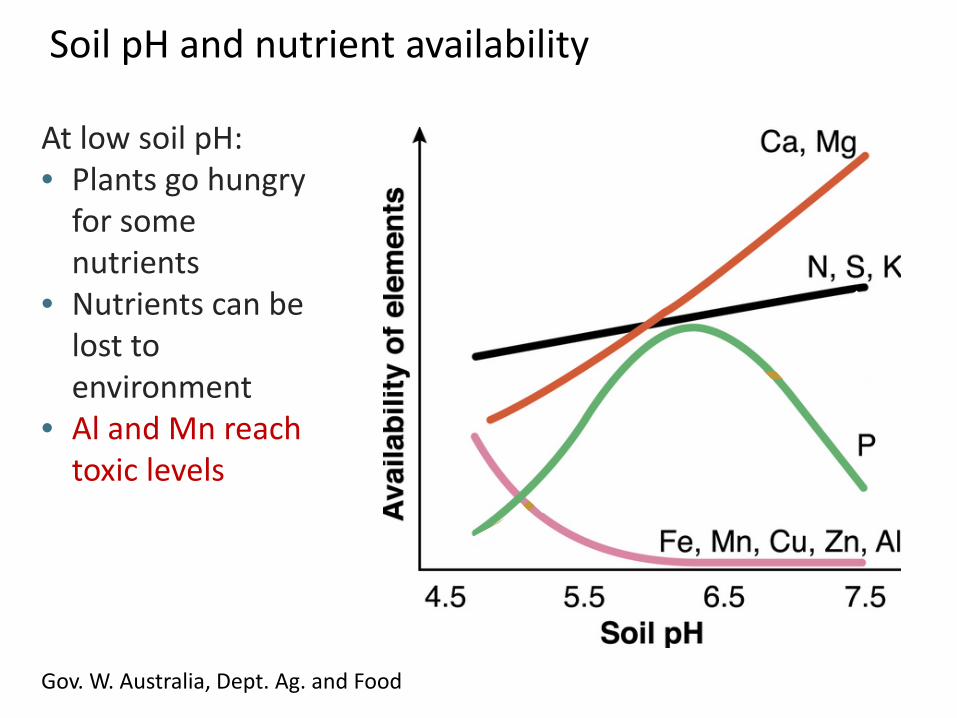
Gov. W. Australia, Dept. Ag. and Food
At low soil pH:• Plants go hungry
for some nutrients
• Nutrients can be lost to environment
• Al and Mn reach toxic levels
Soil pH and nutrient availability
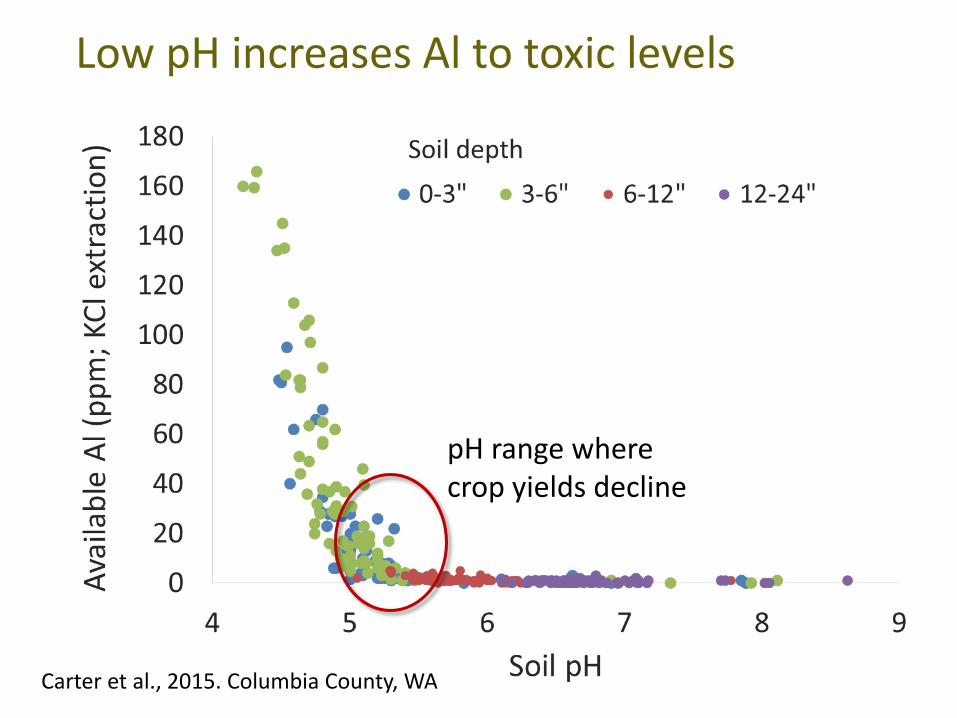
Low pH increases Al to toxic levels
Carter et al., 2015. Columbia County, WA
pH range where crop yields decline
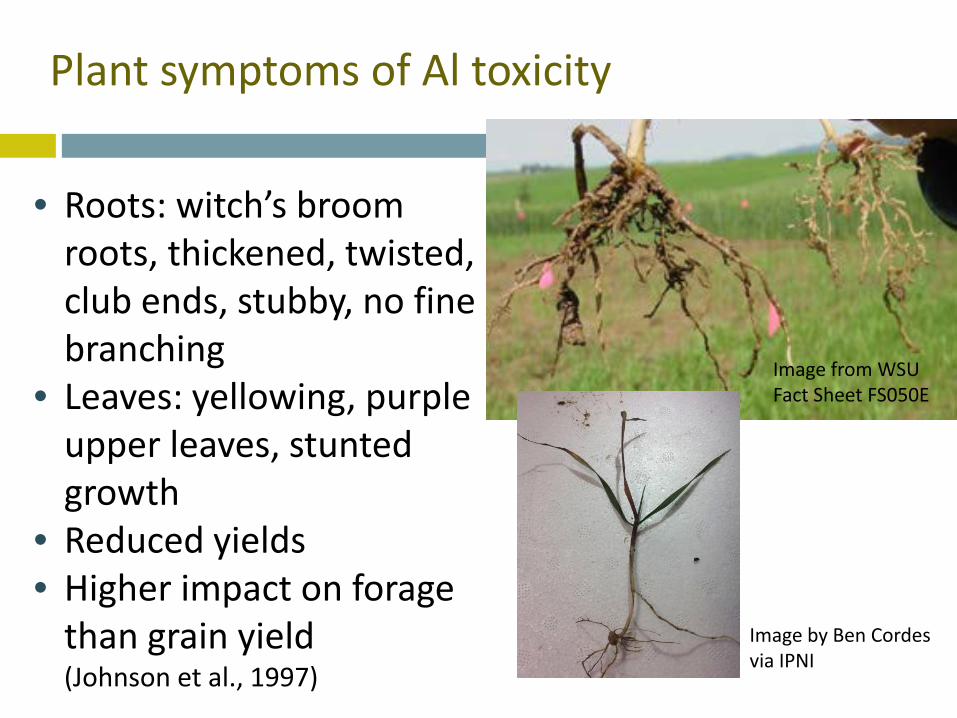
Plant symptoms of Al toxicity
Image from WSU Fact Sheet FS050E
• Roots: witch’s broom roots, thickened, twisted, club ends, stubby, no fine branching
• Leaves: yellowing, purple upper leaves, stunted growth
• Reduced yields• Higher impact on forage
than grain yield (Johnson et al., 1997)
Image by Ben Cordesvia IPNI
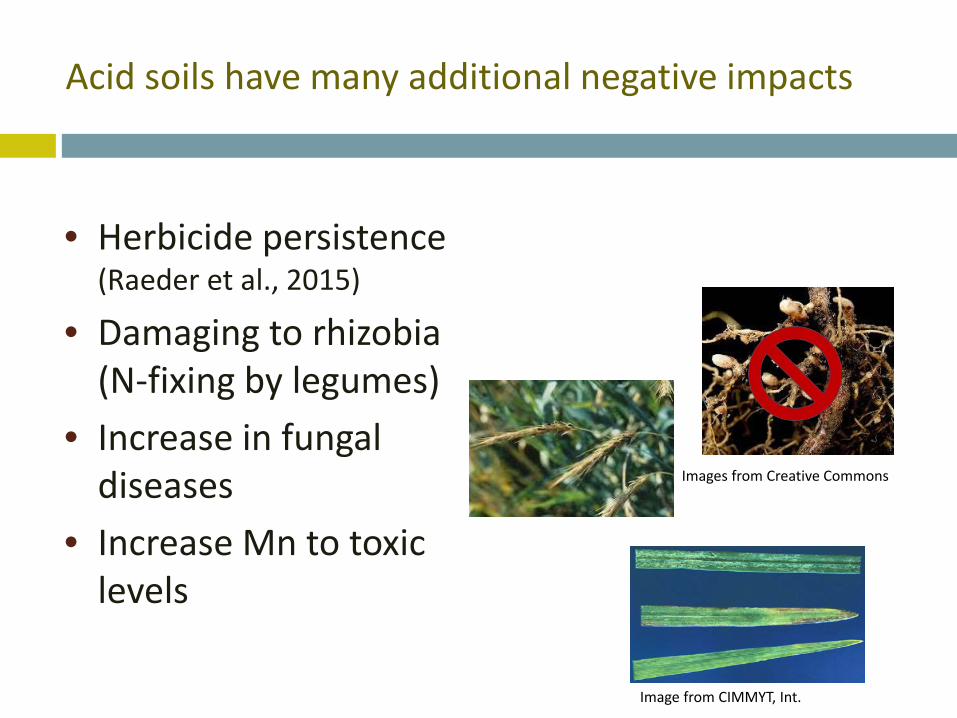
Acid soils have many additional negative impacts
• Herbicide persistence (Raeder et al., 2015)
• Damaging to rhizobia (N-fixing by legumes)
• Increase in fungal diseases
• Increase Mn to toxic levels
Image from CIMMYT, Int.
Images from Creative Commons
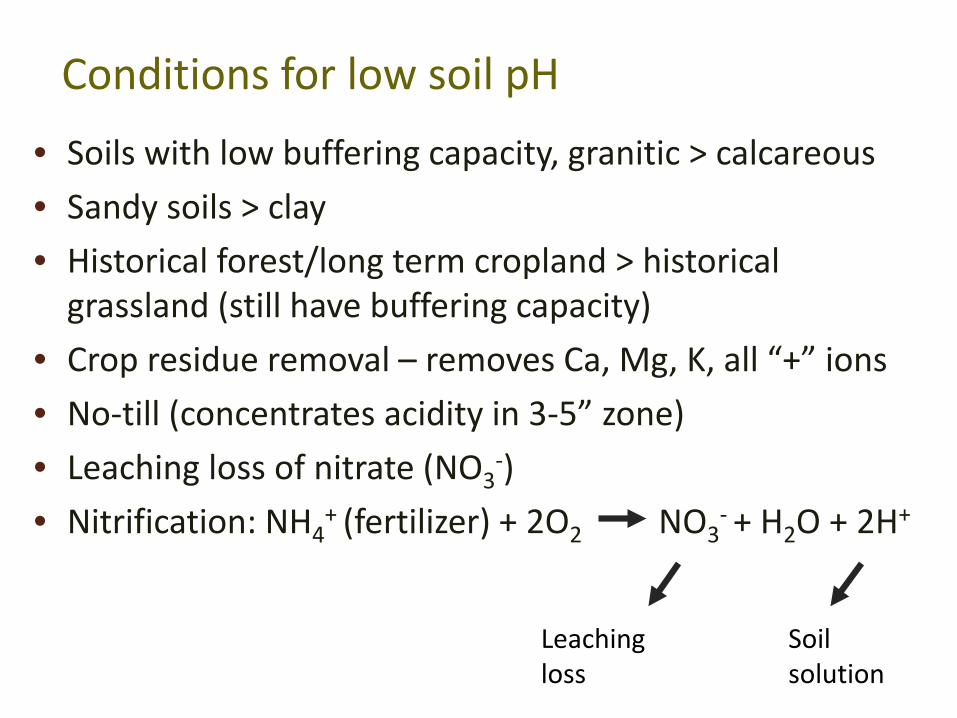
Conditions for low soil pH• Soils with low buffering capacity, granitic > calcareous • Sandy soils > clay• Historical forest/long term cropland > historical
grassland (still have buffering capacity)• Crop residue removal – removes Ca, Mg, K, all “+” ions• No-till (concentrates acidity in 3-5” zone)• Leaching loss of nitrate (NO3
-) • Nitrification: NH4
+ (fertilizer) + 2O2 NO3- + H2O + 2H+
Leaching loss
Soil solution
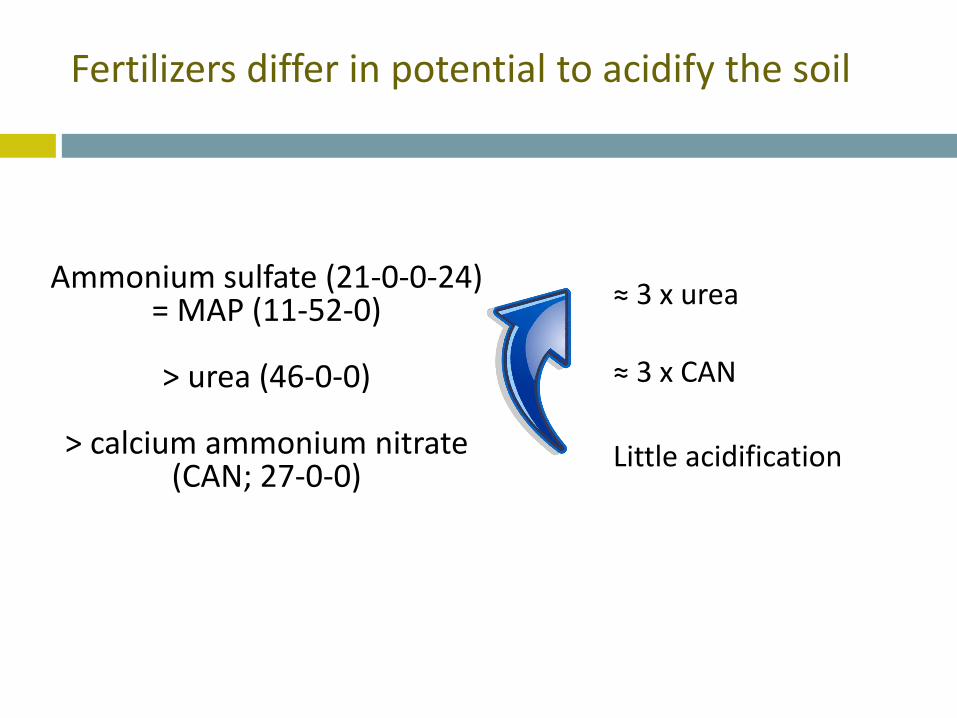
Fertilizers differ in potential to acidify the soil
Ammonium sulfate (21-0-0-24) = MAP (11-52-0)
> urea (46-0-0)
> calcium ammonium nitrate (CAN; 27-0-0) Little acidification
≈ 3 x urea
≈ 3 x CAN
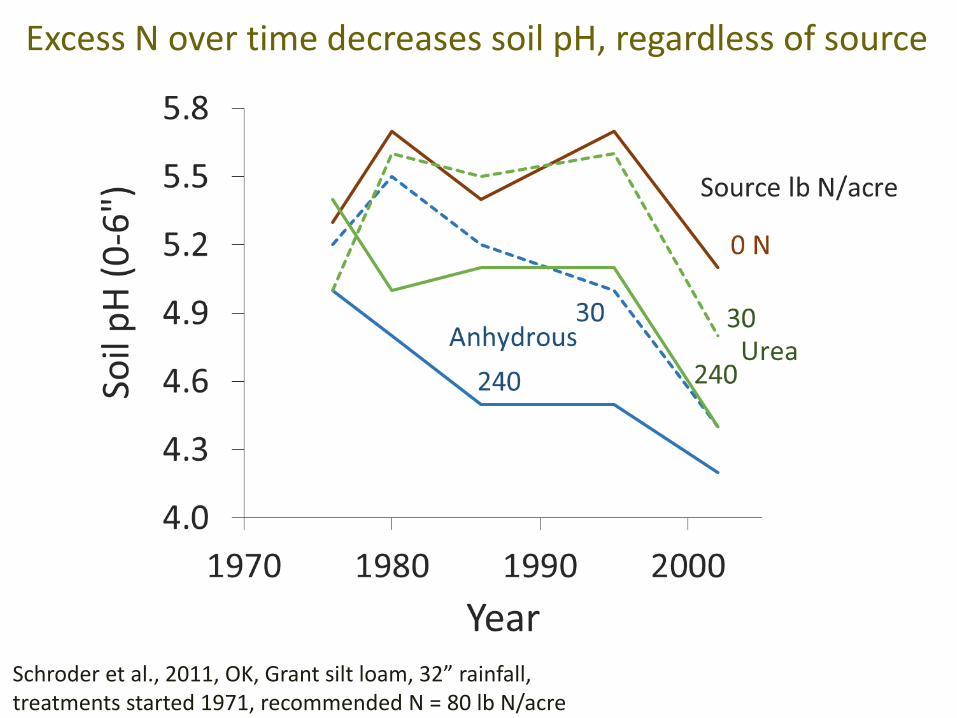
Excess N over time decreases soil pH, regardless of source
Schroder et al., 2011, OK, Grant silt loam, 32” rainfall, treatments started 1971, recommended N = 80 lb N/acre
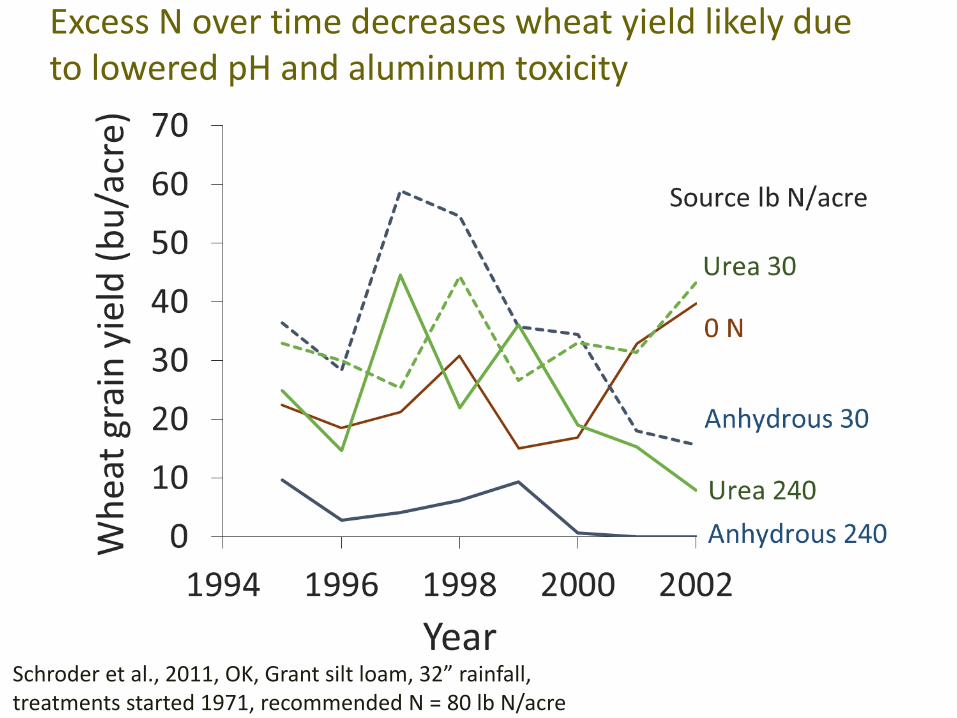
Excess N over time decreases wheat yield likely due to lowered pH and aluminum toxicity
Schroder et al., 2011, OK, Grant silt loam, 32” rainfall, treatments started 1971, recommended N = 80 lb N/acre

Questions?
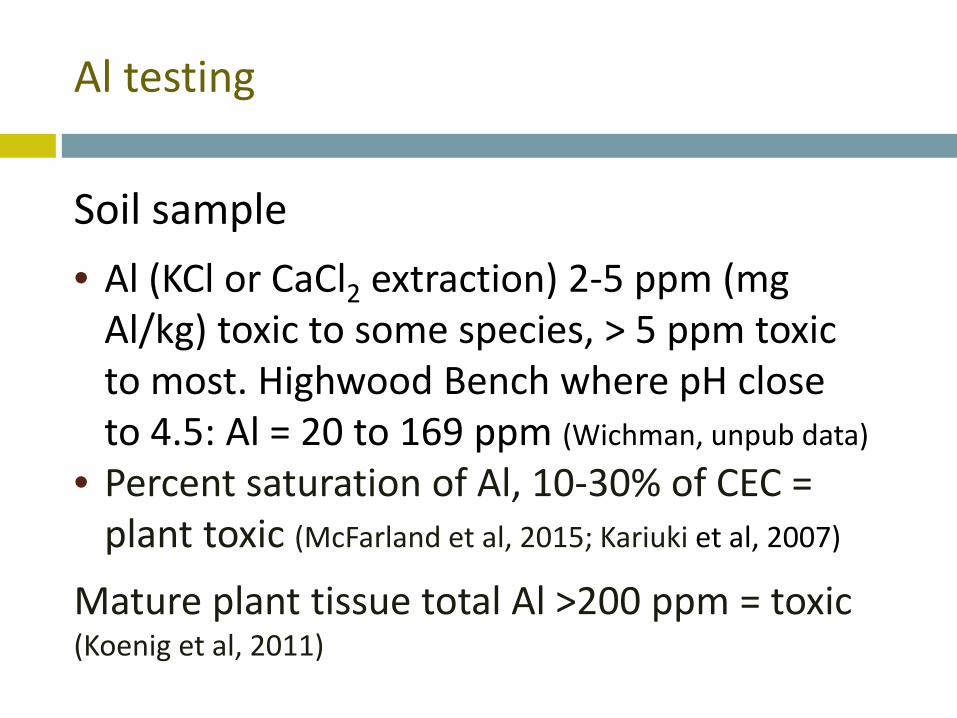
Al testing
Soil sample• Al (KCl or CaCl2 extraction) 2-5 ppm (mg
Al/kg) toxic to some species, > 5 ppm toxic to most. Highwood Bench where pH close to 4.5: Al = 20 to 169 ppm (Wichman, unpub data)
• Percent saturation of Al, 10-30% of CEC = plant toxic (McFarland et al, 2015; Kariuki et al, 2007)
Mature plant tissue total Al >200 ppm = toxic (Koenig et al, 2011)
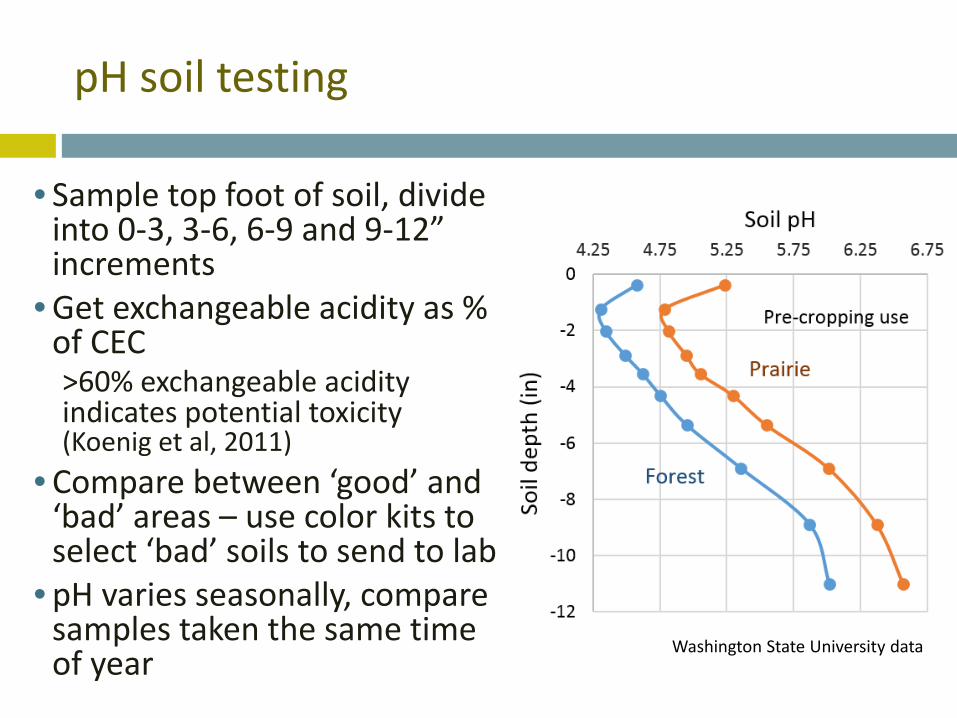
pH soil testing
• Sample top foot of soil, divide into 0-3, 3-6, 6-9 and 9-12” increments
• Get exchangeable acidity as % of CEC >60% exchangeable acidity indicates potential toxicity (Koenig et al, 2011)
• Compare between ‘good’ and ‘bad’ areas – use color kits to select ‘bad’ soils to send to lab
• pH varies seasonally, compare samples taken the same time of year Washington State University data
Managing low pH
• Plant Al-tolerant crops or varieties• Leave crop residue in field – retains base
cations and SOM buffers pH changes and Al toxicity
• Use legumes in rotation – they don’t need N fertilizer
• Inversion till to mix acid zone throughout plow layer – one-time summer tillage doesn’t negate long term benefits of no-till (Norton et al., 2014)
Managing low pH (cont.)
• Use practices to optimize N use efficiency – no left-over N
• Amend with lime, or seed-place lime to compensate for annual N application
• Band P with seed (binds some Al)• Select N source with lower acidifying
potential, e.g. Ca-nitrate
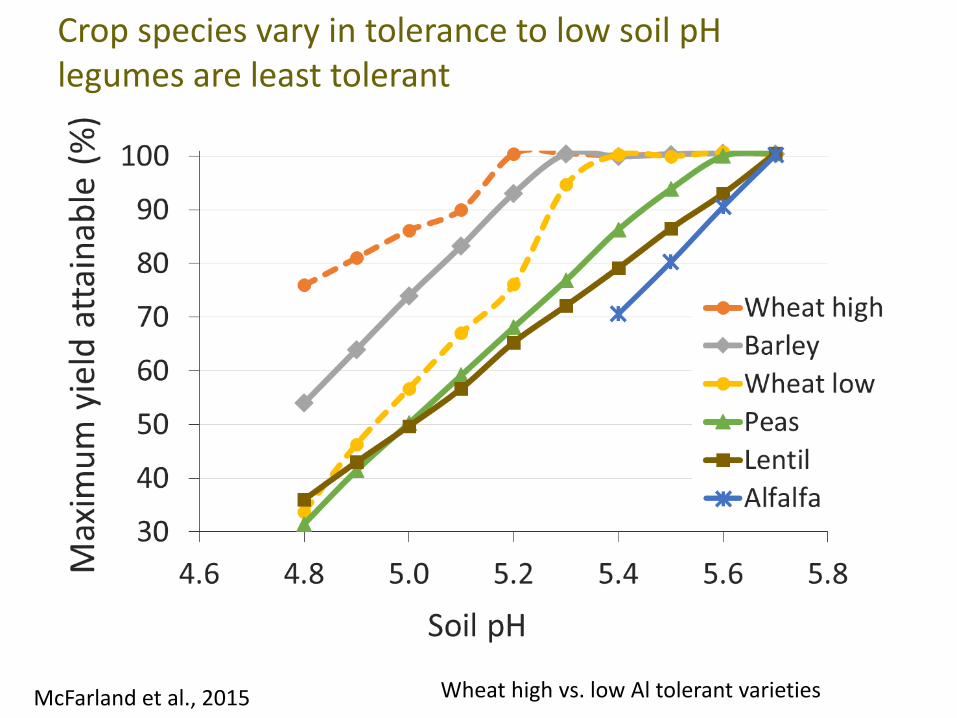
Crop species vary in tolerance to low soil pHlegumes are least tolerant
McFarland et al., 2015 Wheat high vs. low Al tolerant varieties
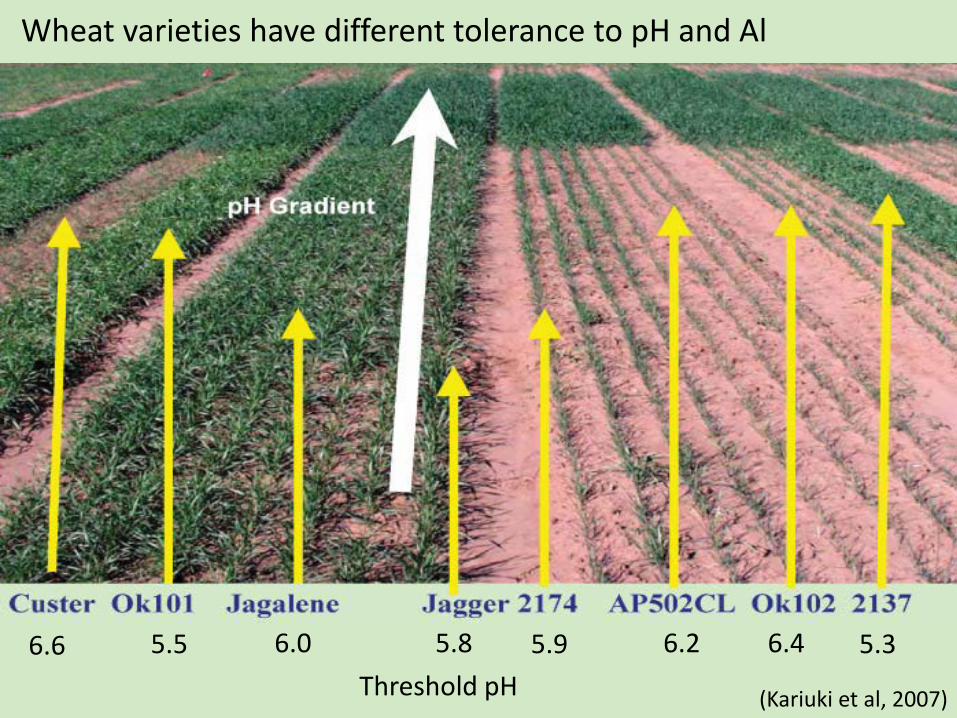
5.35.86.05.56.6 5.9 6.2 6.4
Wheat varieties have different tolerance to pH and Al
Threshold pH (Kariuki et al, 2007)
Winter wheat varieties with higher pH and Al tolerance
• Judee based on variety screening in Oklahoma
• Warhorse and Bearpaw have gene for Al tolerance (P Bruckner pers comm)
http://plantsciences.montana.edu/crops
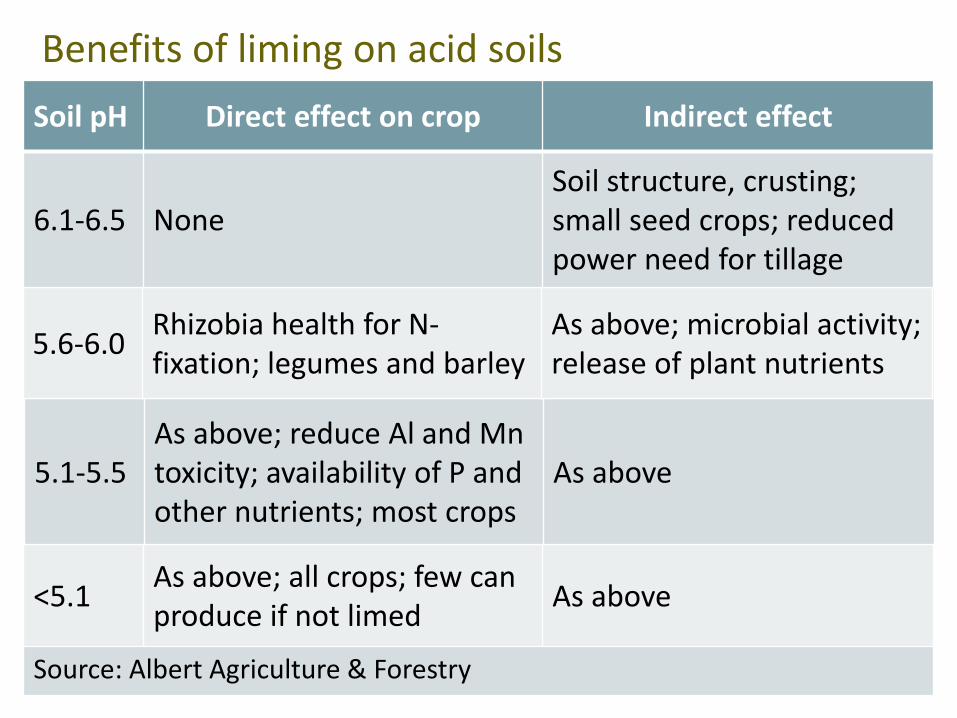
Benefits of liming on acid soilsSoil pH Direct effect on crop Indirect effect
6.1-6.5 NoneSoil structure, crusting; small seed crops; reduced power need for tillage
5.6-6.0 Rhizobia health for N-fixation; legumes and barley
As above; microbial activity; release of plant nutrients
5.1-5.5As above; reduce Al and Mn toxicity; availability of P and other nutrients; most crops
As above
<5.1 As above; all crops; few can produce if not limed As above
Source: Albert Agriculture & Forestry
Soil pH Direct effect on crop Indirect effect
6.1-6.5 NoneSoil structure, crusting; small seed crops; reduced power need for tillage
5.6-6.0 Rhizobia health for N-fixation; legumes and barley
As above; microbial activity; release of plant nutrients
5.1-5.5As above; reduce Al and Mn toxicity; availability of P and other nutrients; most crops
As above
Soil pH Direct effect on crop Indirect effect
6.1-6.5 NoneSoil structure, crusting; small seed crops; reduced power need for tillage
5.6-6.0 Rhizobia health for N-fixation; legumes and barley
As above; microbial activity; release of plant nutrients
Soil pH Direct effect on crop Indirect effect
6.1-6.5 NoneSoil structure, crusting; small seed crops; reduced power need for tillage
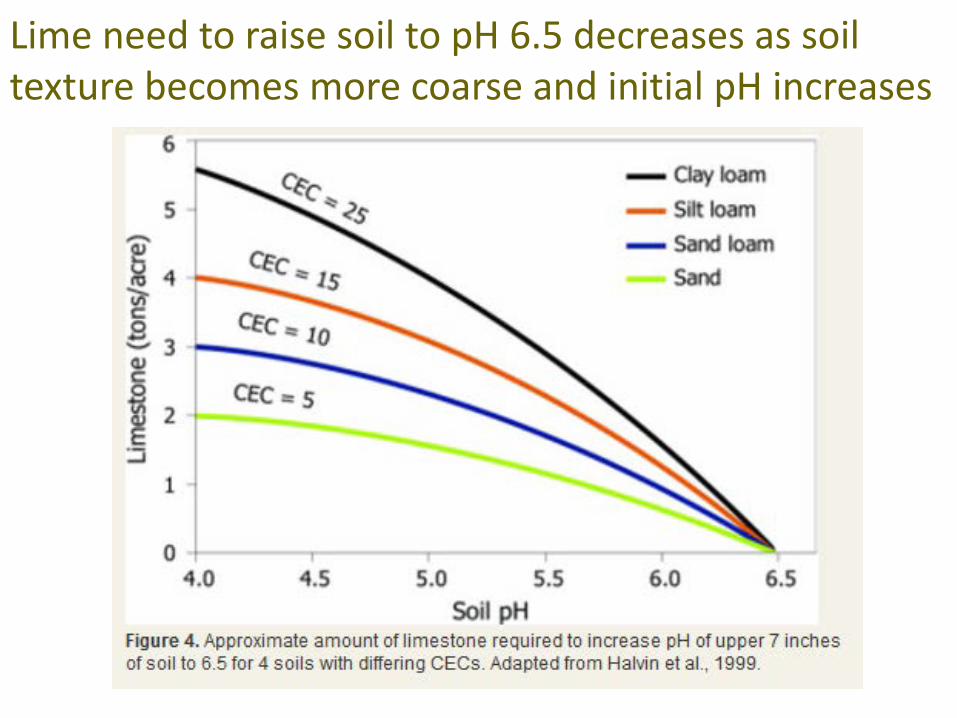
Lime need to raise soil to pH 6.5 decreases as soil texture becomes more coarse and initial pH increases
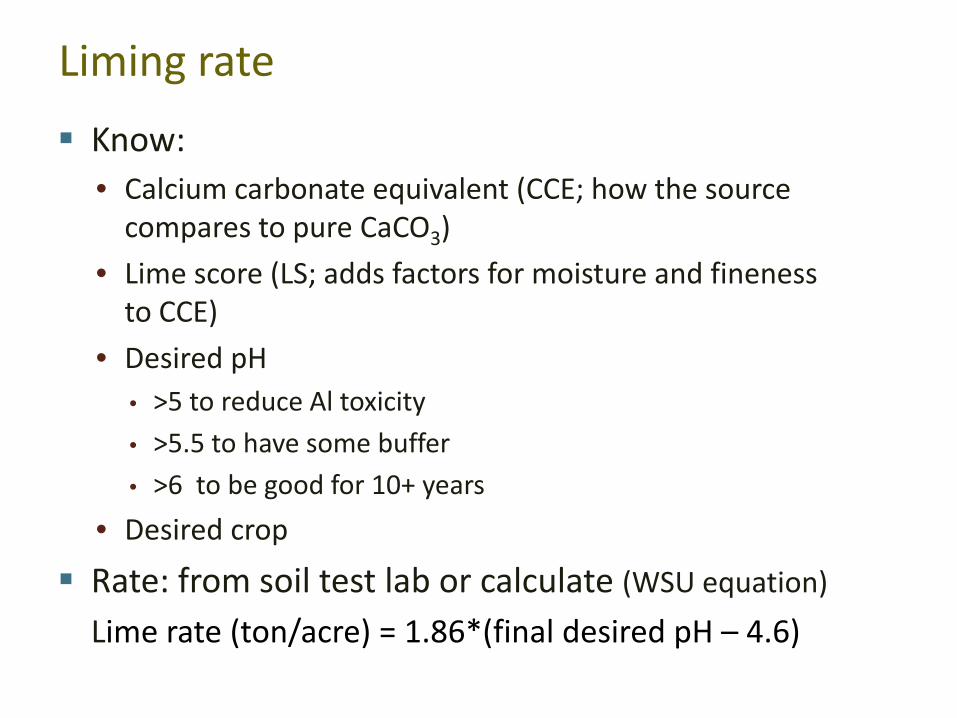
Liming rate Know:
• Calcium carbonate equivalent (CCE; how the source compares to pure CaCO3)
• Lime score (LS; adds factors for moisture and fineness to CCE)
• Desired pH• >5 to reduce Al toxicity• >5.5 to have some buffer • >6 to be good for 10+ years
• Desired crop
Rate: from soil test lab or calculate (WSU equation)Lime rate (ton/acre) = 1.86*(final desired pH – 4.6)
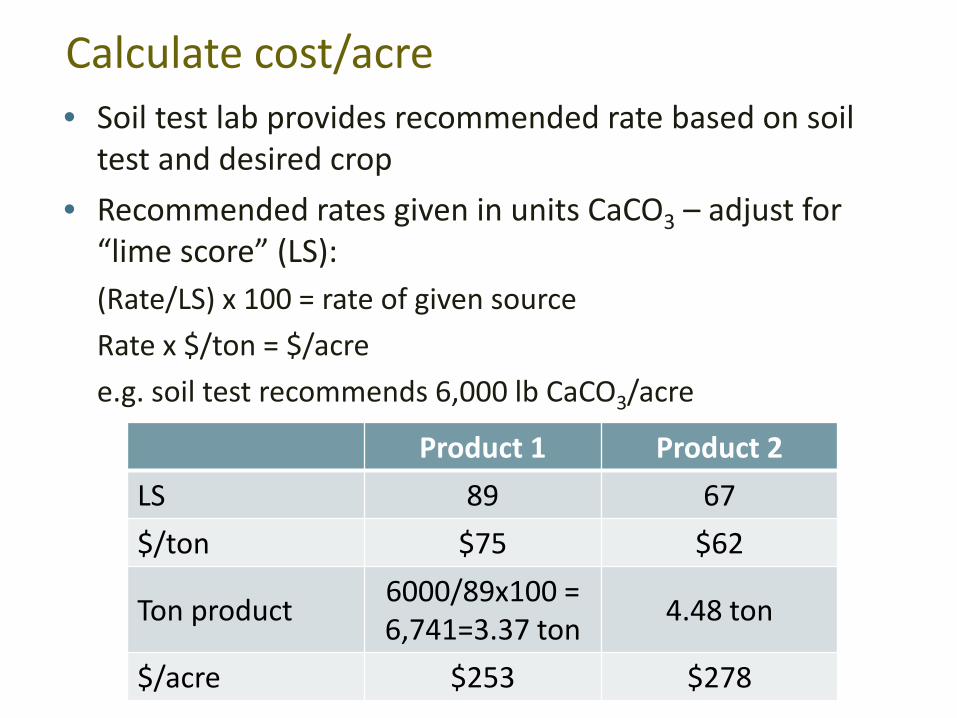
Calculate cost/acre• Soil test lab provides recommended rate based on soil
test and desired crop• Recommended rates given in units CaCO3 – adjust for
“lime score” (LS):(Rate/LS) x 100 = rate of given sourceRate x $/ton = $/acree.g. soil test recommends 6,000 lb CaCO3/acre
Product 1 Product 2LS 89 67$/ton $75 $62
Ton product 6000/89x100 = 6,741=3.37 ton 4.48 ton
$/acre $253 $278
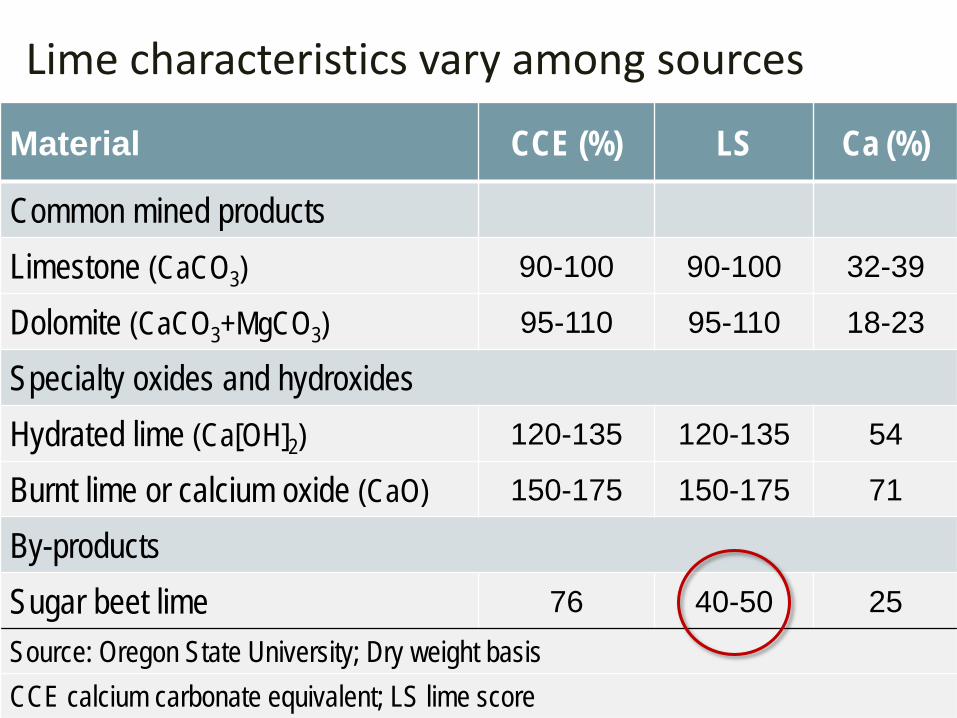
Lime characteristics vary among sources
Material CCE (%) LS Ca (%)
Common mined productsLimestone (CaCO3) 90-100 90-100 32-39
Dolomite (CaCO3+MgCO3) 95-110 95-110 18-23
Specialty oxides and hydroxidesHydrated lime (Ca[OH]2) 120-135 120-135 54
Burnt lime or calcium oxide (CaO) 150-175 150-175 71
By-productsSugar beet lime 76 40-50 25Source: Oregon State University; Dry weight basis CCE calcium carbonate equivalent; LS lime score
How much does lime cost in Choteau (delivered)? Limestone vs Sugarbeet lime
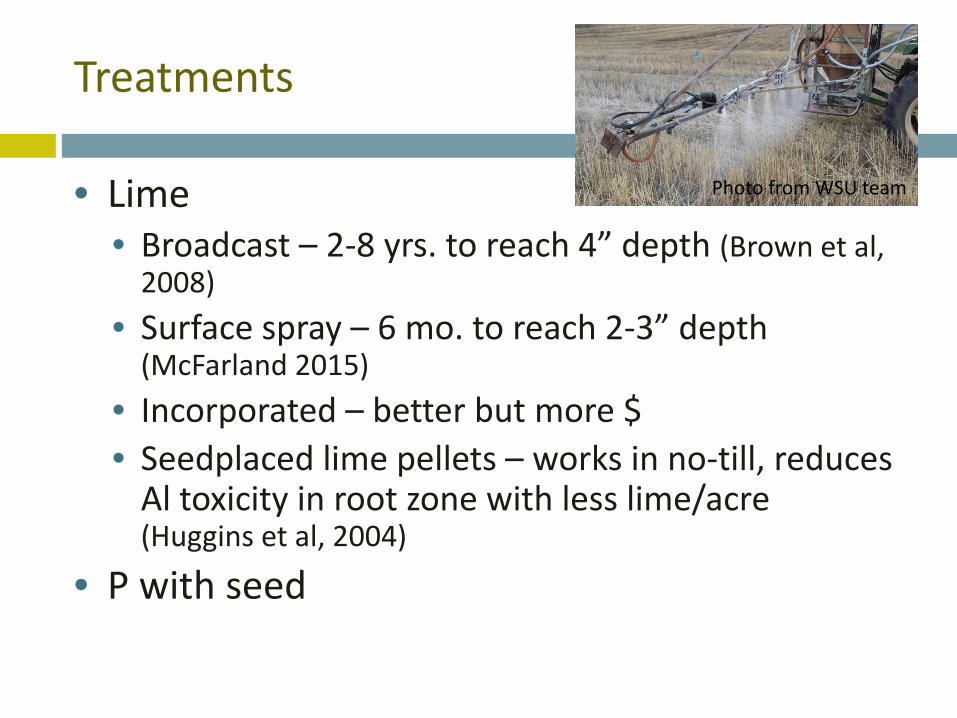
Treatments
• Lime • Broadcast – 2-8 yrs. to reach 4” depth (Brown et al,
2008)• Surface spray – 6 mo. to reach 2-3” depth
(McFarland 2015)• Incorporated – better but more $• Seedplaced lime pellets – works in no-till, reduces
Al toxicity in root zone with less lime/acre (Huggins et al, 2004)
• P with seed
Photo from WSU team

Only high rates of surface applied lime change pH at seed depth within 6 months after application
McFarland 2015 (thesis defense, WSU)
aabb
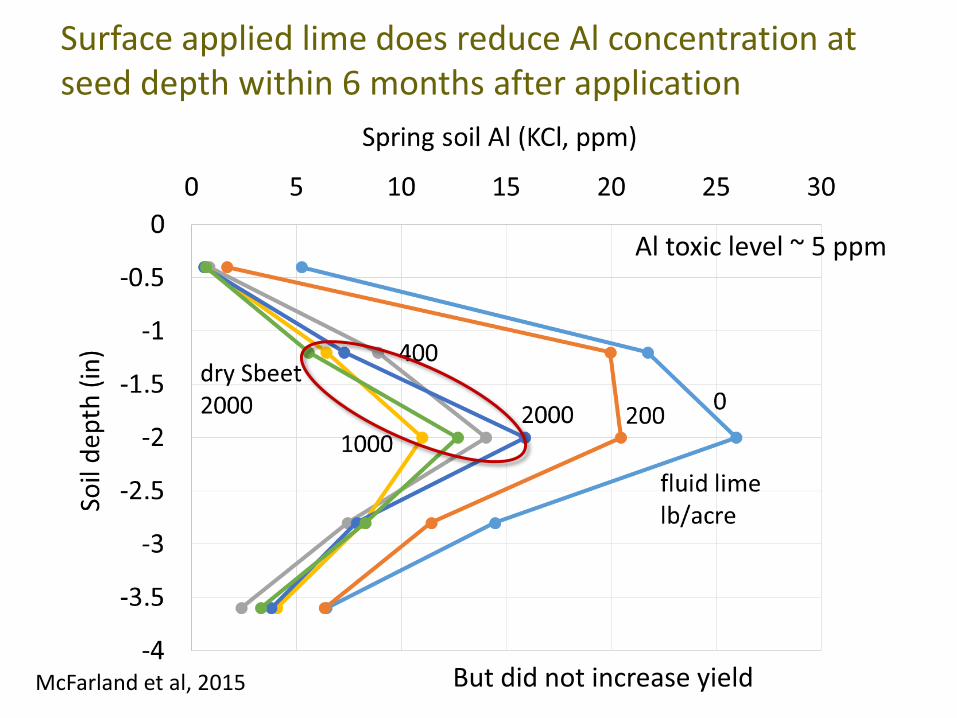
Surface applied lime does reduce Al concentration at seed depth within 6 months after application
McFarland et al, 2015 But did not increase yield
Al toxic level ~ 5 ppm
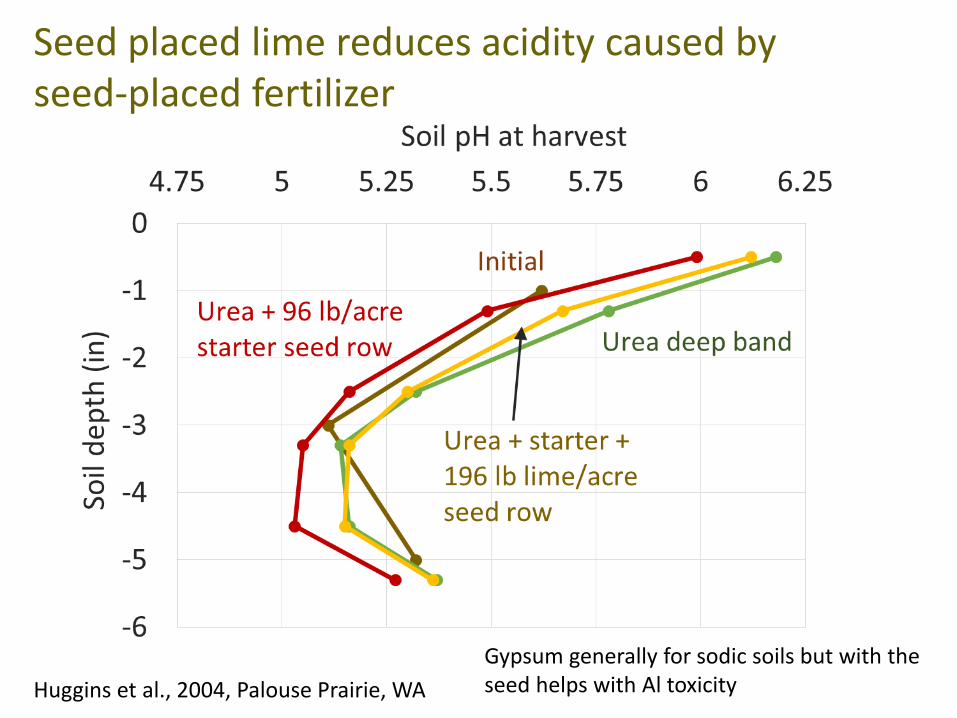
Seed placed lime reduces acidity caused by seed-placed fertilizer
Huggins et al., 2004, Palouse Prairie, WAGypsum generally for sodic soils but with the seed helps with Al toxicity
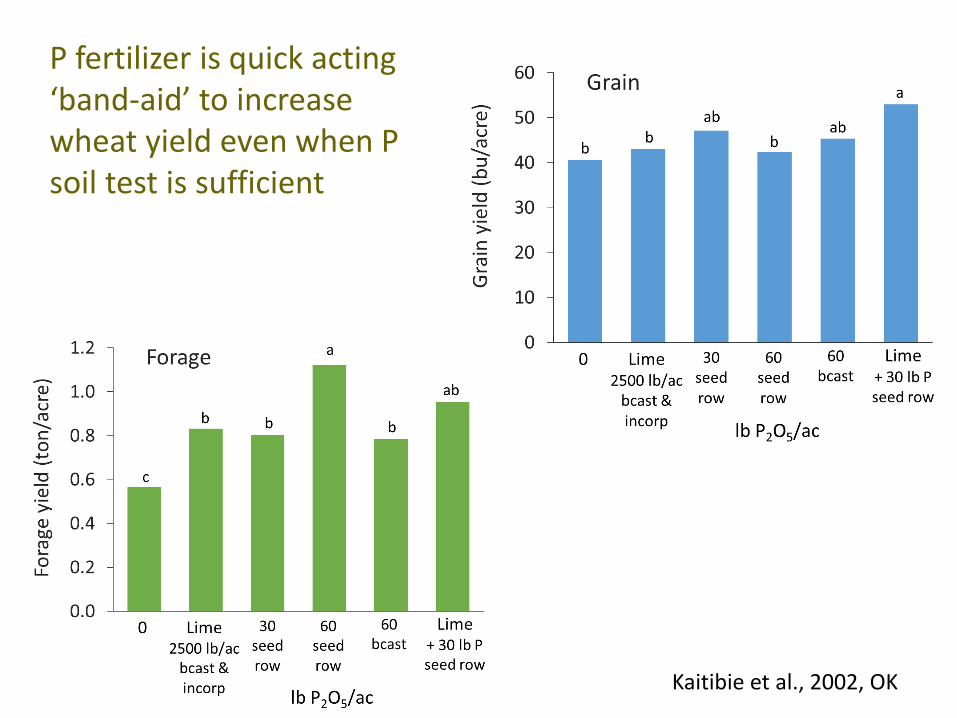
P fertilizer is quick acting ‘band-aid’ to increase wheat yield even when P soil test is sufficient
Kaitibie et al., 2002, OK
Summary
• Cropland soils are becoming more acidic, at least on Highwood Bench, in part due to N fertilization
• This reduces yields for several reasons• Management options exist to cope with, slow
down or reverse the trend of soil acidification• My colleague, Rick Engel, is writing a Fertilizer
Check-Off proposal to study this issue.
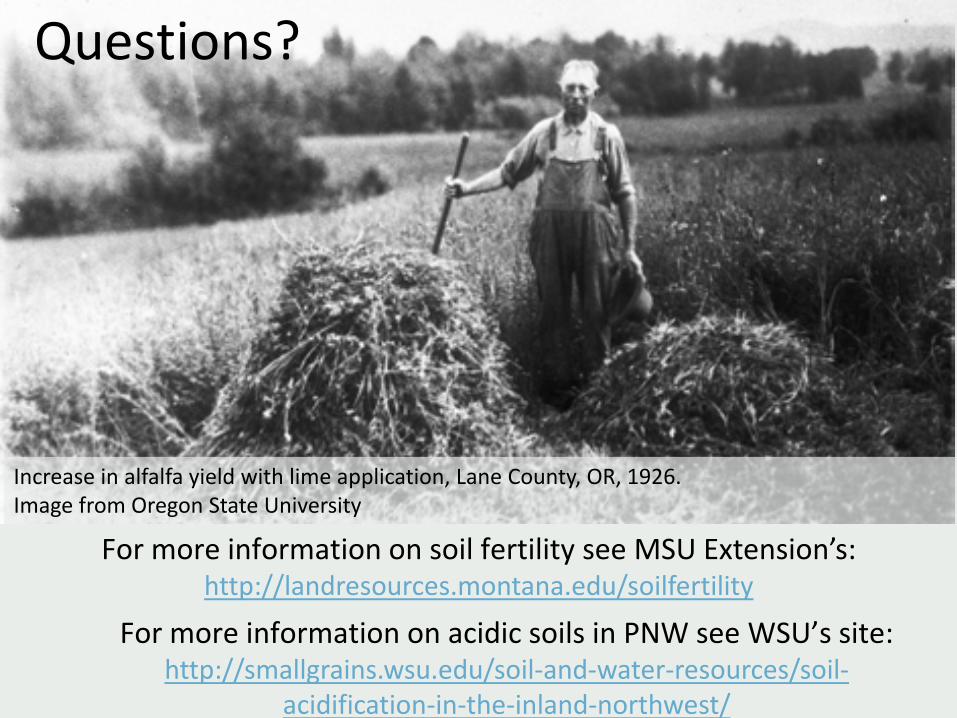
Increase in alfalfa yield with lime application, Lane County, OR, 1926. Image from Oregon State University
For more information on soil fertility see MSU Extension’s:http://landresources.montana.edu/soilfertility
Questions?
For more information on acidic soils in PNW see WSU’s site:http://smallgrains.wsu.edu/soil-and-water-resources/soil-
acidification-in-the-inland-northwest/