softconversion contor 20080228 2 · acre ft/year (not a prediction of gains, estimate of...
TRANSCRIPT

1
Soft Conversions
Presentation to theComprehensive Aquifer Management
Plan CommitteeIdaho Falls, February 2008
B. Contor

2
The Potential Application of Additional Surface Waterto Irrigated Lands
Having Both Surface-water and Ground· water Irrigation Rights,
to Benefit the Eastern Snake Plain Aquifer:
Soft Conversions
PT_od .. _ w .. " R ____ Ro_ ....... ~ __ ,IT'"
01 """"",, . """"'"''''' T'E~ ASS>STA><C£ '00 .... STE ... """"" PiAl" ACIUf'ER COIoO '""HEr<St<E AOO F ER o.w<""""'''1T ........ STUl!~
• __ w",, -.. ......... •• _ ... "" ",-,,,,,,,,oIW_ R-... ..
"_2000 ... ""w_-.. __ ... ..... r_ "-R-, 0000-<l02

3
Why conversions?
• Legal status of water use is irrigation• Double benefit to aquifer
– reduce pumping– increase incidental recharge
• Keeps land in production– "main-street" economic benefits
• Recharge is broadly distributed– fewer water-quality concerns

4
What are "mixed-source" lands?
• Lands that have both a valid surface-water right and a valid ground-water right

5
Paradigm 1
Ditch Pump
Well Pump

6
Paradigm 2
Ditch Pump
Well Pump

7
Paradigm 3
Ditch Pump
Well Pump

8
What are "soft conversions?"
• Full or partial replacement of ground-water with surface water, to irrigate mixed-source lands– already have surface water rights
– major infrastructure components (diversions & main canals) already exist
• To benefit the aquifer, there must be additional surface water delivered.

9
Illustration 1: Soft Conversion with Additional SW Delivery

10
"Before"
Diversion 50ET -40Net Rech 10
Pumping -50ET -40Perc 10

11
"After"
Diversion 100ET -80Net Rech 20

12
Comparison
Diversion 50ET -40Net Rech 10
Pumping -50ET -40Perc 10
Combined
GW Pump -50Net Rech +10GW Perc +10Total -30
Combined
GW Pump 0Net Rech +20Total +20
Diversion 100ET -80Net Rech 20
50 acre ftnew diversions
50 acre ftaquifer benefit
Before After

13
Illustration 2: Soft Conversion without
Additional SW Delivery
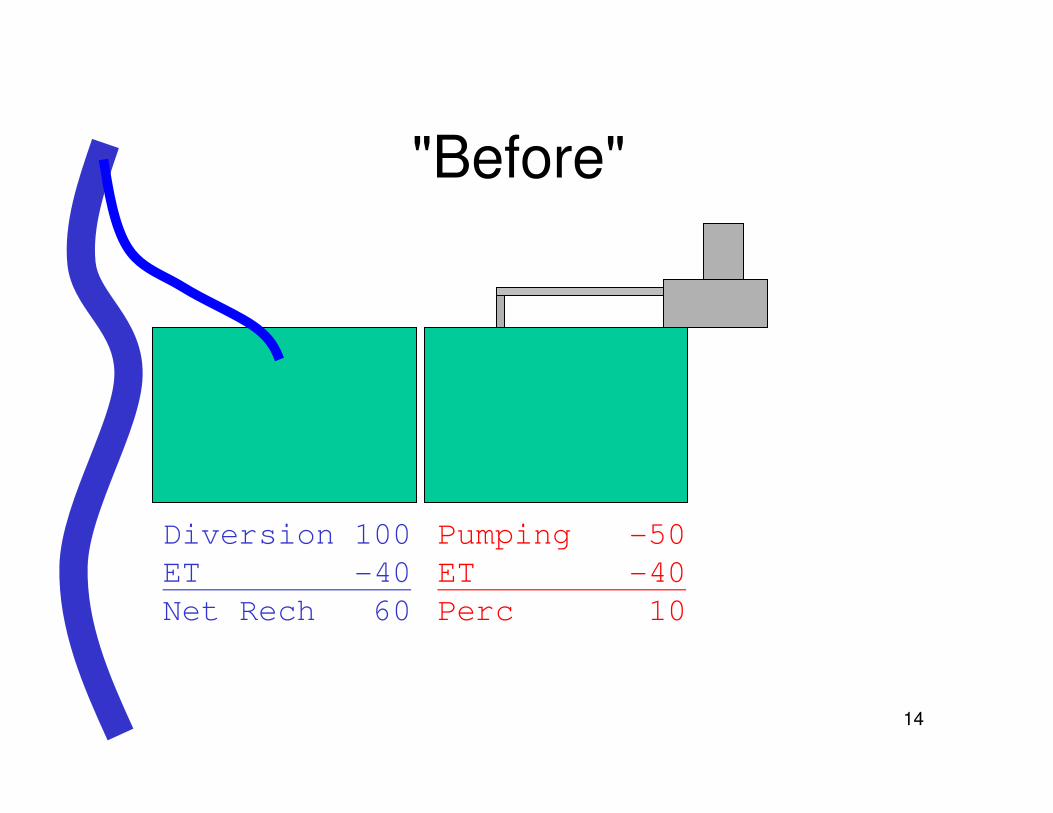
14
"Before"
Diversion 100ET -40Net Rech 60
Pumping -50ET -40Perc 10
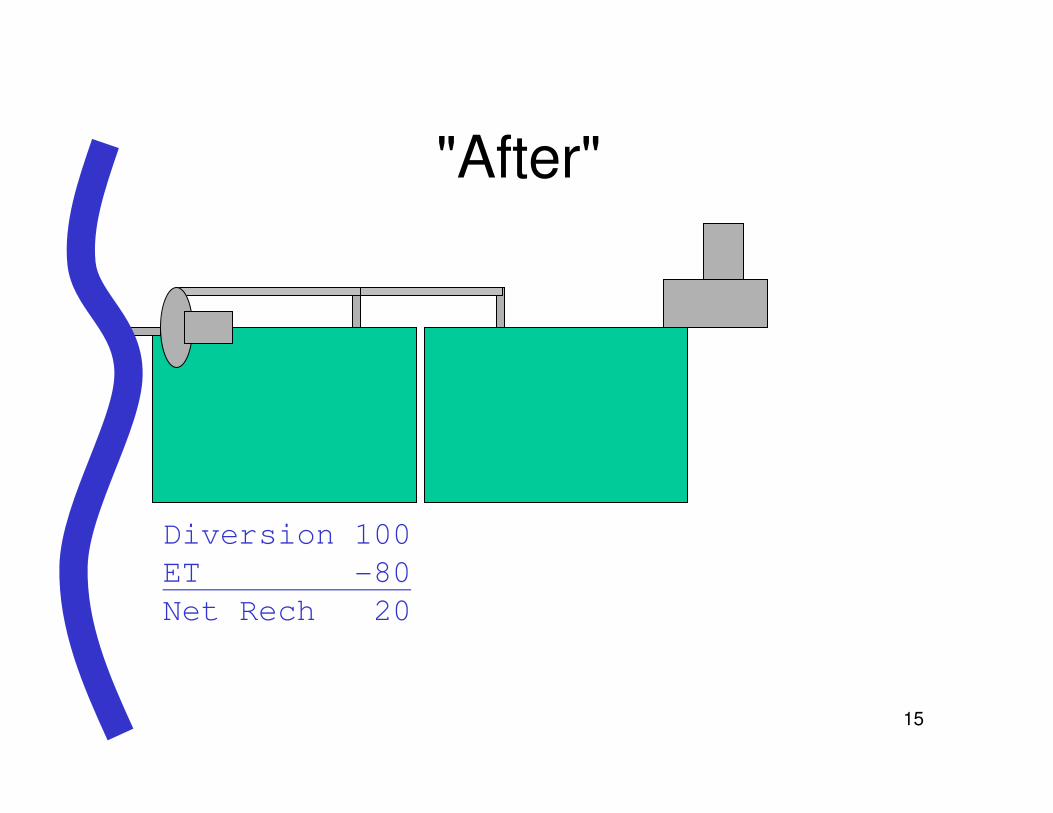
15
"After"
Diversion 100ET -80Net Rech 20

16
Comparison
Diversion 100ET -40Net Rech 60
Pumping -50ET -40Perc 10
Combined
GW Pump -50Net Rech +60GW Perc +10Total +20
Combined
GW Pump 0Net Rech +20Total +20
Diversion 100ET -80Net Rech 20
nonew diversions
no newaquifer benefit
Before After

17
Study Questions:
• How many mixed-source lands can receive additional surface-water supplies?
• What would it take to convert the rest?• Can the canals deliver to all these
parcels?
• Is there water available?

18
Study Approach:
• How many mixed-source lands can receive additional surface-water supplies?– Field inspection & WR file review

19

20
Study Approach:
• What would it take to convert the rest?– Field inspection & IDWR engineering
expertise
• Can the canals deliver to all these parcels?– Review of diversion data
– Letters to canal managers

21Figure 2 from report
Aberdeen Canal Maximum Monthly Diversions - IDWR Records
0
10
20
30
40
50
60
70
80
90
100
1920 1930 1940 1950 1960 1970 1980 1990 2000 2010
Yr
KA
F/m
onth Annual
Per Rec Capacity
20-yr Capacity

22
• Is there water available? – assessed by IDWR, not part of this study
23
Results:
• Most parcels are physically supplied by either GW or SW
• Very few are actually supplied by both
• Very few still have both types of infrastructure

24
• About 53,000 acres could reasonably be converted– nearly all would require a ditch pump
– about 2/3 would require additional improvements
• 3-phase power• ditch• mainline
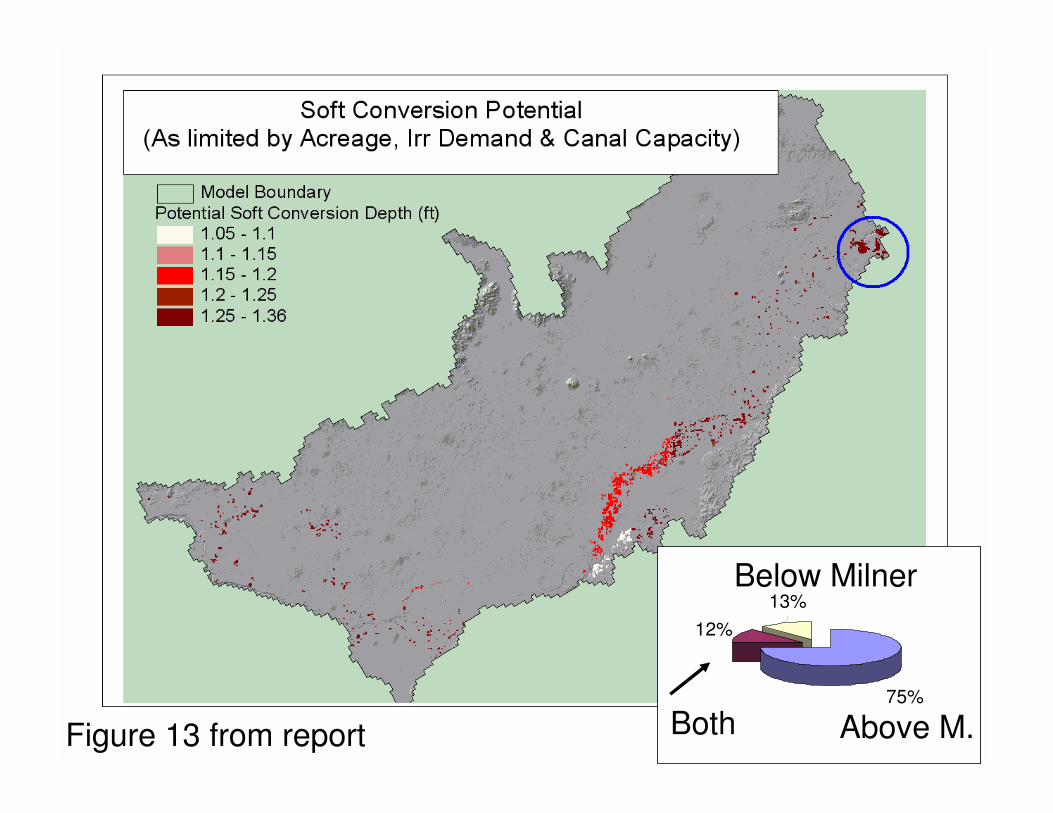
25Figure 13 from report
75%
12%
13%
Above M.
Below Milner
Both

26
• Most canals have adequate capacity to support soft conversions– One manager said laterals might need
enlargement
• Canals that are capacity-limited are only limited during peak demand
• Great benefit could still be obtained by delivering to soft conversions only in the spring and fall

27
Bottom Line:
• 53,000 acres reasonably convertible• Considering seasonal irrigation
demand, canal-capacity limitations & acreage under each canal, potential benefit to aquifer is 180,000 acre feet per year
• Cost is $3,000,000 for the easiest 1/3, $15,000,000 for all 53,000 acres

28
• $15,000,000/180,000 acre feet = $82 one-time investment for capacity to deliver 1 acre foot/year benefit
• $3,000,000/57,000 acre feet =$53 one-time investment for capacity to deliver1 acre foot/year benefit

29
• If this were the lowest-cost alternative, would supplies be available in many (most) years to supply these conversions? (see IDWR water-supply results)
– Presentations this afternoon assume available water is delivered to other uses first

30
• If soft conversions were supplied every year, most benefits would be realized at springs & rivers within 20 years (assuming 10-year phase-in)
Soft Conversions Total Benefit Assuming Full Supply
185,584
0
50,000
100,000
150,000
200,000
0 20 40 60 80 100 120 140 160
Year
Acr
e F
t/Y
ear
(NOT a prediction of gains, ESTIMATE of IMPROVEMENT)

31
• Most of the benefit would be available at Milner and above
Soft Conversions BenefitsAssuming Full Supply
164,143
21,440
185,584
0
50,000
100,000
150,000
200,000
0 50 100 150 200
Year
Acr
e F
t/Y
ear
Abv Milner
Blw Milner
Total
(NOT a prediction of gains, ESTIMATE of IMPROVEMENT)

32
Discussion

33
Backup slides

34

35
W-YR en ,cv ceo "'" em WR wc "" ,c, ,c, Ace ~ec '"' me 16.5 B C C C C " 57.4 '" 62.1 71.2 53.1 m me 16.5 B C C C C " 57.4 59.7 71.2 52.1 33.8 297.1
'"'' 16.5 B C C C C " 47.9 ffie " m TI, 274.4 1931 16.5 B C C C C , 40.1 " 44.1 "', 12.8 '"' , 1932 16.5 B C C C C " 44.3 "H 64.8 '" 24.9 265.3 1933 16.5 B C C C C " '" 74.1 67.2 51.8 27.2 282.3 1934 16.5 B C C C eo
'" 53.7 "'" "" '" 11.5 176.6
,% 16.5 B C C C C " 47.7 ffi' 61.1 "', 14.8 "" C m, 16.5 B C C C C " 9" 65.6 69.7 40.8 27.6 M 1937 16.5 B C C C C " '" ffi, 69.6 48.2 '" He m, 16.5 B C C C C " 9 H 64.9 69.1 51.4 31.0 W,
'"'' 16.5 B C C C C " 71.7 74.4 74.8 55.5 "', 334.9 1940 16.5 B C C C C " 67.7 73.9 '" '" 16.3 "" 1941 16.5 B C C C C " 63.4 73.3 ffi 48.1 32.6 n , 1942 16.5 B C C C C " 46.9 72.2 76.6 61.2 40.5 320.3 1943 16.5 B C C C C " 65.7 643 76.4 69.8 53.7 352.8 1944 16.5 B C C C C " 547 51.1 75.5 63.8 45.2 313.2 1945 16.5 B C C C C " ;ec ;e, 75.7 64.5 52.4 33].8 1946 16.5 B C C C C " 67.1 65.3 78.1 61.9 m 333.8 1947 16.5 B C C C C " 71.9 ;e, 79.3 "" 43.7 342 .8 1948 16.5 B C C C C " 53.2 62.9 77.7 67.4 44.2 328.3 1949 16.5 B C C C C " ," mo 811 62.7 40.6 llO" '''''' 16.5 B C C C C " " 65.1 74.3 74.2 47.3 345 .8
"" 16.5 B C C C C " 59.6 70.3 79.7 67.7 '" EO ,
"" 16.5 B C C C C " 61.5 " 79.9 73.6 51.5 EO ,
''" 16.5 B C C C C " 51.5 57.9 ",e 67.6 42.5 323.2
"" 16.5 B C C C C " 69.1 62.6 78.6 ffi' 46.7 "C
"'" 16.5 B C C C C " 55.7 73.3 78.3 "'" 41.4 no , ,~ 16.5 B C C C C " "" 72.4 00, 73.8 52.5 376.8
"" 16.5 B C C C C " 32.7 76.7 87.5 "" 9" EO"
'''' 16.5 B C C C C " m, 77.8 87.4 62.4 40.3 E U
"'" 16.5 B C C C C " " "''' ffiC 69.4 47.3 374.3
'''' 16.5 B C C C C " ffi, 83.8 91.6 65.2 49.7 381.7
'''' 17.6 " C C C C ;0 ffi' 75.5 79.3 57.7 15.3 317.2
''', 17.6 " C C C C ;0 " 74.6 00' 70.2 61.0 379.1
''', 17.6 " C C C C ;0 m '" 91.5 72.4 42.7 325.8
'''' 17.6 " C C C C ;0 40.2 ;eo 00" 77.8 ;e, 345 .1
''', 17.6 " C C C C ;0 me '" "" ffi~ 542 359.7
'''' 17.6 " C C C C ;0 76.7 en en 72.8 47.5 392.2
'''' 17.6 " C C C C ;0 45.8 59.3 en 79.7 ffi ::63.3
'''' 17.6 " C C C C ;0 " " 91.7 '" 44.2 ::62.6
'"'' 17.6 " C C C C ;0 77.9 71.8 91.1 82.3 em 4[6 .7 1970 17.6 " C C C C ;0 46.6 " 87.5 76.4 48.4 E" 1971 17.6 " C C C C " 52.2 74.3 ffi' 71.7 43.2 348.9 1972 17.6 " C C C C , 73.7 74.5 877 70.2 46.3 377.1 1973 "" C C C C C , ffi' ffi, 00, 74.6 49.3 "'" 1974 24.5 C C C C C ," 61.9 ffi, ,m 077 52.4 liH 1975 "" C C C C C C 21.1 "''' ffio 70.6 " 340.5 1976 "', C C C C C C 41.8 " ffi 52.1 45.2 313.3 1977 m u c c c c " 52.7 ffi, 73.7 51.5 33.3 m 1978 18.8 C C C C C U 43.2 ffi, 74.1 ;e, m 'mC 1979 31.4 C C C C C " 59.5 72.1 76.6 ;e, 48.7 "" C '"" M C C C C C , m 61.5 "" 57.4 42.8 m
'''' 21.6 C C C C C ,C 37.6 65.2 77.8 62.2 52.1 322.3
''', 18.6 " C C C C H 44.9 57.4 65.9 '" m 284.4 ,em 17.4 c C c c C 10.3 m '" 65.3 52.1 45.6 287 .9
'''' 19.3 C C C C C B 37.4 54.5 62.2 44.8 41.7 263 .8
''''' m c c c c c e" 48.7 65.1 ffiC 54.6 " 3]2.2
"'" 16.8 C C C C C 12.9 " 61.1 59.9 49.3 37.2 xm
'"" 19.7 C C C C C 22.7 59.7 ffi, 61.9 54.4 42.6 329.3
''''' 19.7 C C C C C "" 61.3 71.5 " '" E 317.2 ,ern "', c u c c C 13.6 59.4 67.2 " 53.6 41.8 DU
'''' 19.1 C C C C c m " 64.9 72.8 55.8 46.2 337.6
"" "', c c c c C 14.4 " ffi, 72.5 57.2 44.5 312.1
"" 21.1 C C C C C 3' 69.6 64.9 55.7 34.9 m 3]1 .6
"B H C C C C c n 37.3 53.4 ffi, 49.1 m 254 .9
'''' "" c c c c C 19.9 61.9 75.4 74.5 9" " 354.8 me 13.7 c C c c C 23.9 48.7 49.3 67.6 55.6 48.2 '" ,em '" c c c c C 23.6 55.3 ffi, ffi' 57.2 46.2 341.5
'''' m c c c c C 18.8 57.1 " 63.6 m, 45.5 mo ,em 22.1 c C c c c "" 57.1 59.4 73.2 ;e, 45.6 3439
"m 17.5 c C c c C 22.3 49.7 'U 74.5 61.1 52.9 n, = ';0 C C C C C 'EO 63.5 " 73.9 62.9 47.9 400.4
"'" 23.4 C C C C C 15.5 62.1 ffi' 61.1 "" 19.9 283.5
"", C C C C C C '" 53.8 67.9 64.9 52.5 21.0 "" , "'"' co c c c c c m 59.3 78.1 70.1 3' 19.2 282.4
"'" C C C C C C 18.3 62.5 65.1 62.3 m 3" 294.4
= C C C C C C '" 47.3 65.1 71.7 54.4 46.5 294 .1

36Figure 1 from report
Legend
D Inspected.Jlo~Qons
D 300_ran oom]ct,' Qct1 s
o Modellou nd arylDTM83
Prepared by Paul L. Pelot

37Figure 3 from report
D Counties _ IESW018 D Model Bndry IESW019 SW Entities IESW020 _ IESWOOO IESW022
IESW001 IESW025 _ IESW002 IESW027 _ IESW005 IESW028
IESW007 _ IESW029 IESW008 _ IESW030 IESW009 IESW031 IESW010 IESW032 IESW011 IESW033 IESW012 IESW034 IESW014 IESW035 IESW015 _ IESW036
_ IESW016
IESW037 IESW038
_ IESW039 IESW040
_ IESW041 IESW044 IESW051 IESW052
_ IESW053 IESW054 IESW055 IESW056
_ IESW057

38Figure 4 from report
Water-right Status of Surface-water Irrigated Lands in ESPAM1.1 Data
D Counties D Model Boundary SW Entities - Water Right Status
GW&SW _SWOnly

39Figure 5 from report
43%
6%
51%
GW
Mixed
SW
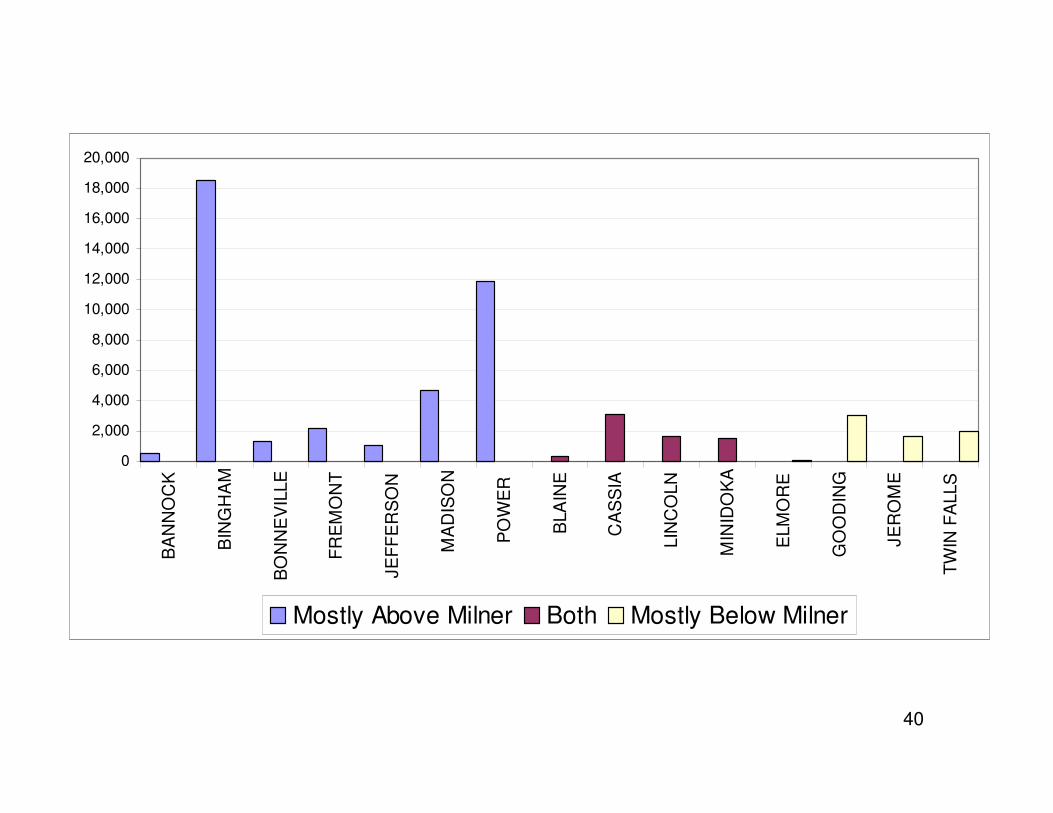
40
0
2,000
4,000
6,000
8,000
10,000
12,000
14,000
16,000
18,000
20,000B
AN
NO
CK
BIN
GH
AM
BO
NN
EV
ILLE
FR
EM
ON
T
JEF
FE
RS
ON
MA
DIS
ON
PO
WE
R
BLA
INE
CA
SS
IA
LIN
CO
LN
MIN
IDO
KA
ELM
OR
E
GO
OD
ING
JER
OM
E
TW
IN F
ALL
S
Mostly Above Milner Both Mostly Below Milner

41Figure 6 from report
0%
10%
20%
30%
40%
0 1 2 3 Impractial
No. of Improvements in Addition to Pump
Improvements Needed for Soft Conversion,Field Inspection of Sample Sites

42Figure 7 from report
0%
20%
40%
60%
80%
0.00 0.10 0.20 0.30 0.40 0.50 0.60 0.70 0.80 0.90 1.00
Miles
Miles of Power Line Needed for Soft Conversion,Field Inspection of Sample Sites

43Figure 8 from report
0%
20%
40%
60%
80%
0.00 0.10 0.20 0.30 0.40 0.50 0.60 0.70 0.80 0.90 1.00
Miles
Miles of Ditch Needed for Soft Conversion,Field Inspection of Sample Sites

44Figure 9 from report
0%10%20%30%40%50%60%70%80%
0.00 0.10 0.20 0.30 0.40 0.50 0.60 0.70 0.80 0.90 1.00
Miles
Miles of Pipe Needed for Soft Conversion, Field Inspection of Sample Sites

45Figure 10 from report
0.0
0.1
0.2
0.3
0.4
0.5
0.6
0.7
0.8
MA
R E
T
AP
R E
T
MA
Y E
T
JUN
ET
JUL
ET
AU
G E
T
SE
P E
T
OC
T E
T
ET
Req
(ft
/mo
)

46Figure 11 from report
Available Canal Capacity
0
200,000
400,000
600,000
800,000
1,000,000
1,200,000
1,400,000
MAR APR MAY JUN JUL AUG SEP OCT
Acr
e F
eet

47Figure 12 from report
Soft Conversion Potential as Limited by Convertible Acres, Irrigation Demand and Canal Capacity (if supply were to be made available)
0
20,000
40,000
60,000
80,000
100,000
120,000
140,000
160,000
180,000
MAR APR MAY JUN JUL AUG SEP OCT Sum SumThrough
June
Net
Aq
uif
er B
enef
it,
AF
/yr

48Figure 14 from report
Soft Conversion Potentialand Available Canal Capacity
0
1,000,000
2,000,000
3,000,000
4,000,000
5,000,000
6,000,000
MAR APR MAY JUN JUL AUG SEP OCT Sum
Acr
e F
eet
Conv. Requirements Avail. Capacity

49Figure 15 from report
0
10
20
30
40
50
60
70
80
April May Jun Jul Aug Sep Oct
Div
ersi
on
s K
AF
/mo
nth
Manager 19-yr Avg
IWRRI Study Avg

50Figure 16 from report
0
10
20
30
40
50
60
70
80
90
April May Jun Jul Aug Sep Oct
Div
ersi
on
s K
AF
/mo
nth
Manager 12-yr Avg
IWRRI study Avg

51Table 1 from report
Table 1
Infrastructure Improvements Needed for Soft Conversion of 53,000 Acres (410 sites)
Within the Eastern Snake Plain Aquifer
Improvement Number Approximate CostPumping plant 410 $9,060,000 3-phase power line 29 miles $3,220,000 Earthen ditch 19 miles $150,000 Buried pipeline 46 miles $2,470,000 Total cost $14,900,000 Average cost/site $36,500

52Table 2 from report
Table 2
Soft-conversion Convertible Acres by Surface-water Irrigation Entity
Entity Acres Entity Acres Entity Acres
IESW001 112 IESW018 4,317 IESW034 4,924IESW002 19,020 IESW019 2,471 IESW035 448IESW007 3,310 IESW020 495 IESW036 623IESW009 555 IESW022 2,627 IESW038 60IESW010 1,976 IESW027 932 IESW039 280IESW011 302 IESW028 634 IESW055 241IESW012 1,508 IESW030 1,562 IESW056 762IESW014 753 IESW031 0 IESW015 0 IESW032 4,157 IESW016 695 IESW033 72

53Table 3 from report
Table 3 Average Percentage of Irrigation Requirement
for Soft Conversions that Can Be Served With Available Unused Canal Capacity
Entity Apr May Jun Jul Aug Sep Oct
IESW001 100% 100% 100% 100% 100% 100% 100% IESW002 100% 100% 37% 27% 100% 100% 100% IESW007 100% 100% 100% 100% 100% 100% 100% IESW009 100% 100% 100% 100% 100% 100% 100% IESW010 100% 100% 100% 100% 100% 100% 100% IESW011 100% 100% 100% 100% 100% 100% 100% IESW012 100% 100% 100% 100% 100% 100% 100% IESW014 100% 100% 100% 100% 100% 100% 100% IESW015 N/A N/A N/A N/A N/A N/A N/A IESW016 100% 100% 100% 100% 100% 100% 100% IESW018 100% 100% 31% 27% 100% 100% 100% IESW019 100% 100% 100% 100% 100% 100% 100% IESW020 100% 100% 100% 100% 100% 100% 100% IESW022 100% 100% 100% 100% 100% 100% 100% IESW027 100% 100% 100% 100% 100% 100% 100% IESW028 100% 100% 100% 100% 100% 100% 100% IESW030 100% 100% 100% 100% 100% 100% 100% IESW031 N/A N/A N/A N/A N/A N/A N/A IESW032 100% 100% 100% 100% 100% 100% 100% IESW033 100% 100% 100% 100% 100% 100% 100% IESW034 100% 100% 100% 100% 100% 100% 100% IESW035 100% 100% 100% 100% 100% 100% 100% IESW036 100% 100% 100% 100% 100% 100% 100% IESW038 100% 100% 100% 100% 100% 100% 100% IESW039 100% 100% 100% 100% 100% 100% 100% IESW055 100% 100% 100% 100% 100% 100% 100% IESW056 100% 100% 100% 100% 100% 100% 100%
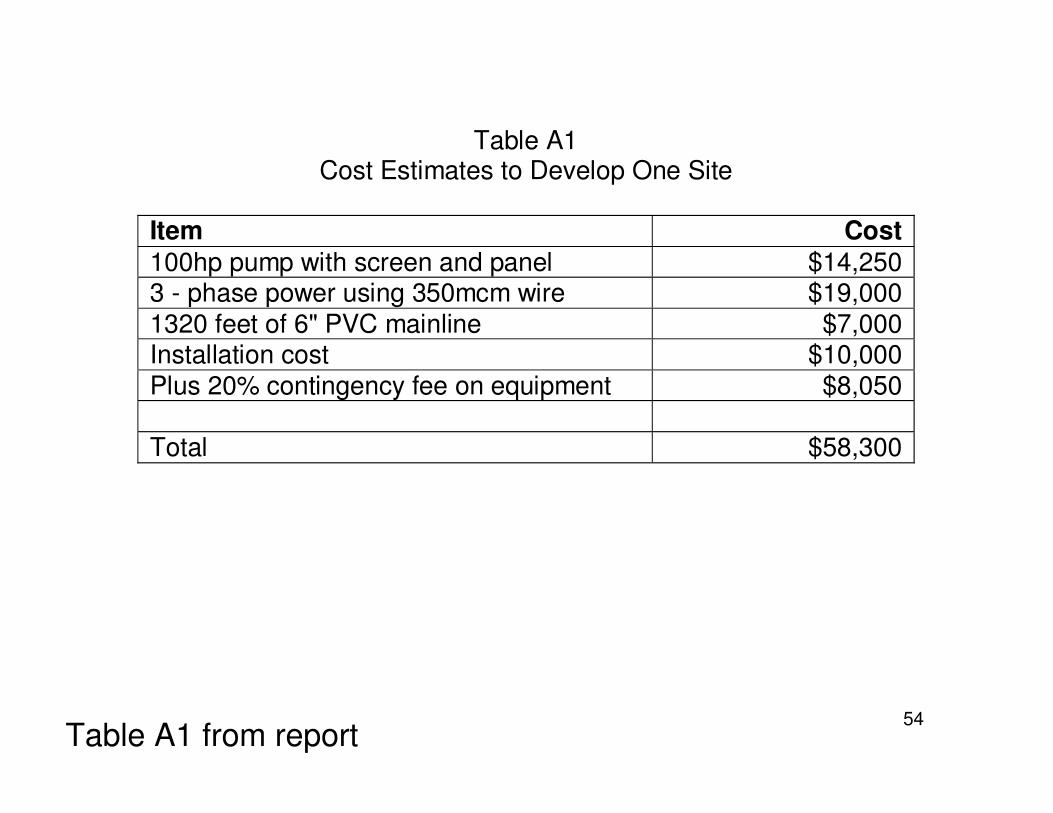
54Table A1 from report
Table A1
Cost Estimates to Develop One Site
Item Cost 100hp pump with screen and panel $14,250 3 - phase power using 350mcm wire $19,000 1320 feet of 6" PVC mainline $7,000 Installation cost $10,000 Plus 20% contingency fee on equipment $8,050
Total $58,300

55Table A2 from report
Table A2 Adjusted Per-improvement Unit Costs
Item Base
Estimate Pump Only
Power Line
Mainline Ditch
Pumping Plant $14,250 $14,250 Power $19,000 $19,000 Mainline $7,000 $7,000 Ditch1 $2,000 $2,000 Installation $10,000 $5,000 $5,000 $5,000 Contingency (20%)
$8,050 $2,850 $3,800 $1,400
Total $60,300 $22,100 $27,800 $13,400 $2,000
Unit Site Mile Mile MileUnits in Base Estimate
1 0.25 0.25 0.25
Per Unit $22,100 $111,200 $53,600 $8,000
Table 1 in the body of the text applies the per-unit costs from Table A2, rounding the total to the nearest $10,000.