sockeye fry, smolt, and nursery lake monitoring of quesnel and shuswap lakes in 2004. jeremy
TRANSCRIPT

Sockeye fry, smolt, and nursery lake monitoring of Quesnel and Shuswap lakes
in 2004.
Jeremy Hume1
Ken Shortreed1
Timber Whitehouse2
March, 2005
1Fisheries & Oceans Canada, Cultus Lake Salmon Research Laboratory 4222 Columbia Valley Highway Cultus Lake B. C. V2R 5B6 2Fisheries & Oceans Canada British Columbia Interior Area 985 McGill Place Kamloops, BC V2C 6X6

Introduction
Record dominant brood year escapements occurred to Quesnel Lake in 2001 and to Shuswap Lake in 2002. The subdominant brood year escapement to Quesnel Lake in 2002 was not fully enumerated but was also estimated to be the highest on record (Steve Latham, Pacific Salmon Commission, personal communications, Fig. 1A, 2A). Potential juvenile sockeye densities from these large escapements far exceeded predicted optimal recruitment levels based on historic lake productivity assessments. The record escapements (particularly in Quesnel Lake) also returned unprecedented amounts of marine-derived nutrients (MDN) from sockeye carcasses. The effects of these escapements on density and growth of sockeye fry were assessed in 2002 and 2003 (Hume et al. 2004), and the effects on lake productivity were assessed in Quesnel Lake in 2003 (Hume et al. 2004; Shortreed et al., in prep). In 2003, escapements to both lakes were considerably lower than the earlier record escapements (Fig. 1A, 2A). The 2003 escapement was about an order of magnitude lower than the previous year in both lakes but at it was still the highest escapement on that nondominant cycle line in Quesnel Lake (Fig. 1B). In Shuswap Lake, the 2003 escapement was similar to recent subdominant escapements (Fig. 2B). Escapements in 2003 were below the long term (1970-2003) average escapement to each lake. The extensive time series of limnological and juvenile sockeye data presented us with an opportunity to examine the effects of variable inputs of MDN and the interactions between cycle lines. We conducted these studies through detailed surveys on the limnology of Quesnel Lake and surveys of juvenile sockeye abundance, size, and productivity in both lakes. An additional objective of the current study was to determine winter and spring growth of the 2002 brood year by sampling smolts leaving Quesnel and Shuswap lakes in the spring of 2004. There are relatively little data on emigrant smolt size from either lake and these data help in determining variability in over-winter growth and the utility of using fall fry size data as a predictor of smolt size. Our specific objectives were:
1. Conduct detailed monthly limnological sampling at Quesnel Lake to assess top down or bottom up mechanisms that relate to carry over effects on lake primary and secondary production and on sockeye production.
2. Conduct fall fry surveys at Quesnel and Shuswap lakes to determine fall abundance, size and distribution.
3. Conduct downstream trapping at Quesnel and Shuswap lake outlets to representatively sample and quantify smolt size at emigration in 2004.
Study Area
Quesnel, and Shuswap lakes are located in the south-central portion of the interior plateau of British Columbia and are two of the larger lakes in the Fraser River drainage basin. The climate consists of cold winters and warm, dry summers but winters are much less severe at Shuswap than at Quesnel Lake.
2

Quesnel Lake (52°30'N, 120°00'W) has a surface area of 272 km2 and its maximum depth of 523 m (mean depth = 150 m) makes it the ninth deepest lake in the world. It lies at an elevation of 725 m in the Cassiar-Columbia Mountain physiographic region and the Interior Western Hemlock biogeoclimatic zone of central British Columbia (Farley 1979). Annual precipitation ranges from <75 cm at the western end of the lake to about 150 cm at the eastern end (Farley 1979). The lake has a large (5,930 km2) drainage basin and an average water residence time of 9.8 yr. Quesnel Lake is dimictic, with winter ice cover occurring each year. The most important spawning areas for adult sockeye are the lake's two major tributaries, the Horsefly and Mitchell rivers, while smaller numbers of sockeye spawn in many small streams. Further, in some years substantial numbers spawn along the shores of the lake. Two shallow bays have very low densities of sockeye fry and have been excluded in our analysis of sockeye densities (adults and juveniles), resulting in a surface area of 261 km2. With an area of 330 km2 including Mara Lake, Shuswap Lake, is the second largest in the Fraser River system. It is the most southerly (50°00'N, 119°05'W) of our study lakes and also is situated at a substantially lower elevation (346 m). Consequently, the climate is milder, resulting in a longer growing season, more prolonged and pronounced thermal stratification, and a warmer epilimnion than in Quesnel Lake. Annual precipitation is 50-75 cm (Farley 1979). The large drainage basin (16,221 km2) and relatively shallow depth (mean=62 m, maximum=162 m) results in a water residence time of only 2.1 yr. While occasional strong winds do occur, Shuswap Lake is much less windy than Quesnel Lake. Sockeye spawn in a number of lake tributaries and in the lake itself, with approximately 70% of the total escapement spawning in the Adams River, which enters Shuswap Lake only 2 km from the outlet of the lake.
Methods
Limnology - Quesnel Lake Limnological data were collected once monthly from May to October (n=6). Each month, four locations were sampled: station 3 (North Arm), 7 (western end Main Arm), 8 (eastern end Main Arm), and 9 (East Arm) (Fig. 3). Methods were similar to those used on many other limnological investigations of B.C. sockeye lakes (Shortreed et al. 2001). On each sampling date we used an Applied Microsystems Micro CTD 7079 to obtain temperature and conductivity profiles from the surface to 100 m. A standard white, 20-cm diameter Secchi disk was used to measure water clarity. A Li-Cor data logger (model LI-1000) equipped with a model LI-193SA spherical quantum sensor was used to measure photosynthetic photon flux density (PPFD) (400-700 nm) and determine euphotic zone depths. Dissolved oxygen (DO) concentrations at the surface and at 50 m were obtained using an Oxyguard Handy Beta meter. All water sampling took place between 0800 and 1100 h (PST). We used an opaque, 6-L Van Dorn bottle to collect all water samples. Integrated water samples (water from 4 depths within each integral was mixed) were collected from within the epilimnion and from the bottom of the epilimnion to the bottom of the euphotic zone. A hypolimnetic sample was collected from a depth of 50 m. In addition, at station 8 water was collected from 8 discrete depths from the surface to 50 m and later analyzed for nitrate and
3

chlorophyll concentration. All collected water was processed (filtered, frozen, or preserved) within 3 h of collection. Later replicate analyses from the integrated samples included total dissolved solids, chlorophyll, dissolved silica, phosphorus (total and dissolved), nitrogen (nitrate and ammonia), bacteria, and phytoplankton. Subsequent chemical analyses were carried out according to methods given in Stephens and Brandstaetter (1983) and Stainton et al. (1977). For total phosphorus determination, clean screw-capped test tubes were rinsed with sample, filled, capped, stored at 4°C, and later analyzed using a molybdenum blue method after persulfate digestion. Water for dissolved nitrate analyses was filtered through an ashed 47-mm diameter Micro Filtration Systems (MFS) borosilicate microfiber filter (equivalent to a Whatman GF/F filter) and then frozen. For chlorophyll analysis, we filtered water through 47-mm diameter, 0.45-µm Millipore HA filters, which were then frozen. Filters were later macerated in 90% acetone and chlorophyll concentration was determined using either a Turner Model 112 fluorometer or a Turner Designs Model 10-AU fluorometer. Water for bacteria enumeration was collected in sterile 20-mL glass vials and preserved with two drops of formaldehyde. Bacterioplankton were later counted using the DAPI method (Robarts and Sephton 1981). For phytoplankton enumeration and identification, opaque 125-mL polyethylene bottles were rinsed with sample, filled, and fixed with 1-mL of Lugol's iodine solution. Phytoplankton were enumerated and identified to genus or species using a Wild M40 inverted microscope equipped with phase contrast optics. Phototrophic picoplankton were enumerated using the method described by MacIsaac and Stockner (1985). Within a few hours of collection, 15 mL of water was filtered through a 0.2-µm Nuclepore filter counter-stained with Irgalan black. Filters were placed in opaque petri dishes, air-dried and stored in the dark at room temperature until analyzed. A Zeiss epifluorescence microscope equipped with a 397-nm longwave-pass exciter filter and a 560-nm shortwave-pass exciter filter, a 580-nm beam-splitter mirror and a 590-nm longwave-pass barrier filter was used for picoplankton enumeration. Filters were examined at 1250X magnification under oil immersion. In situ phytoplankton photosynthetic rates (PR) were estimated using standard techniques of 14C uptake in light and dark bottles. PR was determined at 7 discrete depths from the surface to below the euphotic zone. At each depth, three 125-mL glass bottles (2 light and 1 dark) were filled, inoculated with a
14C-bicarbonate stock solution,
and incubated for 1.5-2 h at the original sampling depth. Incubations commenced between 0900 and 1100 h (PST). At each sampling date we also inoculated three scintillation vials containing 0.5 mL of 0.2 N NaOH with the
14C-bicarbonate solution for
later determination of its activity. After incubations, bottles were placed in light-proof boxes and transported to the field laboratory where samples were filtered onto 25-mm diameter MFS glass fiber filters <2 h after incubation stopped. After filtration, filters were placed in scintillation vials containing 0.5 mL of 0.5 N HCl and lids were left off the vials for 6-8 h. Before counting, 10 mL of Scintiverse II (Fisher Scientific) was added to each scintillation vial. Activity in each vial was determined using a Beckman Coulter LS6500 liquid scintillation counter. A quench series composed of the same scintillation cocktail and filter used for samples was used to determine counting efficiency. The equation of Strickland and Parsons (1972) was used to calculate hourly PR. Daily PR (mg C·m-2·d-1) was estimated using sunlight data collected with Li-Cor LI-1000 data loggers and Li-Cor 190SA quantum sensors.
4
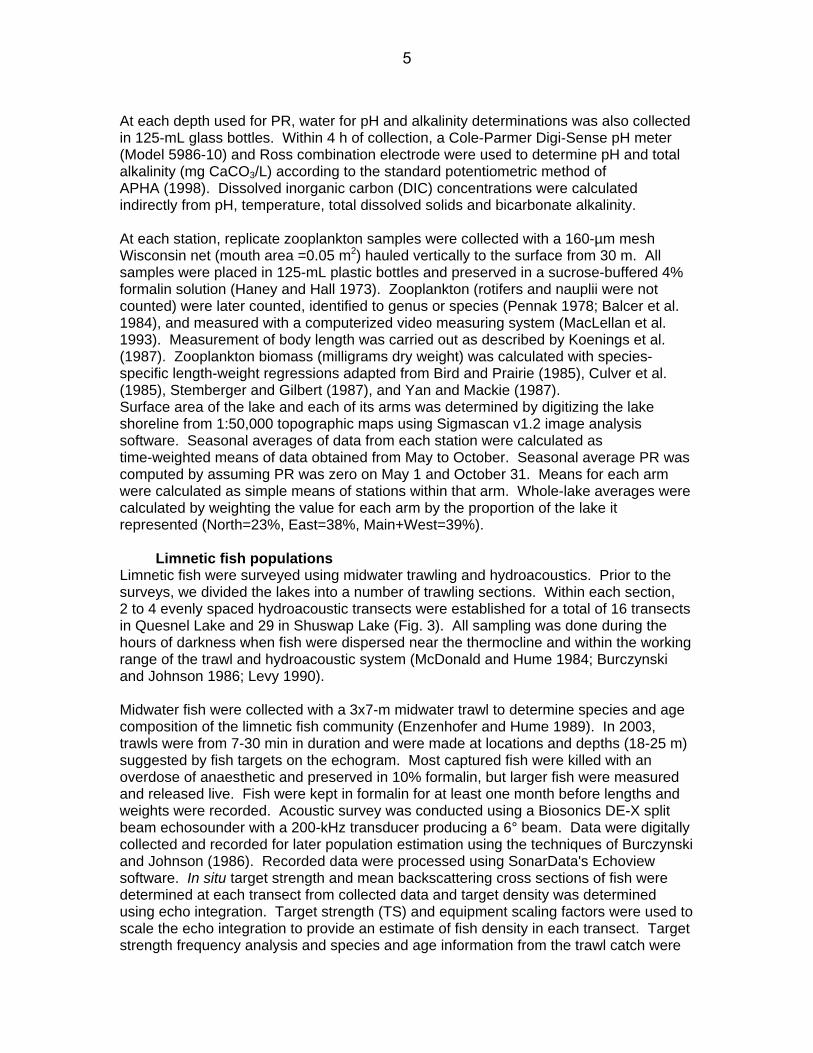
At each depth used for PR, water for pH and alkalinity determinations was also collected in 125-mL glass bottles. Within 4 h of collection, a Cole-Parmer Digi-Sense pH meter (Model 5986-10) and Ross combination electrode were used to determine pH and total alkalinity (mg CaCO3/L) according to the standard potentiometric method of APHA (1998). Dissolved inorganic carbon (DIC) concentrations were calculated indirectly from pH, temperature, total dissolved solids and bicarbonate alkalinity. At each station, replicate zooplankton samples were collected with a 160-µm mesh Wisconsin net (mouth area =0.05 m2) hauled vertically to the surface from 30 m. All samples were placed in 125-mL plastic bottles and preserved in a sucrose-buffered 4% formalin solution (Haney and Hall 1973). Zooplankton (rotifers and nauplii were not counted) were later counted, identified to genus or species (Pennak 1978; Balcer et al. 1984), and measured with a computerized video measuring system (MacLellan et al. 1993). Measurement of body length was carried out as described by Koenings et al. (1987). Zooplankton biomass (milligrams dry weight) was calculated with species-specific length-weight regressions adapted from Bird and Prairie (1985), Culver et al. (1985), Stemberger and Gilbert (1987), and Yan and Mackie (1987). Surface area of the lake and each of its arms was determined by digitizing the lake shoreline from 1:50,000 topographic maps using Sigmascan v1.2 image analysis software. Seasonal averages of data from each station were calculated as time-weighted means of data obtained from May to October. Seasonal average PR was computed by assuming PR was zero on May 1 and October 31. Means for each arm were calculated as simple means of stations within that arm. Whole-lake averages were calculated by weighting the value for each arm by the proportion of the lake it represented (North=23%, East=38%, Main+West=39%).
Limnetic fish populations Limnetic fish were surveyed using midwater trawling and hydroacoustics. Prior to the surveys, we divided the lakes into a number of trawling sections. Within each section, 2 to 4 evenly spaced hydroacoustic transects were established for a total of 16 transects in Quesnel Lake and 29 in Shuswap Lake (Fig. 3). All sampling was done during the hours of darkness when fish were dispersed near the thermocline and within the working range of the trawl and hydroacoustic system (McDonald and Hume 1984; Burczynski and Johnson 1986; Levy 1990). Midwater fish were collected with a 3x7-m midwater trawl to determine species and age composition of the limnetic fish community (Enzenhofer and Hume 1989). In 2003, trawls were from 7-30 min in duration and were made at locations and depths (18-25 m) suggested by fish targets on the echogram. Most captured fish were killed with an overdose of anaesthetic and preserved in 10% formalin, but larger fish were measured and released live. Fish were kept in formalin for at least one month before lengths and weights were recorded. Acoustic survey was conducted using a Biosonics DE-X split beam echosounder with a 200-kHz transducer producing a 6° beam. Data were digitally collected and recorded for later population estimation using the techniques of Burczynski and Johnson (1986). Recorded data were processed using SonarData's Echoview software. In situ target strength and mean backscattering cross sections of fish were determined at each transect from collected data and target density was determined using echo integration. Target strength (TS) and equipment scaling factors were used to scale the echo integration to provide an estimate of fish density in each transect. Target strength frequency analysis and species and age information from the trawl catch were
5

used to apportion the acoustic fish density for each transect. Acoustic estimates were apportioned into age-0 sized O. nerka , other fish of similar size, and large fish. First, estimates for small fish (TS of -63 to -44 dB) and large fish (TS>-44 dB) were made. The trawl catch, which is mostly unbiased for fish up to 150 mm, was then used to apportion the small fish into age-0 O. nerka and others. Based on many years of trawl catches, all of the large fish were assumed to be older age classes of kokanee. In any case, very large TS's (>=37 dB) comprised <1% of the sample. Data from each transect within a trawling section were averaged to provide a mean estimate of density for each section. Mean density was multiplied by the surface area of the section to provide a population estimate for the section and then summed to provide a total population estimate for the lake. Mean lake density was calculated by dividing the lake population estimate by the total surface area. Variances were calculated for the density of each section and were then weighted by the square of the section area. The sum of the weighted variances was divided by the square of the lake area to provide a variance for the lake population estimate. In this paper we report 95% confidence limits.
O. nerka ageing and stock identification We used both length-frequency analysis and scale analysis to age O. nerka captured in the midwater trawls. All O. nerka were initially assigned to preliminary age classes based on groupings determined from a simple length frequency analysis. It was apparent from the observed size distribution that most fish were young of the year (age-0) and up to 20 scales were randomly taken from this group to confirm this age classification. Scales were also taken from up to 20 of the larger fish. Ages from scales were then used to confirm ages from the length frequency analysis. In past years, we have found length frequency analysis to be almost always accurate on O. nerka from both lakes. If any discrepancies are found, the scale aging is used. All scale aging was done by modification of the methods described in Clutter and Whitesel (1956) (Shayne MacLellan, DFO, Nanaimo, personal communication). Juvenile O. nerka in both Quesnel and Shuswap lakes may be anadromous sockeye or non-anadromous kokanee. Based on scale analysis of returning adults, most sockeye migrate from Shuswap Lake after one winter as age-1 smolts (Pacific Salmon Commission, Vancouver, data on file). We therefore assumed that all age-1 and older O. nerka captured in trawls during July and October in Shuswap Lake were kokanee. Other than possibly size (in some lakes), there are no readily distinguishable physical differences between age-0 sockeye and age-0 kokanee (Wood and Foote 1990). Other techniques such as the use of DNA or Sr concentration in the otolith core (Rieman et al 1994) have been developed to distinguish sockeye and kokanee. In the past, we used either electrophoretic and Sr methods to identify kokanee but the appropriate labs either no longer exist or are unable to process our samples at this time. Modern DNA methods exist for stock identification of a sockeye-kokanee mix but require adult baseline data. These data does not yet exist for kokanee in these lakes but is planned for at least Quesnel Lake in the coming year. From our hydroacoustic estimates we derived an estimate of numbers of larger fish in both lakes. Based on trawl data and on data from previous years, these larger fish are almost entirely older kokanee. Provincial biologists have determined that on average 60% of the total kokanee population in lakes without sockeye are age-0 kokanee (Dale Sebastian, WLAP, Victoria, personal communications; Sebastian et al. 2003). Using this
6

index, we can generate a rough estimate the of the numbers of age-0 kokanee in both lakes.
Sockeye Diet Stomach contents from up to 20 O. nerka per midwater trawl sample were examined. To minimize bias caused by different digestion rates of prey, only fish captured in trawls made within 3 h after the onset of darkness (approximate start of the most intensive feeding period) were included in the analysis. Samples consisting of the contents of 10 pooled stomachs (two samples/tow) were subsampled with a Folsom plankton splitter and enumerated with a computerized video measuring system (MacLellan et al. 1993). Relative volume of prey types in the 12 stomachs and an index of stomach fullness expressed as a percentage by volume were estimated using a technique modified from Hellawell and Abel (1971).
Sockeye Smolts - Quesnel and Shuswap Lakes Sockeye smolts from the 2002 brood year were captured with an inclined plane trap (IPT) in the spring of 2004 as they were leaving Quesnel and Shuswap lakes. Fishing was conducted on the Quesnel River for 9 days from May 11- 25, 2004 and on the South Thompson River for 7 days from May 11 - 26, 2004. Fish were measured live shortly after capture. Scales were taken for ageing. Ageing results are not yet available.
Results and Discussion
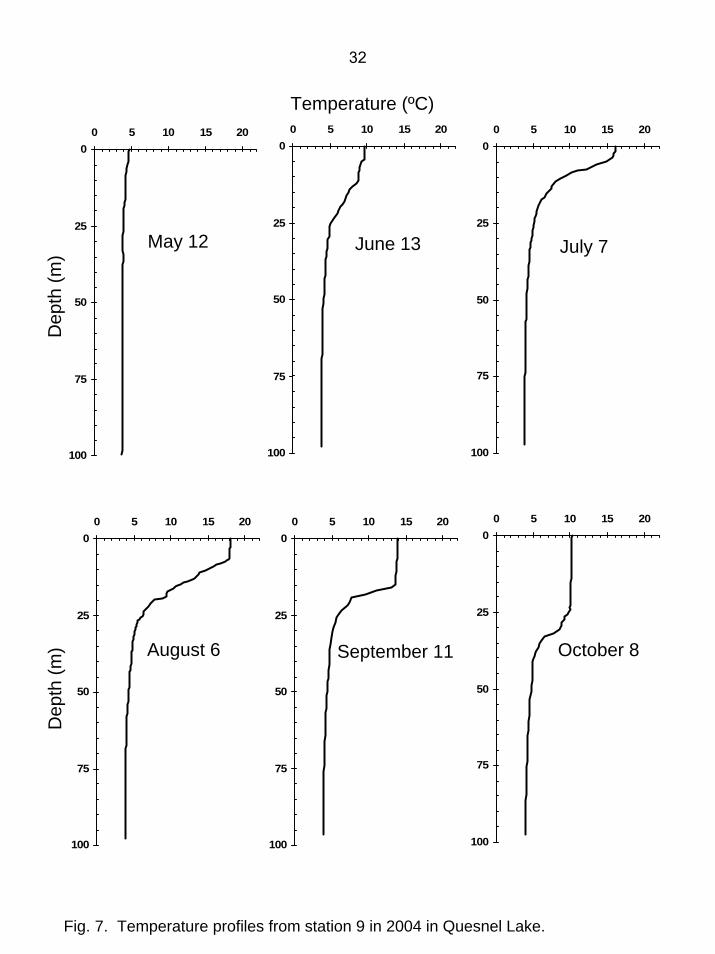
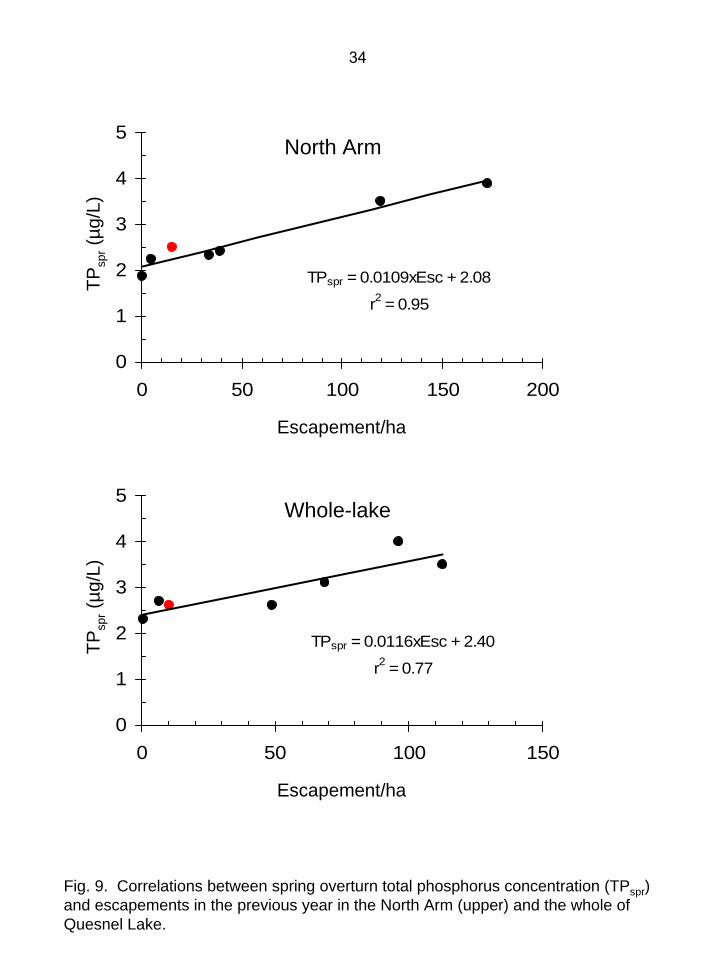
Limnology - Quesnel Lake When the lake was first sampled on May 11-12, surface temperatures were 4.3-4.8ºC and isothermal conditions prevailed. From June to October, the lake was thermally stratified (Fig. 4-7). Epilimnion depths slowly deepened through the growing season and the seasonal average was 8.9 m (Table 1). The maximum surface temperature of 19.5ºC occurred in the Main Arm in early August. Euphotic zone depth and Secchi depth did not exhibit distinct seasonal variability, with the lowest values occurring at station 7 near the Horsefly River during spring freshet. With an average euphotic zone depth of 17.7 m and an average Secchi depth of 9.4 m in 2004, Quesnel Lake had higher water clarity than most other Fraser system lakes (Shortreed et al. 2001). While euphotic zone depths in 2003 tended to be less than those in earlier years, in 2004 they were similar to or greater than those prior to 2003 (Fig. 8). Dissolved oxygen concentrations remained relatively high (range: 7.5-12 mg/L) throughout the water column for the whole growing season and presented no constraints on juvenile sockeye growth and survival (Table 1). Lowest DO values occurred in the epilimnion when temperatures were highest. Quesnel Lake was slightly alkaline in 2004, with pH values ranging from 7.1-8.1. The whole-lake seasonal average pH of 7.6 was lower than in 2003 and within the range observed for earlier years (Table 1, Fig. 8). Quesnel Lake is well-buffered relative to most other Fraser system sockeye lakes, and the seasonal average concentrations of dissolved inorganic carbon (11.8 mg/L), total alkalinity (45.3 mg CaCO3/L), total dissolved solids (mean=63 mg/L), and conductivity (mean=84 µS/cm) are in the upper portion of the range commonly seen in those lakes (Shortreed et al. 2001). Whole-lake seasonal average spring overturn total phosphorus (TPspr) averaged 2.6 µg/L and seasonal average total phosphorus (TP) was 3.0 µg/L (Table 1). This is within the
7

range commonly seen in other oligotrophic B.C. sockeye lakes (Shortreed et al 2001) and places the lake in the lower range of oligotrophy (Carlson 1977). Shortreed et al. (in prep) demonstrated that in Quesnel Lake TPspr was significantly correlated with spawner density in the previous year. In 2004, TPspr concentrations were a good fit to this relationship (Fig. 9). Quesnel Lake has higher nitrogen concentrations than most Fraser system sockeye lakes (Shortreed et al. 2001). In 2004, spring overturn nitrate averaged 139 µg N/L and epilimnetic nitrate concentrations remained relatively high throughout the growing season (Table 1, Fig. 10). It is unclear why spring nitrate concentrations in both 2003 and 2004 were higher than in previous years, because there is insufficient nitrogen in MDN to explain the increase (Fig. 11). Epilimnetic nitrate concentrations became depleted for a portion of the growing season in 2003, but in previous years and in 2004 epilimnetic nitrate did not approach depletion (Fig. 11). Epilimnetic bacteria numbers exhibited relatively little seasonal variability (range: 0.68-1.02 million/mL) and averaged 0.82 million/mL. These numbers are similar to those found in other B.C. sockeye lakes and based on the trophic classification of Bird and Kalff (1984), place the lake in the middle range of oligotrophy. Prior to 2003, seasonal average bacteria numbers in Quesnel Lake were 0.77±0.09 million/mL (2SE, n=5) (Shortreed et al., in prep.). In 2003, the average increased substantially to 1.53 million/mL, placing the lake at the upper end of oligotrophy. In 2004, the average of 0.82 million/mL was substantially lower, and only slightly higher than the average seen in previous years. As with most other variables, the seasonal average epilimnetic chlorophyll concentration of 0.64 µg/L indicated that in 2004 Quesnel Lake was highly oligotrophic (Table 1) (Carlson 1977). Vertical profiles of chlorophyll concentration did not exhibit any distinct trends, although highest summer concentrations tended to occur in the lower epilimnion (Fig. 12). Seasonal variation was minimal, with no distinct spring or fall maxima except in June, at station 7, near the Horsefly River. It is probable that the spring freshet from the Horsefly River brought in additional nutrients which resulted in the June peak at that location. Prior to 2003, the seasonal average epilimnetic chlorophyll concentrations of 1.06 ± 0.06 µg/L (2SE) placed the lake in the middle of the oligotrophic range (Carlson 1977; Shortreed et al., in prep). In 2003, average chlorophyll increased by approximately one-third to 1.62 µg/L. In 2004, average chlorophyll was 0.64 µg/L, substantially lower than in 2003 and also lower than in any of the previous years (Fig. 13). Although phytoplankton biomass (chlorophyll) is a widely used indicator of trophic status, rate measurements such as photosynthetic rates (PR) provide a more sensitive indicator of lake productivity. In our study, PR was estimated directly from in situ uptake of 14C. Vertical PR profiles were variable, but highest values generally occurred in the upper portion of the epilimnion within 5 m of the surface (Fig. 14-17). Seasonal average PR ranged from 101 mg C·m-2·d-1 in the East Arm to 128 mg C·m-2·d-1 in the eastern portion of the Main Arm (Table 1). Prior to 2003, whole-lake seasonal PR averaged 103 ± 12 mg C·m-2·d-1 (2SE). In 2003, the average PR approximately doubled to 211 mg C·m-2·d-1 (Shortreed et al., in prep). In 2004, the seasonal average PR of 115 mg C·m-2·d-1 returned to a level only slightly higher than the years prior to 2003 (Fig. 18). Phytoplankton community structure in Quesnel Lake was similar to that found in many other B.C. sockeye lakes. Picoplankton numbers were lowest in spring and highest in
8

July. The average picoplankton density of 35,000/mL was within the range commonly observed in oligotrophic B.C. lakes (Stockner and Shortreed 1991). The cyanobacteria Synechococcus was the dominant picoplankton and made up over 90% of total picoplankton numbers. Of nanoplankton other than diatoms, the most common genera were the flagellates Chromulina and Chroomonas, both of which are ubiquitous in B.C. lakes and are favourable prey items for herbivorous zooplankton. The diatom genera Cyclotella sp. and Rhizosolenia sp. are ubiquitous and abundant in most oligotrophic B.C. lakes and this was also the case in Quesnel Lake. With one notable exception, phytoplankton community structure exhibited relatively minor annual variability and genera which were common in 2004 were common in all other years. However, in years prior to 2003, the large chain-forming diatom Tabellaria fenestrata was often present but always in low numbers, with an average density of only 0.59±0.24/mL (2E). In 2003, its average density increased over 3 orders of magnitude to an average of 888/mL. In 2004, average T. fenestrata numbers were substantially lower (5.3/mL), but still much higher than in years prior to 2003 (Fig. 18). Because of the large size of individual cells and the long chains it forms, T. fenestrata is a relatively poor food item for herbivorous zooplankton. At all stations sampled, macrozooplankton biomass was lowest in spring and increased to seasonal maxima in September or early October (Fig. 19, 20). Seasonal average biomass ranged from 494 mg dry wt/m² at station 7 to 722 mg dry wt/m² at station 8 (Table 1). Daphnia comprised 50% of total biomass with copepods (predominantly Diacyclops and Leptodiaptomus) making up one-third of the total. The whole-lake seasonal average macrozooplankton biomass of 645 mg dry wt/m² was within the range commonly observed (mean=780±100 mg dry wt/m²) for all years (n=14) for which data are available from 1985-2003. The seasonal average Daphnia biomass of 322 mg dry wt/m² was slightly higher than the long-term average of 250±34 mg dry wt/m². The average biomass of both macrozooplankton and Daphnia in Quesnel Lake is near the middle of the range observed in other Fraser system sockeye lakes (Shortreed et al. 2001).
Juvenile sockeye diet Stomachs from 10-20 age-0 O. nerka from each arm were examined for diet information except for the North Arm of Quesnel Lake where only 2 age-0 O. nerka were captured. In total 57 stomachs from Quesnel Lake and 87 from Shuswap Lake were examined. In both lakes Daphnia was the dominant prey item eaten (Fig. 21). In Quesnel Lake Daphnia comprised more than 99% of the biomass of the stomach contents in the West, Main and North arms of the lake. In the East Arm they were still the dominant prey item (56%) but other zooplankton such as cyclopoids (27%),Bosmina (15%), and the diaptomid, Epischura (8.9%) were also common. The lowered presence of Daphnia in the East Arm diet probably reflects the lower abundance of Daphnia in that arm during the fall (Stn. 9, Fig. 20). In Shuswap Lake, Daphnia also was the dominant prey item comprising 79% in Mara Lake to 86% in Seymour Arm and over 95% in Main and Salmon arms. Epischura was the most common secondary prey item in Mara Lake (13%) and Seymour Arm (6.1%). Mara Lake sockeye also had cyclopoids (<3%) and the occasional insect (other category). In Seymour Arm O. nerka the other category was comprised of insects and Leptodora.
Lake resident O. nerka - Quesnel Lake The hydroacoustic and trawl survey of Quesnel Lake was successfully conducted on October 7-9, 2004. The weather was good and equipment performed well. No problems
9

were encountered that would affect data quality. A thermocline was still present and the fish were well distributed for acoustic sampling (see Fig. 22A for a typical echogram). It was apparent from the observed length frequency distribution of the trawl catch that the majority of fish in the limnetic region of Quesnel Lake were young of the year (age-0) O. nerka (Table 2). Only one out of 251 O. nerka captured was from an older age class (Fig. 23). Scale ageing results confirmed the preliminary age classification as all fish <93 mm that were aged were classified as age-0. As is typical for Quesnel Lake, no other species were caught in the trawl. Since the trawl data provided little information on older age classes, we used hydroacoustic target strength (TS) data to estimate the abundance of older age classes. Theoretical relationships between TS and fish size such as Love's (1977) formula and experience on other lakes provides guidelines for separation points between broad categories of salmonid fish size. Generally TS below -63 dB are too small to be fish while -63 to -45 dB correspond to age-0 sockeye sized targets. TS's between -45 and -35 dB correspond to older age classes of kokanee. The TS information indicates that most fish are in the age-0 O. nerka size range (Fig. 23B). Although acoustical TS corresponds to fish size, it is difficult to distinguish between small differences in fish size and the age-0 group may contain some age-1 sized fish. In Quesnel Lake, the trawl data indicates that older fish were a very small proportion of the total. O. nerka can be either anadromous sockeye or non-anadromous kokanee. Based on scale analysis of returning adults, most sockeye migrate from Quesnel Lake after one winter as age-1 smolts (Pacific Salmon Commission, Vancouver, data on file). Returns from age-2 smolts have occurred infrequently since 1948 and have comprised <1% of brood year returns in those years. We therefore assumed that all age-1 and older O. nerka captured in trawls or identified by acoustical target strength during October were kokanee. Distinguishing age-0 sockeye from age-0 kokanee is more difficult and not yet completed. We have stockpiled age-0 O. nerka samples preserved in ethanol for DNA-based stock identification until such time as appropriate adult data are available. Baseline data for adult sockeye is available at DFO's Molecular Genetics Lab, Pacific Biological Station, but a similar data set for adult kokanee does not yet exist. Collection of adult kokanee samples is planned for the fall of 2005 by WLAP (Rob Dolighan, MWLAP, Williams Lake, personal communications). The juvenile samples are also suitable for otolith Sr determination and we are working with the ICP-MS Facility at the University of Victoria to develop suitable protocols and methodology (K. Telmer, U.Vic., personal communications). Vertical distribution was typical of Quesnel Lake at this time of year. The moderately strong thermal stratification (Fig. 4, 7) resulted in a nighttime distribution of fish targets between 10 and 30 m (Fig. 22A). Abundance and density of age-0 O. nerka was relatively low throughout Quesnel Lake, with an average of 400/ha or a total 10.4 million fry (Table 3). These densities were expected given the relatively small sockeye escapement in 2003. Juveniles were found in all areas of the lake but highest densities were found in the Main Arm (779 /ha) and lowest in the East Arm (196/ ha). TS data indicated that low densities of older kokanee were also found throughout the lake. We estimated a total of 1.1 million (41/ha) larger kokanee-sized fish in the limnetic zone of Quesnel Lake. Although other more direct methods of estimating the age-0 kokanee population are not yet available, we did generate a preliminary estimate using survival relationships
10

between adult and age-0 kokanee . These were developed by provincial kokanee biologists and are based on observed numbers of older kokanee in allopatric kokanee lakes. Sebastian et al. (2003) reported that on average 60% of the total kokanee population in lakes without sockeye are age-0 kokanee. Using this criteria, we derived an estimate of 1.6 million age-0 kokanee or about 15% of the age-0 population in Quesnel Lake (Table 4). Average weight of age-0 fall fry in 2004 was 3.6 g, well within the expected range for the brood year escapement (Table 2, Fig. 24A). As sample sizes were low in many of the trawling sections, it is difficult to show differences in size between arms. However, fry in the East Arm were significantly larger than Main Arm fry (Table 2), perhaps due to lower East Arm densities (Table 3). At 2.0 g, sockeye smolts from the 2002 brood year were the smallest ever recorded from Quesnel Lake (Hume et al. 1996, Table 2). Further, they showed virtually no overwinter or spring growth, since average weight of fry in the previous fall was 1.9 g (Hume et al. 2004). We derived estimates of the total limnetic biomass in the lake by combining the hydroacoustic abundance and the size estimates. We assumed that age-0 kokanee were the same size as sockeye. For older kokanee we used the mean size (75 g) for age-1 to age-3 kokanee found in Quesnel Lake by Sebastian et al. (2003). Overall, there was an estimated 125 t (4.79 kg/ha) of limnetic fish biomass in Quesnel Lake (Table 5). Age-0 sockeye comprised 31.5 t or 25% of the total while all age classes of kokanee and other fish comprised 93.4 t or 75% of the total. The size information used for kokanee in these calculations needs to be improved with further sampling but is probably an adequate approximation of the non-sockeye biomass in the lake.
Lake resident O. nerka - Shuswap Lake The hydroacoustic and trawl survey of Shuswap Lake was successfully conducted on October 15-18, 2004. The weather was good and equipment performed well. No problems were encountered that would affect data quality. A thermocline was still present and the fish were well distributed for acoustic sampling (see Fig. 22B for a typical echogram). The majority of fish caught in the limnetic region of Shuswap Lake by the trawl were young of the year (age-0) O. nerka (Table 6). The length frequency distribution of captured fish indicated that there were considerably more age-1 O. nerka than in Quesnel Lake (Fig. 25A). Scale-ageing confirmed the length frequency distribution, indicating that fish <80 mm were age-0 O. nerka while those between 82 and 140 mm were age-1 O. nerka. Only one other age-0 sized fish, a Pygmy whitefish (Prosopium coulteri), was caught in the trawl. An adult lake trout (Salvelinus namaycush) and a burbot (Lota lota) were also caught, a not unusual occurrence in Shuswap Lake. In Shuswap Lake, we used trawl and TS data to estimate the abundance of older age classes. Theoretical relationships between TS and fish size such as Love's (1977) formula and experience on other lakes provides guidelines for separation points between broad categories of salmonid fish size. Generally TS below -63 dB are too small to be fish while -63 to -45 dB correspond to age-0 sockeye sized targets. TS's between -45 and -35 dB correspond to older age classes of kokanee. The TS information indicates that most fish are in the age-0 O. nerka size range (Fig. 25B). Although acoustical TS
11

corresponds to fish size, it is difficult to distinguish between small differences in fish size and the age-0 group may contain some age-1 sized fish. O. nerka can be either anadromous sockeye or non-anadromous kokanee. Based on scale analysis of returning adults, most sockeye migrate from Shuswap Lake after one winter as age-1 smolts (Pacific Salmon Commission, Vancouver, data on file). Returns from age-2 smolts to the Adams River have occurred infrequently in recent years and have comprised < 1% of brood year returns since 1970. We therefore assumed that all age-1 and older O. nerka captured in trawls or identified by acoustical target strength during October were kokanee. Distinguishing age-0 sockeye from age-0 kokanee is more difficult. Baseline data for adult sockeye is available at DFO's Molecular Genetics Lab, Pacific Biological Station, but a similar data set for adult kokanee does not yet exist. Although we have stockpiled age-0 O. nerka samples preserved in ethanol for DNA-based stock identification there are no current plans to collect adult kokanee samples. The juvenile samples are also suitable for otolith Sr determination and we are working with the ICP-MS Facility at the University of Victoria to develop suitable protocols and methodology (K. Telmer, U.Vic., personal communications). Vertical distribution was typical of Shuswap Lake at this time of year. The nighttime distribution of fish targets was between 15 and 35 m (Fig. 22B). Abundance and density of age-0 O. nerka was variable throughout Shuswap Lake, ranging from 1,200/ha in the Main Arm to 700/ha in Mara Lake and 260/ha or less in Seymour, Anstey, and Salmon arms. There was an average of 620 age-0 fry/ha or a total 18.5 million fry in the whole lake (Table 7). TS data indicated that low densities of older kokanee occurred throughout the lake. We estimated a total of 1.0 million (35/ha) larger kokanee-sized fish in the limnetic zone of Shuswap Lake. Although other more direct methods of estimating the age-0 kokanee population are not yet available, we did generate a preliminary estimate using survival relationships between adult and age-0 kokanee. These were developed by provincial kokanee biologists and are based on observed numbers of older kokanee in allopatric kokanee lakes. Sebastian et al. (2003) reported that on average 60% of the total kokanee population in lakes without sockeye are age-0 kokanee. Using this criteria we derived an estimate of 1.6 million age-0 kokanee or about 9% of the age-0 population in Shuswap Lake (Table 8). Overall age-0 fry size averaged 2.3 g, well within the expected range for the brood year escapement (Table 6, Fig. 24B) and slightly larger than the 2.0 g found the previous year. Fry were smallest in Mara Lake (1.8 g) and Salmon Arm (2.1 g), and largest in Seymour and Anstey arms (3.2 g). Unlike Quesnel Lake smolts from the Shuswap Lake showed considerable over winter and spring growth, averaging 3.7 g (Table 6). This was nearly 85% larger than the 2.0 g in the fall of 2003. We derived estimates of the total limnetic biomass in the lake by combining the hydroacoustic abundance and the size estimates. We assumed that age-0 kokanee were the same size as sockeye. For older kokanee we used the long term mean size (65 g) for age-1 to age-3 kokanee captured in Shuswap Lake from 1977 to 2004. Overall, there was an estimated 116.4 t (3.9 kg/ha) of limnetic fish biomass in Shuswap
12

Lake (Table 9). Age-0 sockeye comprised 44.2 t or 38% of the total while all age classes of kokanee and other fish comprised 72.2 t or 62% of the total.
Conclusions
This study was designed to examine the long term effects of one to two years of record high escapements to Shuswap and Quesnel lakes on lake and juvenile sockeye production. Hume et al. (2004) showed that fry production from the high brood years did not increase with escapement, but rather reached a plateau around 29 EFS/ha in Shuswap Lake and 28 EFS/ha in Quesnel Lake (Fig. 26, 27). Further, smolts from the 2002 brood year were among the smallest ever recorded from Quesnel Lake. After much smaller 2003 escapements, fall fry abundance and size were within the range previously observed for brood years of similar size. The high escapements and influx of marine-derived nutrients to Quesnel Lake in 2001 and 2002 resulted in substantial changes to water chemistry, plankton productivity, and plankton community structure in 2003 (Shortreed et al., in prep.). However, by 2004 the lake had returned to earlier production levels, with only slight indications of altered dynamics (e.g. PR slightly elevated, phytoplankton community structure slightly different, increase in relative abundance of Daphnia). The small size of Quesnel Lake smolts from the 2002 brood year will likely result in reduced marine survival (Hyatt and Stockner 1985, Henderson and Cass 1991, Koenings et al. 1993), which should be taken into account when predicting adult returns.
Acknowledgements
We thank Kelly Malange, Steve MacLellan, and Steve McDonald for invaluable assistance in data collection and analysis. Chemical analyses were carried out by Kathy Roxborough and Kerry Parish. Zooplankton was analyzed by Mary Jane Hudson and the scales were analyzed at the scale lab at PBS under the direction of Shayne MacLellan.
13

Literature Cited
American Public Health Association, American Water Works Association and Water
Pollution Control Federation. 1998. Standard methods for the examination of water and wastewater. 20th edition. Washington, D.C.
Balcer, M.D., N.L. Korda, and S.I. Dodson. 1984. Zooplankton of the Great Lakes. The
Univ. of Wisconsin. In press. Madison, Wisconsin. 174 p. Bird, D.F., and J. Kalff. 1984. Empirical relationships between bacterial abundance and
chlorophyll concentration in fresh and marine waters. Can. J. Fish. Aquat. Sci. 41: 1015-1023.
Bird, D.F., and Y.T. Prairie. 1985. Practical guidelines for the use of zooplankton
length-weight regression equations. J. Plankton Res. 7: 955-960. Burczynski, J. J., and R. L. Johnson. 1986. Application of dual-beam acoustic survey
techniques to limnetic populations of juvenile sockeye salmon (Oncorhynchus nerka). Can. J. Fish. Aquat. Sci. 43: 1776-1788.
Carlson, R.E. 1977. A trophic state index for lakes. Limnol. Oceanogr. 22: 361-369. Clutter, R. I., and L.E. Whitesel. 1956. Collection and interpretation of sockeye salmon
scales. International Pacific Salmon Fisheries Commission. Bulletin IX. 159 p. Culver, D.A., M.M. Boucherie, D.J. Bean, and J.W. Fletcher. 1985. Biomass of
freshwater crustacean zooplankton from length-weight regressions. Can. J. Fish. Aquat. Sci. 42: 1380-1390.
Enzenhofer, H. J., and J. M. B. Hume. 1989. Simple closing midwater trawl for small
boats. N. Am. J. Fish Manage. 9: 372-377. Farley, A.L. 1979. Atlas of British Columbia. Univ. of British Columbia Press,
Vancouver, B.C.: 136 p. Haney, J.F., and D.J. Hall. 1973. Sugar-coated Daphnia: A preservative technique for
Cladocera. Limnol. Oceanogr. 18: 331-333. Hellawell, J.M., and R. Abel. 1971. A rapid volumetric method for the analysis of the
food of fishes. J. Fish. Biol. 3: 29-37. Henderson, M.A., and A.J. Cass. 1991. Effect of smolt size on smolt to adult survival
for Chilko Lake sockeye salmon (Oncorhynchus nerka). Can. J. Fish. Aquat. Sci. 48: 988-994.
Hume, J.M.B., K.S. Shortreed, and S. MacLellan. MS 2004. Preliminary report on sockeye fry in Quesnel and Shuswap lakes in 2003. MS 5 p.
Hyatt, K.D., and J.G. Stockner. 1985. Response of sockeye salmon (Oncorhynchus
nerka) to fertilization of British Columbia coastal lakes. Can. J. Fish. Aquat. Sci. 44: 320-331.
14

Koenings, J.P., J.A. Edmundson, G.B. Kyle, and J.M. Edmundson. 1987. Limnology field and laboratory manual: methods for assessing aquatic production. Alaska Dep. Fish Game, FRED Div. Rep. Ser., Juneau. 71: 212 p.
Koenings, J.P., H.J. Geiger, and J.J. Hasbrouck. 1993. Smolt-to-adult survival patterns
of sockeye salmon (Oncorhynchus nerka): effects of smolt length and geographic latitude when entering the sea. Can. J. Fish Aquat. Sci. 50: 600-611.
Levy, D.A. 1990. Reciprocal diel vertical migration behavior in planktivores and
zooplankton in British Columbia lakes. Can. J. Fish. Aquat. Sci. 47:1755-1764. Love, R.H. 1977. Target strength of an individual fish at any aspect. J. Acoustical Soc.
Am., 62: 1397-1403. MacIsaac, E.A., and J.G. Stockner. 1985. Current trophic state and potential impact of
coal mine development on productivity of Middle Quinsam and Long lakes. Can. Tech. Rep. Fish. Aquat. Sci. 1381: 63 p.
McDonald, J., and J. M. B. Hume. 1984. Babine Lake sockeye salmon (Oncorhynchus
nerka) enhancement program: testing some major assumptions. Can. J. Fish. Aquat. Sci. 41: 70-92.
MacLellan, S.G., K.F. Morton, and K.S. Shortreed. 1993. Zooplankton community
structure, abundance, and biomass in Quesnel Lake British Columbia: 1985-1990. Can. Data Rep. Fish. Aquat. Sci. 918: 151 p.
Pennak, R.W. 1978. Freshwater Invertebrates of the United States, 2nd Ed. John Wiley
& sons. New York. 803 p. Rieman, B.E., D. L. Myers and R. L. Nielsen. 1994. Use of otolith microchemistry to
discriminate Oncorhynchus nerka of resident and anadromous origin. Can. J. Fish. Aquat. Sci. 51: 68-77.
Robarts, R.D., and L.M. Sephton. 1981. The enumeration of aquatic bacteria using
DAPI. J. Limnol. Soc. Afr. 7: 72-74. Sebastian, D., R. Dolighan, H. Andrusak, J. Hume, P. Woodruff, and G. Scholten. 2003.
Summary of Quesnel Lake kokanee and rainbow trout biology with reference to sockeye salmon. Ministry of Water, Land, and Air Protection, Province of British Columbia. Stock Management Report No. 17. 109p.
Shortreed, K.S., and J.M.B. Hume. In prep. Effects of increased sockeye escapements
on productivity of a large British Columbia lake. Shortreed, K.S., K.F. Morton, K. Malange, and J.M.B. Hume. 2001. Factors limiting
sockeye production and enhancement potential for selected B.C. nursery lakes. Can. Sci. Adv. Secretariat Res. Doc. 2001/098: 69 p.
Stemberger, R.S., and J.J. Gilbert. 1987. Rotifer threshold food concentrations and the
size-efficiency hypothesis. Ecology 68: 181-187.
15
Stainton, M.P., M.J. Chapel, and F.A.J. Armstrong. 1977. The Chemical Analysis of
Fresh Water. 2nd edition. Can. Fish. and Mar. Ser. Misc. Spec. Publ. 25: 180 p. Stephens, K., and R. Brandstaetter. 1983. A laboratory manual: collected methods for
the analysis of water. Can. Tech. Rep. Fish. Aquat. Sci. 1159: 68 p. Stockner, J.G., and K.S. Shortreed. 1991. Phototrophic picoplankton: community
composition, abundance and distribution across a gradient of oligotrophic British Columbia and Yukon Territory lakes. In: J.G. Stockner (ed.), Autotrophic picoplankton in freshwater ecosystems. Int. Rev. Gesamten Hydrobiol. 76: 581-601.
Strickland, J.D.H., and T.R. Parsons. 1972. A practical handbook of seawater analysis. Bull. Fish. Res. Board Can. 67: 311 p.
Wood, C.C., and C. J. Foote. 1990. Genetic differences in the early development and
growth of sympatric sockeye salmon and kokanee (Oncorhynchus nerka) and their hybrids. Can. J. Fish. Aquat. Sci. 47:2250-2260.
Yan, N.D., and G.L. Mackie. 1987. Improved estimation of the dry weight of
Holopedium gibberum (Crustacea, Cladocera) using clutch size, a body fat index, and lake water total phosphorus concentration. Can. J. Fish. Aquat. Sci. 44: 382-389.
16

3.0 7.0 8.0 9.0Surface temperature (ºC) 14.1 14.7 14.7 13.1 14.0Thermocline depth (m) 7.0 9.9 8.6 9.8 8.9Secchi depth (m) 10.8 8.1 11.9 8.0 9.4Euphotic zone depth (m) 19.4 15.4 18.6 17.5 17.7
pH 7.6 7.5 7.6 7.6 7.6Conductivity (µS/cm at 25ºC) 84 82 84 85 84Total alkalinity (mg CaCO3/L) 45.4 43.6 45.5 45.9 45.3Total dissolved solids (mg/L) 62 63 66 62 63Dissolved inorganic carbon (mg/L) 11.90 11.49 11.85 11.91 11.81Dissolved oxygen (mg/L) 9.0 9.0 9.0 9.4 9.2
Soluble reactive silica (mg Si/L) . . . . .Total phosphorus (µg/L) 2.7 4.6 3.0 2.4 3.0Total dissolved phosphorus (µg/L) 1.9 2.3 1.9 1.8 1.9Spring overturn total phosphorus (µg/L) 2.7 3.4 2.7 2.2 2.6Nitrate (µg N/L) 82 66 81 96 84Spring overturn nitrate (µg N/L) 137 129 143 144 139Ammonia (µg N/L) 3.6 3.7 3.3 2.5 3.2
Bacteria (No.x106/mL) . . 0.82 . 0.82Daily PR (mg C·m-2·d-1) 122 122 128 101 115Chlorophyll (µg/L) 0.59 0.79 0.51 0.65 0.64Picoplankton (thousands/mL) . . 35.0 . 35.0Nanoplankton (thousands/mL) . . 0.92 . 0.92Microplankton (thousands/mL) . . 0.43 . 0.43
Macrozooplankton biomass (mg dry wt/m2) 603 494 722 707 645Daphnia biomass (mg dry wt/m2) 381 248 423 271 322Daphnia (% of total biomass) 63 50 59 38 50Eubosmina biomass (mg dry wt/m2) 65 49 70 140 92Diacyclops biomass (mg dry wt/m2) 72 78 101 130 101Leptodiaptomus biomass (mg dry wt/m2) 68 95 114 146 112Epischura biomass (mg dry wt/m2) 13 16 12 16 14
Table 1. Seasonal averages (n=6) of limnological data collected from the 2004 investigation of Quesnel Lake. Chemical and biological data are epilimnetic means except where otherwise noted.
VariableStation Whole-lake
average
17
Lake Taxa Arm N Mean
+-95% C.I. Min Max N Mean
+-95% C.I. Min Max
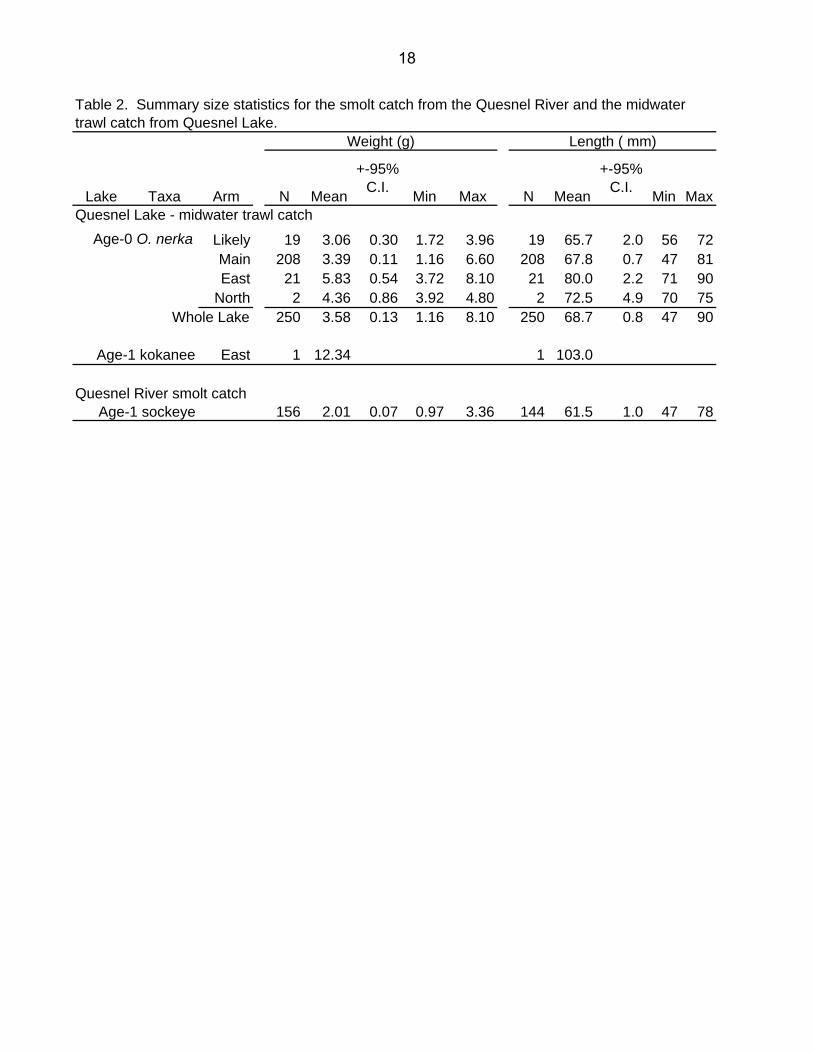
Quesnel Lake - midwater trawl catchAge-0 O. nerka Likely 19 3.06 0.30 1.72 3.96 19 65.7 2.0 56 72
Main 208 3.39 0.11 1.16 6.60 208 67.8 0.7 47 81East 21 5.83 0.54 3.72 8.10 21 80.0 2.2 71 90
North 2 4.36 0.86 3.92 4.80 2 72.5 4.9 70 75Whole Lake 250 3.58 0.13 1.16 8.10 250 68.7 0.8 47 90
Age-1 kokanee East 1 12.34 1 103.0
Quesnel River smolt catchAge-1 sockeye 156 2.01 0.07 0.97 3.36 144 61.5 1.0 47 78
Table 2. Summary size statistics for the smolt catch from the Quesnel River and the midwater trawl catch from Quesnel Lake.
Weight (g) Length ( mm)
18

Trawl SectionSurface
Area (ha) N (N/ha)95% C. I.
(N/ha) N95% C. I.
(N)95% C. I.(% of N)
Age-0 O. Nerka1. Likely Arm 2,943 3 324 1,039 953,178 3,056,722 321%2. Main Arm 6,634 3 779 1,149 5,169,366 7,623,643 147%3. S. North Arm 3,823 2 242 344 926,743 1,315,832 142%4. N. North Arm 2,293 2 338 2,361 774,896 5,413,436 699%5. W. East Arm 5,727 3 285 143 1,634,867 817,201 50%6. E. East Arm 4,670 3 196 150 913,215 702,696 77%Lake total 26,090 6 398 151 10,372,264 3,949,244 38%
Large fish1. Likely Arm 2,943 3 24 82 70,704 242,777 343%2. Main Arm 6,634 3 51 97 336,792 641,757 191%3. S. North Arm 3,823 2 16 95 60,872 363,654 597%4. N. North Arm 2,293 2 68 26 155,720 59,609 38%5. W. East Arm 5,727 3 39 42 222,891 238,688 107%6. E. East Arm 4,670 3 45 22 210,393 101,418 48%Lake total 26,090 6 41 13 1,057,372 345,860 33%
Table 3. Hydroacoustic population estimates for each section of Quesnel Lake from the October 7-9, 2004 survey. Age-0 O. nerka are mostly anadromous sockeye but a proportion will be non-anadromous kokanee. Most of the larger fish will be older age classes of kokanee.
Density Population
19

Trawl SectionSurface
Area (ha)Kokanee
(N/ha)Sockeye(N/ha)
Kokanee(N/ha)
Sockeye(N/ha)
ProportionSockeye
(%N)
1. Likely Arm 2,943 36 288 106,057 847,121 89%2. Main Arm 6,634 76 703 505,188 4,664,178 90%3. S. North Arm 3,823 24 219 91,308 835,436 90%4. N. North Arm 2,293 102 236 233,580 541,316 70%5. W. East Arm 5,727 58 227 334,336 1,300,531 80%6. E. East Arm 4,670 68 128 315,590 597,624 65%Lake total 26,090 61 337 1,586,059 8,786,206 85%
Table 4. Estimated age-0 kokanee and sockeye populations for each section of Quesnel Lake from the October 7-9, 2004 survey. The age-0 kokanee estimate is based on observations in allopatric kokanee lakes where age-0 fry are observed to be about 60% of the total kokanee population (Sebastian et al. 2003).
Density Population
20

Trawl SectionMean
Weight (g)Density (kg/ha) (tonnes)
Age-0 sockeye1. Likely Arm 3.1 0.88 2.62. Main Arm 3.4 2.39 15.83. S. North Arm 3.4 0.74 2.84. N. North Arm 3.4 0.80 1.85. W. East Arm 5.8 1.32 7.66. E. East Arm 5.8 0.75 3.5Quesnel Lake 3.6 1.21 31.5
Age-0 kokanee1. Likely Arm 3.1 0.11 0.32. Main Arm 3.4 0.26 1.73. S. North Arm 3.4 0.08 0.34. N. North Arm 3.4 0.35 0.85. W. East Arm 5.8 0.34 2.06. E. East Arm 5.8 0.39 1.8Quesnel Lake 3.6 0.22 5.7
Large fish1. Likely Arm 83 1.99 5.92. Main Arm 83 4.21 28.03. S. North Arm 83 1.32 5.11. Likely Arm 83 5.64 12.95. W. East Arm 83 3.23 18.56. E. East Arm 83 3.74 17.5Quesnel Lake 83 3.36 87.8
Total non-sockeye biomass 3.58 93.44 Total biomass 4.79 124.90
Table 5. Estimated biomass for each section of Quesnel Lake from the October 7-9, 2004 survey. Age-0 size data is from the 2004 trawl catch but mean size for the Main Arm was use for the North Arm as the sample size for the north arm was small. Size of older fish is calculated from size at age and age-class proportions in Sebastian et al. (2003).
Biomass
21

Lake Taxa Arm N Mean
+-95% C.I. Min Max N Mean
+-95% C.I. Min Max
Shuswap Lake - midwater trawl catchAge-0 O. nerka Main 277 2.7 0.098 0.58 5.18 277 65.5 0.7 42 78
Salmon 173 2.1 0.131 0.48 4.62 173 59.2 1.0 36 77Seymour 38 3.2 0.249 1.92 5.18 38 65.8 1.5 57 75Anstey 7 3.2 0.868 1.40 4.66 7 64.3 6.4 50 74Mara 168 1.8 0.131 0.40 3.88 168 56.1 1.3 41 75
Whole Lake 663 2.3 0.073 0.40 5.18 663 61.4 0.6 36 78
Age-1 kokanee Main 3 9.1 2.163 7.34 11.14 3 95 6.8 89 101Salmon 8 14.5 4.834 6.16 27.52 8 108 11.2 83 135
Seymour 2 17.2 17.91 8.10 26.38 2 115 40.2 94 135Anstey 2 12.9 0.921 12.40 13.34 2 106 2.9 104 107Mara 2 14.9 10.56 9.50 20.28 2 109 24.5 96 121
Whole Lake 17 13.7 3.079 6.16 27.52 17 106 7.2 83 135
Age-2+ kokanee Salmon 1 220 220 220Seymour 1 220 220 220
Whole Lake 2 220 0.0 220 220
Lake trout Anstey 1 700 Burbot Main 1 400
Pygmy whitefish Main 1 0.86 0.86 0.86 1 43.0 43 43
South Thompson River smolt catchAge-1 sockeye 26 3.68 0.27 2.32 5.13 26 70.6 1.7 59 79
Table 6. Summary size statistics for the smolt catch in the South Thompson River in spring 2004 and the midwater trawl catch from Shuswap Lake in October 2004.
Weight (g) Length ( mm)
22

Trawl SectionSurface Area
(ha) N (N/ha) 95% C. I.
(N/ha) N 95% C. I. (N)95% C. I. (% of N)
Age_0 O. Nerka2. West Main Arm 2,487 3 2,177 1,155 5,414,776 2,871,896 53%3. Mid Main Arm 4,217 3 1,251 1,310 5,274,339 5,524,529 105%4. East Main Arm 3,879 4 531 324 2,059,479 1,257,726 61%
Total Main Arm 10,583 3 1,205 284 12,748,594 3,000,209 24%
5. West Seymour Arm 1,703 2 260 680 443,548 1,157,586 261%6. East Seymour Arm 2,791 3 258 240 721,328 670,518 93%
Total Seymour Arm 4,494 2 259 80 1,164,876 361,029 31%
7. Anstey Arm 2,437 2 138 269 335,394 656,167 196%
8. East Salmon Arm 3,034 2 220 78 668,570 236,285 35%9. Mid Salmon Arm 3,884 2 144 159 559,203 617,573 110%10. West Salmon Arm 2,589 2 445 585 1,150,931 1,514,503 132%
Total Salmon Arm 9,507 3 250 27 2,378,704 260,119 11%
11. Tappen Bay 1,142 1 578 660,437 0%
12. East Mara 910 2 896 2,591 815,263 2,358,285 289%13. West Mara 751 2 470 1,935 353,326 1,453,165 411%
Total Mara Lake 1,661 2 703 262 1,168,589 436,018 37%Total Shuswap system 29,823 13 619 103 18,456,594 3,065,948 17%
Other small fish (based on trawl catch)4. East Main Arm 3,879 4 23.9 14.6 92,537 56,512 61%
Total Main Arm 10,583 3 8.7 3.4 92,537 35,515 38%
Large fish2. West Main Arm 2,487 3 62.7 61.1 155,988 152,072 97%3. Mid Main Arm 4,217 3 38.1 27.0 160,816 113,813 71%4. East Main Arm 3,879 4 32.4 31.3 125,771 121,350 96%
Total Main Arm 10,583 3 41.8 11.0 442,575 116,668 26%
5. West Seymour Arm 1,703 2 62.3 29.7 106,155 50,551 48%6. East Seymour Arm 2,791 3 32.9 45.4 91,742 126,553 138%
Total Seymour Arm 4,494 2 44.0 13.2 197,897 59,361 30%
7. Anstey Arm 2,437 2 24.1 94.4 58,784 230,007 391%
8. East Salmon Arm 3,034 2 25.3 22.7 76,639 68,779 90%9. Mid Salmon Arm 3,884 2 24.1 33.5 93,512 130,232 139%10. West Salmon Arm 2,589 2 31.5 15.2 81,679 39,354 48%
Total Salmon Arm 9,507 3 26.5 2.5 251,830 23,996 10%
11. Tappen Bay 1,142 1 45.1 51,448 0%
12. East Mara 910 2 42.4 21.2 38,635 19,329 50%13. West Mara 751 2 9.2 39.3 6,929 29,531 426%
Total Mara Lake 1,661 2 27.4 3.3 45,564 5,555 12%Total Shuswap system 29,823 13 35.1 4.6 1,048,098 138,031 13%
Table 7. Hydroacoustic population estimates for each section of Shuswap Lake from the October 15-18, 2004 survey. Age-0 O. nerka are mostly anadromous sockeye but a proportion will be non-anadromous kokanee. Most of the larger fish will be older age classes of kokanee.
Density Population
23

Lake AreaSurface Area
(ha) Kokanee
(N/ha) Sockeye
(N/ha) Kokanee
(N/ha)Sockeye(N/ha)
ProportionSockeye
(%N)
Main Arm 10,583 63 1,142 663,862 12,084,733 95%Seymour Arm 4,494 66 193 296,846 868,031 75%Anstey Arm 2,437 36 101 88,176 247,218 74%Salmon Arm 9,507 40 210 377,746 2,000,958 84%Tappen Bay 1,142 68 511 77,173 583,264 88%Mara Lake 1,661 41 662 68,346 1,100,244 94%Shuswap system 29,823 53 566 1,572,147 16,884,447 91%
Table 8. Estimated age-0 kokanee and sockeye populations for each section of Shuswap Lake from the October 15-18, 2004 survey. The age-0 kokanee estimate is based on observations in allopatric kokanee lakes where age-0 fry are observed to be about 60% of the total kokanee population (Sebastian et al. 2003).
Density Population
24

Trawl SectionDensity (kg/ha) (tonnes)
Age_0 sockeyeMain Arm 3.1 3.56 37.7 Seymour Arm 3.2 0.61 2.8 Anstey Arm 3.2 0.32 0.8 Salmon Arm 2.4 0.50 4.8 Tappen Bay 2.4 1.22 1.4 Mara Lake 2.1 1.42 2.4
Shuswap system 2.6 1.48 44.2
Age_0 kokaneeMain Arm 3.1 0.20 2.1 Seymour Arm 3.2 0.21 0.9 Anstey Arm 3.2 0.11 0.3 Salmon Arm 2.4 0.10 0.9 Tappen Bay 2.4 0.16 0.2 Mara Lake 2.1 0.09 0.1
Shuswap system 2.6 0.14 4.1
Large fishMain Arm 65.0 2.72 28.8 Seymour Arm 65.0 2.86 12.9 Anstey Arm 65.0 1.57 3.8 Salmon Arm 65.0 1.72 16.4 Tappen Bay 65.0 2.93 3.3 Mara Lake 65.0 1.78 3.0
Shuswap system 65.0 2.28 68.1
Total non-sockeye biomass 2.42 72.24 Total biomass 3.90 116.41
Table 9. Estimated biomass for each section of Shuswap Lake. Age-0 size data is from the 2004 trawl catch (Table 6). Size of older fish is the long term mean (1977 to 2004) of age-1 to 3 O. nerka collected in the fall.
Biomass Mean Weight
(g)
25

A. Quesnel sockeye - all lines
0
500
1,000
1,500
2,000
2,500
3,000
3,500
4,000
1969 1973 1977 1981 1985 1989 1993 1997 2001
Brood year
Esca
pem
ent (
thou
sand
s)
Males & Jacks
EFS
B. Quesnel Sockeye - first non-dominant line
0.0
0.1
0.2
0.3
1939
1943
1947
1951
1955
1959
1963
1967
1971
1975
1979
1983
1987
1991
1995
1999
2003
Brood year
Abu
ndan
ce(m
illio
ns)
Males & Jacks
EFS
Fig. 1. Sockeye escapement to Quesnel Lake showing; A) all brood years and, B) the 2003 cycle line only.
26

A. Shuswap sockeye - all lines
0
1,000
2,000
3,000
4,000
5,000
6,000
1966 1970 1974 1978 1982 1986 1990 1994 1998 2002
Brood year
Esca
pem
ent (
thou
sand
s)
Males & Jacks
EFS
B. Shuswap sockeye - subdominant line
0.0
0.5
1.0
1.5
1939
1943
1947
1951
1955
1959
1963
1967
1971
1975
1979
1983
1987
1991
1995
1999
2003
Brood year
Abu
ndan
ce(m
illio
ns)
Males & Jacks
EFS
Fig. 2. Sockeye escapement to Shuswap Lake showing; A) all brood years and, B) the 2003 cycle line only.
27

N
10 km
Limnology StationHydroacoustic Transect
Trawl section boundary
Horsefly River
Quesnel River
Mitchell River
1.0
3.04.0
2.0 5.0
16.0
10.0
15.014.0
6.013.0
12.011.0
8.0
7.0
9.0
Section 1
Section 4
Section 2
Section 3Section 6
Section 5
3
7
8
9
N
10 km
Limnology StationHydroacoustic Transect
Trawl section boundary
N
10 km
Limnology StationHydroacoustic Transect
Trawl section boundary
Horsefly River
Quesnel River
Mitchell River
1.0
3.04.0
2.0 5.0
16.0
10.0
15.014.0
6.013.0
12.011.0
8.0
7.0
9.0
Section 1
Section 4
Section 2
Section 3Section 6
Section 5
3
7
8
9
20
kilometres
0 5 10
N
6
7
10
33
Acoustic Transects
Trawl Areas17
18
19
MARALAKE
3
4
5
89
11 12
13
SHUSWAPLAKE
910
11 12 1314
22
23
15
21
16
24
252627
28
33
3231
3029
2
6
78
5
MARALAKE
3
4
5
89
11 12
13
SHUSWAPLAKE
910
11 12 1314
22
23
15
21
16
24
252627
28
33
3231
3029
2
6
78
5
Fig. 3. Map of Quesnel and Shuswap lakes showing sampling locations.
28

0
25
50
75
100
0 5 10 15 20
0
25
50
75
100
0 5 10 15 20
0
25
50
75
100
0 5 10 15 20
0
25
50
75
100
0 5 10 15 20
0
25
50
75
100
0 5 10 15 20
0
25
50
75
100
0 5 10 15 20
Temperature (ºC)
Dep
th (m
)D
epth
(m)
May 12
September 11 October 8August 6
July 7June 13
Fig. 4. Temperature profiles from station 3 in 2004 in Quesnel Lake.
29

0
25
50
75
100
0 5 10 15 20
0
25
50
75
100
0 5 10 15 20
0
25
50
75
100
0 5 10 15 20
0
25
50
75
100
0 5 10 15 20
0
25
50
75
100
0 5 10 15 20
0
25
50
75
100
0 5 10 15 20
Temperature (ºC)
Dep
th (m
)D
epth
(m)
May 11
September 10 October 7August 5
July 6June 12
Fig. 5. Temperature profiles from station 7 in 2004 in Quesnel Lake.
30

0
25
50
75
100
0 5 10 15 20
0
25
50
75
100
0 5 10 15 20
0
25
50
75
100
0 5 10 15 20
0
25
50
75
100
0 5 10 15 20
0
25
50
75
100
0 5 10 15 20
0
25
50
75
100
0 5 10 15 20
Temperature (ºC)
Dep
th (m
)D
epth
(m)
May 11
September 10 October 7August 5
July 6June 12
Fig. 6. Temperature profiles from station 8 in 2004 in Quesnel Lake.
31
0
25
50
75
100
0 5 10 15 20
0
25
50
75
100
0 5 10 15 20
0
25
50
75
100
0 5 10 15 20
0
25
50
75
100
0 5 10 15 20
0
25
50
75
100
0 5 10 15 20
0
25
50
75
100
0 5 10 15 20
Temperature (ºC)
Dep
th (m
)D
epth
(m)
May 12
September 11 October 8August 6
July 7June 13
Fig. 7. Temperature profiles from station 9 in 2004 in Quesnel Lake.
32

12
14
16
18
20
East Main North
1985-1994 2003 2004
Euph
otic
zon
e de
pth
(m)
n=3
n=5
n=3
7.0
7.2
7.4
7.6
7.8
8.0
8.2
East Main North
1985-1994 2003 2004
pH
n=3n=5 n=3
Fig. 8. Seasonal average euphotic zone depths and pH in years prior to the recordescapements, in 2003, and in 2004 in Quesnel Lake.
33
TPspr = 0.0109xEsc + 2.08
r2 = 0.95
0
1
2
3
4
5
0 50 100 150 200
North Arm
Escapement/ha
TPsp
r(µ
g/L)
TPspr = 0.0116xEsc + 2.40
r2 = 0.77
0
1
2
3
4
5
0 50 100 150
Whole-lake
Escapement/ha
TPsp
r(µ
g/L)
Fig. 9. Correlations between spring overturn total phosphorus concentration (TPspr)and escapements in the previous year in the North Arm (upper) and the whole of Quesnel Lake.
34

0
10
20
30
40
50
0 50 100 150
0
10
20
30
40
50
0 50 100 150
0
10
20
30
40
50
0 50 100 150
0
10
20
30
40
50
0 50 100 150
0
10
20
30
40
50
0 50 100 150
0
10
20
30
40
50
0 50 100 150
Nitrate (µg N/L)
Dep
th (m
)D
epth
(m)
May 11
September 10 October 7August 5
July 6June 12
Fig. 10. Vertical profiles of nitrate concentration from station 8 in 2004 in Quesnel Lake.
35

0
20
40
60
80
East Main North
1985-1994 2003 2004
Min
. sum
mer
NO
3(µ
g N
/L)
60
80
100
120
140
160
East Main North
1985-1994 2003 2004
Spr
ing
over
turn
NO
3(µ
g N
/L)
n=4n=4
n=4
n=4
n=4n=4
n=4
Fig. 11. Variation in the concentration of spring overturn and minimum epilimnetic nitrate in years prior to the record escapements, in 2003, and in 2004 in Quesnel Lake..
36

0
10
20
30
40
50
0.0 0.5 1.0 1.5 2.0
0
5
10
15
20
25
30
0.0 0.5 1.0 1.5 2.0
0
10
20
30
40
50
0.0 0.5 1.0 1.5 2.0
0
5
10
15
20
25
30
0.0 0.5 1.0 1.5 2.0
0
10
20
30
40
50
0.0 0.5 1.0 1.5 2.0
0
5
10
15
20
25
30
0.0 0.5 1.0 1.5 2.0
Chlorophyll (µg/L)
Dep
th (m
)D
epth
(m)
May 11
September 10 October 7August 5
July 6June 10
Fig. 12. Vertical profiles of chlorophyll concentration from station 8 in 2004 in Quesnel Lake.
37

Chl
orop
hyll
(µg/
L)
0.0
0.5
1.0
1.5
2.0
2.5
East Main North
1985-1994 2003 2004
n=4n=4n=4
Fig. 13. Variation in seasonal average chlorophyll concentration in years prior to the record escapements, in 2003, and in 2004 in Quesnel Lake.
38

0
10
20
30
40
0 100
10
20
30
40
0 10 200
10
20
30
40
0 10
0
10
20
30
40
0 5 10 15 200
10
20
30
40
0 100
10
20
30
40
0 10
Daily PR (mg C·m-3·d-1)
Dep
th (m
)D
epth
(m)
May 12
June 13 July 7
August 6
September 11October 8
122 mg C·m-2·d-1
230 mg C·m-2·d-1127 mg C·m-2·d-1
44 mg C·m-2·d-1109 mg C·m-2·d-1
160 mg C·m-2·d-1
Fig. 14. Vertical profiles of photosynthetic rates at station 3 in 2004 in Quesnel Lake.
39

0
10
20
30
40
0 10 200
10
20
30
40
0 100
10
20
30
40
0 10
0
10
0 10 20 300
10
20
30
40
0 10
Daily PR (mg C·m-3·d-1)
Dep
th (m
)D
epth
(m)
May 11
June 12
August 5
September 10
October 7
72 mg C·m-2·d-1
105 mg C·m-2·d-1
158 mg C·m-2·d-1
133 mg C·m-2·d-1
108 mg C·m-2·d-1
Fig. 15. Vertical profiles of photosynthetic rates at station 7 in 2004 in Quesnel Lake.
0
10
20
30
0 10 20
229 mg C·m-2·d-1
July 6
40

0
10
20
30
40
0 100
10
20
30
40
0 100
10
20
30
40
0 10
0
10
20
30
40
0 10 200
10
20
30
40
0 10 200
10
20
30
40
0 10
Daily PR (mg C·m-3·d-1)
Dep
th (m
)D
epth
(m)
May 11
June 12
August 5September 10 October 7
82 mg C·m-2·d-1
161 mg C·m-2·d-1
151 mg C·m-2·d-1
95 mg C·m-2·d-1
106 mg C·m-2·d-1
Fig. 16. Vertical profiles of photosynthetic rates at station 8 in 2004 in Quesnel Lake.
256 mg C·m-2·d-1
July 6
41

0
10
20
30
40
0 100
10
20
30
40
0 10 20 30
10
20
30
40
0 10
0
10
20
30
40
0 100
10
20
30
40
0 100
10
20
30
40
0 10
Daily PR (mg C·m-3·d-1)
Dep
th (m
)D
epth
(m)
May 12June 13
July 7
August 6
September 11
October 8
118 mg C·m-2·d-1
147 mg C·m-2·d-1141 mg C·m-2·d-1
39 mgC·m-2·d-1
99 mg C·m-2·d-1
118 mg C·m-2·d-1
Fig. 17. Vertical profiles of photosynthetic rates at station 9 in 2004 in Quesnel Lake.
42

Dai
ly P
R (m
g C
·m-2
)
0
50
100
150
200
250
300
East Main North
1985-1994 2003 2004
n=3 n=3n=5
0.1
10.0
1000.0
East Main North
1985-1994 2003 2004
Tabe
llaria
(#/m
L)
Fig. 18. Upper figure is the variation in seasonal average daily photosynthetic rates in Quesnel Lake in years prior to the record escapements, in 2003, and in 2004. The lower figure is the variation in Tabellaria numbers in the same years (data available for all years from the Main Arm only).
43

Fig. 19. Seasonal variation in dry biomass of the major zooplankton groups at stations 3 and 7 in Quesnel Lake.
44
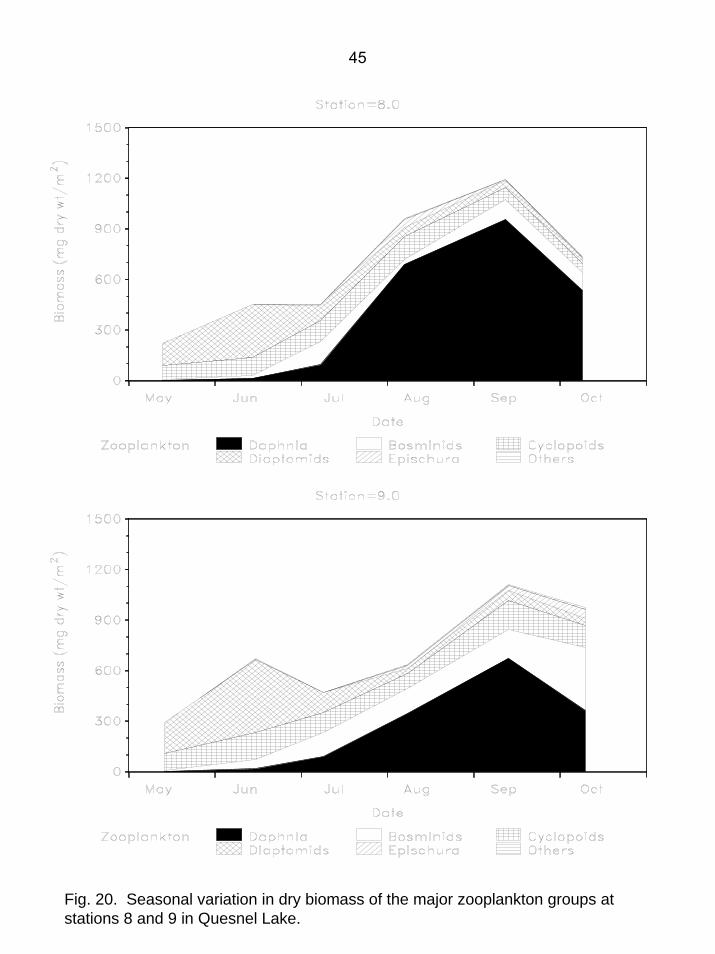
Fig. 20. Seasonal variation in dry biomass of the major zooplankton groups at stations 8 and 9 in Quesnel Lake.
45

Fig. 21. Stomach contents of age-0 sockeye from each basin of A.) Quesnel and B) Shuswap lakes.
B. Shuswap Lake
0%
20%
40%
60%
80%
100%
Main Seymour Mara Salmon
Arm
Pro
porti
on b
y W
eigh
t
OtherCyclopoidsDiaptomidsEpischuraBosminaDaphnia
A. Quesnel Lake
0%
20%
40%
60%
80%
100%
West Main North East
Arm
Pro
porti
on b
y W
eigh
t OtherCyclopoidsDiaptomidsEpischuraBosminaDaphnia
46

A. Quesnel Lake
Bottom
FalseBottom
Fish
B. Shuswap Lake
Fig. 22. Echogram from the October, 2004 surveys from; A) transect 6 onQuesnel Lake and B) transect 11 on Shuswap Lake.
47

0
100
200
300
400
500
600
700
-62 -60 -58 -56 -54 -52 -50 -48 -46 -44 -42 -40 -38 -36 -34 -32 -30 -28 -26 -24 -22
TS (dB)
Freq
uenc
y
Age-0 sockeye sized targets Older kokaneesized targets
Large fish targets
B. Target strength
Fig. 23. A) Length frequency and, B) acoustic target strength (TS) frequency from the 2004 Quesnel survey. TS (roughly corresponding to fish size) and the size range of various expected midwater fish is indicated. Results of scale ageing are shown in A.
0
10
20
30
40
50
60
70
80
90
21 33 45 57 69 81 93 105 117 129 141 153 165 177 189 201 212+
O. nerka Length (3 mm bins)
Freq
uenc
y (n
)
Age -0 Not aged
A. Fork length
Age-0 Age-1
48

A. Quesnel Lake.
0.0
2.0
4.0
6.0
8.0
10.0
0 10 20 30 40 50 60 70
EFS/h a
Size
(g)
B. Shuswap Lake
0.0
1.0
2.0
3.0
4.0
0 20 40 60 80 100
EFS/ha
Size
(g)
Fig. 24. Size of age-0 sockeye fall fry in relationship to effective female escapement. The 2003 brood year (2004 fry yr) is the solid diamond: A) Quesnel Lake and B) Shuswap Lake.
49

0
20
40
60
80
100
120
21 36 51 66 81 96 111 126 141 156 171 186 201
O. nerka Length (3 mm bins)
Freq
uenc
y (n
)
Age -0 Age -1 Not aged
Age-0 Age-1 Age-2+
Fig. 25. Frequency of acoustic target strengths (TS) from the 2004 Shuswap survey. TS (roughly corresponding to fish size) and the size range of various expected midwater fish is indicated. Results of scale ageing are shown in A.
0
500
1000
1500
2000
2500
3000
3500
4000
-62 -60 -58 -56 -54 -52 -50 -48 -46 -44 -42 -40 -38 -36 -34 -32 -30 -28 -26 -24 -22
Target strength (dB)
Freq
uenc
y
Age-0 sockeye sized targets Older kokaneesized targets
Large fish targets
B. Target strength
A. Fork length
50

0
1,000
2,000
3,000
4,000
0 10 20 30 40 50 60 70
EFS/ha
Fall
Fry
(n/h
a)
0
2
4
6
8
10
12
0 10 20 30 40 50 60 70
EFS/ha
Fall
biom
ass
(kg/
ha)
Fig. 26. Abundance and biomass of Quesnel Lake age-0 sockeye in relationship to effective female escapement. The 2003 brood year (2004 fry year) is the solid diamond. Ricker (solid line) and Beverton-Holt (dashed line) curves have been fitted to the data.
51

0
2,000
4,000
6,000
0 20 40 60 80 100
EFS/ha
Fall
Fry
(n/h
a)
0
2
4
6
8
10
12
14
0 20 40 60 80 100
EFS/ha
Fall
Bio
mas
s (k
g/ha
)
Fig. 27. Abundance and biomass of Shuswap Lake age-0 sockeye in relationship to effective female escapement. The 2003 brood year (2004 fry year) is the solid diamond. Ricker (solid line) and Beverton-Holt (dashed line) curves have been fitted to the data.
52