sociology of education - ncaase · sociology of education ... paul t. von hippel and melanie hughes...
TRANSCRIPT

http://soe.sagepub.com/Sociology of Education
http://soe.sagepub.com/content/81/3/242The online version of this article can be found at:
DOI: 10.1177/003804070808100302
2008 81: 242Sociology of EducationDouglas B. Downey, Paul T. von Hippel and Melanie Hughes
School EffectivenessAre ''Failing'' Schools Really Failing? Using Seasonal Comparison to Evaluate
Published by:
http://www.sagepublications.com
On behalf of:
American Sociological Association
can be found at:Sociology of EducationAdditional services and information for
http://soe.sagepub.com/cgi/alertsEmail Alerts:
http://soe.sagepub.com/subscriptionsSubscriptions:
http://www.sagepub.com/journalsReprints.navReprints:
http://www.sagepub.com/journalsPermissions.navPermissions:
http://soe.sagepub.com/content/81/3/242.refs.htmlCitations:
What is This?
- Jul 1, 2008Version of Record >>
at UNIV OF OREGON on October 30, 2012soe.sagepub.comDownloaded from
Are “Failing” Schools Really Failing?Using Seasonal Comparison to Evaluate
School Effectiveness
Douglas B. DowneyPaul T. von Hippel
The Ohio State University
Melanie HughesUniversity of Pittsburgh
To many, it seems obvious which schools are failing—schools whose students perform poorly on
achievement tests. But since evaluating schools on achievement mixes the effects of school and
nonschool influences, achievement-based evaluation likely underestimates the effectiveness of
schools that serve disadvantaged populations. In this article, the authors discuss school-evaluation
methods that more effectively separate school effects from nonschool effects. Specifically, the
authors evaluate schools using 12-month (calendar-year) learning rates, 9-month (school-year)
learning rates, and a provocative new measure, “impact”—which is the difference between the
school-year learning rate and the summer learning rate. Using data from the Early Childhood
Longitudinal Study of 1998–99, the authors show that learning- or impact-based evaluation meth-
ods substantially change conclusions about which schools are failing. In particular, among schools
with failing (i.e., bottom-quintile) achievement levels, less than half are failing with respect to
learning or impact. In addition, schools that serve disadvantaged students are much more likely
to have low achievement levels than they are to have low levels of learning or impact. The impli-
cations of these findings are discussed in relation to market-based educational reform.
Sociology of Education 2008, Vol. 81 (July): 242–270 242
Market-based reforms pervade discus-sions of current educational policy inthe United States. The potential for
markets to promote efficiency, long recog-nized in the private sector, represents anattractive mechanism by which to improvethe quality of public education, especiallyamong urban schools serving poor students,where inefficiency is suspected (Chubb andMoe 1990; Walberg and Bast 2003). Both therapid growth of charter schools (Renzulli andRoscigno 2005) and the emphasis onaccountability in the No Child Left Behind
(NCLB) Act are prompted by the belief thatwhen parents have information about thequality of schools, accompanied by a choiceabout where to send their children, competi-tive pressure will encourage administratorsand teachers to improve schools by workingharder and smarter.
Critical to the success of a market system isthe need for consumers (i.e., parents) to havegood information about the quality of ser-vices (i.e., schools) because market efficiencyis undermined if information is unavailable orinaccurate (Ladd 2002). Toward this end, the
at UNIV OF OREGON on October 30, 2012soe.sagepub.comDownloaded from

Are “Failing” Schools Really Failing? 243
NCLB requires states to make public theirevaluations of schools, addressing the needfor information on quality to be easily acces-sible.
But do states’ usual evaluations providevalid information on school quality? Are theschools that are designated as “failing,”under current criteria, really the least effectiveschools? Under most current evaluation sys-tems, “failing” schools are defined as schoolswith low average achievement scores. Thebasis for this definition of school failure is theassumption that students’ achievement is adirect measure of school quality. Yet we knowthat this assumption is wrong. As theColeman report and other research highlight-ed decades ago, achievement scores havemore to do with family influences than withthe quality of schools (Coleman et al. 1966;Jencks et al. 1972). It follows that a valid sys-tem of school evaluation must separateschool effects from nonschool effects on chil-dren’s achievement and learning.
Since the 1966 Coleman report, sociolo-gists’ contributions to evaluations of schoolshave been less visible, with current educa-tional legislation dominated by ideas fromeconomics and, to a lesser extent, psycholo-gy. In this article, we show how ideas andmethods from sociology can make importantcontributions in the effort to separate schooleffects from nonschool effects. Specifically,we consider evaluating schools using 12-month (calendar-year) learning rates; 9-month (school-year) learning rates; and aprovocative new measure, “impact,” which isthe difference between the school-year learn-ing rate and the summer learning rate. Theimpact measure is unique in that its theoreti-cal and methodological roots are in sociology.
One may expect that the method of eval-uation would have little effect on whichschools appear to be ineffective. After all,schools that have been identified as failingunder achievement-based methods do looklike the worst schools. They not only have lowtest scores, but they tend to have a highturnover of teachers, low levels of resources,and poor morale (Thernstrom andThernstrom 2003). Yet we will show that if weevaluate schools using learning or impact—that is, if we try to isolate the effect of school
from nonschool factors on students’ learn-ing—our ideas about failing schools changein important ways. Among schools that arefailing under an achievement-based criterion,less than half are failing under criteria that arebased on learning or impact. In addition,roughly one-fifth of schools with satisfactoryachievement scores turn up among the poor-est performers with respect to learning orimpact.
These patterns suggest that raw achieve-ment levels cannot be considered an accuratemeasure of the effectiveness of schools; accu-rately gauging school performance requiresnew approaches. Achievement-based indica-tors of school effectiveness are subject to con-siderable error and have limited utility forhelping schools to improve. Evaluatingschools on learning or impact would providebetter information to parents and lead to amore efficient educational market.
THREE MEASURES OF SCHOOLEFFECTIVNESS
In this section, we review the most widelyused method for evaluating schools—achievement—and contrast it with less-often-used methods that are based on learning orgains. We discuss the practice of using stu-dents’ characteristics to “adjust” achievementor gains and highlight the problems that areinherent in making such adjustments. Wethen introduce a new evaluation measurethat we call impact—which measures thedegree to which a school’s students learnfaster when they are in school (during theacademic year) than when they are not (dur-ing summer vacation).
Achievement
Because success in the economy, and in life,typically requires a certain level of academicskill, the NCLB generally holds schoolsaccountable for their students’ levels ofachievement or proficiency. At present, thefederal government allows each state todefine proficiency and set its own proficiencybar (Ryan 2004), but the NCLB provides
at UNIV OF OREGON on October 30, 2012soe.sagepub.comDownloaded from

244 Downey, von Hippel, and Hughes
guidelines about how proficiency is to bemeasured. For example, the NCLB requires allstates to test children in math and readingannually between Grades 3 and 8 and at leastonce between Grades 10 and 12. In addition,states must test students in science three timesbetween Grades 3 and 12. As one example ofhow states have responded, the OhioDepartment of Education complies with theNCLB by using an achievement-bar standardfor Ohio schools that is based on 20 test scoresspanning different grades and subjects, as wellas two indicators (attendance and graduationrates) that are not based on test scores.
In some modest and temporary ways, theNCLB acknowledges that schools serve chil-dren from unequal nonschool environmentsand that these nonschool influences mayhave some effect on children’s achievementlevels. For example, schools with low testscores are not expected to clear the state’sproficiency bar immediately; they can satisfystate requirements by making “adequateyearly progress” toward the desired level forthe first several years. (The definition of “ade-quate yearly progress” varies by state.1) Inthis way, the legislation recognizes thatschools that serve poor children will needsome time to catch up and reach the profi-ciency standards that are expected of allschools. By 2013–14, however, all schools areexpected to reach the standard. More impor-tant, for our purposes, the schools that “needimprovement” are identified mainly on thebasis of their achievement scores.
The main problem with evaluating schoolsthis way is that achievement tests do not ade-quately separate school and nonschool effectson children’s learning. It is likely that aschools’ test scores are a function not just ofschool practices (e.g., good teaching and effi-cient administration), but of nonschool char-acteristics (e.g., involved parenting and high-resource neighborhoods). It is unclear, there-fore, the extent to which schools with hightest scores are necessarily “good” schools andschools with low test scores are necessarilyfailing. Students are not randomly assigned toschools, so there is considerable variation inthe kinds of students who attend differentschools. Thus, when one evaluates schools,the challenge is to measure the value that
schools add independent of the widely varyingnonschool factors that also influence achieve-ment.
Sociologists have documented extensivelythe importance of the home environment tochildren’s development, along with the sub-stantial variation in children’s home experi-ences. As one example of how much homeenvironments vary in cognitive stimulation,Hart and Risley (1995) observed that amongchildren aged 6 months to 3 years, thosewhose families were on welfare had 616words per hour directed to them comparedto 1,251 words for children of working-classparents and 2,153 words for children of pro-fessional parents. Given such varying expo-sure to language, it is not surprising that largegaps in skills can be observed among childrenat the beginning of kindergarten. For exam-ple, 18 percent of children who enteredkindergarten in the United States in the fall of1998 did not know that print reads from leftto right, did not know where to go when aline of print ends, and did not know wherethe story ends in a book (West, Denton, andGermino-Hausken 2000). At the other end ofthe spectrum, a small percentage of kinder-garten entrants could already read words incontext (West et al. 2000).
Of course, widely varying skills amongchildren would not be so problematic for thegoal of measuring school effectiveness ifchildren’s initial achievement levels wererandomly distributed across schools, buteven at the beginning of kindergarten,achievement levels differ substantially fromone school to another (Downey, von Hippel,and Broh 2004; Lee and Burkam 2002;Reardon 2003). At the start of kindergarten,21 percent of the variation in reading testscores and 25 percent of the variation inmath test scores lies between, rather thanwithin, schools (Downey et al. 2004). Inother words, substantial differences inschool achievement levels are observableeven before schools have a chance to mat-ter. Obviously, these variations are not aconsequence of differences in school quality,but represent the fact that schools serve dif-ferent kinds of students.
Although children’s achievement is clearlyinfluenced by both school and nonschool fac-
at UNIV OF OREGON on October 30, 2012soe.sagepub.comDownloaded from
Are “Failing” Schools Really Failing? 245
tors, achievement-based methods of evaluat-ing schools assume that only schools matter.As a result, the burden of improvement is dis-proportionately placed on schools that servechildren from poor nonschool environments,even though it is not clear that these schoolsare less effective than are schools that servechildren from advantaged environments.Although some schools that serve disadvan-taged populations may actually be poor-qual-ity schools, without separating school effectsfrom nonschool effects, it is difficult to makethis evaluation with confidence. These criti-cisms of achievement-based measures ofschool effectiveness are, by now, well estab-lished in the social science community (cf.Scheerens and Bosker 1997; Teddlie andReynolds 1999).
Learning
One way to measure school effectiveness thatbegins to address differences in nonschoolfactors is to gauge how much students learnin a year, rather than where they end up onan achievement scale. The advantage of anapproach based on learning is that schoolsare not rewarded or penalized for theachievement level of their students at thebeginning of the year. Under a learning-basedevaluation system, schools that serve childrenwith initially high achievement would bechallenged to raise students’ performanceeven further, while schools that serve disad-vantaged students could be deemed “effec-tive” if the students made substantialprogress from an initially low achievementlevel, even if their final achievement level wasstill somewhat low.
One example of a learning-based evalua-tion system is the Tennessee Value AddedAssessment System (TVAAS), implemented byTennessee in 1992 to assess its teachers andschools (Sanders 1998; Sanders and Horn1998). Under TVAAS, students are measuredeach year, and data are compiled into a lon-gitudinally merged database linking individ-ual outcomes to teachers, schools, and dis-tricts (Chatterji 2002). Using a mixed modelsomewhat like the models estimated in thisarticle, TVAAS produces estimates of achieve-ment gains for each school and teacher and
then determines a school’s performance bycomparing the school’s or teacher’s gains tothe norm group’s gain on a given grade-leveltest (Kupermintz 2002).
Tennessee is not the only state with learn-ing-based accountability. North and SouthCarolina have implemented systems similar toTVAAS, as has the city of Dallas (Ladd andWalsh 2002). Since the NCLB was passed,politicians and lawmakers have also come torecognize the advantages of learning-basedmeasures. Indeed, in 2005, the U.S. secretaryof education announced that states could col-lect data on children’s learning or achieve-ment growth (along with current informationon raw achievement) that will eventually beused for accountability purposes. Severalstates have since gained approval to pilot-test“growth model” accountability systems.2Outside the policy-making arena, scholars ofeducation have produced a wide range ofindictors of students’ learning (for overviews,see Scheerens and Bosker 1997; Teddlie andReynolds 1999).
Our extension of this useful work is to notean important limitation to learning-basedmeasures of school effectiveness—theamount learned in a year is still heavily influ-enced by children’s time outside school. Thesimplest way to understand how schools lackcontrol over students’ learning is to recognizethat even during the academic year, childrenspend most of their time outside the schoolenvironment. Table 1 presents calculations forthe proportion of waking hours spent inschool, estimated for students with perfectattendance. During a calendar year, whichincludes the nonschool summer, the propor-tion is .25. If we focus on the academic yearonly, the proportion of time spent in schoolincreases, but only to .32. These calculationsagree closely with the survey estimates ofHofferth and Sandberg (2001), who reportedthat school-age children are awake an aver-age of 99–104 hours per week and spend32–33 of these hours in school. In short,whether we measure children’s gains over acalendar or academic year, the majority ofchildren’s waking hours are spent outsideschool. And if we include the years beforekindergarten—which certainly affect achieve-ment and may also affect later learning—we
at UNIV OF OREGON on October 30, 2012soe.sagepub.comDownloaded from

246 Downey, von Hippel, and Hughes
find that the typical 18-year-old American hasspent only 13 percent of his or her wakinghours in school (Walberg 1984).
In short, even during the academic year,children spend most of their time outsideschool. As a result, through no special effort oftheir own, schools that serve children fromadvantaged nonschool environments will moreeasily register learning or gains than will schoolsthat serve children from poor nonschool envi-ronments. Learning, then, although moreunder schools’ control than achievement, is stillheavily contaminated by nonschool factors.
Covariate Adjustment
One way to address the problem of non-school influences is to adjust schools’ learningrates or achievement levels statistically usingmeasured characteristics of students orcovariates. But this approach has seriousproblems (cf. Rubenstein et al. 2004).
First, as a practical matter, it is difficult tofind well-measured covariates that accountfully for children’s nonschool environments.While past research has tried to account fornonschool differences using measures ofpoverty, race/ethnicity, and family structure,among other influences (Ladd and Walsh
2002), it is rarely clear whether a sufficientnumber of nonschool confounders have beenmeasured and measured well (Meyer 1996).Even when considerable nonschool informa-tion is available, it may not adequately cap-ture the effect of nonschool influences onlearning. Typical measures of the nonschoolenvironment, such as parents’ socioeconomicstatus (SES), family structure, race/ethnicity,and gender, explain only 30 percent of thevariation in children’s cognitive skills at thebeginning of kindergarten and just 1 percentof the variation in the amount that childrenlearn when they are out of school duringsummer vacation (Downey et al. 2004).
It is also possible for covariates to overcor-rect estimates of school effectiveness. Forexample, suppose that students’ race/ethnic-ity and SES are correlated with unmeasuredvariables that affect school quality. Modelsthat remove the effects of race/ethnicity andSES may also remove the effect of the unmea-sured school-quality variables. To take anextreme example, consider a segregatedschool system, in which white children andblack children attend separate schools. Byadjusting for students’ race, one is saying, ineffect, that an all-black school can be com-pared only to another all-black school. Under
Table 1. Proportion of Waking Hours that Children Spend in School
From Birth to Hours Age 18 One Calendar Year One Academic Year
Hours in school per day — 7 7
School days attended per year — 180 180
Hours awake each day — 14 14
Hours in school per year — 1,260 1,260
Hours awake per year — 14 hours per day 14 hours per day x 365 days x 285 days
= 5,110 = 3,990
Proportion of waking .13 1,260 hours per year/ 1,260 hours per year/hours in school 5,110 hours per year 3,990 hours per year
= .25 = .32
Source Walberg (1984) Authors’ calculations Authors’ calculations
at UNIV OF OREGON on October 30, 2012soe.sagepub.comDownloaded from

Are “Failing” Schools Really Failing? 247
such constraints, it is impossible to seewhether all-black schools are, on average,more effective or less effective than are all-white schools.
Finally, even if available covariates hadmore desirable statistical properties, adjustingfor covariates such as race is politically sensi-tive. The idea that schools that enroll minori-ty students are held to lower standards istroubling on many levels. Indeed, some of thepopularity of the TVAAS system may stemfrom Sanders’s claim that learning rates donot need adjustment, since they are unrelat-ed to race and SES (Sanders 1998; Sandersand Horn 1998; see also Ryan 2004). As wewill show, this claim is incorrect (see alsoDowney et al. 2004; Kupermintz 2002),although it is true that disadvantage is muchless correlated with learning rates than withachievement.
In short, using covariates to adjust esti-mates of school quality has both method-ological and political limitations. Our alterna-tive strategy, described next, draws on sea-sonal comparison techniques developed as away to improve on covariate adjustment.
Impact
As we mentioned earlier, measured character-istics, such as race and SES, seem to be weakand indirect proxies for the nonschool factorsthat affect children’s learning rates. We nowintroduce a more direct approach to remov-ing nonschool factors from school evalua-tions—an approach that we call impact.
Conceptually, impact is the differencebetween the rate at which children learn inschool and the rate at which they would learnif they were never enrolled in school. Thenever-enrolled learning rate is a counterfactu-al (e.g., Winship and Morgan 1999), which,as usual, cannot be observed directly.However, we can observe how quickly chil-dren learn when they are out of school duringsummer vacation. As a practical matter, then,we can estimate a school’s impact by sub-tracting its students’ summer learning ratefrom the students’ school-year learning rate.For example, in this article, we define aschool’s impact as the average differencebetween its students’ first-grade learning rate
and its students’ learning rate during the pre-vious summer.
The idea of defining impact by comparingschool learning rates to summer learningrates builds on Heyns’s (1978) insight thatwhile learning during the school year is afunction of both nonschool and school fac-tors, summer learning is a product of non-school factors alone. By focusing on thedegree to which schools increase children’slearning over the rates that prevail when chil-dren are not in school, the impact measureaims to separate school effects from non-school effects on learning.
A key advantage of the impact measure isthat it circumvents the formidable task of try-ing to measure and statistically adjust for allthe different aspects of children’s nonschoolenvironments. By focusing instead on non-school learning, impact arguably captureswhat we need to know about children’s learn-ing opportunities outside school withoutincurring the methodological and politicalproblems of covariate adjustment. Anotheradvantage of the impact approach is that itdoes not assume that variations in learningrates are solely a function of environmentalconditions. Even nonenvironmental effects onlearning (e.g., potential variations in students’innate motivation levels) are better account-ed for with summer–school-year compar-isons.
An estimate of impact requires seasonaldata—that is, achievement scores collected atboth the beginning and end of successiveschool years. The notable advantage of sea-sonal data is that they provide an estimate ofchildren’s rate of cognitive growth during thesummer, when children are not in school.Seasonal data are rare in educationalresearch, but are highly revealing when theyare collected. For example, previousresearchers have noted that gaps in academ-ic skills widen primarily during the summer,rather than during the school year, suggest-ing that schooling constrains the growth ofinequality (Downey et al. 2004; Entwisle andAlexander 1992, 1994; Heyns 1978; Reardon2003).
Knowing how fast children learn whenthey are exposed full time to their nonschoolenvironment provides critical leverage for iso-
at UNIV OF OREGON on October 30, 2012soe.sagepub.comDownloaded from

248 Downey, von Hippel, and Hughes
lating school effects. For this reason, theimpact measure has important practicaladvantages over accountability approachesthat require extensive measures of the qualityof students’ nonschool environments. Even indetailed social surveys like the one analyzed inthis article, measures of the nonschool envi-ronment are imperfect and incomplete, andmost school systems collect far less informa-tion than does a social survey. The advantageof the impact measure is that it reducesdependence on observed nonschool charac-teristics, instead relying on the summer learn-ing rate, which is presumably affected notonly by observed characteristics, but byunobserved and even unobservable nonschoolinfluences.
METHODS
Data
We used the Early Childhood LongitudinalStudy, Kindergarten Cohort (ECLS-K), a sur-vey administered by the National Center forEducation Statistics (NCES), U.S. Departmentof Education (NCES 2003). ECLS-K follows amultistage sampling design—first samplinggeographic areas, then sampling schoolswithin each area, and finally sampling chil-dren within each school. Children weretracked from the beginning of kindergartenin fall 1998 to the end of fifth grade in spring2004. But only in the first two school yearswere seasonal data collected that can be usedto estimate school-year and summer learningrates.
We evaluated schools using reading andmath tests. The reading tests measure five lev-els of proficiency: (1) identifying upper- andlower-case letters of the alphabet by name,(2) identifying letters with sounds at thebeginning of words, (3) identifying letterswith sounds at the end of words, (4) recog-nizing common words by sight, and (5) read-ing words in context. Math skill is alsogauged by five levels of proficiency: (1) iden-tifying one-digit numerals, (2) recognizing asequence of patterns, (3) predicting the nextnumber in a sequence, (4) solving simpleaddition and subtraction problems, and (5)
solving simple multiplication and divisionproblems and recognizing more complexnumber patterns. We focus our presentationon the results for reading; results for mathe-matics, which are generally similar, are pre-sented in Appendix A.
The tests followed a two-stage format thatwas designed to reduce ceiling and flooreffects. In the first stage, children took a“routing test” containing items of a widerange of difficulty. In the second stage, chil-dren took a test containing questions of“appropriate difficulty,” given the results ofthe routing test. Item response theory (IRT)was used to map children’s answers onto acommon 64-point scale for mathematics anda 92-point scale for reading. (The readingscale was originally 72 points, but wasrescaled when questions were added after thekindergarten year.) Few scores were clusterednear the top or bottom of the IRT scales, sug-gesting that ceiling and floor effects were suc-cessfully minimized. In addition, the IRTscales improved reliability by downweightingquestions with poor discrimination or high“guessability” (Rock and Pollack 2002).
The reading and mathematics scales maybe interpreted in terms of average first-gradelearning rates. A single point on the readingscale, for example, is approximately theamount learned in two weeks of the firstgrade. We can support this statement bypointing out that, during the first grade,reading scores increase at an average rate ofabout 2.57 points per month,.
A total of 992 schools were visited for test-ing in the fall of kindergarten (Time 1), in thespring of kindergarten (Time 2), and in thespring of first grade (Time 4). Among these992 schools, 309 were randomly selected foran extra test in the fall of first grade (Time 3).Only in those 309 schools could we estimatefirst-grade and summer learning rates. Sincethe summer learning rate is interpreted as awindow into the nonschool environment, weexcluded children who spent part or all of thesummer in school—that is, children whoattended summer school or schools that usedyear-round calendars. We also excluded chil-dren who transferred schools during the two-year observation period, since it would be dif-ficult to know which school deserved credit
at UNIV OF OREGON on October 30, 2012soe.sagepub.comDownloaded from

Are “Failing” Schools Really Failing? 249
for these students’ learning.3 In the end, ouranalysis focused on 4,217 children in 287schools. On average, 15 children were testedper school, but in individual schools as few as1 or as many as 25 students were tested. Theresults were not appreciably different if werestricted the sample to schools with at least15 tested students.
Multilevel Growth Model
We estimated schools’ achievement, learning,and impact rankings using a multilevelgrowth model (Raudenbush and Bryk 2002).Specifically, we fit a three-level model inwhich test scores (Level 1) were nested with-in children and children (Level 2) were nestedwithin schools (Level 3). This multilevelapproach allowed us to estimate mean levelsof achievement, learning, and impact, as wellas school-, child-, and test-level variation.
If each child was tested on the first and lastday of each school year, then learning couldbe estimated simply by subtracting successivetest scores. In the ECLS-K, however, schoolswere visited on a staggered schedule, so that,depending on the school, fall and springmeasurements could be taken anywhere fromone to three months from the beginning orend of the school year. To compensate for thevaried timing of achievement tests, our modeladjusts for the time that the children spent inkindergarten, summer vacation, and the firstgrade at the time of each measurement.
More specifically, at Level 1, we modeledeach test score Ytcs as a linear function of the
months that child c in school s had beenexposed to kindergarten, summer, and firstgrade at the time of test t:4
Ytcs = α0cs + α1cs KINDERGARTENtcs + α2cs SUM-MERtcs + α3cs FIRST GRADEtcs + etcs (1a),
where there aret = 1, 2, 3, 4 measurement occasions
between the start of kindergarten and theend of first grade, for
c = 1, . . . , 15 or so children in each ofs = 1, . . . , 287 schools.
The slopes α1cs, α2cs, and α3cs representmonthly rates of learning during kinder-
garten, summer, and the first grade, and theintercept α0cs represents the child’s achieve-ment level on the last day of the first grade.5This last-day achievement level is an extrapo-lation; it is not the same as the final test scorebecause the final test was typically given oneto three months before the end of the firstgrade. The residual term etcs is measurementerror, or the difference between the test scoreYtcs and the child’s true achievement level atthe time of the test. The variance of the mea-surement error can be calculated from test-reliability estimates in Rock and Pollack(2002); Table 2 reports the error variance forreading and math tests on each of the fourtest occasions.
In vector form, the Level 1 equation can bewritten concisely as
Ytcs = EXPOSUREStcs ααcs + etcs (1b),
where αcs = [α0cs α1cs α2cs v3cs]T and EXPO-SUREStcs = [1 KINDERGARTENtcs SUMMERtcs FIRST
GRADEtcs].Then the Level 2 equation models child-
level variation within each school:
αcs = βs + ac (2),
where βs = [β0s β1s β2s β3s]T is the averageachievement level and learning rates forschool s, and ac = [a0c a1c a2c a3c]
T is a random
effect representing the amount that child cdeviates from the average for school s.
Likewise, the Level 3 equation modelsschool-level variation between one schooland another:
βs = γ0 + bs (3),
where γ0 = γ00 γ01 γ02 γ03]T is a fixed effect rep-resenting the grand average achievement leveland learning rates across all schools, and bs =[b0s b1s b2s b3s]T is a school-level random effectrepresenting the departure of school s from thegrand average. The Level 2 and 3 randomeffects ac and bs are assumed to be uncorrelat-ed with each other; ac and bs are multivariatenormal variables with means of zero and unre-stricted covariance matrices of ΣΣa and ΣΣb.
at UNIV OF OREGON on October 30, 2012soe.sagepub.comDownloaded from

250 Downey, von Hippel, and HughesTa
ble
2.
Mea
sure
men
t Er
ror
Var
ian
ce o
n F
our
Rea
din
g T
ests
an
d F
our
Mat
hem
atic
s Te
sts
Read
ing
Mat
hem
atic
s
Tota
l M
easu
rem
ent
Tota
l M
easu
rem
ent
Occ
asio
n (t
)Va
rianc
eRe
liabi
lity
Erro
r Va
rianc
eVa
rianc
eRe
liabi
lity
Erro
r Va
rianc
e
1. F
all 1
998
73.6
20.
935.
1550
.55
0.92
4.04
2. S
prin
g 19
9911
7.72
0.95
5.89
76.3
90.
944.
583.
Fal
l 199
916
0.53
0.96
6.42
92.3
50.
945.
544.
Sp
ring
2000
200.
790.
976.
0290
.25
0.94
5.42
Not
e: R
elia
bilit
ies
wer
e ca
lcul
ated
by
Rock
and
Pol
lack
(20
02)
usin
g IR
T. If
the
rel
iabi
lity
is r
and
the
tota
l var
ianc
e of
a t
est
is V
ar(Y
sct)
, th
enth
e m
easu
rem
ent
erro
r va
rianc
e is
(1-
r) V
ar(Y
sct)
. N
ote
that
the
var
ianc
e ch
ange
s (t
houg
h no
t by
muc
h) f
rom
one
mea
sure
men
t oc
casi
on t
oth
e ne
xt.
Our
ana
lyse
s ac
coun
t fo
r th
is h
eter
ogen
eity
, bu
t ig
norin
g it
wou
ld y
ield
sim
ilar
resu
lts.
at UNIV OF OREGON on October 30, 2012soe.sagepub.comDownloaded from

Are “Failing” Schools Really Failing? 251
The Level 3 model can be expanded toinclude a vector of school characteristics XS:
βs = γ0 + γ1+XS + bs (4),
where γ1 is a coefficient matrix representing thefixed effects of the school characteristics in Xs,including the school’s location (urban, rural, orsuburban), ethnic composition (percentageminority), poverty level (percentage of studentsreceiving free or reduced-priced lunches), andsector (public, Catholic, non-Catholic religious,or secular private).
Equations 1, 2, and 4 can be combined togive a mixed-model equation:
Ytcs = EXPOSUREStcs (γ0 + γ1 Xs + bs + ac) + etcs (5),
which shows how differences in school learningrates are modeled using interactions betweenschool characteristics Xs and students’ EXPO-SUREStcs to kindergarten, summer, and firstgrade. This model has been used before (e.g.,Downey et al. 2004). What is new in this articleis the emphasis on two derived quantities:
1. The first derived quantity, impact, is the dif-ference between the first-grade and sum-mer learning rates. For school s, impact isβ4s = β3s – β2s.
2. The second derived quantity, 12-monthlearning, is the average monthly learningrate over a period consisting of 2.4 monthsof summer, followed by 9.6 months of thefirst grade. For school s, 12-month learn-ing is β5s = 1—
12(2.4β2s + 9.6β3s).
Average values for impact and 12-monthlearning can be obtained from any softwarethat estimates linear combinations of modelparameters. The variances and correlationsinvolving impact and 12-month learningwere estimated through auxiliary calculationsthat are described in Appendix B.
MULTIPLE IMPUTATION
We compensated for missing values using amultiple-imputation strategy (Rubin 1987)
that filled in each missing value with 10 plau-sible imputations. To ensure that the imputa-tions accounted for correlations among testson the same child, we formatted the data sothat each child’s test scores appeared on asingle line alongside the other variables(Allison 2002). To account for the interactionsin Equation 5, we multiplied the componentsof the interaction before imputation andimputed the resulting products like any othervariable (Allison 2002; von Hippel, underreview).6 To account for the differencebetween child- and school-level variables, wefirst created a school-level file that includedthe school-level variables as well as schoolaverages of the child and test variables. Weimputed this school file 10 times and thenmerged the imputed school files back withthe observed child and test data.
Although our imputation model includedtest scores, none of the imputed test scoreswas used in the analysis. Excluding imputa-tions of the dependent variable is a strategyknown as multiple imputation, then deletion(MID), which increases efficiency and reducesbiases resulting from misspecification of theimputation model (von Hippel 2007).
Although we believe that our imputationstrategy is sound, we recognize that alterna-tives are possible. It is reassuring to note thatour effects are large and robust; we analyzedthese data using a variety of imputationstrategies without material effects on theresults.
RESULTS
In this section, we compare school evaluationmethods based on achievement, learning,and impact. We focus on the results for read-ing. The results for mathematics, which weregenerally similar, are presented in AppendixA.
Which Schools Are Failing?
Table 3 summarizes the distribution ofachievement, learning, and impact across thesampled schools. At the end of the first grade,the average achievement level is 59.33 points(out of 92). Children reach this achievement
at UNIV OF OREGON on October 30, 2012soe.sagepub.comDownloaded from
252 Downey, von Hippel, and Hughes
level by learning at an average rate of 1.70points per month during kindergarten, losing0.08 points per month during the summer,and then gaining 2.57 points per month dur-ing first grade. So school impact—the differ-ence between first-grade and summer learn-ing rates—has an average value of 2.64points per month.7 In addition, 12-monthlearning—the average learning rate over the12-month period from the end of kinder-garten to the end of first grade—is 2.57points per month. Note that if we did nothave seasonal data, we would have to use this12-month, or calendar-year, learning rateinstead of the 9-month learning rate mea-sured during the school year.
Of primary interest are the levels of agree-ment between different methods of evaluat-ing schools. If agreement is high, then themethods are more or less interchangeable,and it does not matter much whether weevaluate schools in terms of achievement,learning, or impact. If agreement is low, how-ever, then it is vital to know which method isbest, since ideas about which schools are fail-ing (or succeeding) would depend stronglyon the yardstick by which schools are evalu-ated.
One way to evaluate agreement is to lookat the school-level correlations in the bottomhalf of Table 3. In general, achievement ismoderately correlated with school-year and12-month learning rates, but only weakly cor-related with impact. For example, acrossschools, achievement (at the end of the firstgrade) has a .52 correlation with the first-grade learning rate (95 percent CI: .40 to.64), and a .58 correlation with the 12-monthlearning rate (95 percent CI: .48 to .69), butachievement has just a .16 correlation withimpact (95 percent CI: –.04 to .36).
Although these correlations are suggestive,they are somewhat abstract. To make differ-ences among the evaluation methods moreconcrete, let us suppose that every schoolwere labeled as either “failing” or “success-ful.” Of course, definitions of failure varyacross states, complicating our attempt toaddress this issue with national data. A usefulexercise with this data, however, is to sup-pose that a school is failing if it is in the bot-tom quintile on a given criterion. The ques-
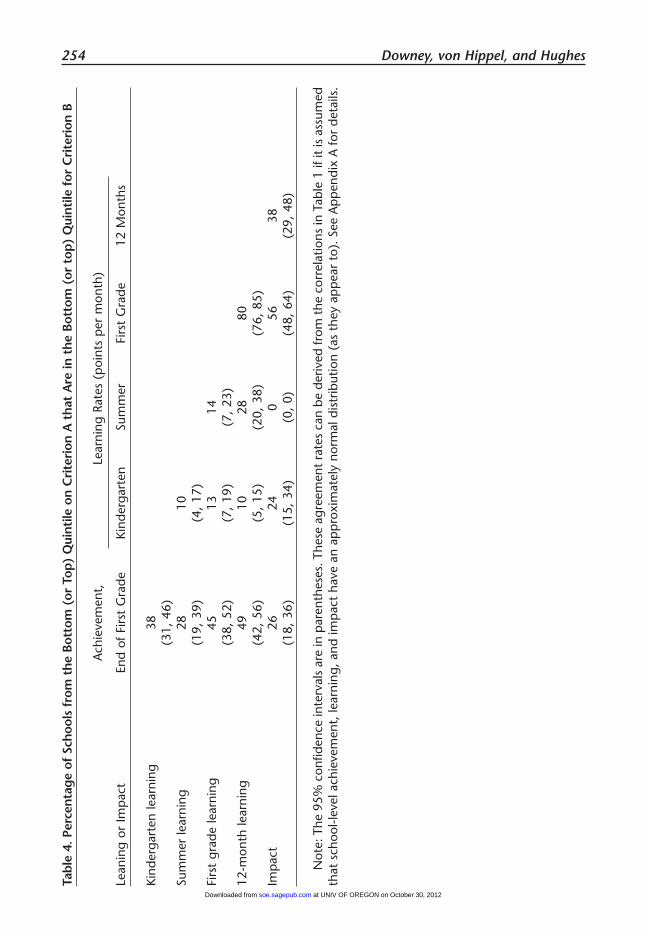
tion, then, is this: How often will a schoolfrom the bottom quintile on one criterion alsobe in the bottom quintile on another? Forexample, among schools with failing achieve-ment levels, what percentage are failing withrespect to learning or impact? This percent-age can be obtained by transforming the cor-relations in Table 3.8
The estimated agreement percentages areshown in Table 4. Again, evaluations basedon achievement agree only modestly withevaluations based on learning, and achieve-ment agrees poorly with impact. Amongschools in the bottom quintile for achieve-ment, 49 percent (95 percent CI: 42 percentto 56 percent) are in the bottom quintile for12-month learning, 45 percent (95 percentCI: 38 percent to 52 percent) are in the bot-tom quintile for first-grade learning, and amere 26 percent (95 percent CI: 18 percentto 36 percent) are in the bottom quintile forimpact. (The chance level of agreementwould be 20 percent.) There are also sub-stantial disagreements between impact andlearning; for example, among schools in thebottom quintile for impact, only 56 percent(95 percent CI: 48 percent to 64 percent) arein the bottom quintile for first-grade learning,and only 38 percent (95 percent CI: 29 per-cent to 48 percent) are in the bottom quintilefor 12-month learning.
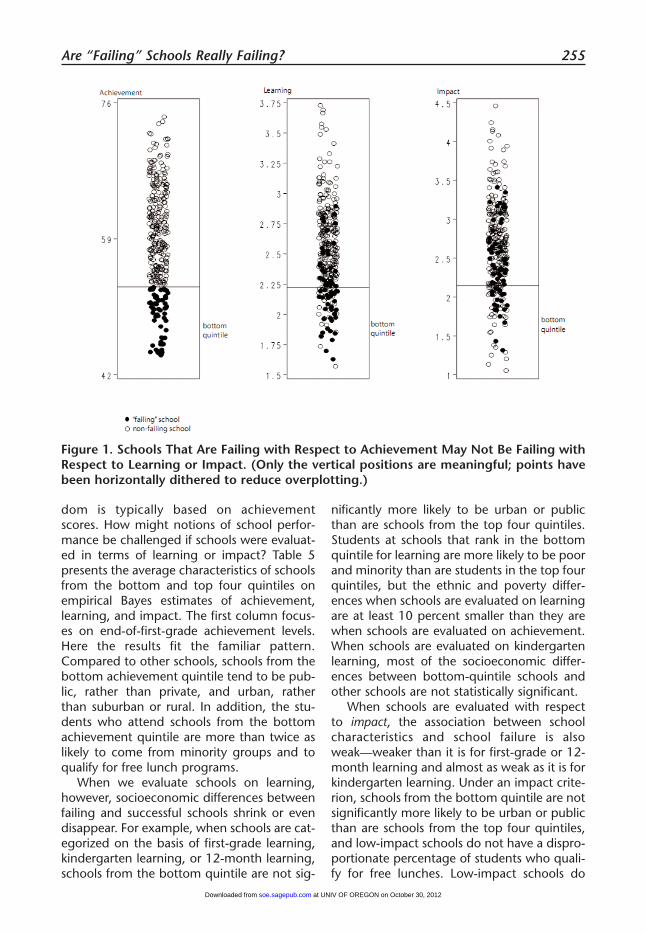
To illustrate the disagreements amongevaluation methods, Figure 1 plots empiricalBayes estimates (Raudenbush and Bryk 2002)of achievement, learning, and impact for the287 schools in our sample. The plots showconcretely how schools with failing achieve-ment levels are often not failing with respectto learning rates and may even be aboveaverage with respect to impact. Conversely, afew schools that are succeeding with respectto achievement appear to be failing withrespect to learning or impact.
What Kinds of Schools AreFailing?
What are the outward characteristics of low-performing schools? Conventional wisdomsuggests that failing schools tend to be urbanpublic schools that serve predominantly pooror minority students. But conventional wis-
at UNIV OF OREGON on October 30, 2012soe.sagepub.comDownloaded from

Are “Failing” Schools Really Failing? 253Ta
ble
3.
Rea
din
g A
chie
vem
ent,
Lea
rnin
g,
and
Im
pac
t, a
s M
easu
red
on
a 9
2-p
oin
t Sc
ale
Ach
ieve
men
t,M
onth
ly L
earn
ing
Rate
s
End
of F
irst
Gra
deKi
nder
gart
enSu
mm
erFi
rst
Gra
de12
Mon
thsa
Imp
actb
Fixe
d Ef
fect
s (m
eans
)59
.33*
**1.
70**
*-0
.08
2.57
***
1.99
***
2.64
***
(58.
40,6
0.26
)(1
.64,
1.76
)(-
0.18
,0.0
3)(2
.50,
2.63
)(1
.94,
2.04
)(2
.51,
2.78
)
Rand
om E
ffect
s (s
choo
l lev
el)
SD7.
07**
*0.
39**
*0.
57**
*0.
45**
*0.
36**
*0.
78**
*(6
.32,
7.81
)(0
.33,
0.44
)(0
.46,
0.69
)(0
.40,
0.51
)(0
.32,
0.40
)(0
.63,
0.93
)C
orre
latio
nsKi
nder
gart
en le
arni
ng0.
40**
*(0
.25,
0.5
4)
Sum
mer
lear
ning
0.19
†-0
.30*
*
(-0.
02,0
.40)
(-0.
52,-
0.09
)Fi
rst-
grad
e le
arni
ng0.
52**
*-0
.19*
-0.1
4(0
.40,
0.64
)(-
0.37
,-0.
01)
(-0.
36,0
.08)
12-m
onth
lear
ning
0.58
***
-0.2
9***
0.21
†0.
94**
*(0
.48,
0.69
)(-
0.46
,-0.
13)
(-0.
01,0
.42)
(0.9
1,0.
97)
Imp
act
0.16
0.11
0.82
***
0.68
***
0.39
***
(-0.
04,0
.36)
(-0.
11,0
.33)
(-0.
90,-
0.74
)(0
.57,
0.80
)(0
.20,
0.58
)
Not
e: C
hild
-leve
l ran
dom
effe
cts
are
not
show
n. T
he 9
5 p
erce
nt c
onfid
ence
inte
rval
s ar
e in
par
enth
eses
.a T
wel
ve-m
onth
lear
ning
is r
ecko
ned
from
the
end
of
kind
erga
rten
to
the
end
of f
irst
grad
e.b I
mp
act
is t
he d
iffer
ence
bet
wee
n th
e fir
st-g
rade
and
sum
mer
lear
ning
rat
es.
† p<
.10,
*p
< .0
5, *
*p<
.01,
***
p<
.001
.
at UNIV OF OREGON on October 30, 2012soe.sagepub.comDownloaded from
254 Downey, von Hippel, and HughesTa
ble
4. P
erce
nta
ge
of S
choo
ls f
rom
th
e B
otto
m (
or T
op)
Qui
nti
le o
n C
rite
rion
A t
hat
Are
in t
he
Bot
tom
(or
top
) Q
uin
tile
for
Cri
teri
on B
Ach
ieve
men
t,Le
arni
ng R
ates
(p
oint
s p
er m
onth
)
Lean
ing
or Im
pac
tEn
d of
Firs
t G
rade
Kind
erga
rten
Sum
mer
Firs
t G
rade
12 M
onth
s
Kind
erga
rten
lear
ning
38(3
1, 4
6)Su
mm
er le
arni
ng28
10(1
9, 3
9)(4
, 17
)Fi
rst
grad
e le
arni
ng45
1314
(38,
52)
(7,
19)
(7,
23)
12-m
onth
lear
ning
4910
2880
(42,
56)
(5,
15)
(20,
38)
(76,
85)
Imp
act
2624
056
38(1
8, 3
6)(1
5, 3
4)(0
, 0)
(48,
64)
(29,
48)
Not
e: T
he 9
5% c
onfid
ence
inte
rval
s ar
e in
par
enth
eses
. The
se a
gree
men
t ra
tes
can
be d
eriv
ed fr
om t
he c
orre
latio
ns in
Tab
le 1
if it
is a
ssum
edth
at s
choo
l-lev
el a
chie
vem
ent,
lear
ning
, and
imp
act
have
an
app
roxi
mat
ely
norm
al d
istr
ibut
ion
(as
they
ap
pea
r to
). S
ee A
pp
endi
x A
for
deta
ils.
at UNIV OF OREGON on October 30, 2012soe.sagepub.comDownloaded from
Are “Failing” Schools Really Failing? 255
dom is typically based on achievementscores. How might notions of school perfor-mance be challenged if schools were evaluat-ed in terms of learning or impact? Table 5presents the average characteristics of schoolsfrom the bottom and top four quintiles onempirical Bayes estimates of achievement,learning, and impact. The first column focus-es on end-of-first-grade achievement levels.Here the results fit the familiar pattern.Compared to other schools, schools from thebottom achievement quintile tend to be pub-lic, rather than private, and urban, ratherthan suburban or rural. In addition, the stu-dents who attend schools from the bottomachievement quintile are more than twice aslikely to come from minority groups and toqualify for free lunch programs.
When we evaluate schools on learning,however, socioeconomic differences betweenfailing and successful schools shrink or evendisappear. For example, when schools are cat-egorized on the basis of first-grade learning,kindergarten learning, or 12-month learning,schools from the bottom quintile are not sig-
nificantly more likely to be urban or publicthan are schools from the top four quintiles.Students at schools that rank in the bottomquintile for learning are more likely to be poorand minority than are students in the top fourquintiles, but the ethnic and poverty differ-ences when schools are evaluated on learningare at least 10 percent smaller than they arewhen schools are evaluated on achievement.When schools are evaluated on kindergartenlearning, most of the socioeconomic differ-ences between bottom-quintile schools andother schools are not statistically significant.
When schools are evaluated with respectto impact, the association between schoolcharacteristics and school failure is alsoweak—weaker than it is for first-grade or 12-month learning and almost as weak as it is forkindergarten learning. Under an impact crite-rion, schools from the bottom quintile are notsignificantly more likely to be urban or publicthan are schools from the top four quintiles,and low-impact schools do not have a dispro-portionate percentage of students who quali-fy for free lunches. Low-impact schools do
Figure 1. Schools That Are Failing with Respect to Achievement May Not Be Failing withRespect to Learning or Impact. (Only the vertical positions are meaningful; points havebeen horizontally dithered to reduce overplotting.)
at UNIV OF OREGON on October 30, 2012soe.sagepub.comDownloaded from

256 Downey, von Hippel, and HughesTa
ble
5.
Mea
n C
har
acte
rist
ics
of
Faili
ng
ver
sus
No
nfa
ilin
g S
cho
ols
, U
nd
er D
iffe
ren
t C
rite
ria
for
Failu
re
Ach
ieve
men
t,Ki
nder
gart
en
Firs
t-G
rade
12
-Mon
th
End
of F
irst
Gra
deLe
arni
ngLe
arni
ngLe
arni
ngIm
pac
t
Bott
omTo
p F
our
.Bo
ttom
Top
Fou
rBo
ttom
Top
Fou
rBo
ttom
Top
Fou
rBo
ttom
Top
Fou
rC
hara
cter
istic
Qui
ntile
Qui
ntile
sD
iffQ
uint
ileQ
uint
iles
Diff
Qui
ntile
Qui
ntile
sD
iffQ
uint
ileQ
uint
iles
Diff
Qui
ntile
Qui
ntile
sD
iff
Scho
ol S
ecto
r(P
erce
ntag
e of
Sch
ools
)Pu
blic
9671
***
7576
7975
7975
6978
Cat
holic
412
†14
105
125
1211
10O
ther
rel
igio
us0
12**
810
611
710
710
Secu
lar
priv
ate
15
34
93
*9
3*
122
***
Scho
ol L
ocat
ion
(Per
cent
age
of S
choo
ls)
Urb
an53
35*
4637
3839
3839
4138
Subu
rban
2342
*36
3935
3935
3941
38Ru
ral
2423
1824
2722
2722
1824
Prop
ortio
nRe
ceiv
ing
free
lu
nche
s52
22**
*34
27†
3826
**38
26**
2629
Rece
ivin
g re
duce
d-p
rice
lunc
hes
97
†8
78
78
77
7M
inor
ity69
31**
*42
3858
34**
*57
34**
*49
36*
†p<
.10,
*p
< .0
5, *
*p<
.01,
***
p<
.001
.
at UNIV OF OREGON on October 30, 2012soe.sagepub.comDownloaded from
Are “Failing” Schools Really Failing? 257
have a higher percentage of students fromminority groups (49 percent versus 36 per-cent for the top four quintiles, p <. 05), butthe difference is about 10 percent smallerthan it is when schools are evaluated on first-grade learning or 12-month learning and 25percent smaller than it is when schools areevaluated on achievement.
Another way to examine school character-istics is to add school-level regressors to ourmultilevel model of achievement, learning,and impact. We do so in Table 6, which againshows that student disadvantage is morestrongly associated with achievement than itis with learning or impact. Specifically, Table 6indicates that school sector, school location,students’ poverty, and minority enrollmentexplain 51 percent of the school-level vari-ance in end-of-first-grade achievement levelsbut just 26 percent of the school-level vari-ance in 12-month learning rates, 17 percentof the school-level variance in first-gradelearning rates, 7 percent of the school-levelvariance in impact, and a mere 5 percent ofthe school-level variance in kindergartenlearning rates. In short, when schools areevaluated with respect to achievement,schools that serve disadvantaged students aredisproportionately likely to be labeled as fail-ing. When schools are evaluated in terms oflearning or impact, however, school failureappears to be less concentrated among dis-advantaged groups.
REMAINING ISSUES
We have introduced impact as a potentialreplacement for the typically used achieve-ment-based measures of school effectiveness.Yet we recognize that evaluating schools viaimpact requires some assumptions and raisesseveral new questions.
First, the impact measure assumes thatthere is little “spillover” between seasons—that is, that school characteristics do not haveimportant influences on summer learning.The literature on spillover effects is limited,but the available evidence suggests thatspillover effects are minimal. Georgies (2003)reported no relationship between summerlearning and kindergarten teachers’ practices
or classroom characteristics. And in our ownsupplemental analyses of ECLS-K, we foundthat summer learning rates were not higher ifkindergarten teachers assigned summer booklists or if schools sent home preparatory“packages” before the beginning of the firstgrade.
Second, the impact measure assumes thatnonschool influences on learning are similarduring the school year and during summervacation. This assumption is more debatable.It seems plausible that nonschool effects maybe smaller during the school year than duringthe summer, for the obvious reason that dur-ing the school year, children spend less timein their nonschool environments. This obser-vation suggests the possibility of a weightedimpact score that subtracts only a fraction ofthe summer learning rate. The ideal weight togive summer is hard to know,9 but the resultsfor weighted impact would lie somewherebetween the results for unweighted impact(effectively weighted impact where summerlearning has a weight of one) and the resultsfor school-year learning (which effectivelygives summer learning a weight of zero). Nomatter where the results fall on this continu-um, the characteristics of low-impact schoolswould be quite different from those of low-achieving schools. That is, compared to low-achievement schools, low-impact schools arenot nearly as likely to be public, urban, poor,or heavily minority.10
An additional concern is that even ifimpact is a more valid measure of effective-ness than is achievement, it may also be lessreliable. It is well known that estimates ofschool learning rates are less reliable than areestimates of school achievement levels (e.g.,Kane and Staiger 2002; von Hippel 2004),and estimates of impact are less reliable still(von Hippel, forthcoming). In a companionpaper, however, we show that the increase invalidity more than compensates for the loss inreliability; that is, a noisy measure of learningis still a better reflection of school effective-ness than is a clean measure of achievement,and a noisy measure of impact may be betterstill (von Hippel forthcoming).
A final concern is that impact-based evalu-ation may penalize schools with high achieve-ment. It may be difficult for any school, no
at UNIV OF OREGON on October 30, 2012soe.sagepub.comDownloaded from

258 Downey, von Hippel, and HughesTa
ble
6.
Sch
oo
l-le
vel P
red
icto
rs o
f R
ead
ing
Ach
ieve
men
t, L
earn
ing
, an
d I
mp
act
Ach
ieve
men
t,Le
arni
ng R
ates
(p
oint
s p
er m
onth
)Im
pac
tb
End
of F
irst
Gra
deKi
nder
gart
enSu
mm
erFi
rst
Gra
de12
Mon
thsa
Fixe
d Ef
fect
sIn
terc
ept
64.1
6***
1.69
***
–0.0
22.
74**
*2.
14**
*2.
76**
*(6
2.24
,66.
08)
(1.5
5,1.
84)
(–0.
31,0
.27)
(2.5
6,2.
92)
(2.0
1,2.
27)
(2.3
5,3.
16)
Scho
ol S
ecto
rC
atho
lic1.
80–0
.03
0.07
0.09
0.08
0.02
(–0.
79,4
.39)
(–0.
23,0
.17)
(–0.
29,0
.44)
(–0.
14,0
.31)
(–0.
09,0
.26)
(–0.
46,0
.50)
Oth
er r
elig
ious
4.39
**0.
24*
0.37
0.13
0.18
*–0
.24
(1.4
7,7.
30)
(0.0
2,0.
46)
(–0.
14,0
.87)
(–0.
12,0
.37)
(0.0
0,0.
36)
(–0.
89,0
.41)
Secu
lar
priv
ate
3.57
0.04
0.32
–0.5
2*–0
.34*
–0.8
5†(–
1.04
,8.1
8)(–
0.31
,0.3
8)(–
0.40
,1.0
5)(–
0.92
,–0.
12)
(–0.
65,–
0.03
)(–
1.76
,0.0
7)Sc
hool
Loc
atio
nU
rban
–0.4
1–0
.01
–0.0
70.
00–0
.02
0.07
(–2.
22,1
.40)
(–0.
15,0
.13)
(–0.
33,0
.19)
(–0.
14,0
.14)
(–0.
13,0
.09)
(–0.
27,0
.40)
Rura
l–2
.02*
0.11
–0.1
2–0
.05
–0.0
60.
07(–
3.95
,–0.
10)
(–0.
05,0
.26)
(–0.
39,0
.14)
(–0.
21,0
.12)
(–0.
19,0
.06)
(–0.
28,0
.42)
Prop
ortio
nRe
ceiv
ing
free
lunc
hes
–9.8
4***
–0.2
4–0
.52†
0.01
–0.1
00.
53(–
14.3
2,–5
.36)
(–0.
59,0
.11)
(–1.
14,0
.10)
(–0.
31,0
.33)
(–0.
35,0
.14)
(–0.
25,1
.31)
Rece
ivin
g re
duce
d-p
riced
lunc
hes
–0.7
10.
710.
99–0
.29
–0.0
2–1
.28
(–18
.39,
16.9
7)(–
0.62
,2.0
4)(–
1.81
,3.7
8)(–
1.98
,1.3
9)(–
1.20
,1.1
7)(–
5.13
,2.5
6)M
inor
ity–5
.39*
*–0
.03
0.08
–0.3
8**
–0.2
8***
–0.4
6(–
8.73
,–2.
05)
(–0.
28,0
.21)
(–0.
39,0
.55)
(–0.
63,–
0.14
)(–
0.45
,–0.
12)
(–1.
10,0
.17)
Rand
om E
ffect
s (s
choo
l lev
el)
SD4.
92**
*0.
37**
*0.
55**
*0.
41**
*0.
31**
*0.
76**
*(4
.27,
5.57
)(0
.31,
0.42
)(0
.44,
0.66
)(0
.35,
0.46
)(0
.27,
0.36
)(0
.62,
0.90
)
R2.5
1.0
5.1
0.1
7.2
6.0
7
Not
e: R
2is
the
pro
por
tion
by w
hich
the
sch
ool-l
evel
var
ianc
es a
re r
educ
ed f
rom
Tab
le 1
. N
ot s
how
n: c
hild
- an
d te
st-le
vel r
ando
m e
ffect
s, s
choo
l-le
vel c
orre
latio
ns.
a The
om
itted
sch
ool s
ecto
r is
pub
lic,
and
the
omitt
ed s
choo
l loc
atio
n is
sub
urba
n. T
hus,
the
inte
rcep
t re
pre
sent
s th
e ex
pec
ted
valu
es f
or a
sub
ur-
ban
pub
lic s
choo
l with
no
min
ority
stu
dent
s an
d no
stu
dent
s re
ceiv
ing
free
or
redu
ced-
pric
e lu
nche
s.†p
<.10
, *p
<.05
, **
p<.0
1, *
**p<
.001
. Pa
rent
hese
s en
clos
e 95
con
fiden
ce in
terv
als.
at UNIV OF OREGON on October 30, 2012soe.sagepub.comDownloaded from

Are “Failing” Schools Really Failing? 259
matter how good, to accelerate learning dur-ing the school year for high-achievement chil-dren. Our study, however, did not find a neg-ative correlation between impact andachievement; to the contrary, the correlationbetween achievement and impact was posi-tive, although small (see Table 3). And amongschools in the top quintile on achievement,26 percent were also in the top quintile onimpact (see Table 4), suggesting that it is possi-ble for a high-achieving school to have highimpact as well. It would be fair to say, though,that a school with fast summer learning cannotalso have high impact (see Tables 4 and A2). Tothe degree that fast summer learning is typicalof children from privileged families, this couldbe a concern for schools that serve such chil-dren under an impact-based evaluation system.
Although the assumptions of impact-basedevaluation are nontrivial, we should bear inmind that every school-evaluation measuremakes assumptions. The assumptions that areneeded for the impact measure should becompared to those that are required to treatachievement or learning as measures ofschool performance. As we previously noted,evaluation systems that are based on achieve-ment or learning assume that nonschool fac-tors play a relatively minor role in shaping stu-dents’ outcomes. This assumption is severelywrong for achievement and somewhat wrongfor learning.
DISCUSSION
The simple observation that children are influ-enced in important ways by their nonschoolenvironments undermines achievement-based methods for evaluating schools.Confidently identifying failing schoolsrequires a method of evaluation that is socio-logically informed—that is, a method thatrecognizes that children’s cognitive develop-ment is a function of exposure to multiplesocial contexts. While holding schoolsaccountable for their performance is attrac-tive for many reasons, schools cannot reason-ably be held responsible for what happens tochildren when they are not under theirpurview.
Other scholars have made the same obser-
vation and have proposed alternatives toachievement-based assessment by usingannual learning rates or by “adjusting”achievement levels for schools’ socioeconom-ic characteristics. We have already discussedthe practical, theoretical, and political difficul-ties of these alternatives. Our contribution is anovel solution. By using seasonal data, we canevaluate schools in terms of impact—separat-ing the effects of the school and nonschoolenvironments without having to measureeither environment directly. We suggest thatimpact can be an important part of the con-tinuing discussion on measuring the effective-ness of schools.
We have argued that there are conceptualreasons for preferring impact over achieve-ment and even over learning-based measuresof school effectiveness. If we are correct thatachievement is the least valid measure ofschool effectiveness, then our results suggestthat there is substantial error in the wayschools are currently evaluated. Indeed, ouranalyses indicate that, more often than not,schools that are vulnerable to the “failing”label under achievement standards are notamong the least effective schools. Specifically,among schools from the bottom quintile forachievement, we found that less than half arein the bottom quintile for learning and only aquarter are in the bottom quintile for impact.In these mislabeled schools, students havelow achievement levels, but they are learningat a reasonable rate, and they are learningsubstantially faster during the school yearthan during summer vacation. These patternssuggest that many so-called failing schoolsare having at least as much impact on theirstudents’ learning rates as are schools withmuch higher achievement scores.
We should emphasize that our results donot suggest that all schools have a similarimpact. To the contrary, impact varies evenmore across schools than does achievementor learning. For impact, the between-schoolcoefficient of variation is 30 percent; that is,the between-school standard deviation is 30percent of the mean. For learning rates, bycontrast, the coefficient of variation is just 23percent in kindergarten and 18 percent in thefirst grade, and for end-of-first-grade achieve-ment, the coefficient of variation is just 12
at UNIV OF OREGON on October 30, 2012soe.sagepub.comDownloaded from

260 Downey, von Hippel, and Hughes
percent. So schools do vary substantially inimpact, but variation in impact is not strong-ly associated with school characteristics, suchas sector or location, or with the characteris-tics of the student body. Whereas high-achieving schools are concentrated amongthe affluent, high-impact schools exist incommunities of every kind. For example, indisadvantaged communities, despite scarceresources, the high turnover of teachers, andlow parental involvement, a sizable numberof schools are having a considerable impact—much more than was previously thought.When we measure school effectiveness fairly,the results highlight how schools that servethe disadvantaged can do a good job even ifthey do not raise students’ skills to a high oreven average level of proficiency.11
Our results raise serious concerns aboutthe current methods that are used to holdschools accountable for their students’achievement levels. Because achievement-based evaluation is biased against schoolsthat serve the disadvantaged, evaluatingschools on the basis of achievement mayactually undermine the NCLB goal of reduc-ing racial/ethnic and socioeconomic gaps inperformance. If schools that serve the disad-vantaged are evaluated on a biased scale,their teachers and administrators mayrespond like workers in other industries whenthey are evaluated unfairly—with frustration,reduced effort, and attrition (Hodson 2001).Under a fair system, a school’s chances ofreceiving a high mark should not depend onthe kinds of students the school happens toserve.
The validity of school performance mea-sures is critical to the success of market-basededucational reforms because making informa-tion about school quality publicly available issupposed to pressure school personnel toimprove. But our results suggest that theinformation that is currently available regard-ing school quality is substantially flawed,undermining the development of marketpressures as a mechanism for improvingAmerican schools. Achievement-based indi-cators of school effectiveness reduce marketefficiency by too often sending parents awayfrom good schools that serve children fromdisadvantaged backgrounds and insufficiently
pressuring unproductive schools that servechildren from advantaged backgrounds. Ourresults suggest that the magnitude of theerror is substantial; indeed, current account-ability systems that rely on achievement maydo as much to undermine school quality asthey do to promote it.
NOTES
1. In Ohio, adequate yearly progress typi-cally means reducing the gap between aschool’s or district’s baseline performance(average of the years 1999–2000, 2000–01,and 2001–02) and the proficiency bar by 10percentage points per year between 2003–04and 2013–14.
2. Pilot programs were first approved in2006 by Tennessee and North Carolina and in2007 by Arizona, Arkansas, Delaware, Florida,Iowa, and conditionally in Ohio.
3. A multilevel model requires that eachunit from the lower level (each child) remainsnested within a single unit from the higherlevel (a school). Data that violate this assump-tion may be modeled using a cross-classifiedmodel, but such models present serious com-putational difficulties, especially when achild’s new school was not in the originalsample. In our analyses, we deleted teststaken after a child moved schools. The resultsare not materially different if we keep thesescores and attribute them to the child’s origi-nal school.
4. These exposures are estimated by com-paring the test date to the first and last datesof kindergarten and the first grade. Test datesare part of the public data release; the firstand last dates of the school year are availableto researchers with a restricted-use datalicense.
5. To ensure that the intercept had thisinterpretation, we centered each EXPOSURES
variable around its maximum. To understandmaximum centering, let KINDERGARTEN*tcs bethe number of months that child c in school shas spent in kindergarten at the time of test t.The maximum value of KINDERGARTEN*tcs isKINDLENGTHs, which is the length of the kinder-garten year in school s. (An average value
at UNIV OF OREGON on October 30, 2012soe.sagepub.comDownloaded from

Are “Failing” Schools Really Failing? 261
would be KINDLENGTHs = 9.4 months.) Then
the maximum-centered variable KINDERGAR-TENtcs is defined as KINDERGARTEN*tcs –KINDLENGTHs; this maximum-centered variablehas a maximum of zero. If KINDERGARTENtcs,SUMMERtcs and FIRST GRADEtcs are all maximumcentered, the intercept σ0cs represents thechild’s score on the last day of the first grade,when KINDERGARTENtcs, SUMMERtcs, and FIRST
GRADEtcs all reach their maximum values ofzero.
6. As is often the case, there was substan-tial colinearity between the interactions andthe component variables. The imputationmodel compensated for this colinearity byusing a ridge prior, as suggested by Schafer(1997).
7. 2.57 minus -0.08 gives an impact of2.65, but if values are not rounded beforesubtraction, the value of impact is closer to2.64.
8. The resulting percentages will be mea-sures of latent school-level agreement, dis-counting random variation at the child andtest levels. The transformation assumes thatthe different measures of school effectivenesshave a multivariate normal distribution.(Scatterplots suggest that this assumption isreasonable.) Let (Zi, Zj) be standardized ver-sions of two school-effectiveness measures,and let q ≈ –.84 be the first quintile of thestandard normal distribution. Then, giventhat Zi is in the bottom quintile (i.e., Zs < q).the probability that Zj is also in the bottom
quintile is pij = P(Zi<q | Zj<q) = 5 P(Zi<q, Zj<q)
= 5 Φ2(q, q, ρij), where Φ2(q, q, ρij) is the
bivariate cumulative standard normal densitywith correlation ρij, evaluated at (q, q) (Roseand Smith 2002). A confidence interval for pij
is obtained by transforming the endpoints ofa confidence interval for ρij.
9. An initially attractive possibility is to esti-mate the fraction by regressing the school-year learning rate on the summer learningrate. But since the correlation betweenschool-year and summer learning is negative(see Table 3), the estimated fraction would be
negative as well, yielding an impact measurethat is the sum, rather than the difference, ofschool and summer learning rates.
10. A more subtle possibility is that thenonschool effect on learning varies acrossseasons and the seasonal pattern varies acrossschools that serve different types of students.Suppose high-SES parents, for example,invest substantially in the summer but thenrelatively less so during the school year whilelow-SES parents produce the opposite sea-sonal pattern. This kind of scenario wouldproduce biases in the impact measure, under-estimating school impact for schools servinghigh-SES families and overestimating the per-formance of schools serving low-SES parents.Although little is known about this possiblesource of bias, most of what we know aboutparental involvement in children’s schoolingsuggests that this pattern is unlikely.Socioeconomically advantaged parentsremain actively involved in their children’slives during the academic year by helpingwith homework, volunteering in classes, andattending school activities and parent-teacherconferences (Lareau 2000).
11. It is not impractical to make schoolevaluation systems fairer. Currently, the NCLBrequires testing at the end of every year inGrades 3–8. These tests are typically used torank schools on the basis of achievement, butthe availability of annual test scores makes itpossible to rank schools on the basis of theamount learned in a 12-month calendar year.Alternatively, the six tests given in Grades 3–8could be rescheduled to permit seasonalcomparisons. The testing schedule could bereshuffled so that tests are given at the end ofGrade 3 and the beginning and end of Grade4 and then, likewise, at the end of the Grade7 and the beginning and end of Grade 8.Such a schedule would allow school evalua-tors to estimate impact and school-year learn-ing during the fourth grade and the eighthgrade without increasing the number of tests.Valid information about these two schoolyears would be preferable to the six years oflow-validity achievement levels that are cur-rently provided.
at UNIV OF OREGON on October 30, 2012soe.sagepub.comDownloaded from

262 Downey, von Hippel, and HughesA
PP
END
IX A
Res
ults
for
Math
emati
cs
Tab
le A
1. M
ath
emat
ics
Ach
ieve
men
t, L
earn
ing
, an
d I
mp
act,
as
Mea
sure
d o
n a
64-
po
int
Scal
e
Ach
ieve
men
t,M
onth
ly L
earn
ing
Rate
Imp
act
End
of F
irst
Gra
deKi
nder
gart
enSu
mm
erFi
rst
Gra
de12
Mon
ths
Fixe
d Ef
fect
s (m
eans
)45
.58*
**1.
34**
*0.
47**
*1.
57**
*1.
33**
*1.
10**
*(4
5.01
,46.
15)
(1.3
0,1.
399)
(0
.37,
0.57
) (1
.53,
1.61
) (1
.30,
1.36
)(0
.98,
1.22
)Ra
ndom
Effe
cts
Scho
ol-le
vel S
D4.
26**
*0.
27**
*0.
58**
*0.
26**
*0.
20**
*0.
70**
*(3
.79,
4.72
)(0
.24,
0.31
) (0
.48,
0.68
) (0
.22,
0.30
)(0
.17,
0.23
)(0
.58,
0.83
)
Scho
ol-le
vel c
orre
latio
nsKi
nder
gart
en le
arni
ng0.
44**
*(0
.29,
0.59
)Su
mm
er le
arni
ng0.
07–0
.44*
**(–
0.12
,0.2
7)(–
0.62
,–0.
26)
Firs
t-gr
ade
lear
ning
0.11
–0.2
2*–0
.31*
*(-
0.06
,0.2
8)(–
0.42
,–0.
03)
(–0.
51,–
0.12
)12
-mon
th le
arni
ng0.
15†
–0.5
0***
0.30
**0.
81**
*(–
0.01
,0.3
2)(–
0.65
,–0.
34)
(0.1
1,0.
50)
(0.7
3,0.
88)
Imp
act
–0.0
20.
28**
–0.9
4***
0.63
***
0.05
(–0.
21,0
.17)
(0
.07,
0.48
)(–
0.96
,–0.
91)
(0.4
9,0.
76)
(–0.
17,0
.26)
Not
e: P
aren
thes
es e
nclo
se 9
5 p
erce
nt c
onfid
ence
inte
rval
s. R
ando
m e
ffect
s at
the
chi
ld le
vel a
re n
ot s
how
n.a T
wel
ve-m
onth
lear
ning
is r
ecko
ned
from
the
end
of
kind
erga
rten
to
the
end
of f
irst
grad
e.b I
mp
act
is t
he d
iffer
ence
bet
wee
n th
e fir
st-g
rade
lear
ning
rat
e an
d th
e su
mm
er le
arni
ng r
ate.
†p<
.10,
*p
< .0
5, *
*p<
.01,
***
p<
.001
.
at UNIV OF OREGON on October 30, 2012soe.sagepub.comDownloaded from

Are “Failing” Schools Really Failing? 263
Table A2. Which Schools Are Failing Mathematics? Percentage Agreement Matrix
Achievement, Learning Rates (points per month)End of
First Grade Kindergarten Summer First Grade 12 Months
Kindergarten learning 40(33,49)
Summer learning 23 6(16,31) (2,11)
First-grade learning 24 12 9(18,32) (6,19) (4,16)
12-month learning 26 4 33 65(20,34) (1,8) (24,44) (59,73)
Impact 19 32 0 51 22(12,27) (23,42) (0,0) (43,61) (14,31)
Note: Among schools from the bottom quintile on criterion A, this matrix shows whatpercentage are also in the bottom quintile for criterion B. Parentheses enclose 95 percentconfidence intervals.
at UNIV OF OREGON on October 30, 2012soe.sagepub.comDownloaded from

264 Downey, von Hippel, and HughesTa
ble
A3.
Mea
n C
har
acte
rist
ics
of
Faili
ng
ver
sus
No
nfa
ilin
g S
cho
ols
, U
nd
er D
iffe
ren
t C
rite
ria
for
Failu
re
Ach
ieve
men
t,Ki
nder
gart
en
Firs
t-G
rade
12
-Mon
th
End
of F
irst
Gra
deLe
arni
ngLe
arni
ngLe
arni
ngIm
pac
t
Bott
omTo
p F
our
.Bo
ttom
Top
Fou
rBo
ttom
Top
Fou
rBo
ttom
Top
Fou
rBo
ttom
Top
Fou
rC
hara
cter
istic
Qui
ntile
Qui
ntile
sD
iffQ
uint
ileQ
uint
iles
Diff
Qui
ntile
Qui
ntile
sD
iffQ
uint
ileQ
uint
iles
Diff
Qui
ntile
Qui
ntile
sD
iff
Scho
ol S
ecto
r (p
erce
ntag
e of
sch
ools
)Pu
blic
9870
***
8673
*67
78†
6579
*72
77C
atho
lic0
13**
213
*15
914
1014
10O
ther
re
ligio
us2
12*
611
810
1010
611
Secu
lar
priv
ate
05
†5
311
2**
112
**8
3
Scho
ol L
ocat
ion
(per
cent
age
of s
choo
ls)
Urb
an54
35**
5136
*40
3839
3937
39Su
burb
an16
44**
*33
4038
3838
3846
36Ru
ral
3021
1625
2223
2323
1625
Aver
age
Perc
enta
ge
of S
tude
nts
Rece
ivin
g fr
ee
lunc
hes
5222
***
4324
***
2728
2629
2529
Rece
ivin
g re
duce
d-p
rice
lunc
hes
97
*8
7†
77
77
77
Min
ority
7330
***
5933
***
4238
4238
3939
†p<
.10,
*p
< .0
5, *
*p<
.01,
***
p<
.001
.
at UNIV OF OREGON on October 30, 2012soe.sagepub.comDownloaded from
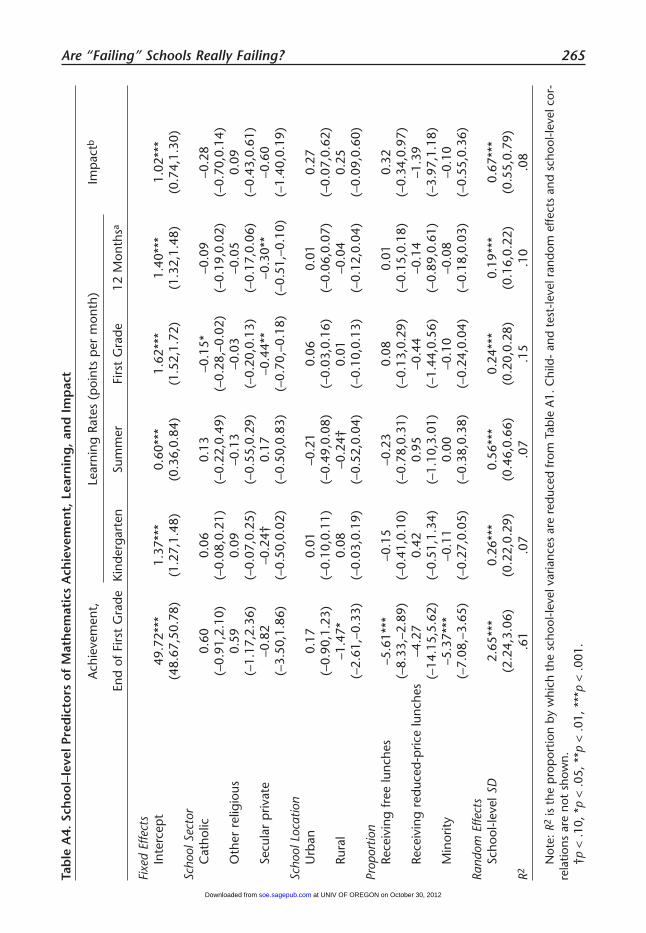
Are “Failing” Schools Really Failing? 265Ta
ble
A4.
Sch
oo
l–le
vel P
red
icto
rs o
f M
ath
emat
ics
Ach
ieve
men
t, L
earn
ing
, an
d I
mp
act
Ach
ieve
men
t,Le
arni
ng R
ates
(p
oint
s p
er m
onth
)Im
pac
tb
End
of F
irst
Gra
deKi
nder
gart
enSu
mm
erFi
rst
Gra
de12
Mon
thsa
Fixe
d Ef
fect
sIn
terc
ept
49.7
2***
1.37
***
0.60
***
1.62
***
1.40
***
1.02
***
(48.
67,5
0.78
)(1
.27,
1.48
)(0
.36,
0.84
)(1
.52,
1.72
)(1
.32,
1.48
)(0
.74,
1.30
)Sc
hool
Sec
tor
Cat
holic
0.60
0.06
0.13
–0.1
5*–0
.09
–0.2
8(–
0.91
,2.1
0)(–
0.08
,0.2
1)(–
0.22
,0.4
9)(–
0.28
,–0.
02)
(–0.
19,0
.02)
(–0.
70,0
.14)
Oth
er r
elig
ious
0.59
0.09
–0.1
3–0
.03
–0.0
50.
09(–
1.17
,2.3
6)(–
0.07
,0.2
5)(–
0.55
,0.2
9)(–
0.20
,0.1
3)(–
0.17
,0.0
6)(–
0.43
,0.6
1)Se
cula
r p
rivat
e–0
.82
–0.2
4†0.
17–0
.44*
*–0
.30*
*–0
.60
(–3.
50,1
.86)
(–0.
50,0
.02)
(–0.
50,0
.83)
(–0.
70,–
0.18
)(–
0.51
,–0.
10)
(–1.
40,0
.19)
Scho
ol L
ocat
ion
Urb
an0.
170.
01–0
.21
0.06
0.01
0.27
(–0.
90,1
.23)
(–0.
10,0
.11)
(–0.
49,0
.08)
(–0.
03,0
.16)
(–0.
06,0
.07)
(–0.
07,0
.62)
Rura
l–1
.47*
0.08
–0.2
4†0.
01–0
.04
0.25
(–2.
61,–
0.33
)(–
0.03
,0.1
9)(–
0.52
,0.0
4)(–
0.10
,0.1
3)(–
0.12
,0.0
4)(–
0.09
,0.6
0)Pr
opor
tion
Rece
ivin
g fr
ee lu
nche
s–5
.61*
**–0
.15
–0.2
30.
080.
010.
32(–
8.33
,–2.
89)
(–0.
41,0
.10)
(–0.
78,0
.31)
(–0.
13,0
.29)
(–0.
15,0
.18)
(–0.
34,0
.97)
Rece
ivin
g re
duce
d-p
rice
lunc
hes
–4.2
70.
420.
95–0
.44
–0.1
4–1
.39
(–14
.15,
5.62
)(–
0.51
,1.3
4)(–
1.10
,3.0
1)(–
1.44
,0.5
6)(–
0.89
,0.6
1)(–
3.97
,1.1
8)M
inor
ity–5
.37*
**–0
.11
0.00
–0.1
0–0
.08
–0.1
0(–
7.08
,–3.
65)
(–0.
27,0
.05)
(–0.
38,0
.38)
(–0.
24,0
.04)
(–0.
18,0
.03)
(–0.
55,0
.36)
Rand
om E
ffect
s Sc
hool
-leve
l SD
2.65
***
0.26
***
0.56
***
0.24
***
0.19
***
0.67
***
(2.2
4,3.
06)
(0.2
2,0.
29)
(0.4
6,0.
66)
(0.2
0,0.
28)
(0.1
6,0.
22)
(0.5
5,0.
79)
R2.6
1.0
7.0
7.1
5.1
0.0
8
Not
e: R
2is
the
pro
por
tion
by w
hich
the
sch
ool-l
evel
var
ianc
es a
re r
educ
ed fr
om T
able
A1.
Chi
ld-
and
test
-leve
l ran
dom
effe
cts
and
scho
ol-le
vel c
or-
rela
tions
are
not
sho
wn.
†p<
.10,
*p
< .0
5, *
*p<
.01,
***
p<
.001
.
at UNIV OF OREGON on October 30, 2012soe.sagepub.comDownloaded from

266 Downey, von Hippel, and Hughes
APPENDIX B
STATISTICAL METHODS
Our basic multilevel growth model estimatesend-of-first-grade achievement levels as wellas learning rates during kindergarten, sum-mer, and the first grade. But transformingthese quantities into impact and 12-monthlearning requires some extra calculation.
More specifically, if ββs = [β0s β1s β2s β3s]T
represents the average end-of-first gradeachievement level and the average kinder-garten, summer, and first-grade learningrates for school s, then the school-level equa-tion is
ββs = γ0+ γ1 Xs + bs (A1),
Where γ0 = [γ00 γ10 γ20 γ30]T is a fixed inter-
cept, γ1 = γ10 γ11 γ12 γ13]T is a fixed matrix of
slopes representing the effects of the schoolcharacteristics in Xs, and bs = [b0s b1s b2s b3s]
T
is a school-level random effect with a mean ofzero and a covariance matrix of ΣΣb. For cer-tain purposes, it will be convenient to workwith vech(ΣΣb), which is a vector containing allthe nonredundant elements of ΣΣb—the lowertriangle of ΣΣb, beginning with the first colum-na (Harville 1997)
Multilevel modeling software (such as theMIXED procedure in SAS) provides point esti-mates γ̂0, γ̂1 and Σ̂b, as well as asymptoticcovariance matrices V(γ̂0), V(γ̂1), andV(vech(Σ̂b)) that represent the uncertainty inthe point estimates. (The diagonal elementsof the asymptotic covariance matrices aresquared standard errors.)
Combining these estimates to obtain esti-mates of 12-month learning and impactrequires some transformation. As we noted inthe text, the impact of school s is β4s = β3s – β2s,or β4s = cimpact ββs, where cimpact =[0 0 -1 1].Likewise, the 12-month learning rate inschool s—the average monthly learning rateover a 12-month period consisting (on aver-age) of 2.4 months of summer followed by9.6 months of first grade—is β5s = 1—
12(2.4 β2s+ 9.6β3s or, in vector form, β5s = c12month βswhere c12month = 1—12 [0 0 2.4 9.6]. So, if we let
C =
I4
c12month
cimpact , where I4 is the 4-by-4
identity matrix, (A2),
then β∗s = C βs = [β0s β1s β2s β3s β4s β5s]T is an
expanded school-level vector that includesimpact and 12-month learning as well asachievement, school-year, and summer learn-ing. The following school-level equation rep-resents how this expanded vector variesacross schools:
β∗s = γ ∗
0 + γ ∗1 Xs + b∗
s (A3),
where γ ∗0 Cγ 0 and γ ∗
1 = Cγ 1 are the fixedintercept and slope, and the random effect b∗
shas a covariance matrix of Σ∗
b =C ΣbCT.Estimated parameters for this expandedequation (A3) can be derived from the esti-mates for the basic equation (A1), as follows:γ̂ 0* = Cγ̂ 0, γ̂ 1* = Cγ̂ 1 and Σ̂b = CΣ̂bCT, orvech(Σ̂∗
b) = Fvech(Σ̂b), where F = H6 (C�C)G4,with G4 a duplication matrix and H6 aninverse duplication matrix.b The asymptoticcovariance matrices for these transformedparameter estimates are V(γ̂ 0*) = CV(γ̂ 0 )CT,V(γ̂ 1*) = CV(γ̂ 1)CT, and V(vech(Σ̂∗
b)) =FV(vech(Σ̂b))FT.c
The final step in our calculations is to con-vert the variances and covariances in Σ∗
b intostandard deviations and correlations, whichare easier to interpret. This is straightforward;a standard deviation σ is just the square rootof the corresponding variance σ2, and there isa simple matrix formula R∗
b=R(Σ∗b) for con-
verting a covariance matrix such as Σ∗b into a
correlation matrix R∗b (Johnson and Wichern,
1997). Again, it will be convenient to workwith vecp(R∗
b), which is a vector containingthe nonredundant elements of R∗
b—the lowertriangle of R∗
b excluding the diagonal, start-ing with the first column (Harville 1997).
Standard errors for the standard deviationsand correlations that result from these calcula-tions can be obtained using the delta rule(e.g., Agresti 2002, Sec. 14.1.3). For example,if V̂(σ̂2) is the squared standard error for the
at UNIV OF OREGON on October 30, 2012soe.sagepub.comDownloaded from

variance estimate σ̂2, then V̂(σ̂) = (dσ̂d—σ̂2)2 V̂(σ̂2) =
1—4σ̂2 V̂(σ̂2) is the squared standard error for thestandard deviation estimate σ̂. Likewise, ifV(vech(Σ̂∗
b)) is the asymptotic covariancematrix of vech(Σ̂∗
b), then
V(vecp(R̂∗b)) =
dvecp(R(Σ̂∗b)) V(vech(Σ̂∗
b)) dvecp(R(Σ̂∗
b))T
dvech(Σ̂∗b) dvech(Σ̂∗
b) (A4)
is the asymptotic covariance matrix ofvecp(Rb*).
aIn SAS software, the vector form of a sym-metric matrix is called SYMSQR and beginswith the first row, rather than the first col-
umn. The elements of SYMSQR(Σb) must berearranged to obtain vech(Σb).
bDuplication and inverse duplication matri-ces are defined in section 16.4b of Harville(1997). The relationship between vech(ΣΣ̂a)and vech(CΣΣ̂aCT) is given, using differentnotation, by formula 4.25 in Chapter 16.Formula 4.25 is restricted to the case where Cis a square matrix; we use a generalizationappropriate to the case where C is not square.We thank David Harville for suggesting thisgeneralization (personal communication,September 27, 2005).
cThese formulas make use of the general for-mula that if the vector X has mean µ and covari-ance matrix Σ, then the vector AX, where A is amatrix, has mean Aµ and covariance matrixAΣAT (Johnson and Wichern 1997:79).
Are “Failing” Schools Really Failing? 267
at UNIV OF OREGON on October 30, 2012soe.sagepub.comDownloaded from

268 Downey, von Hippel, and Hughes
REFERENCES
Agresti, Alan. 2002. Categorical Data Analysis (2nded.). New York: John Wiley.
Allison, Paul D. 2002. Missing Data. ThousandOaks, CA: Sage.
Chatterji, Madhabi. 2002. “Models and Methodsfor Examining Standards-Based Reforms andAccountability Initiatives: Have the Tools ofInquiry Answered Pressing Questions onImproving Schools?” Review of EducationalResearch 72:345–86.
Chubb, John, and Terry Moe. 1990. Politics,Markets, and America’s Schools. Washington,DC: Brookings Institution.
Coleman, James S., Ernest Q. Campbell, Carol J.Hobson, James McPartland, Alexander M.Mood, Frederic D. Weinfeld, and Robert L.York. 1966. Equality of Opportunity.Washington: Government Printing Office.
Downey, Douglas B., Paul T. von Hippel, andBeckett Broh. 2004. “Are Schools the GreatEqualizer? Cognitive Ineqality during theSummer Months and the School Year.”American Sociological Review 69:613–35.
Entwisle, Doris R. and Karl L. Alexander. 1992.“Summer Setback: Race, Poverty, SchoolComposition and Math Achievement in theFirst Two Years of School.” AmericanSociological Review 57:72–84.
—-. 1994. “The Gender Gap in Math: Its PossibleOrigins in Neighborhood Effects.” AmericanSociological Review 59:822–38.
Georgies, Annie. 2003. “Explaining Divergence inRates of Learning and Forgetting Among FirstGraders.” Paper presented at the annualmeeting of the American SociologicalAssociation, Atlanta, GA.
Hart, Betty, and Todd R. Risley. 1995. MeaningfulDifferences in the Everyday Experience of YoungAmerican Children. Baltimore, MD: Paul H.Brookes.
Harville, David. 1997. Matrix Algebra from aStatistician’s Perspective. New York: Springer.
Heyns, Barbara. 1978. Summer Learning and theEffects of Schooling. New York: Academic Press.
Hodson, Randy. 2001. Dignity at Work. New York:Cambridge University Press.
Hofferth, Sandra L., and John F. Sandberg. 2001.“How American Children Spend Their Time.”Journal of Marriage and the Family,63:295–308.
Jencks, Christopher, Marshall Smith, Henry Acland,Mary Jo Bane, David Cohen, Herbert Gintis,Barbara Heyns, and Stephan Michelson. 1972.Inequality: A Reassessment of the Effect of Familyand Schooling in America. New York: Basic Books.
Johnson, Richard A., and Dean W. Wichern.
1997. Applied Multivariate Statistical Analysis(4th ed.). Upper Saddle River, NJ: PrenticeHall.
Kane, Thomas J., and Douglas O. Staiger. 2002.“Volatility in School Test Scores: Implicationsfor Test-Based Accountability Systems.” Pp.235–69 in Brookings Papers on Education Policy,edited by Diane Ravitch. Washington, DC:Brookings Institution.
Kupermintz, Haggai. 2002. “Value-AddedAssessment of Teachers: The EmpiricalEvidence.” Pp. 217–34 in School ReformProposals: The Research Evidence edited by AlexMolnar. Greenwich, CT: Information AgePublishing.
Ladd, Helen. 2002. Market-Based Reforms in UrbanEducation. Washington, DC: Economic PolicyInstitute.
Ladd, Helen F., and Randall P. Walsh. 2002.“Implementing Value-Added Measures ofSchool Effectiveness: Getting the IncentivesRight.” Economics of Education Review 21:1–27.
Lareau, Annette. 2000. Home Advantage: SocialClass and Parental Intervention in ElementaryEducation. Oxford, England: Rowman &Littlefield.
Lee, Valerie E., and David T. Burkam. 2002.Inequality at the Starting Gate: SocialBackground Differences in Achievement asChildren Begin School. Washington, DC:Economic Policy Institute.
Meyer, Robert H. 1996. “Value-Added Indicators ofSchool Performance.” Pp. 197–223 inImproving America’s Schools: The Role ofIncentives, edited by Eric A. Hanushek andDale W. Jorgenson. Washington, DC: NationalAcademy Press.
National Center for Education Statistics. 2003.Early Childhood Longitudinal Survey,Kindergarten Cohort. Washington, DC: Author.
Raudenbush, Stephen W. and Anthony S. Bryk.2002. Hierarchical Linear Models: Applicationsand Data Analysis Methods (2nd ed.).Thousand Oaks, CA: Sage.
Reardon, Sean. 2003. “Sources of EducationalInequality.” Paper presented at the annualmeeting of the American SociologicalAssociation, Atlanta, GA.
Renzulli Linda A., and Vincent J. Roscigno. 2005.“Charter School Policy, Implementation, andDiffusion Across the United States.” Sociologyof Education 78:344–66.
Rock, Donald A., and Judith M. Pollack. 2002. EarlyChildhood Longitudinal Study—KindergartenClass of 1998-99 (ECLS-K), Psychometric Reportfor Kindergarten Through First Grade (NCES200205). Washington, DC: National Centerfor Education Statistics.
at UNIV OF OREGON on October 30, 2012soe.sagepub.comDownloaded from
Are “Failing” Schools Really Failing? 269
Rose, Colin, and Murray D. Smith. 2002.Mathematical Statistics with Mathematica. NewYork: Springer.
Rubenstein, Ross, Leanna Stiefel, Amy Ellen Schwartz,and Hella Bel Hadj Amor. 2004. “DistinguishingGood Schools from Bad in Principle andPractice: A Comparison of Four Methods.” Pp.55–70 in Developments in School Finance: FiscalProceedings from the Annual State DataConference of July 2003 (NCES 2004-325), edit-ed by William J. Fowler, Jr. Washington, DC: U.S.Government Printing office.
Rubin, Donald B. 1987. Multiple Imputation forSurvey Nonresponse. New York: John Wiley.
Ryan, James E. 2004. “The Perverse Incentives ofthe No Child Left Behind Act.” New YorkUniversity Law Review 79:932–89.
Sanders, William L. 1998. “Value-AddedAssessment.” The School Administrator55(11):24–32.
Sanders, William L., and Sandra P. Horn. 1998.“Research Findings from the Tennessee Value-Added Assessment System (TVAAS) Database:Implications for Educational Evaluation andResearch.” Journal of Personnel Evaluation inEducation 12:247–56.
Schafer, Joseph L. 1997. Analysis of IncompleteMultivariate Data. Boca Raton, FL: Chapmanand Hall.
Scheerens, Jaap, and Roel J. Bosker. 1997. TheFoundations of Educational Effectiveness.Oxford, England: Pergamon Press.
Teddlie, Charles, and David Reynolds. 1999. TheInternational Handbook of School EffectivenessResearch: An International Survey of Research onSchool Effectiveness. London: Falmer Press.
Thernstrom, Abigail, and Stephan Thernstrom.
2003. No Excuses: Closing the Racial Gap inLearning. New York: Simon & Schuster.
von Hippel, Paul T. 2004. “School Accountability [acomment on Kane and Staiger (2002)].”Journal of Economic Perspectives, 18, 275–76.
—-. 2007. “Regression with Missing Y’s: AnImproved Strategy for Analyzing MultiplyImputed Data.” Sociological Methodology 37,83–117.
—-. Forthcoming. “Achievement, Learning, andSeasonal Impact as Measures of SchoolEffectiveness: It’s Better to Be Valid thanReliable.” School Effectiveness and SchoolImprovement.
—-. Under review. “Imputing Interactions.”Walberg, Herbert J. 1984. “Families as Partners in
Educational Productivity.” Phi Delta Kappan65:397–400.
Wallberg, Herbert J. and Joseph L. Bast. 2003.Education and Capitalism: How OvercomingOur Fear of Markets and Economics Can ImproveAmerica’s Schools. Stanford, CA: HooverInstitution Press.
West, Jerry, Kristin Denton, and Elvira Germino-Hausken. 2000. America’s Kindergartners:Findings from the Early Childhood LongitudinalStudy, Kindergarten Class of 1998–99 (NCES2000-070). Washington DC: National Centerfor Education Statistics.
Winship, Christopher, and Stephen L. Morgan.1999. “The Estimation of Causal Effects fromObservational Data.” Annual Review ofSociology 25:659–707.
Douglas B. Downey, Ph.D., is Professor, Department of Sociology, The Ohio State University. Hismain fields of interest are stratification, race/ethnicity, and education. Dr. Downey is currentlyexploring when and why the black/white gap in cognitive skills emerges among young children(with Benjamin Gibbs) and is using seasonal comparisons to articulate how schooling influencessocial problems in the United States (with Paul T. von Hippel).
Paul T. von Hippel, Ph.D., is a doctoral candidate in sociology at the Ohio State University and asenior fraud analyst in the banking industry. His recent publications include a study of how schoolsrestrain weight gain in early childhood (American Journal of Public Health, 2007, with BrianPowell, Douglas B. Downey, and Nicholas Rowland) and an article on how to do regression whensome values of the dependent variable are missing (Sociological Methodology, 2007). One of hisforthcoming articles (in School Effectiveness and School Improvement) explores the validity andreliability of the impact measure developed in this article.
Melanie M. Hughes, Ph.D., is Assistant Professor, Department of Sociology, University ofPittsburgh. Her main fields of interest are political sociology, gender, and stratification. Dr. Hughesis currently studying variation in the election of minority women around the world. In other pro-
at UNIV OF OREGON on October 30, 2012soe.sagepub.comDownloaded from

270 Downey, von Hippel, and Hughes
jects, she is examining the global spread of women’s international nongovernmental organizations(with Pamela Paxton) and analyzing how wars affect women’s political outcomes in Africa (with AiliTripp).
This project was funded by grants from the NICHD (R03 HD043917-01), the Spencer Foundation(to Downey and von Hippel), the John Glenn Institute (to Downey), and the Ohio State P-12 Project(to Downey). The contributions of the first two authors are equal. We appreciate the comments ofBeckett Broh, Donna Bobbitt-Zeher, Benjamin Gibbs, and Brian Powell. Direct all correspondence toDouglas B. Downey, Department of Sociology, The Ohio State University, 300 Bricker Hall, 190North Oval Mall, Columbus, OH 43210; e-mail: [email protected].
at UNIV OF OREGON on October 30, 2012soe.sagepub.comDownloaded from