socioeconomic impact assessment of china s co emissions
TRANSCRIPT
1
Socioeconomic impact assessment of China’s CO2 emissions
peak prior to 2030
Zhifu Mi1,2, Yi-Ming Wei1,3,*, Bing Wang1,4, Jing Meng5, Zhu Liu6, Yuli Shan2, Jingru Liu7, Dabo
Guan1,2,*
1 Center for Energy and Environmental Policy Research, Beijing Institute of Technology, Beijing
100081, China
2 Tyndall Centre for Climate Change Research, School of International Development, University
of East Anglia, Norwich NR4 7TJ, UK
3 School of Management and Economics, Beijing Institute of Technology, Beijing 100081, China
4 College of Resources and Safety Engineering, China University of Mining and Technology
(Beijing), Beijing 100083, China
5 School of Environmental Sciences, University of East Anglia, Norwich NR4 7TJ, UK
6 Applied Physics and Materials Science, California Institute of Technology Resnick Sustainability
Institute, Pasadena CA 91125, USA
7 State Key Laboratory of Urban and Regional Ecology, Research Center for Eco-Environmental
Sciences, Chinese Academy of Sciences, Beijing 100085, China
Abstract: China is the largest emitter of carbon emissions in the world. In this paper,
we present an Integrated Model of Economy and Climate (IMEC), an optimization
model based on the input-output model. The model is designed to assess the tradeoff
between emission deceleration and economic growth. Given that China’s projected
average growth rate will exceed 5% over the next two decades, we find that China may
reach its peak CO2 emissions levels by 2026. According to this scenario, China’s carbon
emissions will peak at 11.20 Gt in 2026 and will then decline to 10.84 Gt in 2030.
Accordingly, approximately 22 Gt of CO2 will be removed from 2015 to 2035 relative
to the scenario wherein China’s CO2 emissions peak in 2030. While this earlier peaking
of carbon emissions will result in a decline in China’s GDP, several sectors, such as
Machinery and Education, will benefit. In order to reach peak CO2 emissions by 2026,
China needs to reduce its annual GDP growth rate to less than 4.5% by 2030 and
decrease energy and carbon intensity levels by 43% and 45%, respectively, from 2015
to 2030.
Keywords: Carbon emissions, peak, input-output, optimization model, integrated
assessment model, China
* Corresponding authors.
E-mail address: [email protected] (Y-M Wei), [email protected] (D Guan).

2
1. Introduction
In the “U.S.–China Joint Announcement on Climate Change” released in 2014,
China announced that its carbon dioxide (CO2) emissions will peak by 2030. China’s
CO2 emissions through 2030 will have strong implications for the challenge of limiting
temperature changes caused by anthropogenic greenhouse gas (GHG) emissions to less
than 2 °C from pre-industrial levels. According to the Intergovernmental Panel on
Climate Change’s (IPCC) Fifth Assessment Report, the 2 °C target is likely to be
achieved if atmospheric concentrations are controlled to 450 parts per million (ppm)
carbon dioxide equivalent (CO2eq) through 2100. To accomplish this, global GHG
emissions need to be reduced to 30–50 GtCO2eq by 2030 (IPCC, 2014). However,
China’s CO2 emissions from fuel combustion were 8.5 Gt in 2013, accounting for a
quarter of global emissions (Liu et al., 2016; Liu et al., 2015b; Yuan et al., 2016). In
fact, China’s carbon emissions have shown exponential growth over the past several
decades and accounted for more than half of the increase in global CO2 emissions from
1990 to 2012 (Feng et al., 2013). If China does not take measures to control GHG
emissions, its CO2 emissions may reach as high as 18 Gt by 2030 (Guan et al., 2008;
Tol, 2013), in which case the global 2 °C target would be unlikely to be achieved.
However, China can significantly reduce its carbon emissions if it takes measures to
achieve peak CO2 emissions levels by 2030. In this paper, we assess potential
socioeconomic impacts of China’s CO2 emissions if they reach peak levels prior to 2030.
Over the past decade, numerous institutions and researchers have attempted to
predict the year during which China’s CO2 emissions will peak. The most common
tools used are environmental Kuznets curve (EKC) theory (Chang, 2015; Diao et al.,
2009; Richmond and Kaufmann, 2006), scenario analysis (He et al., 2012; Liu et al.,

3
2015a; Zhang et al., 2016), and the IPAT model (He, 2013; Sadorsky, 2014; Yuan et al.,
2014). Based on these different methods, researchers usually get different results on the
peaking time of China’s CO2 emissions. Zhang et al. (2014) used scenario analysis to
research the role of technologies in CO2 mitigation in China. They found that China’s
CO2 emissions would peak by 2020 in a global carbon tax regime. He et al. (2012)
proposed that China should peak its CO2 emissions around 2030 and realize a sharp
emissions mitigation by 2050. Hao and Wei (2015) used Green Solow model (GSM) to
forecast the turning point in China’s CO2 emissions. The results showed that China’s
CO2 emissions would peak around 2047.
However, these methods can only determine when China’s CO2 emissions will
peak; they do not denote how such levels may be achieved. Therefore, we develop the
Integrated Model of Economy and Climate (IMEC) based on the input-output model.
In this paper, we use the IMEC model to explore whether China’s CO2 emissions will
peak before 2030 and whether China will incur social costs as a result of achieving this
goal.
The input-output model has been extensively used in analyses of CO2 emissions
(Mi et al., 2015a; Mi et al., 2016). Some researchers have used the input-output model
to assess drivers of carbon emissions. The model is typically integrated with the
structural decomposition analysis (SDA) to support the examination of emissions
drivers and contributions. These drivers include gross domestic product (GDP) growth,
energy efficiency, carbon efficiency, production structure, consumption structure, and
population (Minx et al., 2009). China’s carbon emission drivers have been quantified

4
using this method (Su and Ang, 2012; Wei et al., 2016). Guan et al. (2008) used the
input-output model to analyze drivers of Chinese CO2 emissions and to forecast
resulting carbon emissions. Their results showed that China’s production-related CO2
emissions would increase threefold by 2030.
Some scholars have used the multi-region input-output (MRIO) model to calculate
consumption-based CO2 emissions and to analyze emissions embodied in interregional
or international trade (Su and Ang, 2011; Weber and Matthews, 2007; Wiedmann,
2009). Carbon emissions embodied in international trade have increased considerably
over the last several decades; these emissions are exported from China and other
emerging markets to developed countries. For example, Peters and Hertwich (2008)
found that over 5.3 Gt of CO2 were embodied in international trade in 2001. Davis and
Caldeira (2010) showed that approximately 6.2 Gt of CO2 emissions were traded
internationally in 2004 (23% of global emissions). Peters et al. (2011) showed that
carbon emissions embodied in international trade increased to 7.8 Gt of CO2 in 2008
(26% of global emissions). Carbon leakage may also occur within a country’s borders,
and especially among countries exhibiting imbalanced regional development. Feng et
al. (2013) tracked CO2 emissions embodied in trade between Chinese provinces and
internationally. Their results showed that 80% of carbon emissions embodied in goods
consumed in highly developed coastal regions were imported from less developed
Chines provinces.
2. Methodology and data
We develop an Integrated Model of Economy and Climate (IMEC), an

5
optimization model based on the input-output model. We use the IMEC to examine
socioeconomic impacts of peak Chinese emissions.
2.1 Basic linear equations of the input-output model
The input-output (IO) model is an analytical framework that was developed by
Wassily Leontief in the late 1930s (Leontief, 1936). The main purpose of the input-
output model is to establish a tessellated input-output table and a system of linear
equations. The basic linear equations of this system are as follows:
t tI A X Y , (1)
c t tI A X V , (2)
where (suppose there are n sectors in the economy) tX is the total output vector for
year t with n dimensions where jtx is the output of sector j, tY is the final demand
vector for year t with n dimensions where jty is the final demand of sector j (final
demand includes consumption, capital formation and net export), tV is the added
value vector for year t with n dimensions where jtv is the added value of sector j ( tV
is the decision variable of the model), I is the n n dimension identity matrix, and A
is the direct requirement matrix with n n dimensions where ija denotes direct
requirements of sector i per unit of sector j output. ija is obtained from
, 1,2,...,ij
ij
j
xa i j n
x , (3)
Where ijx is the monetary value from sector i to sector j. cA is obtained from
1 2
1 1 1
diag , ,...,n n n
c i i in
i i i
A a a a
, (4)
where diag is the diagonal matrix.

6
2.2 Setting socioeconomic constraints
2.2.1 Economic growth constraints
Climate policies may have negative impacts on social stability levels, economic
development, and residential living (Guan and Hubacek, 2010). The GDP growth rate
is one of the most important socio-economic indicators. Therefore, we show that the
GDP growth rate is not less than t in year t.
1
n
t it
i
G v
, (5)
11t t tG G , (6)
where tG is the GDP for year t, itv is the added value of sector i for year t, and t
is the exogenous parameter.
2.2.2 Energy consumption constraints
Energy resources from the material basis of social development. However, supply
is limited in most areas, and fossil energy combustion constitutes one of the main
sources of GHG emissions. Therefore, the control of energy consumption and the
promotion of non-fossil energy are essential to achieving peak carbon emissions (Ang
and Pandiyan, 1997; Apergis and Payne, 2014). Therefore, it is understood that growth
rates of total energy consumption are not greater than it during year t.
1 1 1
n m mh
t ikt it kt
i k k
E b v E
, (7)
1 11t t tE E , (8)
where tE is the total level of energy consumption in year t, iktb denotes energy
consumption k per unit of added value in sector i during year t (k=1, 2, 3, and 4 refer to
coal, oil, natural gas, and non-fossil energy, respectively), h
ktE denotes household

7
energy consumption k for year t, and 1t is the exogenous parameter.
Carbon emissions can be effectively reduced by substituting renewable energy for
fossil fuels (Cong, 2013; Cong and Shen, 2014). China ascribes great importance to the
development of non-fossil energy sources, with its proportion in 2013 accounting for
9.8%. China intends to increase its share of non-fossil fuels to 15% by 2020 and to 20%
by 2030 (Mi et al., 2015b; The White House, 2014).
20302
2030
rE
E , (9)
20203
2020
rE
E , (10)
where r
tE denotes non-fossil energy consumption in year t and where 2 and 3
are exogenous parameters.
2.2.3 Emission peak constraints
To achieve peak CO2 emissions, emission growth rates need to be controlled and
must become negative following a carbon emissions peak. Therefore, it is crucial that
carbon emission growth rates do not exceed 1t during year t and that 1 0t after a
carbon emissions peak.
1 1
n mh
t ik ikt i it t
i k
C d E s v C
, (11)
1 11t t tC C , (12)
1 0, if t t t , (13)
where tC denotes CO2 emissions for year t, ikd denotes CO2 emissions per unit of
energy consumption k in sector i, iktE denotes energy consumption k in sector i during
year t, is denotes non-energy related CO2 emissions per unit of added value in sector
8
i, h
tC denotes household CO2 emissions for year t, t denotes the year of the carbon
emissions peak, and 1t is an exogenous parameter. In addition, China plans to
decrease CO2 emissions per unit of GDP from 2005 levels by 40–45% and 60–65% by
2020 and 2030, respectively.
2020 20052
2020 2005
1C C
G G , (14)
2030 20053
2030 2005
1C C
G G , (15)
where 2 and 3 are exogenous parameters.
2.2.4 Employment constraints
Employment is one of the most important issues related to macroeconomic
planning. To control the unemployment rate, the growth rate of employment
opportunities must not fall below the population growth rate.
1
n
t i it
i
P q v
, (16)
1 1
1 1
t t t t
t t
P P L L
P L
, (17)
where tP denotes employment opportunities for year t, iq denotes employment
opportunities per unit of added value in sector i, and tL denotes the population in year
t.
2.2.5 Industrial structure change constraints
Each industry performs irreplaceable functions in an economic system, and
industrial structures cannot be adjusted freely over a period of time (Mi et al., 2015a).
Therefore, the lower and upper bounds of proportions of sectoral added value in GDP
are constrained in the model.

9
, 1
1
1i tit
it
t t
vv
G G
, (18)
, 1
1
1i tit
it
t t
vv
G G
, (19)
where itv denotes the added value of sector i in year t, tG denotes the GDP for year
t, and it and it are exogenous parameters. Proportions of sectoral value in GDP
are used as control variables in this model.
2.2.6 Consumption and investment constraints
Final demand consists of consumption, capital formation, and net export:
it it it ity q f o , (20)
where ity , itq , itf and ito denote final demand, consumption, capital formation,
and net exports for year t, respectively. For each sector, wherein proportions of
consumption, capital formation, and net export are assumed to be constant:
0
0
1,2,...,it i
it i
q qi n
y y , (21)
0
0
1,2,...,it i
it i
f fi n
y y , (22)
0
0
1,2,...,it i
it i
o oi n
y y , (23)
where 0iy , 0iq , 0if and 0io denote final demand, consumption, capital formation,
and net exports for the base year, respectively. The lower and upper bounds of
consumption rates are constrained in the model:
1
n
t it
i
Q q
, (24)

10
1
t
t
Q
G , (25)
2
t
t
Q
G , (26)
where tQ denotes consumption in year t, and 1 and 2 are exogenous parameters.
2.3 Setting objective functions
Objective functions are key elements in optimization models. Typically, various
modelers choose different objective functions (Daly et al., 2015; Humpenöder et al.,
2015). Objectives of the climate change integrated assessment model (IAM) can be
divided into welfare maximization and cost minimization goals (Wei et al., 2015; Wei
et al., 2013; Yang et al., 2016). The IMEC uses the former and maximizes the sum of
present values of intertemporal national welfare. We define individual welfare as the
logarithm of per capita consumption, which has been widely used in modern theories
of optimal economic growth (Cass, 1965; Ramsey, 1928). Therefore, the objective
function is:
11
1Max log
1
Tt
t tt t
QL
L
, (27)
where is the pure rate of time preference, T is the number of years, tL is the
population in year t, and tQ denotes consumption in year t.
2.4 Data sources
The data used in this study were primarily obtained from the World Input–Output
Database (WIOD) (Timmer et al., 2015). More specifically, the Chinese input-output
table used was drawn from WIOD National Input-Output Tables, energy and carbon
emissions data were drawn from WIOD Environmental Accounts, and employment

11
dates and price levels of added value were drawn from WIOD Socio Economic
Accounts. In addition, population data were drawn from United Nations World
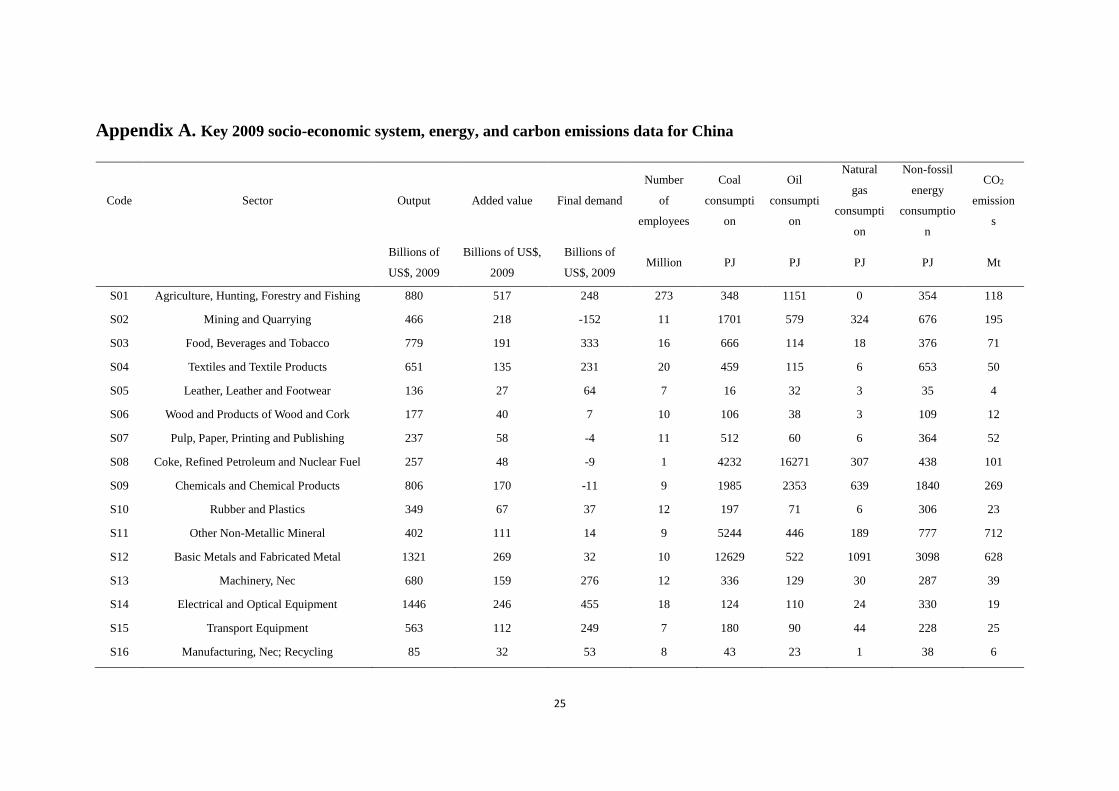
population prospects: the 2012 revision (United Nations, 2013). Key 2009 data for
China are shown in the Appendix A.
3. Scenario design
3.1 Economic growth
China’s economy has enjoyed rapid growth. The average annual GDP growth rate
has been 9.5% over the past two decades. In addition, China’s annual GDP growth rate
has shown a clear downward trend. The country’s GDP growth rate increased from 1998
to 2007, peaking at 14.2% in 2007. It then decreased to 7.4% in 2014. It is very likely
that China’s GDP growth will continue to decrease over the next two decades. The
lower bound of the country’s GDP growth rate is currently 7% (2015) and will decrease
by 0.2% each year until 2035. As a result, the lower bound of the average annual GDP
growth rate will remain at approximately 5% from 2015 to 2035.
3.2 Energy consumption and fuel mix
Coinciding with its rapidly growing economy, China’s energy consumption has
also increased dramatically (Timmer et al., 2015). The growth rate peaked at 17.5% in
2004 and then decreased each year thereafter. Therefore, the upper bound of energy
consumption growth is 5.9% as of 2015 and will decrease by 0.1% each year until 2035.
China’s non-fossil fuel sectors have developed rapidly; the proportion of non-
fossil fuels used in primary energy consumption increased from 6.1% in 1995 to 9.8%
in 2013. According to China’s Energy Development Strategy Action Plan (2014-2020),
the share of non-fossil fuels is projected to reach 15% by 2020 (State Council, 2014).

12
In the U.S.–China Joint Announcement on Climate Change, China also announces that
it will increase its consumption of non-fossil fuels to 20% by 2030 (The White House,
2014).
3.3 Carbon emission peak
The upper bound of China’s CO2 emissions growth rate is assumed to decline
linearly. The upper bound of its growth rate was 6% in 2010, as the average growth rate
of China’s CO2 emissions was approximately 6% from 1995 to 2009 (Timmer et al.,
2015). As is well known, the CO2 emissions growth rate should be negative following
a carbon emissions peak. If China’s CO2 emissions peak in year , we assume that the
upper growth rate bound will be -0.5% in year . The upper bounds for other years
are calculated using the linear assumption. For instance, if China’s CO2 emissions peak
in 2030, the upper bound of growth rate will be -0.5% in 2031. Thus, the upper bound
of the CO2 emissions growth rate declines by approximately 0.3% per year.
In addition, we examine non-energy-related CO2 emissions for each sector. Non-
energy emissions per unit added value in each sector have not varied significantly over
the past two decades. Therefore, we assume that non-energy CO2 emissions per unit
added value to be equal to 2014 levels until 2035.
3.4 Technological change
In this paper, technological change is denoted as the reduction in energy intensity
levels (energy consumption per unit of added value or GDP) in each sector. All sectors
were divided into two categories when energy intensity levels were set. In the first
category, energy intensity levels have reduced dramatically over the past two decades.
Thus, energy intensity levels are predicted to decline exponentially until 2035. For
example, energy intensity levels of the Education (S31) sector decreased from 8.15
t
1t

13
MJ/US$ in 1995 to 1.47 MJ/US$ in 2014 (Timmer et al., 2015). The R2 value of its
exponential regression is 0.97. According to the exponential assumption, this value will
decline to 0.86 MJ/US$ in 2020 and to 0.35 MJ/US$ in 2030 (Timmer et al., 2015). For
the second category, energy intensity has fluctuated over the past two decades. Thus, it
is assumed that energy intensity levels will be equal to the average value for 1995–2014
until 2035. For example, energy intensity levels of the Air Transport (S24) sector have
fluctuated between 45 and 100 MJ/US$ over the past two decades with an average level
of 66 MJ/US$. Therefore, we assume that this will remain at 66 MJ/US$ until 2035.
3.5 Industrial structure change
The proportions of sectoral added value to GDP are the control variables of the
IMEC model. The proportion of sectoral added value in GDP is assumed to change each
year under upper and lower bound constraints. According to historical data, the upper
bound is 4.5% as of 2015 and will increase by 0.5% each year until 2035. Meanwhile,
the lower bound is -4.5% as of 2015 and will decrease by 0.5% each year until 2035.
4. Results
4.1 The path to China’s carbon peak
There is a tradeoff between GDP growth and carbon emissions reduction. In this
study, the lower bound of the average annual GDP growth rate is predicted to remain at
approximately 5% from 2015 to 2035. Under this constraint, China may experience a
peak in carbon emissions by 2026. From objectives to maximize social welfare, an
optimal pathway is obtained. First, China’s CO2 emissions will peak at 11.20 Gt in 2026
according to this scenario, and cumulative emissions from 2015 to 2035 are estimated
to reach 219.72 Gt (Figure 1). China’s average annual CO2 emissions growth rate was
5.18% from 1995 to 2014, and this value will decrease to 1.33% from 2015 to 2030 if

14
China’s CO2 emissions peak in 2026.
Second, the annual GDP growth rate will decline to less than 4.5% by 2030.
Energy is essential to economic development, and energy combustion serves as one of
the main sources of carbon emissions. Thus, GDP growth has a dramatic effect on CO2
emissions (Peters et al., 2007). China’s economy has experienced rapid development
over the past several decades. The average annual GDP growth rate was approximately
9.5% from 1995 to 2014. However, this GDP growth rate must be reduced in order to
reach peak CO2 emissions by 2026.
Figure 1. Optimal pathways of CO2 emissions and GDP based on a scenario wherein
CO2 emissions peak in 2026. S01–S33 are sector codes; for full names, see Appendix
A.
Third, tertiary industries will increase while secondary industries will decline.
More specifically, according to this scenario, the proportion of tertiary industrial
activities increases from 47.57% in 2014 to 57.46% in 2030 while by contrast, the
proportion of secondary industrial activities declines from 42.67% in 2014 to 34.22%

15
in 2030. In fact, the energy intensity of secondary industrial activities for 2014 is
reported as 42.37 MJ/US$, which is approximately 14 times more than that recorded
for tertiary industrial activities. Therefore, carbon emissions can be effectively
controlled via tertiary industry promotion.
According the sectoral perspective, added value to sectors with relatively low
levels of energy intensity will grow quickly. The following three sectors will have the
highest proportion of added value in GDP in 2030: Wholesale Trade and Commission
Trade (S19), Real Estate Activities (S28), and Financial Intermediation (S27). Their
proportions will be 11.79%, 9.16%, and 8.70% in 2030, respectively, and their average
annual growth rates will exceed 8% from 2015 to 2030. By contrast, added value to
several sectors of relatively high levels of energy intensity will gain smaller proportions
of GDP. These sectors include the following: Pulp, Paper, Printing and Publishing (S07);
Chemicals and Chemical Products (S09); and Mining and Quarrying (S02).
Fourth, China needs to control the total energy consumption and increase the share
of non-fossil energy use in order to achieve peak carbon emissions by 2026. Energy
consumption and carbon emissions levels are directly related, and thus a carbon peak
will constrain growth in energy use. The average annual growth rate of Chinese energy
consumption was 5.87% from 1995 to 2014, and this value will be reduced to 1.46%
from 2015 to 2030 if China’s CO2 emissions peak in 2026.
Fifth, China’s energy intensity and carbon intensity levels will decline dramatically.
China’s GDP will grow by more than 110%, and its energy consumption and CO2
emission levels will increase by 24% and 22%, respectively. As a result, energy and
carbon intensity levels will decline by 43% and 45%, respectively (Figure 2).

16
Figure 2. China’s energy and carbon intensity levels will decline dramatically. Levels
for 2010 are set to 1 for all indicators.
According to the sectoral perspective, most sectoral energy and carbon intensity
levels will also decline (Figure 3). Figures 3(a) and 3(b) show energy consumption
levels of each sector for 2014 and 2030, respectively. The horizontal axis shows the
accumulated value added, and the vertical axis presents energy intensity levels. The
total area refers to the consumption of different forms of energy. It is evident that
sectoral energy intensity levels will decline considerably. In addition, the share of coal
in total energy consumption will decline, as the red area of 2030 is much smaller than
that of 2014. Figures 3(c) and 3(d) show carbon emissions of each sector for 2014 and
2030, respectively. Sectoral energy intensity levels will also decline considerably. Non-
energy related emissions are primarily derived from the production of Basic Metals and
Fabricated Metals (S12) and Other Non-Metallic Minerals (S11).

17
Figure 3. Energy and carbon intensity levels in most sectors will decline. (Note: Energy consumption levels for S08 and S17 are not shown, as
energy intensity levels in these sectors are much higher than those of other sectors. In addition, carbon emissions for S11, S17 and S24 are not
shown, as carbon intensity levels in these sectors are much higher than those of other sectors.)

18
4.2 Socioeconomic impacts of an earlier Chinese carbon emissions peak
CO2 emission peaks constrain national economic growth and energy consumption,
thus affecting socio-economic systems. We assess optimal pathways whereby CO2
emissions peak in different years from 2026 to 2030. Figure 4 compares carbon
emissions and GDP levels under different scenarios. The scenario wherein CO2
emissions peak in 2030 is designated as a business as usual (BAU) case.
Figure 4. If China’s CO2 emissions peak in 2026, approximately 22 Gt of CO2 will be
removed from 2015 to 2035 relative to the scenario wherein China’s CO2 emissions
peak in 2030.
As shown in Figure 4a, China’s carbon emissions will peak at 12.59 Gt in 2030
under the BAU. According to the IPCC’s Fifth Assessment Report, Global GHG
19
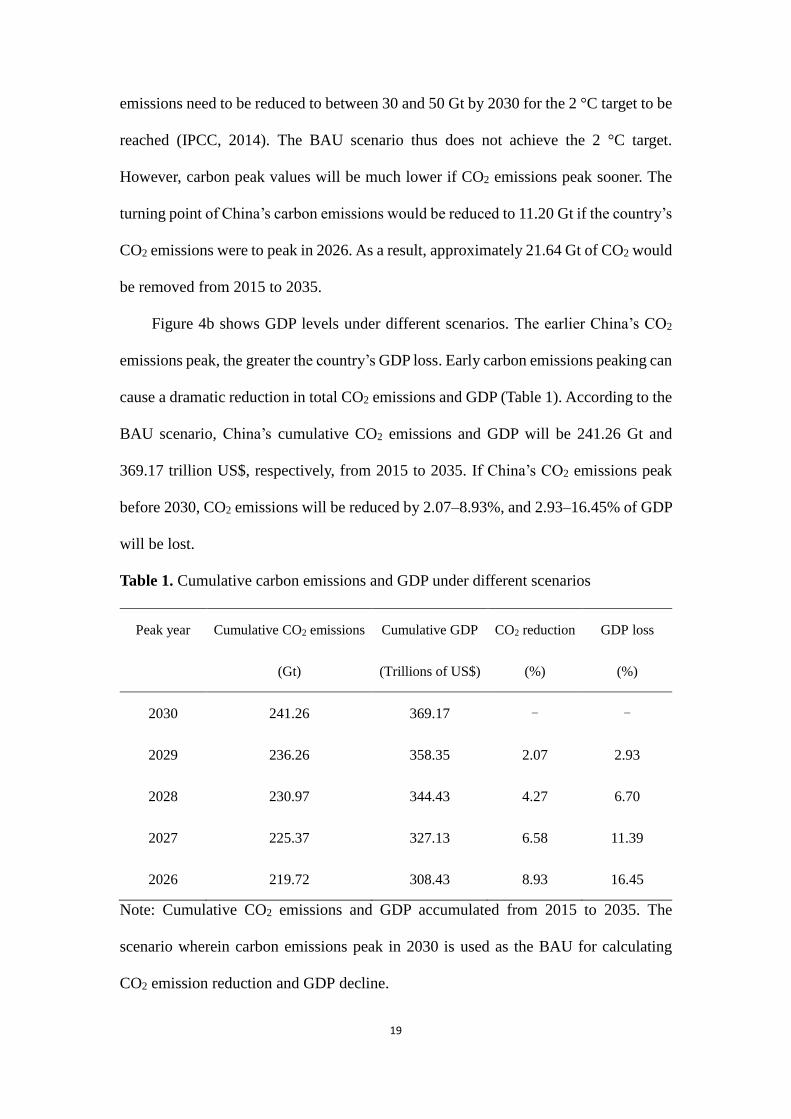
emissions need to be reduced to between 30 and 50 Gt by 2030 for the 2 °C target to be
reached (IPCC, 2014). The BAU scenario thus does not achieve the 2 °C target.
However, carbon peak values will be much lower if CO2 emissions peak sooner. The
turning point of China’s carbon emissions would be reduced to 11.20 Gt if the country’s
CO2 emissions were to peak in 2026. As a result, approximately 21.64 Gt of CO2 would
be removed from 2015 to 2035.
Figure 4b shows GDP levels under different scenarios. The earlier China’s CO2
emissions peak, the greater the country’s GDP loss. Early carbon emissions peaking can
cause a dramatic reduction in total CO2 emissions and GDP (Table 1). According to the
BAU scenario, China’s cumulative CO2 emissions and GDP will be 241.26 Gt and
369.17 trillion US$, respectively, from 2015 to 2035. If China’s CO2 emissions peak
before 2030, CO2 emissions will be reduced by 2.07–8.93%, and 2.93–16.45% of GDP
will be lost.
Table 1. Cumulative carbon emissions and GDP under different scenarios
Peak year Cumulative CO2 emissions Cumulative GDP CO2 reduction GDP loss
(Gt) (Trillions of US$) (%) (%)
2030 241.26 369.17 - -
2029 236.26 358.35 2.07 2.93
2028 230.97 344.43 4.27 6.70
2027 225.37 327.13 6.58 11.39
2026 219.72 308.43 8.93 16.45
Note: Cumulative CO2 emissions and GDP accumulated from 2015 to 2035. The
scenario wherein carbon emissions peak in 2030 is used as the BAU for calculating
CO2 emission reduction and GDP decline.

20
Earlier carbon emissions peaking will benefit several sectors. Relative to the BAU
scenario, the added value to most sectors will be reduced if China’s carbon emissions
peak in 2026. The added value to the Food, Beverages and Tobacco (S03); Pulp, Paper,
Printing and Publishing (S07); and Retail Trade and Repair of Household Goods (S20)
industries would decline by approximately 60%. However, several sectors would
benefit from an earlier carbon emissions peak, as added value to the Machinery, not
elsewhere classified (S13); Renting of Machinery and Equipment and Other Business
Activities (S29); and Education (S31) sectors would grow by 106%, 56%, and 29%,
respectively.
4.3 Uncertainty analysis
Uncertainty exists in the input-output modeling method. The optimization model
used in this study is based on the static input-output model. Thus, interdependencies
between different sectors of China’s economy are held constant. For a discussion of
input-output model uncertainty, see Wiedmann (2009) and Peters et al. (2007). The
dynamic input-output model, which reflects inter-sectoral balancing over time, can be
used to deal with this uncertainty in future work.
In addition to the uncertainty in methodology, the assumptions in the scenario
design are also controversial. For example, we assume that China’s average annual
GDP growth rate will exceed 5% from 2015 to 2035. This assumption is based on
China’s current economic situation and government planning, which affect the results.
If the lower bound of GDP growth is reduced, China may reach peak CO2 emissions
sooner. The sensitivity analysis is carried out on the exogenous parameters, such as
lower bound of GDP growth, upper bound of energy consumption, upper bound of
carbon emission, technological change, and population. The Figure 5(a) and 5(b) show

21
the impacts on GDP and CO2, respectively, when the exogenous parameters change by
5% or -5%. The most sensitive assumption is technological change, while population
does not have impacts on the results.
Figure 5. Impacts on GDP and CO2 of exogenous parameters.
Finally, data uncertainty may be significant. Several authors have questioned
Chinese energy and carbon data (Guan et al., 2012; Liu et al., 2015b). Liu et al. (2015b)
revealed that energy consumption in China was underestimated by the Chinese national
statistics while its carbon emission was overestimated by IPCC and other reports. In
addition, we mainly use energy and economic data of WIOD and design scenarios based
on the Chinese government planning and data from Chinese national statistics. The gap

22
between WIOD data and Chinese national statistics may also affect the results.
5. Conclusions
Currently, China emits approximately 25% of global CO2 emissions. With the
dramatic growth in China’s carbon emissions, this percentage is on the rise. Thus,
China’s carbon emissions plan will have strong implications for global mitigation.
China has promised to peak its carbon emissions by 2030, but this target will not
achieve the 2 °C target. We find that China may peak its CO2 emissions by 2026 if its
average annual GDP growth rate exceeds 5% from 2015 to 2035. According to this
scenario, China’s carbon emissions will peak at 11.20 Gt in 2026 and will drop to 10.84
Gt in 2030. Accordingly, approximately 22 Gt of CO2 will be removed from 2015 to
2035.
An earlier carbon emissions peak would benefit several sectors. If China’s carbon
emissions were to peak in 2026, its cumulative GDP would be reduced by 16.45%, and
this would in turn reduce the added value to most sectors. However, several sectors
would benefit from an earlier carbon emissions peak (e.g., Machinery and Education).
Based on the results of this study, we present several suggestions on ways in which
China may peak its CO2 emissions prior to 2030. First, China needs to set total carbon
emissions targets. The Chinese government has announced a reduction in carbon
intensity from 2005 levels of 40–45% by 2020 and by 60–65% by 2030. These are both
emission-intensity targets. Two main approaches are used to lower carbon intensity
levels: reducing carbon emissions and increasing GDP. Most regions in China prefer
the latter, as economic development constitutes one of the most important criteria used
to promote provincial and local leaders. Therefore, Chinese government should set up
a balanced policy, which considers the economic development, environmental
protection and social cohension (Cong and Brady, 2012). We find that China must

23
reduce its GDP growth rate to less than 4.5% by 2030 in order to achieve peak CO2
emissions by 2026.
Second, China needs to update its industrial structure. Over the past few decades,
China’s economic growth has been based on the development of heavy industry and
manufacturing. China has become a 'factory to the world' owing to its access to low-
cost labor, land, and resources. In 2014, the energy intensity of China’s secondary
industry was approximately 15 times that of its tertiary industry. Therefore, carbon
emissions can be effectively controlled through tertiary industry promotion. China
needs to develop low-carbon industries (e.g., Wholesale and Commission Trade, Real
Estate Activities, and Financial Intermediation).
Third, total energy consumption levels, and coal consumption levels in particular,
must be reduced. China has set targets to lower total primary energy consumption to
under 4.8 billion tons of standard coal equivalent and to reduce the proportion of coal
consumption to under 62% by 2020. These targets will not allow China to achieve peak
carbon emissions by 2026. Our results show that China needs to control total energy
consumption more strictly in order to achieve peak carbon emissions by 2026.
Fourth, technological change will play a critical role in China’s achievement of
peak carbon emissions prior to 2030. Technological change constitutes one of the most
important drivers of CO2 emissions reduction (Guan et al., 2008). This paper shows that
China’s energy and carbon intensity levels will decline by 43% and 45%, respectively,
if its CO2 emissions peak in 2026.
However, this paper has limitations. First, there are uncertainties in exogenous
parameters. The sensitivity analysis is carried out on key exogenous parameters, such
as lower bound of GDP growth, upper bound of energy consumption, upper bound of
carbon emission, technological change, and population. Recently, many researchers
24
have proposed to include endogenous technological change in models. For example,
Acemoglu et al. (2012) introduced endogenous and directed technological change in a
growth model with environmental constraints. Second, the interactions between
production sectors and final demand are not taken into considerations. Computable
general equilibrium (CGE) model is a potential method to solve this issue. Classical
CGE model will be considered to research the future pathways of China’s CO2
emissions. Third, technological breakthroughs (e.g., carbon capture and storage (CCS))
are not considered in this paper. CCS has great potential to reduce CO2 emissions, as
new technologies can substantially reduce its costs (Yu et al., 2016). We thus plan to
analyze more scenarios that consider new technological breakthroughs.
Acknowledgements
This work was supported by National Key R&D Program of China [No.
2016YFA0602603, 2016YFA0602604], National Natural Science Foundation of China
[No. 71603248, 71521002, 71020107026, 71573013 and 41328008], the UK Economic
and Social Research Council [No. ES/L016028/1], Natural Environment Research
Council [No. NE/N00714X/1] and British Academy Grant [No. AF150310].
25
Appendix A. Key 2009 socio-economic system, energy, and carbon emissions data for China
Code Sector Output Added value Final demand
Number
of
employees
Coal
consumpti
on
Oil
consumpti
on
Natural
gas
consumpti
on
Non-fossil
energy
consumptio
n
CO2
emission
s
Billions of
US$, 2009
Billions of US$,
2009
Billions of
US$, 2009 Million PJ PJ PJ PJ Mt
S01 Agriculture, Hunting, Forestry and Fishing 880 517 248 273 348 1151 0 354 118
S02 Mining and Quarrying 466 218 -152 11 1701 579 324 676 195
S03 Food, Beverages and Tobacco 779 191 333 16 666 114 18 376 71
S04 Textiles and Textile Products 651 135 231 20 459 115 6 653 50
S05 Leather, Leather and Footwear 136 27 64 7 16 32 3 35 4
S06 Wood and Products of Wood and Cork 177 40 7 10 106 38 3 109 12
S07 Pulp, Paper, Printing and Publishing 237 58 -4 11 512 60 6 364 52
S08 Coke, Refined Petroleum and Nuclear Fuel 257 48 -9 1 4232 16271 307 438 101
S09 Chemicals and Chemical Products 806 170 -11 9 1985 2353 639 1840 269
S10 Rubber and Plastics 349 67 37 12 197 71 6 306 23
S11 Other Non-Metallic Mineral 402 111 14 9 5244 446 189 777 712
S12 Basic Metals and Fabricated Metal 1321 269 32 10 12629 522 1091 3098 628
S13 Machinery, Nec 680 159 276 12 336 129 30 287 39
S14 Electrical and Optical Equipment 1446 246 455 18 124 110 24 330 19
S15 Transport Equipment 563 112 249 7 180 90 44 228 25
S16 Manufacturing, Nec; Recycling 85 32 53 8 43 23 1 38 6

26
S17 Electricity, Gas and Water Supply 482 138 21 4 35277 295 683 5617 3326
S18 Construction 1417 330 1371 79 189 1285 5 159 71
S19 Wholesale Trade and Commission Trade 585 352 235 18 30 67 1 209 8
S20 Retail Trade; Repair of Household Goods 121 73 49 48 6 87 0 44 7
S21 Hotels and Restaurants 277 105 97 23 29 68 251 168 22
S22 Inland Transport 270 140 36 19 133 1140 16 120 98
S23 Water Transport 109 49 32 2 0 1313 0 0 100
S24 Air Transport 44 11 10 1 0 1093 0 0 78
S25 Other Supporting and Auxiliary Transport
Activities; Activities of Travel Agencies 111 43 17 3 23 382 2 7 31
S26 Post and Telecommunications 210 125 80 9 3 73 0 108 6
S27 Financial Intermediation 376 260 77 5 0 42 0 71 3
S28 Real Estate Activities 328 273 237 2 6 45 0 31 4
S29 Renting of Machinery and Equipment and
Other Business Activities 454 186 70 4 107 175 45 128 26
S30 Public Admin and Defence; Compulsory
Social Security 342 188 327 16 142 144 29 124 26
S31 Education 283 159 237 23 124 97 1 199 19
S32 Health and Social Work 241 83 206 8 189 33 16 97 23
S33 Other Community, Social and Personal
Services 266 120 107 109 123 273 39 78 39
Final household consumption expenditures – – – – 1931 3592 751 10920 482
Grand total 15150 5033 5033 809 67090 32308 4530 27992 6696
Note: PJ denotes 1015 joules, and Mt denotes 106 tons.

27
References
Acemoglu, D., Aghion, P., Bursztyn, L., Hemous, D., 2012. The environment and
directed technical change. Am. Econ. Rev. 102, 131-166.
Ang, B.W., Pandiyan, G., 1997. Decomposition of energy-induced CO2 emissions in
manufacturing. Energ. Econ. 19, 363-374.
Apergis, N., Payne, J.E., 2014. Renewable energy, output, CO2 emissions, and fossil
fuel prices in Central America: Evidence from a nonlinear panel smooth transition
vector error correction model. Energ. Econ. 42, 226-232.
Cass, D., 1965. Optimum growth in an aggregative model of capital accumulation. Rev.
Econ. Stud. 32, 233-240.
Chang, M.-C., 2015. Room for improvement in low carbon economies of G7 and
BRICS countries based on the analysis of energy efficiency and environmental Kuznets
curves. J. Clean. Prod. 99, 140-151.
Cong, R.-G., 2013. An optimization model for renewable energy generation and its
application in China: A perspective of maximum utilization. Renew. Sustain. Energy
Rev. 17, 94-103.
Cong, R.-G., Brady, M., 2012. How to design a targeted agricultural subsidy system:
efficiency or equity? PloS one 7, e41225.
Cong, R.-G., Shen, S., 2014. How to Develop Renewable Power in China? A Cost-
Effective Perspective. Sci. World J. 2014, 7.
Daly, H.E., Scott, K., Strachan, N., Barrett, J., 2015. Indirect CO2 emission implications
of energy system pathways: Linking IO and TIMES models for the UK. Environ. Sci.

28
Technol. 49, 10701-10709.
Davis, S.J., Caldeira, K., 2010. Consumption-based accounting of CO2 emissions. P.
Natl. Acad. Sci. U.S.A. 107, 5687-5692.
Diao, X.D., Zeng, S.X., Tam, C.M., Tam, V.W.Y., 2009. EKC analysis for studying
economic growth and environmental quality: a case study in China. J. Clean. Prod. 17,
541-548.
Feng, K., Davis, S.J., Sun, L., Li, X., Guan, D., Liu, W., Liu, Z., Hubacek, K., 2013.
Outsourcing CO2 within China. P. Natl. Acad. Sci. U.S.A. 110, 11654-11659.
Guan, D., Hubacek, K., 2010. China can offer domestic emission cap-and-trade in post
2012. Environ. Sci. Technol. 44, 5327-5327.
Guan, D., Hubacek, K., Weber, C.L., Peters, G.P., Reiner, D.M., 2008. The drivers of
Chinese CO2 emissions from 1980 to 2030. Global Environ. Chang. 18, 626-634.
Guan, D., Liu, Z., Geng, Y., Lindner, S., Hubacek, K., 2012. The gigatonne gap in
China's carbon dioxide inventories. Nature Clim. Change 2, 672-675.
Hao, Y., Wei, Y.-M., 2015. When does the turning point in China's CO2 emissions occur?
Results based on the Green Solow model. Environ. Dev. Econ. 20, 723-745.
He, J.-k., 2013. Analysis of CO2 emissions peak: China's objective and strategy. China
Popul. Resour. Environ. 23, 1-9. (in Chinese).
He, J., Yu, Z., Zhang, D., 2012. China's strategy for energy development and climate
change mitigation. Energ. Policy 51, 7-13.
Humpenöder, F., Popp, A., Stevanovic, M., Müller, C., Bodirsky, B.L., Bonsch, M.,
Dietrich, J.P., Lotze-Campen, H., Weindl, I., Biewald, A., 2015. Land-use and carbon

29
cycle responses to moderate climate change: implications for land-based mitigation?
Environ. Sci. Technol. 49, 6731-6739.
IPCC, 2014. Climate change 2014: Mitigation of climate change. Contribution of
Working Group III to the Fifth Assessment Report of the Intergovernmental Panel on
Climate Change. Cambridge University Press, Cambridge, UK.
Leontief, W.W., 1936. Quantitative input and output relations in the economic systems
of the United States. Rev. Econ. Stat. 18, 105-125.
Liu, L.-C., Cao, D., Wei, Y.-M., 2016. What drives intersectoral CO2 emissions in China?
J. Clean. Prod. 133, 1053-1061.
Liu, Z., Guan, D., Moore, S., Lee, H., Su, J., Zhang, Q., 2015a. Climate policy: Steps
to China's carbon peak. Nature 522, 279-281.
Liu, Z., Guan, D., Wei, W., Davis, S.J., Ciais, P., Bai, J., Peng, S., Zhang, Q., Hubacek,
K., Marland, G., Andres, R.J., Crawford-Brown, D., Lin, J., Zhao, H., Hong, C., Boden,
T.A., Feng, K., Peters, G.P., Xi, F., Liu, J., Li, Y., Zhao, Y., Zeng, N., He, K., 2015b.
Reduced carbon emission estimates from fossil fuel combustion and cement production
in China. Nature 524, 335-338.
Mi, Z.-F., Pan, S.-Y., Yu, H., Wei, Y.-M., 2015a. Potential impacts of industrial structure
on energy consumption and CO2 emission: a case study of Beijing. J. Clean. Prod. 103,
455-462.
Mi, Z.-F., Wei, Y.-M., He, C.-Q., Li, H.-N., Yuan, X.-C., Liao, H., 2015b. Regional
efforts to mitigate climate change in China: a multi-criteria assessment approach. Mitig.
Adapt. Strateg. Glob. Change DOI 10.1007/s11027-015-9660-1.

30
Mi, Z., Zhang, Y., Guan, D., Shan, Y., Liu, Z., Cong, R., Yuan, X.-C., Wei, Y.-M., 2016.
Consumption-based emission accounting for Chinese cities. Appl. Energ. DOI
10.1016/j.apenergy.2016.06.094.
Minx, J.C., Wiedmann, T., Wood, R., Peters, G.P., Lenzen, M., Owen, A., Scott, K.,
Barrett, J., Hubacek, K., Baiocchi, G., Paul, A., Dawkins, E., Briggs, J., Guan, D., Suh,
S., Ackerman, F., 2009. Input–output analysis and carbon footprinting: An overview of
applications. Econ. Syst. Res. 21, 187-216.
Peters, G.P., Hertwich, E.G., 2008. CO2 embodied in international trade with
implications for global climate policy. Environ. Sci. Technol. 42, 1401-1407.
Peters, G.P., Minx, J.C., Weber, C.L., Edenhofer, O., 2011. Growth in emission transfers
via international trade from 1990 to 2008. P. Natl. Acad. Sci. U.S.A. 108, 8903-8908.
Peters, G.P., Weber, C.L., Guan, D., Hubacek, K., 2007. China's growing CO2 emissions
a race between increasing consumption and efficiency gains. Environ. Sci. Technol. 41,
5939-5944.
Ramsey, F.P., 1928. A mathematical theory of saving. Econ. J. 38, 543-559.
Richmond, A.K., Kaufmann, R.K., 2006. Is there a turning point in the relationship
between income and energy use and/or carbon emissions? Ecol. Econ. 56, 176-189.
Sadorsky, P., 2014. The effect of urbanization on CO2 emissions in emerging economies.
Energ. Econ. 41, 147-153.
State Council, 2014. Energy development strategy action plan (2014-2020). State
Council.
Su, B., Ang, B.W., 2011. Multi-region input–output analysis of CO2 emissions

31
embodied in trade: The feedback effects. Ecol. Econ. 71, 42-53.
Su, B., Ang, B.W., 2012. Structural decomposition analysis applied to energy and
emissions: Some methodological developments. Energ. Econ. 34, 177-188.
The White House, 2014. U.S.–China joint announcement on climate change. The White
House.
Timmer, M.P., Dietzenbacher, E., Los, B., Stehrer, R., de Vries, G.J., 2015. An
illustrated user guide to the world input–output database: the case of global automotive
production. Rev. Int. Econ. 23, 575-605.
Tol, R.S.J., 2013. Targets for global climate policy: An overview. J. Econ. Dyn. Control
37, 911-928.
United Nations, 2013. World population prospects: the 2012 revision. United Nations,
Department of Economic and Social Affairs, Population Division, New York, NY.
Weber, C.L., Matthews, H.S., 2007. Embodied environmental emissions in US
international trade, 1997-2004. Environ. Sci. Technol. 41, 4875-4881.
Wei, J., Huang, K., Yang, S., Li, Y., Hu, T., Zhang, Y., 2016. Driving forces analysis of
energy-related carbon dioxide (CO2) emissions in Beijing: an input–output structural
decomposition analysis. J. Clean. Prod. DOI 10.1016/j.jclepro.2016.05.086.
Wei, Y.-M., Mi, Z.-F., Huang, Z., 2015. Climate policy modeling: An online SCI-E and
SSCI based literature review. Omega 57, 70-84.
Wei, Y.-M., Mi, Z.-F., Zhang, H., 2013. Progress of integrated assessment models for
climate policy. Syst. Eng. Theor. Pract. 33, 1905-1915. (in Chinese).
Wiedmann, T., 2009. A review of recent multi-region input–output models used for

32
consumption-based emission and resource accounting. Ecol. Econ. 69, 211-222.
Yang, Z., Wei, Y.-M., Mi, Z., 2016. Integrated assessment models (IAMs) for climate
change. Oxford Bibliogr. DOI 10.1093/OBO/9780199363445-0043.
Yu, H., Wei, Y.-M., Tang, B.-J., Mi, Z., Pan, S.-Y., 2016. Assessment on the research
trend of low-carbon energy technology investment: A bibliometric analysis. Appl.
Energ. DOI 10.1016/j.apenergy.2016.07.129.
Yuan, J., Xu, Y., Hu, Z., Zhao, C., Xiong, M., Guo, J., 2014. Peak energy consumption
and CO2 emissions in China. Energ. Policy 68, 508-523.
Yuan, X.-C., Sun, X., Lall, U., Mi, Z.-F., He, J., Wei, Y.-M., 2016. China's
socioeconomic risk from extreme events in a changing climate: a hierarchical Bayesian
model. Clim. Change DOI 10.1007/s10584-016-1749-3.
Zhang, S., Bauer, N., Luderer, G., Kriegler, E., 2014. Role of technologies in energy-
related CO2 mitigation in China within a climate-protection world: a scenarios analysis
using REMIND. Appl. Energ. 115, 445-455.
Zhang, X., Karplus, V.J., Qi, T., Zhang, D., He, J., 2016. Carbon emissions in China:
How far can new efforts bend the curve? Energ. Econ. 54, 388-395.