integrating biophysical and socioeconomic factors in ... · integrating biophysical and...
TRANSCRIPT

271
Present and Future of Modeling Global Environmental Change: Toward Integrated Modeling,Eds., T. Matsuno and H. Kida, pp. 271–292.© by TERRAPUB, 2001.
Integrating Biophysical and Socioeconomic Factors inModeling Impacts of Global Environmental Change
Günther FISCHER
International Institute for Applied Systems Analysis, 2361 Laxenburg, Austria
Abstract—This paper presents examples of modeling studies carried out at theInternational Institute for Applied Systems Analysis (IIASA) where anintegration of biophysical and socioeconomic factors in modeling impacts ofglobal environmental was successfully achieved. The first example is takenfrom an integrated analysis of the impacts of alternative future energy paths onthe regional supply and trade of agricultural products. Second, threecomplementary approaches for analyzing and projecting regional land use arediscussed. The methods have been developed by the Land Use Change (LUC)Project at IIASA and have been applied to assess land-use trajectories andprospects of China’s food and agriculture sectors. It is concluded that land-usepolicy alternatives aimed at minimizing adverse impacts of global environmentalchange can adequately be analyzed in an economic framework using optimizationwhen this is well informed by incorporating a representation of climate andbiophysical conditions in the model specification.
INTRODUCTION
Various approaches for analyzing and projecting regional impacts of globalenvironmental change have been developed at the International Institute forApplied Systems Analysis (IIASA). Initially these studies were geared towardsassessing the potential impacts of global climate change. For example, theanalysis of the impacts of alternative future energy paths on the regional supplyand trade of agricultural commodities has been part of an integrated assessmentstudy undertaken jointly by the ECS (Environmentally Compatible EnergyStrategies), TAP (Transboundary Air Pollution) and LUC (Land Use Change)projects at IIASA. The complexity and multiple interrelationships of the problemat hand require an analysis that takes into account the relevant physical andeconomic relationships governing the world food system. To achieve consistencyamong the various research groups, the assessment models have been harmonizedthrough a process of soft-linking.
More recently, changes in land use and land cover were recognized as beingcentral to the study of global environmental change (Turner et al., 1995). Inaddition to their cumulative long-term global dimensions and their potentialresponsiveness to global environmental change, such changes can have profound

272 G. FISCHER
regional environmental implications during the life span of current generations,including various themes central to the debate of sustainability such as reducedbiodiversity, changed land productivity, climate feedbacks, robustness of theland use systems with respect to economic or environmental shocks, or enhancedwater scarcity problems, e.g., the lowering of groundwater tables.
The importance of these topics, and the need for innovative andinterdisciplinary approaches to study the nature of land-use and land-coverchanges, have prompted IIASA to establish its project on Modeling Land-Use andLand-Cover Changes in Europe and Northern Asia (LUC). The project has twomain goals: first and foremost, to develop new concepts that address themethodological challenges of projecting complex human-environment systems;and second, to apply these concepts within regional assessments to identifyeconomically viable options for land use and food policy. The current application
Fig. 1. Demographic changes 1995–2030 and 2030–2050.

Integrating Biophysical and Socioeconomic Factors in Modeling Impacts 273
focus has been on China.Global environmental change issues are long-term and are related to questions
of resource development and investment planning. Current demographic andsocioeconomic trends suggest that the next 30–50 years will be decisive formanaging viable transitions towards sustainable land-use systems (see Fig. 1).The LUC project therefore is concentrating its analysis on the period up to 2050.For instance, China’s population growth will most likely come to a halt around2030, and pressures on the food system will ease subsequently.
In the first part of this paper as summary is provided of the linkagemechanisms used in IIASA’s integrated analysis of the impacts of alternativefuture energy paths on regional supply and trade of agricultural products. Whilethe process of soft-linking may be criticized for being achieved by sacrificingcertain rigorous formalism, the benefits clearly accrue in being able to exploitdetailed and specialized assessment models.
In the second part of the paper we illustrate the integration of biophysical andsocioeconomic factors with three complementary approaches in land-use analysis,which were applied within LUC’s study of China’s food and land-use prospects.First, an enhanced Agro-ecological zones (AEZ) assessment model is used toprovide a spatially explicit measure of crop suitability and land productivitypotentials for rain-fed and irrigated conditions. This provides inputs to scenarioanalysis, based on an extended Input-Output (I-O) model, to quantify future landrequirements associated with the projected demographic trends and economicactivities. Finally, changes in land and water use are viewed as dependent on howthese resources are transformed and managed by human activity. The underlyingdecision problem is cast in the form of a welfare optimum model to elaboratesocially desirable and economically efficient trajectories of resource uses andtransformations. For this, special emphasis was placed on specifying a set ofproduction relations of the land-based economic sectors such that these wouldpermit the integration of spatially varied biophysical factors into the economicmodel.
ANALYZING IMPACTS OF ALTERNATIVE FUTURE ENERGY PATHSON REGIONAL FOOD SYSTEMS
The analysis of the impacts of alternative future energy paths on the regionalsupply and trade of agricultural commodities has been part of an integratedassessment study undertaken at IIASA. For the agricultural study, results fromthe MESSAGE-MACRO energy models of IIASA’s Environmentally CompatibleEnergy Strategies (ECS) project and from the regional air pollution modelRAINS developed by IIASA’s Transboundary Air Pollution (TAP) project werecompiled to define the economic and environmental conditions for a number ofsimulation experiments with the BLS, IIASA’s world agriculture model. IIASA’sresearch has provided a framework for analyzing the world food system, viewingnational agricultural systems as embedded in national economies, which in turninteract with each other at the international level.

274 G. FISCHER
To achieve consistency among the various research groups, the assessmentmodels have been harmonized through an approach that we term soft-linking. Ageneral scheme of the assessment is provided in Fig. 2.
A critical step in this process is linking the results of the integrated energymodel MESSAGE-MACRO (Nakicenovic et al., 1997) and IIASA’s model of theworld food and agriculture system, the Basic Linked System of NationalAgricultural Policy Models (BLS) (Fischer et al., 1988). First, the demographicand economic projections of the BLS are calibrated to match the output from themacroeconomic energy model component MACRO. Second, the yield impactmodule of the BLS is parameterized according to emission trajectories calculatedby MESSAGE (Model for Energy Supply Strategy Alternatives and their GeneralEnvironmental Impact), the systems-engineering component of the IIASA energymodel, and according to global temperature changes derived from GCMexperiments, if available, or obtained with a robust simple climate modelMAGICC (a Model for the Assessment of Greenhouse-gas Impacts and ClimateChange; Wigley and Raper, 1992; Hulme et al., 1995). Third, results from RAINS(Regional Acidification INformation and Simulation model; Amann, 1993;Amann et al., 1995; Cofala and Dörfner, 1995) were used to inform regional yielddamage functions in the BLS accounting for the effects of increasing SO2emissions and deposition. This proved to be especially relevant in high emissionfossil energy scenarios.
The world agriculture model system BLS
The BLS is a world level general equilibrium model system. It consists ofsome thirty-five national and/or regional models. The individual models are
Fig. 2. Scheme of integrated study on energy-environment-economy impacts of alternative energypathways on regional food provision.

Integrating Biophysical and Socioeconomic Factors in Modeling Impacts 275
linked together by means of a world market module. A detailed description of theentire system is provided in Fischer et al. (1988). Various results obtained withthe system are discussed in Parikh et al. (1988), Rosenzweig and Parry (1994),Fischer et al. (1990, 1994, 1996), and Fischer and Rosenzweig (1996).
The general equilibrium approach upon which the BLS is constructednecessitates that all economic activities are represented in the model. Financialflows as well as commodity flows within a country and at the international levelare consistent in the sense that they balance. Whatever is produced will bedemanded, either for human consumption, feed or intermediate input; it might betraded or put into storage. Consistency of financial flows is imposed at the levelof the economic agents in the model (individual income groups, governments,etc.), at the national as well as the international level. This implies that totalexpenditures cannot exceed total income from economic activities and fromabroad, in the form of financial transfers, minus savings. On a global scale, notmore can be spent than what is earned.
The country models are linked through trade, world market prices andfinancial flows. The system is solved in annual increments, simultaneously for allcountries. Since these steps are taken on a year-by-year basis, a recursivedynamic simulation results.
Although the BLS contains different types of models, all adhere to somecommon specifications. The models contain two main sectors: agriculture andnon-agriculture. Agriculture produces nine aggregated commodities. All non-agricultural activities are combined into one single aggregate sector. Productionis critically dependent on the availability of the modeled primary productionfactors, i.e., of land, labor and capital. The former is used only in the agriculturalsector, while the latter two are determinants of output in both the agricultural andthe non-agricultural sectors.
For agricultural commodities, acreage or animal numbers and yield aredetermined separately. Yield is represented as a function of fertilizer application(crops) or feeding intensity (livestock). Technical progress is included in themodels as biological technical progress in the yield functions of both crops andlivestock. Rates of technical progress were estimated from historical data and, ingeneral, show a decline over time. Mechanical technical progress is part of thefunction determining the level of harvested crop area and livestock husbandry.
Linking BLS with MESSAGE-MACRO
MESSAGE-MACRO is a recently developed integrated systems-engineeringand macroeconomic energy model, based on two components, MACRO andMESSAGE, which can also be run independently. MACRO is a macroeconomicmodel derived from 11R, an eleven-region adaptation of the Global 2100 model(Manne and Richels, 1992). This model, in several variants, has been widely usedfor economic studies of the global implications of CO2 reductions. MACRO is adynamic nonlinear optimization model used for the analysis of long-term CO2-energy-economy interactions. Its objective function is the total discounted utilityof a single representative producer-consumer.

276 G. FISCHER
MACRO generates internally consistent projections of global and regionalgross domestic product (GDP), as well as trajectories of regional investment,labor, and primary energy consumption. A high degree of correspondence withthe BLS in key variables for modeling the economy makes it feasible to harmonizethe scenario analysis undertaken with the MESSAGE-MACRO and BLS models.
The approach chosen for linking was to synchronize rates of economicgrowth generated in the BLS with those projected by MACRO through adjustmentof production factors and of autonomous technical progress. The thirty-fourmodel components of the BLS were aggregated into ten world regions as closelyas possible matching the regionalization of MACRO. Then, the harmonization ofproduction factors and GDP for the period 1990 to 2050 was carried out on aregion-by-region basis, by calibrating the economic growth generated in the BLSfor the sub-periods 1990 to 2010, 2010 to 2030, and 2030 to 2050. To keep theanalysis transparent and focused on energy-environment-economy interactions,it was decided to use only one common population projection (Lutz et al., 1996).
Another cornerstone of the integrated assessment was MESSAGE, a dynamicsystems engineering optimization model used for medium to long-term energysystem planning and energy policy analysis. MESSAGE uses a bottom-upapproach to describe the full range of technological aspects of energy use, fromresource extraction, conversion, transport and distribution, to the provision ofenergy end-use services. The model keeps a detailed account of pollutantemissions such as of CO2 and SO2.
The emissions projected in MESSAGE-MACRO scenario runs were input toMAGICC (Hulme et al., 1995), a simple climate change model that has beenwidely used for assessments reported by the IPCC. MAGICC accounts for theclimate feedback due to CO2 fertilization, and for negative radiative forcing dueto sulphate aerosols and stratospheric ozone depletion. Emissions are convertedto atmospheric concentrations by gas models, and the concentrations are convertedto radiative forcing potentials for each gas. The net radiative forcing is thencomputed and input into a simple upwelling-diffusion energy-balance climatemodel. This produces global* estimates of mean annual temperature.
Temperature and CO2 yield impacts
To estimate crop yield changes for a variety of conditions, we employedgeographically detailed information generated within earlier climate impactstudies (see Rosenzweig and Parry, 1994; Rosenzweig and Iglesias, 1994;Fischer et al., 1994, 1996; ASA, 1995; Strzepek and Smith, 1995). It is assumedthat yield impacts estimated in detail for different GCM climate scenariosdescribe response relationships that can be scaled to the levels of temperaturechange and atmospheric CO2 projected in the alternative energy emission scenarios.Let ∆y0
t,j denote the estimated aggregate yield changes per degree of warming inregion j (of the BLS) due to climate change only, and ∆y0
c,j is a vector of
*MAGICC estimates temperature change separately for the northern and southern hemispheres.

Integrating Biophysical and Socioeconomic Factors in Modeling Impacts 277
respective yield changes due to CO2 fertilization at 555 ppmv CO2 as derivedfrom crop modeling studies (Rosenzweig and Iglesias, 1994). Then, for globalclimate conditions resulting from any particular energy scenario s, i.e., acombination of projected temperature change and increase of CO2 concentration(∆ts, ∆cs) defined in the climate model, the effective yield impact ∆yj is calculatedby interpolation according to:
∆yj(∆ts, ∆cs) = ∆y0t,j·∆ts + ∆y0
c,j·g(∆cs).
Multiplier g(∆c) is specified as a quadratic function parameterized such thatit yields zero at base year concentrations, unity at a CO2 concentration level of555 ppmv, and reaches saturation at 800 ppmv. In the BLS simulations, projectedtemperature changes were read in 5-year intervals starting in 1990. Annual valueswithin each 5-year interval were obtained by linear interpolation. This approach,which combines geographically explicit information on yield impacts derivedfrom GCM climate experiments with transient temperature change and CO2projections, is the best that can be done given usually the lack of GCM transientclimate change results simulated with the range of emission scenarios of interest.
SO2 yield impacts
Key input parameters for defining regional sulfur damage functions in theBLS were obtained from RAINS (Amann, 1993; Amann et al., 1995). RAINS isa modular simulation system originally designed for integrated assessment ofalternative strategies to reduce acid deposition in Europe (Alcamo et al., 1990).The model quantifies sulfur emissions from given activity levels in the energysector, both production and end-uses, traces the fate of these emissions usingatmospheric transport and chemical transformation models, calculates the amountof sulfur deposition and estimates their impacts on soils and ecosystems. RAINSgenerates results in a geographically explicit manner on a grid of 1 × 1 degreealong latitude and longitude. To parameterize the yield damage caused by drydeposition of SO2, the gridded estimates of sulfur deposition and SO2concentrations for South and East Asia projected by RAINS-Asia were evaluatedfor areas with crop cultivation, using a linear damage function:
∆y e xe x
sS j, max ,
..( )( ) = − ( ) −
030
2 670 01
wherex geographic location (i.e., pixel of 1 × 1 degree along latitude and longitude);e(x) mean annual SO2 concentration in µgm–3 at location x;∆ys
S,j yield change caused by SO2 at mean annual concentration of e(x).The quantification of SO2 impacts on crops is difficult and controversial.

278 G. FISCHER
Nevertheless, it was decided to attempt quantification of possible damages fromsulfur deposition in the BLS runs, because omitting these effects would havecreated an unacceptable bias in the assessment. However, we must stress, thereis great uncertainty as to the magnitude of the possible SO2 damage. We use a SO2concentration threshold of 30 µgm–3 as established for Europe (see Ashmore andWilson, 1993). In accordance with experiments cited in Fitter and Hay (1987) andConway and Pretty (1991), we have adopted the assumption that crop yielddamage increases linearly with SO2 concentration levels exceeding the thresholdsuch that yield is reduced by 10 percent for each 10 ppbv (i.e., each 10 ppbv ≅ 26.7µgm–3) increase of mean annual sulfur dioxide concentrations beyond the criticallevel. The estimates of crop damage by grid-box were then aggregated for themain agricultural areas of major countries in the study region of RAINS-Asia(e.g., China, India, Pakistan, Thailand, Indonesia). Estimates of crop damagefrom SO2 deposition were also included for the former Soviet Union (FSU) andNorth America (NAM) using the regional trajectories of sulfur emissions calculatedby MESSAGE in each of the energy scenarios. Consequently, the climate changeyield impact equation was amended to also include a term accounting for SO2damage:
∆yj(∆ts, ∆cs, es) = ∆y0t,j·∆ts + ∆y0
c,j·g(∆cs) + ∆ysS,j(es).
What was learned by integration?
Crop experiments and studies of the impact of climate change on cropproductivity have resulted in the understanding that global warming (i.e., theclimate effect only), on a broad regional level, will have negative impacts onagriculture especially in tropical and sub-tropical regions. This effect is mitigatedand will often be more than compensated by beneficial effects on plants ofincreasing CO2 levels, through enhancing photosynthesis and water use efficiency.For a number of reasons, agriculture in temperate zones is expected to fare betterunder climate change than tropical agriculture.
The release of pollutants in high fossil fuel emission scenarios, notably ofSO2, poses a number of environmental risks including human health effects,acidification of soils and water bodies, fumigation of crops and forests, anddamage to buildings and engineering materials. Unlike in the debate on climatechange impacts, where the regions mainly responsible for the increase inatmospheric CO2 concentrations may be different from those most affected by it,the damage caused by air pollution stays more closely with the region of origin,at least when analyzing the effects in terms of broader world regions.
While numerous studies of climate change impacts on agriculture havearrived at similar conclusions as mentioned above, the insights offered belowcould hardly be obtained without integrating biophysical, agronomic, technologicaland economic factors across a wide range of models:
• In all scenario variants projected for 2050 and 2100, developing countriesexperience a worsening of agricultural production trends relative to simulations

Integrating Biophysical and Socioeconomic Factors in Modeling Impacts 279
with current climate and atmospheric conditions. Outcomes for developingregions are most negative in scenarios with high and unabated fossil fuelcombustion where both warming and SO2 pollution cause sizeable damages.
• Agricultural production in developed regions increases relative to projectionsassuming current climate and atmospheric conditions. However, scenario outcomesfor developed regions are mainly determined by economic conditions resultingfrom production changes and import needs in developing countries rather thandirect impacts due to changing environmental conditions.
• Sulfur emission abatement, in terms of agricultural and environmentalimpacts, is a regional issue much more than a global one. While there is relativelylittle difference between outcomes at the global level, regional results varygreatly between scenarios. Hence, from a regional perspective, sulfur abatementappears to be foremost in the interest of the polluters themselves.
MODEL-BASED ANALYSIS OF FUTURE LAND-USE/LAND-COVER CHANGE
Land use and food systems represent a critical intersection of the economyand the environment. While studies of the Earth system are concerned with land-cover changes and alterations of biochemical cycles of carbon, nitrogen, etc.,social science disciplines and political attention relate to food security, ruraldevelopment, and sustainability of land-use systems. Land-use changes are mostoften directly linked with economic decisions. This recognition has led LUC tochoose an economic framework as the organizing principle, resulting in a broadset of project activities geared towards providing a biophysical and geographicalunderpinning to the representation of actors and land-based economic sectors inmodeling land and water use decisions.
LUC has been aiming to fill this niche with theoretically sound yet practicalnew approaches, including integration of diverse statistical and geographical datasets within a Geographical Information System (GIS), agro-ecological assessmentsof environmental constraints and land productivity potentials, and developmentof decision tools for evaluating policy options concerning land use and agriculture(Fischer and Makowski, 2000).
Crop suitability and land productivity assessment based on AEZ modeling
LUC has recently completed a new implementation of a series of landevaluation steps, originating from the Food and Agriculture Organization of theUnited Nations (FAO) and widely know as the AEZ methodology (for details ofthe AEZ approach see “http://www.iiasa.ac.at/Research/LUC/GAEZ”). Inapplying this methodology to the territory of the FSU, Mongolia, and China, LUChas extended the AEZ from its original focus on tropical and sub-tropicalconditions to the seasonal temperate and boreal climate zones. The system workswith recent digital databases to quantify agricultural production risks as expressedby historical variability and considers possible impacts of climate change on theprevalence of constraints to crop production and of agricultural potentials.Another objective was to generate geographically explicit information that could
280 G. FISCHER
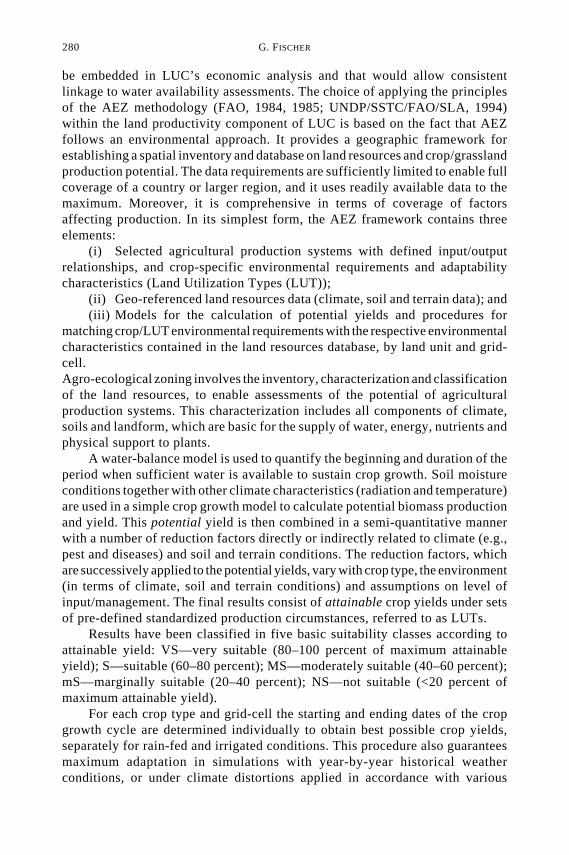
be embedded in LUC’s economic analysis and that would allow consistentlinkage to water availability assessments. The choice of applying the principlesof the AEZ methodology (FAO, 1984, 1985; UNDP/SSTC/FAO/SLA, 1994)within the land productivity component of LUC is based on the fact that AEZfollows an environmental approach. It provides a geographic framework forestablishing a spatial inventory and database on land resources and crop/grasslandproduction potential. The data requirements are sufficiently limited to enable fullcoverage of a country or larger region, and it uses readily available data to themaximum. Moreover, it is comprehensive in terms of coverage of factorsaffecting production. In its simplest form, the AEZ framework contains threeelements:
(i) Selected agricultural production systems with defined input/outputrelationships, and crop-specific environmental requirements and adaptabilitycharacteristics (Land Utilization Types (LUT));
(ii) Geo-referenced land resources data (climate, soil and terrain data); and(iii) Models for the calculation of potential yields and procedures for
matching crop/LUT environmental requirements with the respective environmentalcharacteristics contained in the land resources database, by land unit and grid-cell.Agro-ecological zoning involves the inventory, characterization and classificationof the land resources, to enable assessments of the potential of agriculturalproduction systems. This characterization includes all components of climate,soils and landform, which are basic for the supply of water, energy, nutrients andphysical support to plants.
A water-balance model is used to quantify the beginning and duration of theperiod when sufficient water is available to sustain crop growth. Soil moistureconditions together with other climate characteristics (radiation and temperature)are used in a simple crop growth model to calculate potential biomass productionand yield. This potential yield is then combined in a semi-quantitative mannerwith a number of reduction factors directly or indirectly related to climate (e.g.,pest and diseases) and soil and terrain conditions. The reduction factors, whichare successively applied to the potential yields, vary with crop type, the environment(in terms of climate, soil and terrain conditions) and assumptions on level ofinput/management. The final results consist of attainable crop yields under setsof pre-defined standardized production circumstances, referred to as LUTs.
Results have been classified in five basic suitability classes according toattainable yield: VS—very suitable (80–100 percent of maximum attainableyield); S—suitable (60–80 percent); MS—moderately suitable (40–60 percent);mS—marginally suitable (20–40 percent); NS—not suitable (<20 percent ofmaximum attainable yield).
For each crop type and grid-cell the starting and ending dates of the cropgrowth cycle are determined individually to obtain best possible crop yields,separately for rain-fed and irrigated conditions. This procedure also guaranteesmaximum adaptation in simulations with year-by-year historical weatherconditions, or under climate distortions applied in accordance with various

Integrating Biophysical and Socioeconomic Factors in Modeling Impacts 281
Fig. 3. AEZ index SI of land suitability for cereal production.

282 G. FISCHER
climate change scenarios.Adequate agricultural exploitation of the climatic potentials or maintenance
of productivity largely depends on soil fertility and the use and management ofthe soil on an ecological sustained basis. The AEZ agro-edaphic suitability ratingscheme has been intensively used by the FAO and other organizations, at variousscales, and in numerous countries and regions; it passed through severalinternational expert consultations, and hence it constitutes the most recentconsolidation of expert knowledge. In this system suitability classifications areproposed for each soil unit, by individual crops at defined levels of inputs andmanagement circumstances.
The model systematically tests the growth requirements of about 150 croptypes against a detailed set of agro-climatic and soil conditions. For China themodel operates on a 5 by 5 kilometer grid; so the total grid matrix has 810 by 970cells, of which about 375 thousand grid-cells cover the mainland of China.Results of crop suitability analysis have been summarized in tabular and mapform. On these maps, suitability results of each 5 kilometer grid-cell of the Chinaresource inventory are represented by a combination of the suitability index(SI)*, reflecting the level of suitability of the part of each grid-cell consideredsuitable, and by the percentage suitable in that particular grid-cell. The results forChina, assuming an intermediate level of management and input conditions, areshown in Fig. 3.
AEZ modeling establishes a platform for developing various applications. InLUC’s study of China, besides providing land availability scenarios and therepresentation of agro-climatic and biophysical conditions for production functionestimation, other recent examples deal with China’s food prospects with specialreference to water resources (Fischer and Wiberg, 2000; Heilig et al., 2000). TheAEZ modeling clearly brings out and quantifies the vast regional differences ofChina’s rain-fed and irrigated grain production potential and irrigation waterrequirements.
Extended Input-Output modeling and land-use scenario analysis
Extended I-O models have been widely used for natural resource accounting,material balances, and scenario analyses in the area of ecological and environmentassessments (e.g., Duchin, 1998). The fundamental purpose of an I-O model is toanalyze the interdependence of economic sectors. Extensions of the basic I-Omodel include representations of social institutions (cf. Stone, 1970) and of theenvironment (e.g., Daly, 1968; Ayres and Kneese, 1969).
The basic I-O model presents the state of an economy during a singleaccounting period (generally a year) and analyzes the changes from one state toanother that have taken place in the past. Dealing with discrete and explicitchanges in economic structure through rigorous accounting constitutes the mostdistinguished feature of I-O modeling. Through the evaluation of scenarios that
*The suitability index is defined as SI = 0.9 VS + 0.7 S + 0.5 MS + 0.3 mS.

Integrating Biophysical and Socioeconomic Factors in Modeling Impacts 283
reflect current thinking and by pinpointing the inadequacies and inconsistenciesin these scenarios, as a basis for improving them, scenario analysis based on I-Omodeling can stimulate new insights in the search for promising futuredevelopments.
Table 1 provides the scheme of an extended I-O table. The matrixes of inter-industrial flows (zij), of final deliveries (uis), and of factor inputs (vkj), correspondto a standard I-O table used in economic analysis. For application in environmentalanalysis, the standard I-O table is augmented by a representation of inputs andoutputs of land, water and other environmental resources, as shown in Table 1.
The rows in the bottom panel show the quantities of different resources usedby the various economic sectors (Lrj), and by households and other institutions(Lrs). The columns in matrix (dir) account for the depreciation and degradation ofthese resources caused by industrial, household and other social activities. For theland-use scenario analysis, we included various land types as inputs (denoted asLj and Ls hereafter) in the enhanced I-O table. These include the uses by economicsectors of the major land categories such as rain-fed and irrigated cropland,grassland, forestland, and land used for industry and mining, transportation,residence and services.
For a single accounting period, the input-output relations are represented byfixed coefficients. When dealing with another state of the economy, correspondingto a different accounting period, usually also a different set of coefficients isestablished to represent the altered structure of the economy.
Table 1. Schematic representation of an extended Input-Output table.

284 G. FISCHER
These changes are derived from scenarios developed around each questionto be explored. Structural changes include the technologies in use in differentsectors, changes in the relative size of different sectors, changes in the compositionand magnitude of various final demand sectors, and changes in the availabilityand quality of different environmental resources. A central piece of informationin scenario development is technical literature, expert knowledge, and, wherepossible, modeling of sub-systems to provide insights into current and potentialfuture production processes, population and other social trends, and theenvironment. Given a specific research topic, modelers need to first identify whatthe important contributing factors and issues are, usually through a qualitativeanalysis based on literature and expert opinions. Then the task is to identify acomprehensive yet minimal set of variables for modeling, and to quantifyparameters. This step provides great flexibility for embedding biophysicalaspects into the economic analysis although it is usually not possible to maintainfull geographical detail.
Steps in implementing an I-O based scenario analysis
The procedure of the land-use scenario analysis undertaken for Chinaconsists of seven logical steps (for details see Hubacek and Sun, 1999):
Step 1: Stylize various scenarios of population growth, urbanization, changesof lifestyles, and per capita income growth.
Step 2: Define quantitative scenarios according to bundles of changes, whichare considered to be the most interesting or most representative ones. This is donemainly based on literature surveys across different research fields as well asinternational comparisons.
Step 3: Translate the selected social and economic scenarios intocorresponding future states of final demand by different economic sectors.
Step 4: Referring to Table 1, calculate the I-O matrix of technical coefficients,
A a z z vij ij iji
kjk
= ( ) = +
∑ ∑ ,
for the selected future years in the scenario schedule. For example, let us consideryear 2025. The future sectoral structure requires a new inter-sectoral technicalstructure. Because of path dependence and economic inertia, it is plausible toassume that the future technical structure will have a close linkage with thecurrent technical structure. To establish a consistent I-O technical coefficientmatrix for year 2025, we minimize the difference between the current coefficientmatrix (Acurrent) and the matrix representing the economy in the target year, matrix

Integrating Biophysical and Socioeconomic Factors in Modeling Impacts 285
(A2025). The distance to be minimized is defined as*:
D A A aa
aijij
ijjicurrent current
: ln .2025 20252025
1[ ] = ( ) ( )( )
−
∑∑
This generates the “least surprising” representation of matrix (A2025) as it fullyincorporates both the historical information (Acurrent) and the projected structuralinformation of sectoral output (X2025), intermediate deliveries (U2025), andintermediate purchases (V2025).
Step 5: Using the Leontief inverse matrix, (I – A)–1, we obtain estimates ofsectoral total outputs, x = (I – A)–1y. Here, x and y denote, respectively, the vectors
of output (xi) = ( z yij ij
+∑ ) and final demand (yi) = ( uisx∑ ). Letter I indicates the
identity matrix, and A is the matrix of I-O coefficients as before.Step 6: Establish scenarios of land supply based on the results of the AEZ
assessment as well as other technical changes in non-agricultural sectors, andcalculate the vector of sectoral land requirement coefficients, (cj) = (Lj/xj). Theinverse of a coefficient cj measures the output of a given sector per unit of landemployed, i.e., sectoral land productivity. In order to link land requirementsassociated with changes in economic sectors to changes in land categories (∆L),the vector representing changes in sector output (∆x) is pre-multiplied by adiagonal land requirement coefficient matrix (
)C ) and a land distribution matrix
(R). Future land use (LF) is calculated by adding the present land uses (LP) and thechanges in land use (∆L) caused by the changes in output:
∆ ∆ ∆L RC x L L LF P= = +)
and .
The land distribution matrix R constitutes the mapping relationship between landuses in economic sectors and the natural categories of land, and the coefficientsin R are the shares of the former in the latter.
Step 7: Compare the results from different land-use scenarios againstvarious land availability limits, and calculate the necessary land productivityincreases that would keep the future sectoral land requirements consistent withthe availability of land. Alternatively, productivity increases can be limited, and
*This distance function is named the “information gain entropy function” and is employed inthe RAS technique (Theil, 1967; Miller and Blair, 1985). The term RAS method refers to amathematical procedure for adjusting sequentially the rows and columns of a given I-O coefficientmatrix, A(0), in order to generate an estimate of a revised matrix, A(1), when only the new structuralinformation of sectoral output, intermediate deliveries, and intermediate purchases, are known.Once the procedure converges, the final outcome is usually written as A(1) = RA(0)S (hence the nameRAS method), where R and S denote diagonal matrices constructed by the algorithm.
286 G. FISCHER
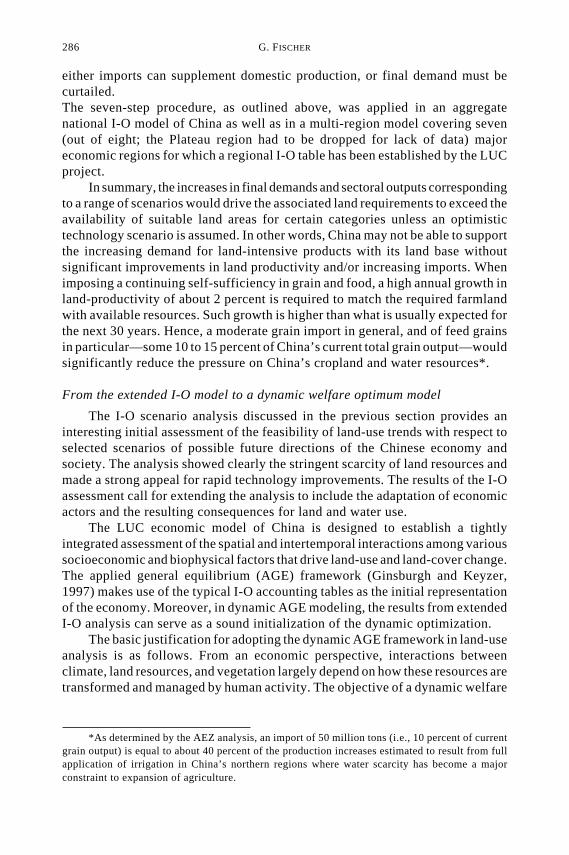
either imports can supplement domestic production, or final demand must becurtailed.The seven-step procedure, as outlined above, was applied in an aggregatenational I-O model of China as well as in a multi-region model covering seven(out of eight; the Plateau region had to be dropped for lack of data) majoreconomic regions for which a regional I-O table has been established by the LUCproject.
In summary, the increases in final demands and sectoral outputs correspondingto a range of scenarios would drive the associated land requirements to exceed theavailability of suitable land areas for certain categories unless an optimistictechnology scenario is assumed. In other words, China may not be able to supportthe increasing demand for land-intensive products with its land base withoutsignificant improvements in land productivity and/or increasing imports. Whenimposing a continuing self-sufficiency in grain and food, a high annual growth inland-productivity of about 2 percent is required to match the required farmlandwith available resources. Such growth is higher than what is usually expected forthe next 30 years. Hence, a moderate grain import in general, and of feed grainsin particular—some 10 to 15 percent of China’s current total grain output—wouldsignificantly reduce the pressure on China’s cropland and water resources*.
From the extended I-O model to a dynamic welfare optimum model
The I-O scenario analysis discussed in the previous section provides aninteresting initial assessment of the feasibility of land-use trends with respect toselected scenarios of possible future directions of the Chinese economy andsociety. The analysis showed clearly the stringent scarcity of land resources andmade a strong appeal for rapid technology improvements. The results of the I-Oassessment call for extending the analysis to include the adaptation of economicactors and the resulting consequences for land and water use.
The LUC economic model of China is designed to establish a tightlyintegrated assessment of the spatial and intertemporal interactions among varioussocioeconomic and biophysical factors that drive land-use and land-cover change.The applied general equilibrium (AGE) framework (Ginsburgh and Keyzer,1997) makes use of the typical I-O accounting tables as the initial representationof the economy. Moreover, in dynamic AGE modeling, the results from extendedI-O analysis can serve as a sound initialization of the dynamic optimization.
The basic justification for adopting the dynamic AGE framework in land-useanalysis is as follows. From an economic perspective, interactions betweenclimate, land resources, and vegetation largely depend on how these resources aretransformed and managed by human activity. The objective of a dynamic welfare
*As determined by the AEZ analysis, an import of 50 million tons (i.e., 10 percent of currentgrain output) is equal to about 40 percent of the production increases estimated to result from fullapplication of irrigation in China’s northern regions where water scarcity has become a majorconstraint to expansion of agriculture.

Integrating Biophysical and Socioeconomic Factors in Modeling Impacts 287
optimum model is to elaborate socially desirable and economically efficienttrajectories of resource uses and transformations. In mathematical terms, thewelfare optimum levels of resource uses and transformations are a function of theinitial state of the economy and of resources, of the parameterization of consumerpreferences and production relations, and of (exogenously) specified dynamicsand constraints. Though optimization may be regarded as too idealistic, it helpsto distinguish problems attributable to incompatibilities of fundamentalrelationships, for example population dynamics and resource availability, fromthose problems induced by specific modes of social organization and institutionalsettings. The results of AGE modeling are thus particularly helpful and relevantfor policy analysis.
The integrated agricultural production function
To transform the theoretical framework, a key requirement of socioeconomicand environmental land-use analysis in China is to establish an integratedagricultural production function for use in the AGE framework (Keyzer, 1998).For use in optimization, it should permit consistent aggregation over farm unitswithin each economic region. Furthermore, once the optimal solution has beendetermined in the regional AGE model, the production relations should thenallow for a disaggregation of the results to the basic sub-regional observationunits (i.e., the county level). The specification of the LUC agricultural productionrelations meets all of these requirements.
The basic structure of the agricultural production relations consists of anoutput function and an input response function, linked by means of an agriculturaloutput index. This output index is a quantity aggregation of crops produced. It isbased on a standard aggregation rule used in economics, namely a constant-elasticity-of-transformation (CET) function. As a starting point for estimation,we derived a database of gross value of crop production per hectare of cultivatedland in 1990. The compilation was based on province-level prices and county-level statistical information on output quantities, land survey data, and mappeddistribution of cultivated land, as shown in Fig. 4.
Crop production is co-determined by the biophysical potential of land, andby the level of factor inputs per unit of cultivated land. The potential output isderived from an AEZ assessment of agro-climatic and biophysical conditions.
The input response function is specified as a generalization of a popular yieldfunction in the agronomic literature, called the Mitscherlich-Baule yield function(Franke et al., 1990; Llewelyn and Featherstone, 1997). The rationale behind thisspecification is that the observed actual crop output level represents a certainfraction of the biophysical potential and is determined by the factor input levelsper unit of land, and by the technology employed. In mathematical terms,aggregate output Q is obtained as,
Q C f V H A N A y xj jj
j= ( )( ) ( )( )∏0 , ; ; , ;δ β νθ

288 G. FISCHER
where N(·) specifies an aggregate potential output index incorporating themaximum attainable yield estimates y , for given soil and climatic conditions xand derived through AEZ. Inputs of power and nutrients are denoted by V, anaggregate index of land types per observation unit is given as H(A; δ). All othersymbols denote parameters and should be determined by empirical estimation. Inthe Mitcherlich-Baule yield curve, function f is specified as saturating exponentialfunction. The theoretical background and specification details of the agriculturalproduction relations are discussed in Albersen et al. (2000).
Output and input response functions of China’s cropping agriculture in 1990were estimated for seven of the eight economic regions distinguished in the LUCmodel. The basic observation units are counties (2358 in total). The parameterestimations were deliberately conducted in the form of primal regressions, eventhough estimation of such non-linear problems can be difficult from a numericalperspective. Estimation of the production relations in primal form provides amethodological advantage in terms of modeling farmers’ behavior in a transitioneconomy like China, where both state-controlled and market prices coexist formajor agricultural products, and furthermore in which the statistical data onprices, if available, are averaged ones without details as to how the averaging isconducted. The primal estimation uses only the physical quantities of outputs andinputs. The dual variables associated with the primal optimization problemrepresent economically meaningful signals, usually termed as “shadow prices”.
Fig. 4. Average value of crop output per hectare of cultivated land in 1990 (Yuan/ha).

Integrating Biophysical and Socioeconomic Factors in Modeling Impacts 289
The estimation procedures and corresponding significance tests were implementedin GAMS (Brooke et al., 1992); their convergence was facilitated throughelaborating step-wise programming and proper loop structures (see Albersen etal., 2000).
The specification of the agricultural production function assumes that therepresentative farmer in each region determines optimal output and input mixesacross all suitable crops and key input factors. Decision-making is subject tovarying conditions of climate, soil, landform and other natural factors across thecounties in the region. This means that the specification captures farmers’adaptation to variations in natural conditions. It incorporates detailed agronomicknowledge, and thus also provides an ideal means for assessing the impact ofclimate change. This is important, as detailed biophysical assessments of croppingimpacts and water availability indicate great differences in climate impactconsequences across different regions in China (Fischer and Wiberg, 2000).
Much of the structural information on China’s agriculture was revealed bythe cross-section estimation carried out within each economic region. The resultsstrongly support the view that it is both possible and worthwhile to integrateinformation from biophysical process understanding within an economic model.
CONCLUDING REMARKS
The paper discusses examples of methodologies from IIASA’s globalenvironmental change research where integration of biophysical andsocioeconomic factors is of crucial importance to the analysis. A first applicationprovided an integrated assessment of the impacts of alternative energy paths onglobal environmental change and regional food provision, the second applicationillustrates how spatially explicit biophysical factors can be embedded in aneconomic model based on optimization.
In the first case, an integrated systems-engineering and macroeconomicenergy model, a regional air pollution model, and a global food system modelwere combined in a process termed soft-linking, i.e., a harmonization of basicassumption and transfer of relevant outputs among models. Furthermore, theprocedure ensured that results from climate and crop models was consistentlyembedded in the economic analysis.
In the second example, three complementary methodologies were appliedwithin a land-use change and food systems study of China. While each method byitself can provide useful information and is well regarded in its discipline, onlytheir combination provides a powerful and integrative tool for policy analysis. AnAEZ assessment was carried out, (i) to provide land availability estimates,employed in land-use scenario analysis based on an extended I-O model, and(ii) to generate an agro-environmental characterization for use in the specificationand estimation of a spatially explicit agricultural production function. Thisproduction function in turn plays a key role in LUC’s regionalized appliedgeneral equilibrium model of China. An extended I-O model is used to obtain aninitial assessment of the feasibility of land-use trends with respect to a range ofscenarios of possible future directions of China’s economy and society. The

290 G. FISCHER
results from the I-O modeling also serve as a sound initialization of the dynamicgeneral equilibrium model.
The issues of global environmental change, in particular also of land use andcover change have been studied by many scientific disciplines. A bettercommunication between these disciplines has often been desired and postulatedas a prerequisite for further development of improved methodologies. On thebasis of rich modeling experience accumulated at IIASA, we argue that a solutionis not likely to be found in a theory of everything but rather in improved ways ofchanneling and translating disciplinary information among natural and socialscience disciplines. We conclude that models based on economic theory andrational behavior are perhaps the most appropriate tools to modeling adaptationto and consequences of global environmental change. However, when dealingwith global environmental change, economists and their models need to pay moreattention to three aspects: first, a stronger integration of biophysical conditionsand process characteristics in specifying economic activities; second, a moreadequate embedding of geographical features and spatial relations; and third, amore careful consideration of spatial scale, spatial heterogeneity and aggregation.
Acknowledgments—The integrated energy-environment-economy study was a majorcollaborative effort of three research projects at IIASA: the Environmentally CompatibleEnergy Strategies (ECS) project led by Neboja Nakicenovic, the Transboundary AirPollution (TAP) project under the leadership of Markus Amann, and the Land Use Change(LUC) project, with major contributions from Cynthia Rosenzweig and Ana Iglesias(Columbia University, NY, USA). The research of the LUC project is a multidisciplinaryand collaborative effort. It has involved researchers at IIASA and in various collaboratinginstitutions in China, Europe, Japan, Russia, and United States. For the work presented inthis paper, the author is grateful and owes due recognition to the researchers who havedeveloped and significantly contributed to the various themes: Harrij T. van Velthuizen(IIASA, LUC) contributed to the AEZ modeling. Klaus Hubacek (IIASA, LUC andRensselaer Polytechnic Institute, Troy, NY, USA) and Laixiang Sun (IIASA, LUC)contributed to developing and implementing the extended I-O analysis; Peter Albersenand Michiel A. Keyzer (Free University, SOW-VU, Amsterdam, The Netherlands) andLaixiang Sun (IIASA, LUC) designed and greatly contributed to implementing andestimating the agricultural production functions used in the welfare optimum model. LiXiubin, Liu Yanhua, Zhao Mingcha (Institute of Geography, Chinese Academy ofSciences, Beijing, China) and Zheng Zenyuan (State Land Administration, Beijing,China) greatly supported the provision, interpretation and compilation of data.
REFERENCES
Albersen, P., Fischer, G., Keyzer, M. and Sun, L. (2000). Estimation of agricultural productionrelation in the LUC Model for China. Interim Report IR-2000-027, IIASA, Laxenburg, Austria.
Alcamo, J., Shaw, R. and Hordijk, L. (eds.) (1990). The RAINS Model of Acidification, Science andStrategies in Europe. Kluwer Academic Publishers, Dordrecht, Netherlands.
Amann, M. (1993). Transboundary Air Pollution: The RAINS model, Options, Winter ’93,International Institute for Applied Systems Analysis, Laxenburg, Austria.
Amann, M., Cofala, J. and Hordijk, L. (1995). Integrated Assessment. In: RAINS ASIA: AnAssessment Model for Air Pollution in Asia, Chapter 2 of the Report on the World BankSponsored Project “Acid Rain and Emission Reductions in Asia”, International Institute for

Integrating Biophysical and Socioeconomic Factors in Modeling Impacts 291
Applied Systems Analysis, Laxenburg, Austria.ASA (1995). Climate change and agriculture: Analysis of potential international impacts. ASA
Special Publication Number 59. American Society of Agronomy, Madison, Wisconsin, USA.Ashmore, M. R. and Wilson, R. B. (eds.) (1993). Critical Levels of Air Pollutants for Europe.
Creative Press, Reading, UK.Ayres, R. and Kneese, A. (1969). Production, consumption, and externalities. American Economic
Review 59(3), 282–297.Brooke, A., Kendrick, D., and Meeraus, A. (1992). GAMS: A User’s Guide, Release 2.25. Boyd &
Fraser Publishing Company, Danvers, MA.Cofala, J. and Dörfner, P. (1995). Constructing regional energy scenarios from global energy
models. WP-95-112, International Institute for Applied Systems Analysis, Laxenburg, Austria.Conway, G. R. and Pretty, J. N. (1991). Unwelcome Harvest: Agriculture and Pollution. Earthscan,
London, UK.Daly, H. (1968). On economics as a life science. Journal of Political Economy 76(3), 392–406.Duchin, F. (1998). Structural Economics: Measuring Change in Technology, Lifestyles, and the
Environment. Island Press, Washington, D.C.FAO (1984). Guidelines: Land evaluation for rain-fed agriculture. FAO Soils Bulletin 52. Food and
Agricultural Organization of the United Nations, Rome.FAO (1985). Guidelines: Land evaluation for irrigated agriculture. FAO Soils Bulletin 55. Food and
Agricultural Organization of the United Nations, Rome.Fischer, G. and Makowski, M. (2000). Land-use planning. In: Model-Based Decision Support
Methodology with Environmental Applications, Wierzbicki, A. P., Makowski, M., and Wessels,J. (eds.), Kluwer Academic Publishers, Dordrecht/Boston/London, pp. 333–365.
Fischer, G. and Rosenzweig, C. (1996). The impacts of climate change, CO2 and SO2 on agriculturalsupply and trade: An integrated assessment. International Institute for Applied Systems Analysis,Laxenburg, Austria.
Fischer, G. and Wiberg, D. (2000). Climate Change Impacts on Water-stressed Agriculture inNortheast China. Paper presented at Workshop on Natural Environment Management andApplied Systems Analysis, September 2000. International Institute for Applied Systems Analysis,Laxenburg, Austria.
Fischer, G., Frohberg, K., Keyzer, M. A., and Parikh, K. S. (1988). Linked National Models: A Toolfor International Policy Analysis. Kluwer Academic Publishers, Netherlands.
Fischer, G., Frohberg, K., Keyzer, M. A., Parikh, K. S., and Tims, W. (1990). Hunger—Beyond thereach of the Invisible Hand, IIASA, Laxenburg.
Fischer, G., Frohberg, K., Parry, M. L., and Rosenzweig, C. (1994). Climate change and world foodsupply, demand and trade: Who benefits, who loses? Global Environmental Change 1994 4(1),7–23.
Fischer, G., Frohberg, K., Parry, M. L., and Rosenzweig, C. (1996). Impacts of potential climatechange on global and regional food production and vulnerability. In: Climate Change and WorldFood Security, Downing, E. T. (ed.), Springer-Verlag, Berlin, Germany.
Fitter, A. H. and Hay, R. K. M. (1987). Environmental Physiology of Plants. Academic Press,London, UK.
Franke, M. D., Beattie, B. R., and Embleton, M. F. (1990). A comparison of alternative crop responsemodels. American Journal of Agricultural Economics 72, 597–602.
Ginsburgh, V. and Keyzer, M. (1997). The Structure of Applied General Equilibrium Models. TheMIT Press, Cambridge, MA.
Heilig, G. K., Fischer, G., and van Velthuizen, H. (2000). Can China feed itself? An analysis ofChina’s food prospects with special reference to water resources. International Journal ofSustainable Development and World Ecology, 7, 153–172.
Hubacek, K. and Sun, L. (1999). Land-use change in China: A scenario analysis based on input-output modeling, Interim Report IR-99-073, IIASA, Laxenburg, Austria.
Hulme, M., Raper, S., and Wigley, T. M. L. (1995). An integrated framework to address climatechange (ESCAPE) and further development of the global and regional climate modules(MAGICC). Energy Policy, volume 23(4/5), 347–356.

292 G. FISCHER
Keyzer, M. (1998). Formulation and spatial aggregation of agricultural production relationshipswithin the Land Use Change (LUC) model. Interim Report IR-98-092, IIASA, Laxenburg,Austria.
Llewelyn, R. V. and Featherstone, A. M. (1997). A comparison of crop production functions usingsimulated data for irrigated corn in western Kansas. Agricultural System 54(4), 521–538.
Lutz, W., Sanderson, W., Scherbov, S., and Goujon, A. (1996). World population scenarios for the21st century. In: The Future of the World, IIASA and Earthscan, Lutz, W. (ed.), Laxenburg,Austria and London, UK.
Manne, A. and Richels, R. (1992). Buying Greenhouse Insurance: The Economic Costs of CO2
Emission Limits. MIT Press, Cambridge, USA.Miller, R. E. and Blair, P. D. (1985). Input-Output Analysis: Foundations and Extensions. Prentice-
Hall, Inc., New Jersey.Nakicenovic, N., Amann, M., and Fischer, G. (1997). Global Energy Supply and Demand and Their
Environmental Effects, Report to the Central Research Institute of the Electric Power Industry(CRIEPI). Internal document. International Institute for Applied Systems Analysis, Laxenburg,Austria.
Parikh, K. S., Fischer, G., Frohberg, K., and Gulbrandsen, O. (1988). Toward Free Trade inAgriculture. Martinus Nijhoff, The Hague, Netherlands.
Rosenzweig, C. and Parry, M. L. (1994). Potential impacts of climate change on world food supply.Nature, 367, 133–138.
Rosenzweig, C. and Iglesias, A. (eds.) (1994). Implications of Climate Change for InternationalAgriculture: Crop Modeling Study. United States Environmental Protection Agency, Office ofPolicy, Planning and Evaluation, Washington, D.C., USA.
Stone, R. (1970). Demographic input-output: an extension of social accounting. In: Contributionsto Input-Output Analysis, Vol. 1, Carter, A. P. and Brody, A. (eds.), North-Holland, Amsterdam,pp. 293–319.
Strzepek, K. M. and Smith, J. B. (eds.) (1995). As Climate Changes: International Impacts andImplications. Cambridge University Press.
Theil, H. (1967). Economics and Information Theory. North Holland, Amsterdam.Turner, B. L., II, Skole, D., Sanderson, S., Fischer, G., Fresco, L., and Leemand, R. (1995). Land-
Use and Land-Cover Change: Science/Research Plan. IGBP Report No. 35 and HDP Report No.7. IGBP, ICSU, HDP and ISSC, Stockholm and Geneva.
UNDP/SSTC/FAO/SLA (1994). Land Resources, Use and Productivity Assessment in China. MainReport and Technical annex (Vol. 1–9) of Project CPR/87/029/B/01/R. United NationsDevelopment Program, State Science and Technology Commission of the People’s Republic ofChina, Food and Agriculture Organization of the United Nations, State Land Administration ofthe People’s Republic of China, Beijing.
Wigley, T. M. L. and Raper, S. C. B. (1992). Implications for climate and sea level of revised IPCCemissions scenarios. Nature, 357, 293–300.
G. Fischer (e-mail: [email protected])