socio-economic status of urban women of kokrajhar …
TRANSCRIPT
Indian Journal of Applied Business and Economic ResearchVol. 2, No. 1, 2021 : pp. 9-28© ARF India. All Right ReservedURL : www.arfjournals.com
ARF INDIAAcademic Open Access Publishingwww. arfjournals. com
To cite this article:
Pradip Brahmachary. Socio-Economic Status of Urban Women of Kokrajhar District of Assam.Indian Journal of Applied Business and Economic Research, Vol. 2, No. 1, pp. 9-28
SOCIO-ECONOMIC STATUS OF URBAN WOMEN OF KOKRAJHARDISTRICT OF ASSAM
Pradip Brahmachary
Associate Professor of Economics, Dept. of Humanities & Social ScienceCentral Inatitute of Technology Kokrajhar, Kokrajhar, Assam, E-mail: [email protected]
Received : 12 February 2021; Revised : 19 February 2021;Accepted : 27 February 2021; Published : 5 June 2021
Abstract: The present paper discusses about the socio-economic status of womenliving in two urban parts of Kokrajhar District of Assam. The study is mainlybased on primary data as well as secondary data. Primary data were collected byfilling responses in structured questionnaires and for that purpose a sample of100 married women from each of the urban area was selected. The study dealswith various socio-economic indicators like sex ratio, work participation rate,literacy rate, level of education, patterns of income- expenditure etc. GenderDevelopment Index is calculated to know the relative status of men and womenon the basis of literacy rate, work participation rate and earned income. The findingof the study reveals that gender disparity is more prominent in Kokrajhar townthan that of Salakati town and Gender Empowerment Measure (GEM) indicatesthat women’s economic independence is significantly lower than their politicalparticipation with respect to their male counterparts.
Keywords: Sex Ratio, Work Participation Rate, Literacy Rate, Gender DevelopmentIndex, Gender Empowerment Measurement, Equally Distributed EquivalentPercentage
INTRODUCTION
Worldwide, the history of development of human society generally indicatea dominant role either instinctively played or influentially assumed by malemembers at familial, societal, national and even international levels. Theapparently hegemonistic behaviour exhibited by male members oftenstemmed from the perceived need to ensure sustainable livelihood, securityof family, and maintenance of social order. The role of female membersused to be generally relegated to supporting male members in the latter’sdischarging of duties, upbringing progeny, and maintaining familial bonds.Although this apparently discriminatory character of human social system
10 Pradip Brahmachary
may often be deemed natural in the light of observance of distinct rolesplayed by male and female members by many species of the animal kingdomof the world who live in colonies or groups or families, yet the deliberatesubversion and aberrations of the spirit of the system by male members ofthe human societies often result in the despicable phenomenon of “genderdiscrimination” of women by men which, in turn, cause bias in behaviour,conflicts amongst members, rifts in families, asymmetric development ofsocieties and stymieing growth of the nation.
With technological development, knowledge explosion and creation ofnew avenues of opportunities worldwide, many societies are opening uptheir closed systems, and are coming to terms with the realisation thatreorganisation of the control system of families by empowering womenmembers of the family to take decisions and to undertake activitiestraditionally performed by male members would be beneficial. It is alsobeing realized that the status of women in a society is a significant indicatoras well as reflector of the level of social uprightness in that society and it isby and large determined by the active roles played by women in variousspheres of life.
The discourse on the status of women in India is an age-oldmultidimensional issue. The status of women in India has been subjectedto many great changes since ancient times. In ancient Vedic age, womenwere treated equally with men. They were enjoying equal rights, statusand opportunities like their male counterpart. However the status of womenbegan to deteriorate during late medieval period. In pre-British era, beforethe emergence of anti-colonial movement, the position of women was veryhumiliating. Under British rule, some laws were enacted to impose ban onSati Pratha, Child marriage, female infanticide, etc. in order to liberate theposition of women in Indian society.
The Constitution of the independent India not only accorded equality towomen but also empowered the State to combat discrimination againstwomen. There are many Articles in the Constitution which reiterate thecommitment of the nation towards the socio-economic development ofwomen and uphold their political rights and participation in decision making.
However, despite provisions in the Indian Constitution and legalsafeguards, women continue to be victims of exploitation, primarily due tohegemonistic attitudes of their male counterparts in the society.
The focus of the current research primarily being a community namelythe ‘Bodos’ of the north eastern region of India in the perspective of genderequality and gender discrimination, it is imperative to present an overviewof the region’s socio-economic fabrics that are inter-woven and yet distinctly
Socio-Economic Status of Urban Women of Kokrajhar District of Assam 11
positioned. India’s North East Region (NER) is a paradise of a large numberof ethnic communities represented by an innumerable variety of tribes andplains professing a wide range of beliefs, customs, cultures, languages,traditions and social systems. The NER mainly comprises of eight contiguousstates and Assam is one of them. Bodoland Territorial Area Districts (BTAD)is one of the autonomous regions of Assam which came into existence in theyear 2001. The BTAD consists of four contiguous districts — Kokrajhar,Chirang, Baksa and Udalguri, administered through a council known asBodoland Territorial Council (BTC) which is situated at Kokrajhar. Theboundary of this region shares its proximity with Arunachal, West Bengal,Bhutan and other parts of Assam. The region is inhibited predominantly byBodo language speaking ethnic group, Rajbongshi, Assamese, Bengalis,Rabha, and other indigenous Mongoloid tribes. The region is industriallybackward and lagging behind the other states in respect of human capital,employment of human resources, infrastructure development etc.
When the issue of empowerment comes in north eastern perspectives,it becomes more complex due to multifaceted complex, geo-socioeconomicback ground. There is a perception that the status of bodo women is higherin comparison with the status of women in the rest of the country. Thoughthe women in this region generally enjoy greater mobility and visibilitycompared to the other parts of the country, still like their counterpart ofother region, they have also been encountering a number of specificproblems over ages such as patriarchal social system, lack of access toproductive resources, minimal participation in decision making process, alittle financial autonomy etc.
OBJECTIVES OF THE STUDY
In the light of the above, the current research was planned to investigatethe following objectives:
i) To examine the socio-economic status of women in selected urbanpart of Kokrajhar district.
ii) To examine the relative status of men and women, GenderDevelopment Indices (GDI) and Gender Empowerment Measure(GEM) are calculated as the broad indicators of womenempowerment.
Data and Methodology
The present study is confined to two urban part of Kokrajhar district namelyKokrajhar town and Salakati inhabited by 16,569 and 2,253 femalesrespectively (as per 2011 census). The purpose behind selecting only two
12 Pradip Brahmachary
towns i.e., Kokrajhar town (most populous) and Salakati town (leastpopulous) is that they provide an outline of the rest two towns of the district,which remains uncovered in this study, so that an overview of the overallstatus of women in whole urban part of the district may emerge.
A sample of 100 women from each of the urban area is selected. All thesample women are married and preferably belong to the age group 18 to 55years. To cover about 100 respondents, the number of households may bevaried from town to town.
The present study is mainly based on primary data. Primary data arecollected by filling responses in structured questionnaires whereassecondary data are used mainly from District Census Handbook ofKokrajhar district and other government publications. Objective-wisedetailed methodology is explained as follows:
To examine the socio-economic status of the women the analysis hasbeen divided into two parts.
In the first part overall socio-economic status will be examined by usingGender Development Index (GDI) measurement. In the second part, somesocio-economic aspects like the educational status of the women, thedecision making power of the women, freedom of movement within andoutside the locality and monetary accessibility of the women will beanalyzed for knowing their present status on these aspects separately.GDIreflects the status of development of the women. GDI will be measured byconsidering two dimensions viz; social dimension and economic dimensionand it will be calculated following UNDP methodology as discussed below.
District wise GDI values are calculated separately for secondary dataas well as for primary data. In case of GDI computation on the basis ofsecondary data, social dimension is reflected by literacy rate and economicdimension is reflected by work participation rate; whereas for primary data,social dimension is reflected by literacy rate and economic dimension isreflected by earned income and work participation. GDI has been calculatedby the following three steps. Firstly, female and male indices in eachdimension are calculated according to this general formula:
ActualValue MinimumValueDimensionIndex
MaximumValue MinimumValue
Maximum and minimum value would be as per the goalposts valuegiven in Human Development Report 2005.
Secondly, the female and male indices in each dimension are combinedin a way that penalizes differences in achievement men and women. Theresulting index is calculated according to the general formula:
Socio-Economic Status of Urban Women of Kokrajhar District of Assam 13
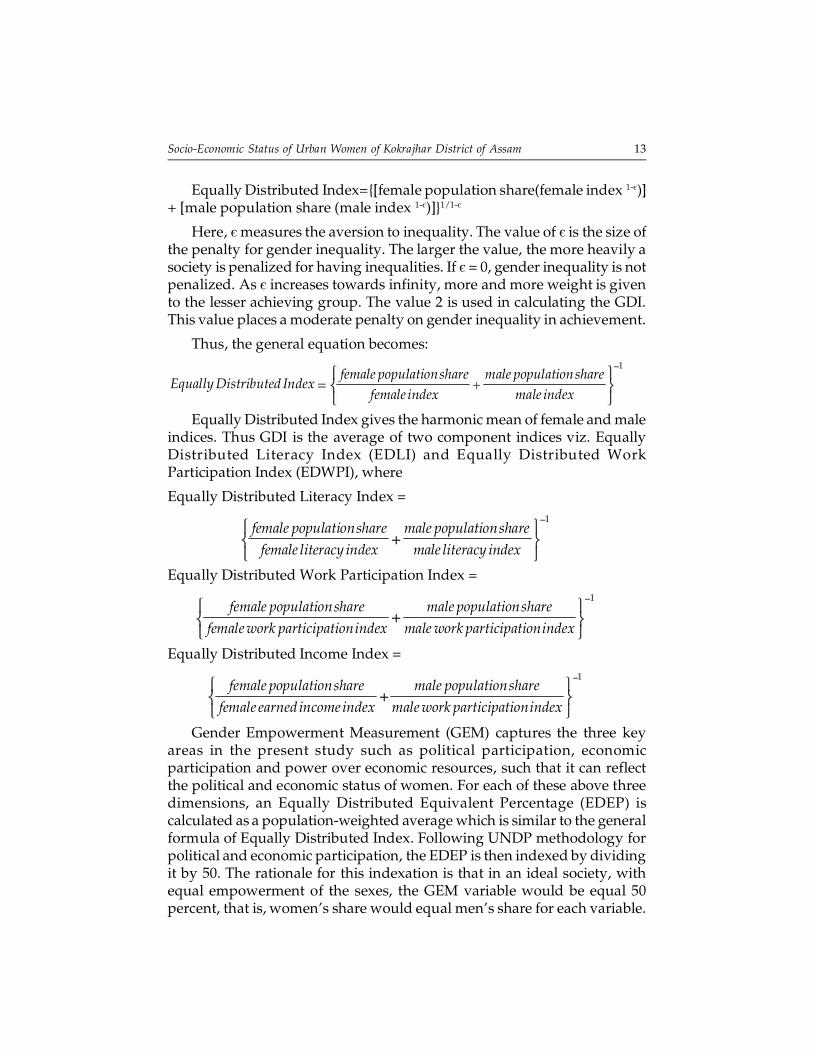
Equally Distributed Index={[female population share(female index 1-є)]+ [male population share (male index 1-є)]}1/1-є
Here, є measures the aversion to inequality. The value of є is the size ofthe penalty for gender inequality. The larger the value, the more heavily asociety is penalized for having inequalities. If є = 0, gender inequality is notpenalized. As є increases towards infinity, more and more weight is givento the lesser achieving group. The value 2 is used in calculating the GDI.This value places a moderate penalty on gender inequality in achievement.
Thus, the general equation becomes:1
female populationshare male populationshareEqually Distributed Index
female index male index
Equally Distributed Index gives the harmonic mean of female and maleindices. Thus GDI is the average of two component indices viz. EquallyDistributed Literacy Index (EDLI) and Equally Distributed WorkParticipation Index (EDWPI), where
Equally Distributed Literacy Index =1
female populationshare male populationshare
female literacy index male literacy index
Equally Distributed Work Participation Index =1
female populationshare male populationshare
female work participationindex male work participationindex
Equally Distributed Income Index =1
female populationshare male populationshare
female earnedincomeindex male work participationindex
Gender Empowerment Measurement (GEM) captures the three keyareas in the present study such as political participation, economicparticipation and power over economic resources, such that it can reflectthe political and economic status of women. For each of these above threedimensions, an Equally Distributed Equivalent Percentage (EDEP) iscalculated as a population-weighted average which is similar to the generalformula of Equally Distributed Index. Following UNDP methodology forpolitical and economic participation, the EDEP is then indexed by dividingit by 50. The rationale for this indexation is that in an ideal society, withequal empowerment of the sexes, the GEM variable would be equal 50percent, that is, women’s share would equal men’s share for each variable.
14 Pradip Brahmachary
RESULTS AND ANALYSIS
Regional geographical profile
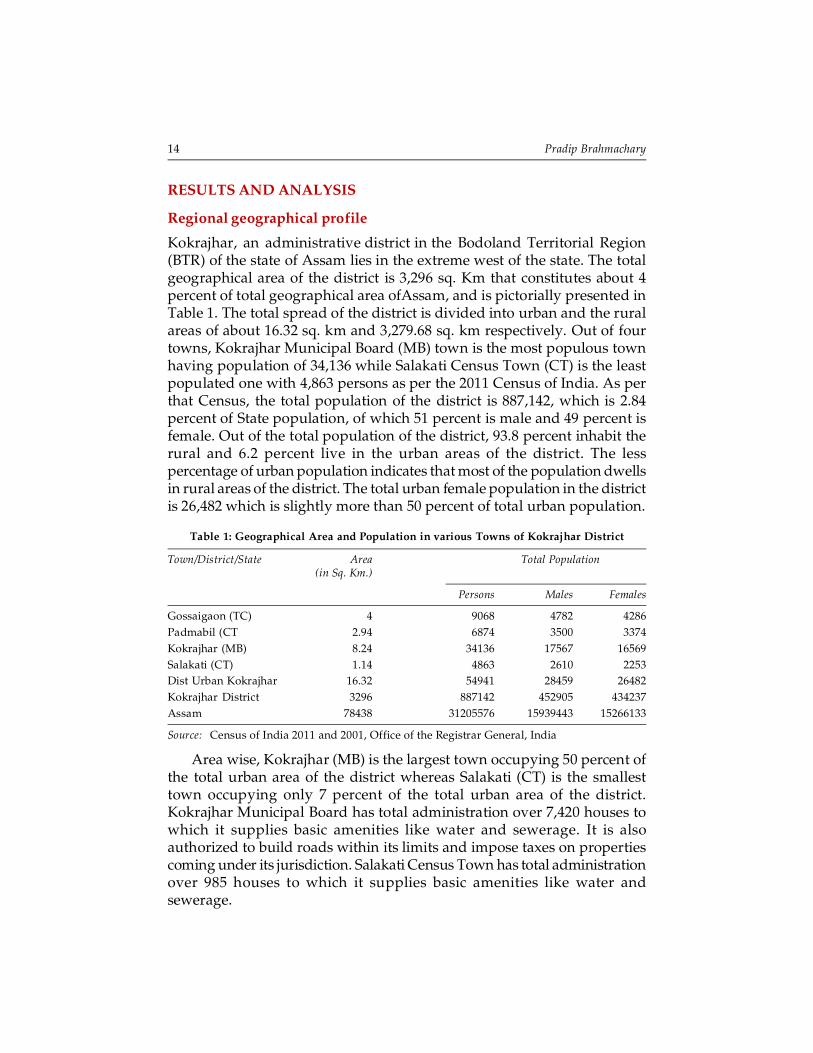
Kokrajhar, an administrative district in the Bodoland Territorial Region(BTR) of the state of Assam lies in the extreme west of the state. The totalgeographical area of the district is 3,296 sq. Km that constitutes about 4percent of total geographical area ofAssam, and is pictorially presented inTable 1. The total spread of the district is divided into urban and the ruralareas of about 16.32 sq. km and 3,279.68 sq. km respectively. Out of fourtowns, Kokrajhar Municipal Board (MB) town is the most populous townhaving population of 34,136 while Salakati Census Town (CT) is the leastpopulated one with 4,863 persons as per the 2011 Census of India. As perthat Census, the total population of the district is 887,142, which is 2.84percent of State population, of which 51 percent is male and 49 percent isfemale. Out of the total population of the district, 93.8 percent inhabit therural and 6.2 percent live in the urban areas of the district. The lesspercentage of urban population indicates that most of the population dwellsin rural areas of the district. The total urban female population in the districtis 26,482 which is slightly more than 50 percent of total urban population.
Table 1: Geographical Area and Population in various Towns of Kokrajhar District
Town/District/State Area Total Population(in Sq. Km.)
Persons Males Females
Gossaigaon (TC) 4 9068 4782 4286Padmabil (CT 2.94 6874 3500 3374Kokrajhar (MB) 8.24 34136 17567 16569Salakati (CT) 1.14 4863 2610 2253Dist Urban Kokrajhar 16.32 54941 28459 26482Kokrajhar District 3296 887142 452905 434237Assam 78438 31205576 15939443 15266133
Source: Census of India 2011 and 2001, Office of the Registrar General, India
Area wise, Kokrajhar (MB) is the largest town occupying 50 percent ofthe total urban area of the district whereas Salakati (CT) is the smallesttown occupying only 7 percent of the total urban area of the district.Kokrajhar Municipal Board has total administration over 7,420 houses towhich it supplies basic amenities like water and sewerage. It is alsoauthorized to build roads within its limits and impose taxes on propertiescoming under its jurisdiction. Salakati Census Town has total administrationover 985 houses to which it supplies basic amenities like water andsewerage.
Socio-Economic Status of Urban Women of Kokrajhar District of Assam 15
Sex Ratio
An important indicator of gender disparity is the number of females perthousand males. The district had a sex ratio of 959 which is higher than thestate sex ratio of 958 as per the Census of 2011.
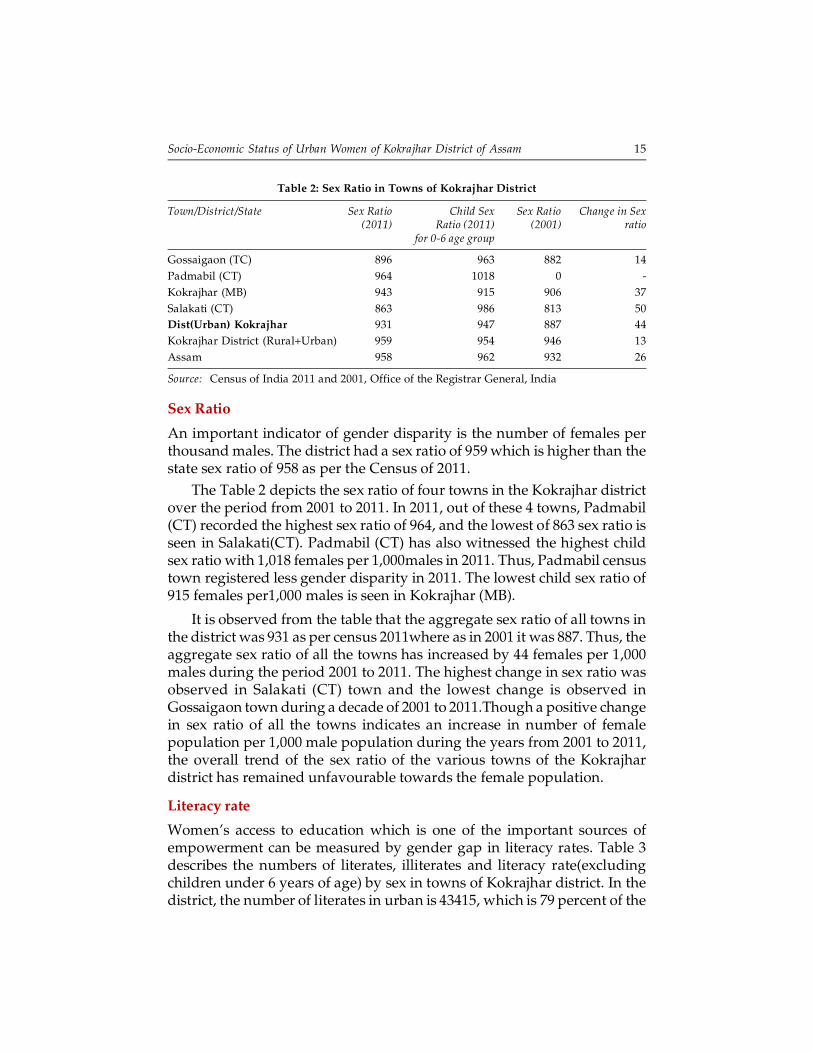
The Table 2 depicts the sex ratio of four towns in the Kokrajhar districtover the period from 2001 to 2011. In 2011, out of these 4 towns, Padmabil(CT) recorded the highest sex ratio of 964, and the lowest of 863 sex ratio isseen in Salakati(CT). Padmabil (CT) has also witnessed the highest childsex ratio with 1,018 females per 1,000males in 2011. Thus, Padmabil censustown registered less gender disparity in 2011. The lowest child sex ratio of915 females per1,000 males is seen in Kokrajhar (MB).
It is observed from the table that the aggregate sex ratio of all towns inthe district was 931 as per census 2011where as in 2001 it was 887. Thus, theaggregate sex ratio of all the towns has increased by 44 females per 1,000males during the period 2001 to 2011. The highest change in sex ratio wasobserved in Salakati (CT) town and the lowest change is observed inGossaigaon town during a decade of 2001 to 2011.Though a positive changein sex ratio of all the towns indicates an increase in number of femalepopulation per 1,000 male population during the years from 2001 to 2011,the overall trend of the sex ratio of the various towns of the Kokrajhardistrict has remained unfavourable towards the female population.
Literacy rate
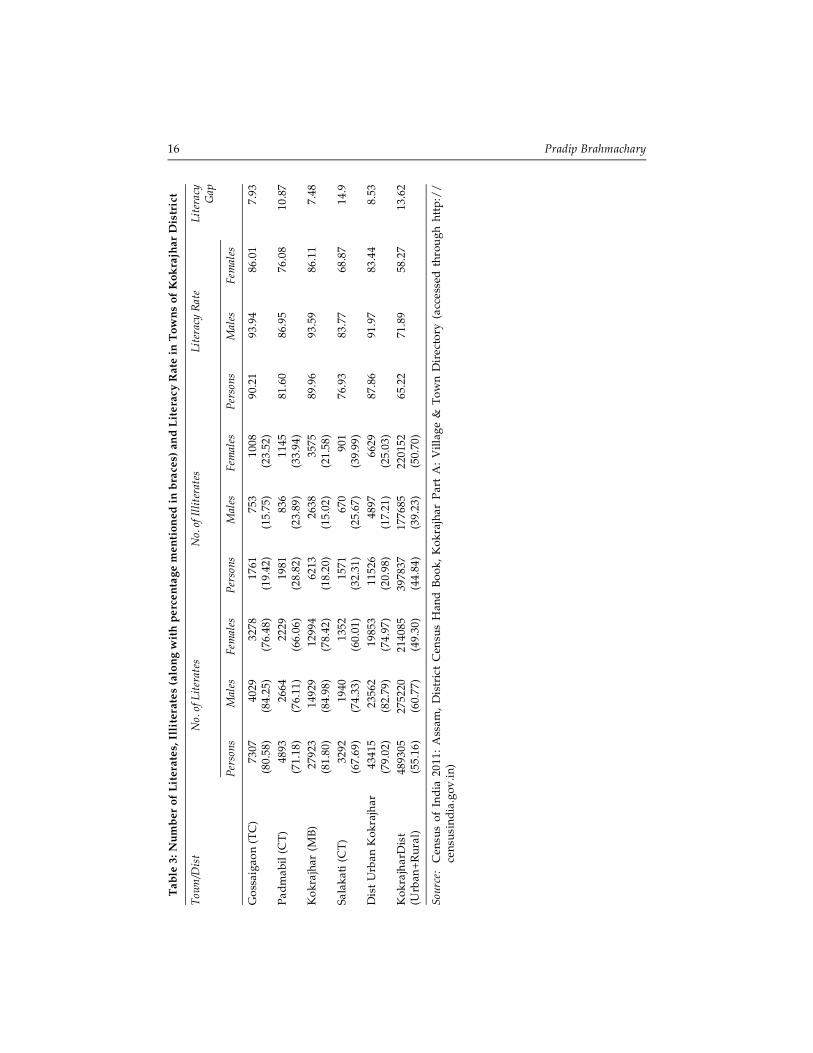
Women’s access to education which is one of the important sources ofempowerment can be measured by gender gap in literacy rates. Table 3describes the numbers of literates, illiterates and literacy rate(excludingchildren under 6 years of age) by sex in towns of Kokrajhar district. In thedistrict, the number of literates in urban is 43415, which is 79 percent of the
Table 2: Sex Ratio in Towns of Kokrajhar District
Town/District/State Sex Ratio Child Sex Sex Ratio Change in Sex(2011) Ratio (2011) (2001) ratio
for 0-6 age group
Gossaigaon (TC) 896 963 882 14Padmabil (CT) 964 1018 0 -Kokrajhar (MB) 943 915 906 37Salakati (CT) 863 986 813 50Dist(Urban) Kokrajhar 931 947 887 44Kokrajhar District (Rural+Urban) 959 954 946 13Assam 958 962 932 26
Source: Census of India 2011 and 2001, Office of the Registrar General, India
16 Pradip Brahmachary
Tab
le 3
: Nu
mb
er o
f L
iter
ates
, Ill
iter
ates
(al
ong
wit
h p
erce
nta
ge m
enti
oned
in
bra
ces)
an
d L
iter
acy
Rat
e in
Tow
ns
of K
okra
jhar
Dis
tric
t
Tow
n/D
ist
No.
of L
iter
ates
No.
of I
llite
rate
sLi
tera
cy R
ate
Lite
racy
Gap
Pers
ons
Mal
esFe
mal
esPe
rson
sM
ales
Fem
ales
Pers
ons
Mal
esFe
mal
es
Gos
saig
aon
(TC
)73
0740
2932
7817
6175
310
0890
.21
93.9
486
.01
7.93
(80.
58)
(84.
25)
(76.
48)
(19.
42)
(15.
75)
(23.
52)
Padm
abil
(CT)
4893
2664
2229
1981
836
1145
81.6
086
.95
76.0
810
.87
(71.
18)
(76.
11)
(66.
06)
(28.
82)
(23.
89)
(33.
94)
Kok
rajh
ar (
MB)
2792
314
929
1299
462
1326
3835
7589
.96
93.5
986
.11
7.48
(81.
80)
(84.
98)
(78.
42)
(18.
20)
(15.
02)
(21.
58)
Sala
kati
(C
T)32
9219
4013
5215
7167
090
176
.93
83.7
768
.87
14.9
(67.
69)
(74.
33)
(60.
01)
(32.
31)
(25.
67)
(39.
99)
Dis
t U
rban
Kok
rajh
ar43
415
2356
219
853
1152
648
9766
2987
.86
91.9
783
.44
8.53
(79.
02)
(82.
79)
(74.
97)
(20.
98)
(17.
21)
(25.
03)
Kok
rajh
arD
ist
4893
0527
5220
2140
8539
7837
1776
8522
0152
65.2
271
.89
58.2
713
.62
(Urb
an+R
ural
)(5
5.16
)(6
0.77
)(4
9.30
)(4
4.84
)(3
9.23
)(5
0.70
)
Sour
ce:
Cen
sus
of I
ndia
201
1: A
ssam
, D
istr
ict
Cen
sus
Han
d B
ook,
Kok
rajh
ar P
art
A:
Vill
age
& T
own
Dir
ecto
ry (
acce
ssed
thr
ough
htt
p://
cens
usin
dia.
gov.
in)
Socio-Economic Status of Urban Women of Kokrajhar District of Assam 17
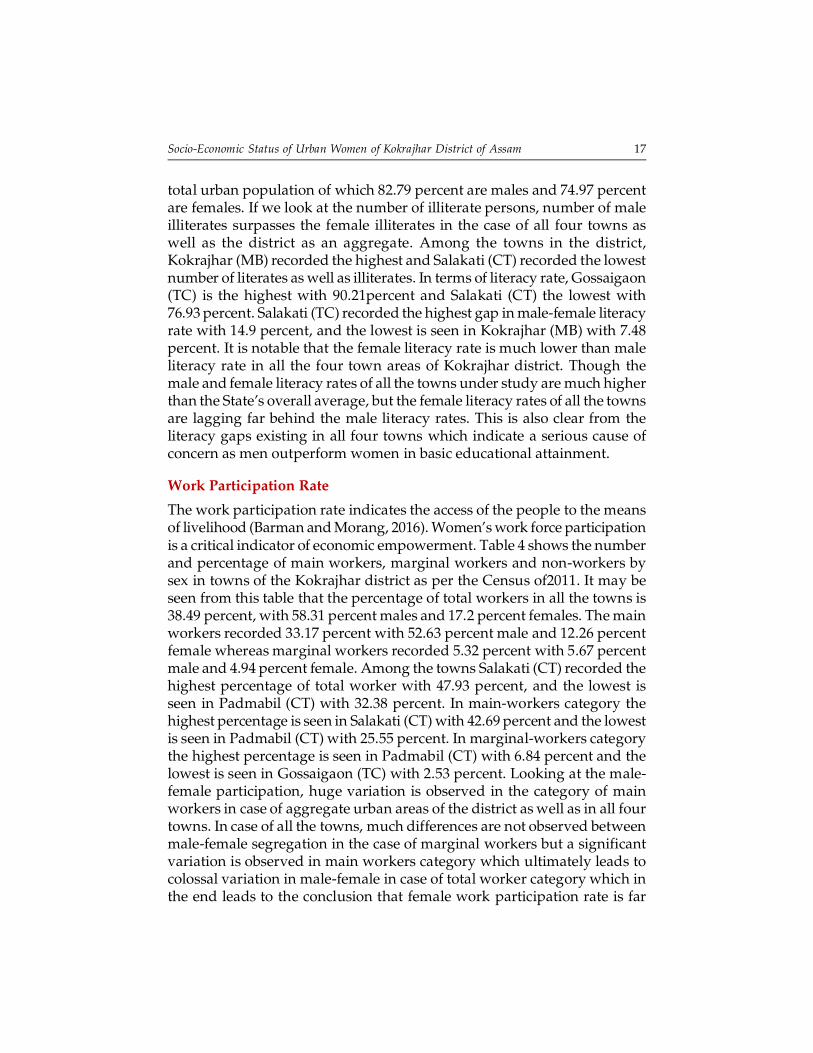
total urban population of which 82.79 percent are males and 74.97 percentare females. If we look at the number of illiterate persons, number of maleilliterates surpasses the female illiterates in the case of all four towns aswell as the district as an aggregate. Among the towns in the district,Kokrajhar (MB) recorded the highest and Salakati (CT) recorded the lowestnumber of literates as well as illiterates. In terms of literacy rate, Gossaigaon(TC) is the highest with 90.21percent and Salakati (CT) the lowest with76.93 percent. Salakati (TC) recorded the highest gap in male-female literacyrate with 14.9 percent, and the lowest is seen in Kokrajhar (MB) with 7.48percent. It is notable that the female literacy rate is much lower than maleliteracy rate in all the four town areas of Kokrajhar district. Though themale and female literacy rates of all the towns under study are much higherthan the State’s overall average, but the female literacy rates of all the townsare lagging far behind the male literacy rates. This is also clear from theliteracy gaps existing in all four towns which indicate a serious cause ofconcern as men outperform women in basic educational attainment.
Work Participation Rate
The work participation rate indicates the access of the people to the meansof livelihood (Barman and Morang, 2016). Women’s work force participationis a critical indicator of economic empowerment. Table 4 shows the numberand percentage of main workers, marginal workers and non-workers bysex in towns of the Kokrajhar district as per the Census of2011. It may beseen from this table that the percentage of total workers in all the towns is38.49 percent, with 58.31 percent males and 17.2 percent females. The mainworkers recorded 33.17 percent with 52.63 percent male and 12.26 percentfemale whereas marginal workers recorded 5.32 percent with 5.67 percentmale and 4.94 percent female. Among the towns Salakati (CT) recorded thehighest percentage of total worker with 47.93 percent, and the lowest isseen in Padmabil (CT) with 32.38 percent. In main-workers category thehighest percentage is seen in Salakati (CT) with 42.69 percent and the lowestis seen in Padmabil (CT) with 25.55 percent. In marginal-workers categorythe highest percentage is seen in Padmabil (CT) with 6.84 percent and thelowest is seen in Gossaigaon (TC) with 2.53 percent. Looking at the male-female participation, huge variation is observed in the category of mainworkers in case of aggregate urban areas of the district as well as in all fourtowns. In case of all the towns, much differences are not observed betweenmale-female segregation in the case of marginal workers but a significantvariation is observed in main workers category which ultimately leads tocolossal variation in male-female in case of total worker category which inthe end leads to the conclusion that female work participation rate is far
18 Pradip Brahmachary
Tab
le 4
: Dis
trib
uti
on o
f W
ork
ers
and
Wor
k P
arti
cip
atio
n R
ate
by
sex
in T
own
s of
Kok
rajh
ar D
istr
ict
- 20
11(P
erce
nta
ge o
f w
ork
ers
men
tion
ed i
n b
race
s)
Mai
n W
orke
rsM
argi
nal W
orke
rsTo
tal W
orke
rsW
ork
Part
icip
atio
n R
ate
Tow
n/D
ist
Pers
ons
Mal
eFe
mal
ePe
rson
sM
ale
Fem
ale
Pers
ons
Mal
eFe
mal
ePe
rson
sM
ale
Fem
ale
Gos
saig
aon
(TC
)29
9025
9939
122
912
010
932
1927
1950
035
.50
56.8
611
.67
(32.
97)
(54.
35)
(9.1
2)(2
.53)
(2.5
1)(2
.54)
(35.
50)
(56.
86)
(11.
67)
Padm
abil
(CT
1756
1515
241
470
291
179
2226
1806
420
32.3
851
.60
12.4
5(2
5.55
)(4
3.29
)(7
.14)
(6.8
4)(8
.31)
(5.3
1)(3
2.38
)(5
1.60
)(1
2.45
)K
okra
jhar
(M
B)11
403
9374
2029
1969
1059
910
1337
210
433
2939
39.1
759
.39
17.7
4(3
3.40
)(5
3.36
)(1
2.25
)(5
.77)
(6.0
3)(5
.49)
(39.
17)
(59.
39)
(17.
74)
Sala
kati
(C
T)20
7614
9158
525
514
511
023
3116
3669
547
.93
62.6
830
.85
(42.
69)
(57.
13)
(25.
97)
(5.2
4)(5
.56)
(4.8
8)(4
7.93
)(6
2.68
)(3
0.85
)D
ist
Urb
an K
okra
jhar
1822
514
979
3246
2923
1615
1308
2114
816
594
4554
38.4
958
.31
17.2
0(3
3.17
)(5
2.63
)(1
2.26
)(5
.32)
(5.6
7)(4
.94)
(38.
49)
(58.
31)
(17.
20)
Kok
rajh
arD
ist
2531
1019
8804
5430
688
021
3751
850
503
3411
3123
6322
1048
0938
.552
.224
.1(2
8.53
)(4
3.90
)(1
2.51
)(9
.92)
(8.2
8)(1
1.6)
(38.
45)
(52.
18)
(24.
14)
Sour
ce:
Cen
sus
of In
dia
2011
: Ass
am, D
istr
ict C
ensu
s H
and
Book
, Kok
rajh
ar P
art A
& P
art B
: Vill
age
& T
own
Dir
ecto
ry (a
cces
sed
thro
ugh
http
://c
ensu
sind
ia.g
ov.in
)

Socio-Economic Status of Urban Women of Kokrajhar District of Assam 19
Tab
le 5
: Per
cen
tage
dis
trib
uti
on o
f th
e ca
tego
rica
l va
riab
les
of t
he
sam
ple
res
pon
den
ts
Var
iabl
eC
ateg
ory
Kok
rajh
ar (
MB)
Tow
nSa
laka
ti (
CT
) To
wn
Freq
uenc
yPe
rcen
tC
umul
ativ
eFr
eque
ncy
Perc
ent
Cum
ulat
ive
Perc
ent
Perc
ent
Rel
igio
nH
ind
uis
m82
82.0
82.0
7575
.075
.0Is
lam
1313
.095
.023
23.0
98.0
Chr
isti
an5
5.0
100.
02
2.0
100.
0O
ther
00
100.
00
010
0.0
Soci
al C
ateg
ory
Gen
eral
1616
.016
.06
6.0
6.0
SC7
7.0
23.0
1111
.017
.0ST
6565
.088
.058
60.0
67.0
OB
C12
12.0
100.
025
23.0
100.
0Fa
mily
com
posi
tion
Nu
clea
r93
92.0
92.0
8989
.089
.0E
xten
ded
78.
010
0.0
1111
.010
0.0
Age
of
resp
onde
nt<2
5 yr
s8
8.0
8.0
1616
.016
.025
-35
yrs
4141
.049
.039
39.0
55.0
36-4
5 yr
s49
49.0
98.0
3939
.094
.046
-55y
rs2
2.0
100.
06
6.0
100.
0M
arit
al s
tatu
sM
arri
ed95
95.0
95.0
9696
.096
.0D
ivor
ced
44.
099
.01
1.0
97.0
Wid
ow1
1.0
100.
03
3.0
100.
0O
ccu
pati
onN
il7
7.0
7.0
5353
.053
.0A
gicu
ltur
e5
5.0
12.0
1010
.063
.0Se
lf E
mp
loye
d14
14.0
26.0
99.
072
.0B
usin
ess
3939
.065
.012
12.0
84.0
Serv
ice
3232
.097
.010
10.0
94.0
Oth
ers
33.
010
0.0
66.
010
0.0
Sour
ce:
Cal
cula
ted
from
the
dat
a of
pri
mar
y su
rvey
, Ju
ne, 2
018-
Dec
, 202
0

20 Pradip Brahmachary
lower than male work participation rate. This implies that low workparticipation rate of female is an indication of less women’s participationin economic activities.
Descriptive Analysis of respondent women and Surveyed Households
In this section results of an empirical study are presented. In order to carryout this empirical analysis a primary level household survey was conductedin two selected towns of Kokrajhar district of Assam. From this survey andfield observations information about socio-economic and demographiccharacteristics of households of the study areas was collected. The empiricalstudy is based on information collected from 200 households, 100 each fromtwo selected towns surveyed during the period 2018-19.
From Table 5, it is clear that majority of the respondents and theirhouseholds of both the selected towns are Hindu. Sample households belongto Islam emerges second religious group whereas number of Christianrespondents is minimal. In case of social category, the number of Scheduletribe respondent is much higher than any other category (65 percent and 60percent respectively). This is so because the areas under study are tribaldominated. As the sample survey covers only married women belong toage group 18-55 years, the number of married respondents in both thesample towns is significantly high where as the number of divorcee andwidow is almost negligible. Moreover, maximum number of respondentsbelongs to age group of 36-45 years. Regarding occupation status, 39 percentof women are engaged in business activities, where as 32 percent are jobholders in Kokrajhar (MB). On the other hand, in Salakti (CT) more than 50percent women are not engaged in any economic activities. This meansthat as far as occupation status is concerned, women in Salakati town areless empowered than their counterpart in Kokrajhar (MB) town.
Demographic Characteristics of the Surveyed Population
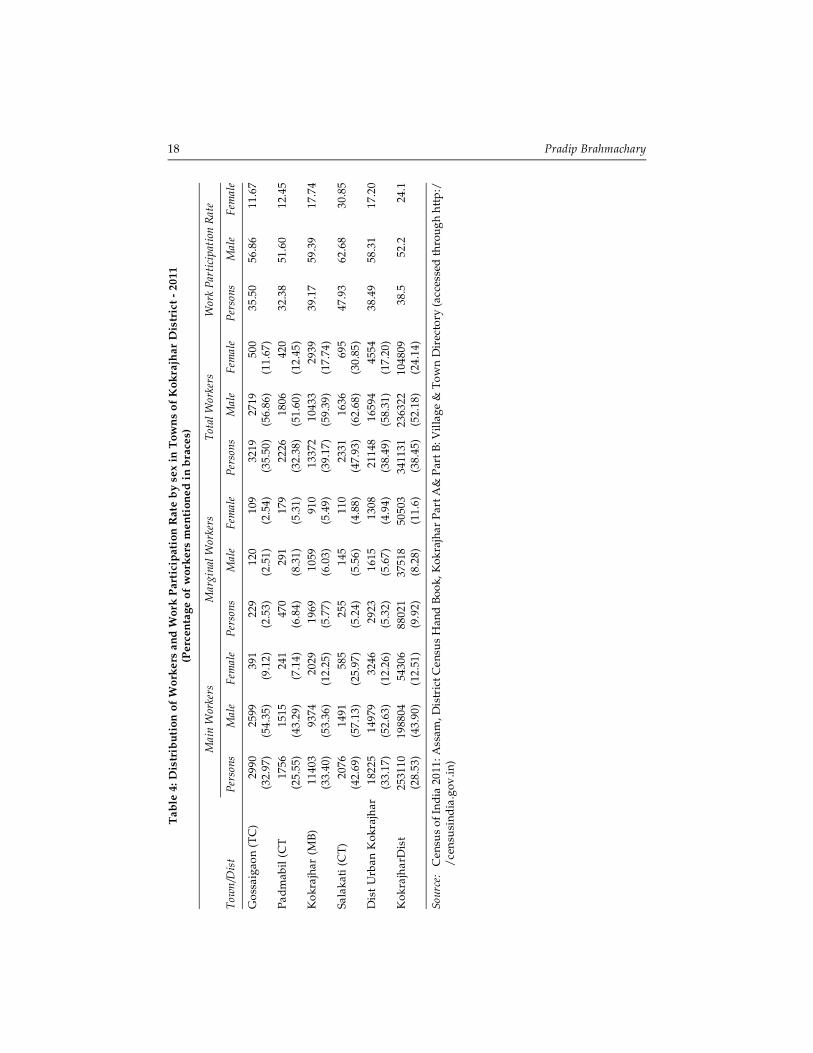
From Table 6, it may be seen that on an average each family of Kokrajar(MB) town has 3.69 members while maximum number in a family is 7. Thistable shows that the half of the sample families has more than 1 child. Theaverage age of respondents in Kokrajar (MB) town is 37.22 years while theaverage age of respondents’ husband is 40.99 years which results in 3.77years spousal age gap. The high values of Standard Deviation (SD) for‘Duration of marriage’ and ‘Age at marriage time’ reflect wide variation inthese two demographic characteristics. The average dependency ratio is44.93 percent. This means that almost half of the family members on averagedepend on others for their bread and butter.
Socio-Economic Status of Urban Women of Kokrajhar District of Assam 21
Tab
le 6
: Rel
evan
t D
emog
rap
hic
pro
file
of
sam
ple
hou
seh
old
s of
Kok
rajh
ar T
own
Des
crip
tive
Fam
ily s
ize
Num
ber
ofA
ge o
fA
ge o
fSp
ousa
l age
(in
Yea
rs)
Age
at
Dep
ende
ncy
stat
isti
cs(i
n N
umbe
r)ch
ildre
n R
espo
nden
tH
usba
ndga
pm
arri
age
tim
eR
atio
(%)
(in
Yea
rs)
(in
Yea
rs)
(in
Yea
rs)
(in
Yea
rs)
Mea
n3.
691.
0937
.22
40.9
93.
7711
.85
25.3
744
.928
57M
edia
n4
155
6010
1224
.550
Max
73
2140
031
3910
0M
in2
037
423
118
0SD
1.06
480.
5495
9.90
0110
.203
42.
3145
417.
2688
284.
7405
817
.725
31
Sour
ce:
Cal
cula
ted
from
the
dat
a of
pri
mar
y su
rvey
, Ju
ne, 2
018-
Dec
, 202
0
Tab
le 7
: Rel
evan
t D
emog
rap
hic
pro
file
of
sam
ple
hou
seh
old
s of
Sal
akat
i T
own
Des
crip
tive
Fam
ily s
ize
Num
ber
ofA
geA
ge o
fSp
ousa
l age
Dur
atio
n of
Age
at
Dep
ende
ncy
stat
isti
cs (
in N
umbe
r)ch
ildre
n(i
n Y
ears
) H
usba
ndga
pm
arri
age
mar
riag
e ti
me
Rat
io (%
)(i
n Y
ears
)(i
n Y
ears
) (i
n Y
ears
) (i
n Y
ears
)
Mea
n5
1.46
3237
48
2553
.522
9M
edia
n5
132
354
725
60M
ax8
351
5812
2636
100
Min
20
2024
-20
180
SD1.
6941
070.
787.
0306
7.11
772.
2517
4.91
913.
6874
20.7
663
Sour
ce:
Cal
cula
ted
from
the
dat
a of
pri
mar
y su
rvey
, Ju
ne, 2
018-
Dec
, 202
0
22 Pradip Brahmachary
It is also clear from Table 7 that on an average each family of Salakati(CT) town has 5 members while maximum number in a family is 8 and theminimum is 2. It is also obvious that the half of the sample families hasonly 1 child. The average age of respondents in Kokrajar (MB) town is 32years while the average age of respondents’ husband is 37 years whichresults in 4 years spousal age gap. The high values of Standard Deviation(SD) for ‘Duration of marriage’ and ‘Age at marriage time’ reflect widevariation in these two demographic characteristics; but these variations areless than that of Kokrajhar town.
The average dependency ratio is 53.52 percent. This means that morethan half of the family members on average depend on other for their breadand butter.
Education status of Sample Households
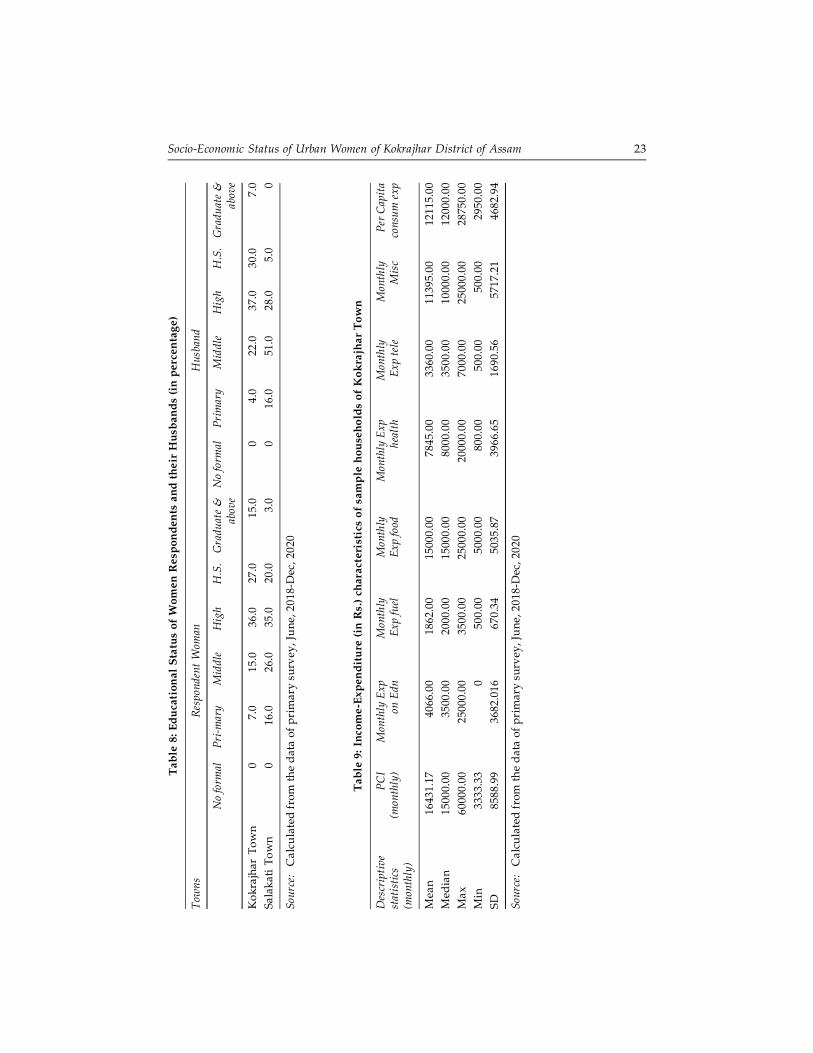
Educational status is an important aspect under the social status of womenempowerment. Table 8 reveals the status of education between womenrespondents and their husbands. It is clear that all the respondent womenand their respective husbands belong to both the towns had receivedminimum formal education. In the case of higher education, wives are foundmore educated than their husbands in both the towns. In Kokrajhar (MB)town, the percentage of men having middle, high and higher secondaryeducation is more than their female counterparts. But in Salakati (CT) townthe percentage of women having high and higher secondary education ismore than their male counterparts. Thus, women of Salakati (CT) town arefound as being more qualified than their male counterparts in comparisonto women of Kokrajhar (MB) town.
Table 9 and Table 10 describe income-expenditure figures of samplehouseholds of Kokrajhar (MB) and Salakati (CT) town respectively. Theaverage monthly per capita income of the families is more than their medianof monthly per capita income (PCI) in both the towns. This means that themajority of the sample households lies above poverty line. The maximum,minimum and Standard Deviation values indicate that the variations inmonthly PCI in Kokrajhar town are relatively higher than that of Salakatitown. In case of expenditure under various heads, families of both townsspend relatively more on food and less on fuel. The differences betweenmonthly PCI and monthly per capita consumption expenditure indicatethat most of the households have the tendency of saving a part of theirincome.
Thus, it may be concluded from the income as well as expenditurepatterns of surveyed households that the focus would be to examine the
Socio-Economic Status of Urban Women of Kokrajhar District of Assam 23
Tab
le 8
: Ed
uca
tion
al S
tatu
s of
Wom
en R
esp
ond
ents
an
d t
hei
r H
usb
and
s (i
n p
erce
nta
ge)
Tow
nsR
espo
nden
t W
oman
Hus
band
No
form
alPr
i-m
ary
Mid
dle
Hig
hH
.S.
Gra
duat
e &
No
form
alPr
imar
yM
iddl
eH
igh
H.S
.G
radu
ate
&ab
ove
abo
ve
Kok
rajh
ar T
own
07.
015
.036
.027
.015
.00
4.0
22.0
37.0
30.0
7.0
Sala
kati
Tow
n0
16.0
26.0
35.0
20.0
3.0
016
.051
.028
.05.
00
Sour
ce:
Cal
cula
ted
from
the
dat
a of
pri
mar
y su
rvey
, Ju
ne, 2
018-
Dec
, 202
0
Tab
le 9
: In
com
e-E
xpen
dit
ure
(in
Rs.
) ch
arac
teri
stic
s of
sam
ple
hou
seh
old
s of
Kok
rajh
ar T
own
Des
crip
tive
PC
IM
onth
ly E
xpM
onth
lyM
onth
lyM
onth
ly E
xpM
onth
lyM
onth
lyPe
r C
apit
ast
atis
tics
(mon
thly
) o
n E
dnEx
p fu
elEx
p fo
od h
ealt
hEx
p te
leM
isc
cons
um e
xp(m
onth
ly)
Mea
n16
431.
1740
66.0
018
62.0
015
000.
0078
45.0
033
60.0
011
395.
0012
115.
00M
edia
n15
000.
0035
00.0
020
00.0
015
000.
0080
00.0
035
00.0
010
000.
0012
000.
00M
ax60
000.
0025
000.
0035
00.0
025
000.
0020
000.
0070
00.0
025
000.
0028
750.
00M
in33
33.3
30
500.
0050
00.0
080
0.00
500.
0050
0.00
2950
.00
SD85
88.9
936
82.0
1667
0.34
5035
.87
3966
.65
1690
.56
5717
.21
4682
.94
Sour
ce:
Cal
cula
ted
from
the
dat
a of
pri
mar
y su
rvey
, Ju
ne, 2
018-
Dec
, 202
0

24 Pradip Brahmachary
Tab
le 1
0: I
nco
me
Exp
end
itu
re (
in R
s.)
char
acte
rist
ics
of s
amp
le h
ouse
hol
ds
of S
alak
ati
Tow
n
Des
crip
tive
Mon
thly
Mon
thly
Exp
Mon
thly
Exp
Mon
thly
Exp
Mon
thly
Exp
Mon
thly
Exp
Mon
thly
Mis
cPe
r C
apit
ast
atis
tics
PC
Ion
Edn
on fu
elon
food
on h
ealt
hon
pho
neex
pco
nsum
exp
(mon
thly
)
Mea
n89
05.2
940
12.0
021
10.0
014
010.
0061
25.0
028
32.0
078
80.0
079
43.5
8M
edia
n83
09.2
940
00.0
020
00.0
015
000.
0060
00.0
030
00.0
080
00.0
074
16.6
7M
ax25
000
1000
0.00
4000
.00
2200
0.00
1200
0.00
5000
.00
2000
0.00
2050
0.00
Min
2500
.00
080
0.00
6000
.00
1000
.00
500.
0010
00.0
053
4.65
SD39
05.3
2439
.77
787.
8537
61.6
426
81.7
712
82.8
037
07.5
131
67.7
7
Sour
ce:
Cal
cula
ted
from
the
dat
a of
pri
mar
y su
rvey
June
, 201
8-D
ec, 2
020
Socio-Economic Status of Urban Women of Kokrajhar District of Assam 25
empowerment status of women of middle income grouped society of thetwo selected towns.
Construction of Gender Development Index (GDI)
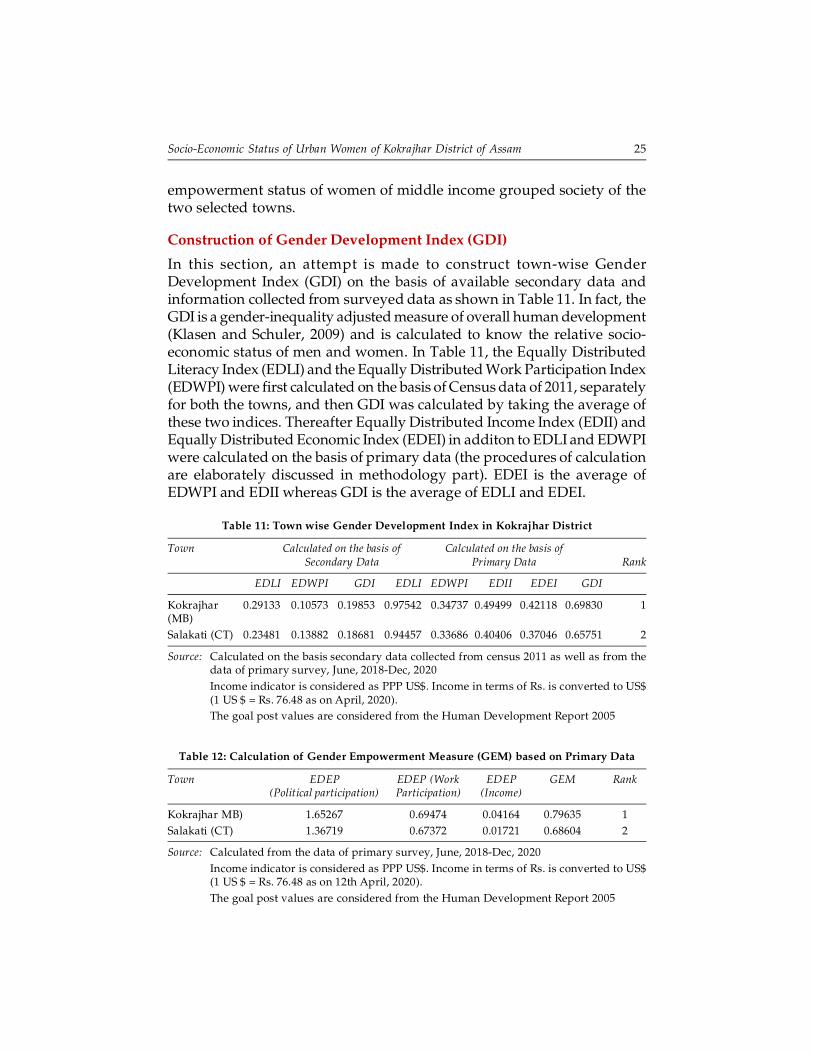
In this section, an attempt is made to construct town-wise GenderDevelopment Index (GDI) on the basis of available secondary data andinformation collected from surveyed data as shown in Table 11. In fact, theGDI is a gender-inequality adjusted measure of overall human development(Klasen and Schuler, 2009) and is calculated to know the relative socio-economic status of men and women. In Table 11, the Equally DistributedLiteracy Index (EDLI) and the Equally Distributed Work Participation Index(EDWPI) were first calculated on the basis of Census data of 2011, separatelyfor both the towns, and then GDI was calculated by taking the average ofthese two indices. Thereafter Equally Distributed Income Index (EDII) andEqually Distributed Economic Index (EDEI) in additon to EDLI and EDWPIwere calculated on the basis of primary data (the procedures of calculationare elaborately discussed in methodology part). EDEI is the average ofEDWPI and EDII whereas GDI is the average of EDLI and EDEI.
Table 11: Town wise Gender Development Index in Kokrajhar District
Town Calculated on the basis of Calculated on the basis ofSecondary Data Primary Data Rank
EDLI EDWPI GDI EDLI EDWPI EDII EDEI GDI
Kokrajhar 0.29133 0.10573 0.19853 0.97542 0.34737 0.49499 0.42118 0.69830 1(MB)Salakati (CT) 0.23481 0.13882 0.18681 0.94457 0.33686 0.40406 0.37046 0.65751 2
Source: Calculated on the basis secondary data collected from census 2011 as well as from thedata of primary survey, June, 2018-Dec, 2020Income indicator is considered as PPP US$. Income in terms of Rs. is converted to US$(1 US $ = Rs. 76.48 as on April, 2020).The goal post values are considered from the Human Development Report 2005
Table 12: Calculation of Gender Empowerment Measure (GEM) based on Primary Data
Town EDEP EDEP (Work EDEP GEM Rank(Political participation) Participation) (Income)
Kokrajhar MB) 1.65267 0.69474 0.04164 0.79635 1Salakati (CT) 1.36719 0.67372 0.01721 0.68604 2
Source: Calculated from the data of primary survey, June, 2018-Dec, 2020Income indicator is considered as PPP US$. Income in terms of Rs. is converted to US$(1 US $ = Rs. 76.48 as on 12th April, 2020).The goal post values are considered from the Human Development Report 2005
26 Pradip Brahmachary
It may be observed from the Table 11 that there is a wide differencebetween Equally Distributed Literacy Index (EDLI) and Equally DistributedWork Participation Index (EDWPI) in two towns as far as secondary andprimary data are concerned. The EDLI values are much higher than EDWPIof which means that most of the literate women in these two towns arehaving very low work participation rate. When towns are ranked as perGDI value it is clear that Kokrajhar (MB) town is ahead of Salakati (CT)town. In other words, women in Salakati (CT) town are relativelyunderprivileged in respect of literacy rate, work participation rate andearned income.The high values of Equally Distributed Indices calculatedon the basis of primary data indicate that gender inequality in education iscomparatively very high.
The Gender Empowerment Measure (GEM), an index that focuses onthree variables that reflects women’s participation in political decision-making, their access to professional opportunities and their earning poweris calculated in Table 12. It is observed that gender empowerment isrelatively high in both the towns. The Equally Distributed EquivalentPercentage (EDEP) of political participation is very high compared to thatof work participation and income. The Equally Distributed EquivalentPercentage (EDEP) of income is very low in all the areas which in turnresults in lowering the value of GEM. This means that women’s economicindependence is significantly lower than their political participation withrespect to their male counterparts.
CONCLUSION
In recent perspectives, empowerment of women has become a serious areaof study. In fact, empowerment of women is a social-political idealenvisioned in relation to the wider framework of women’s rights. It wouldbe achieved only when advancement in the conditions of women isaccompanied by their ability to influence the direction of social changegained through equal opportunities in economic, social and political spheresof life. In light of results and analyses appeared above, the findings of thestudy can be summarized as follows:
1. Sex ratio in selected towns is well below District’s aggregate sexrato. This brings out the fact that there are less number of womenper 1000 men in the area under study which is not at all a healthytrend for any society.
2. There exists significant gap between male and female literacy ratewhich indicates that a significant number of women are devoid ofgetting basic education facility.
Socio-Economic Status of Urban Women of Kokrajhar District of Assam 27
3. In case of work participation rate female work participation rate isfar lower than male work participation rate which is an indicationof less women’s participation in economic activities.
4. The percentage of bodo and non-bodo women in Kokrajhar townwas 65 and 35 percent respectably whereas in Salakati town itwas and 60 and 40 percent respectively. This is so because theareas under study are tribal dominated and therefore status ofwomen can’t be analysed separately for bodo and non-bodowomen.
5. Incidents of less domestic violence in both the towns indicate thatwomen are not physically humiliated.
6. It is observed that there is a wide difference between EquallyDistributed Literacy Index (EDLI) and Equally Distributed WorkParticipation Index (EDWPI) in two towns. The EDLI values aremuch higher than EDWPI which means that most of the literatewomen in these two towns are having very low work participationrate. If we rank towns as per GDI value it is clear that Kokrajhar(MB) town is ahead of Salakati (CT) town. In other words, genderdisparity is more prominent in Kokrajhar town with respect toliteracy rate, work participation rate and earned income.
7. The various components of GEM reveal that women’s economicindependence is significantly lower than their political participationwith respect to their male counterparts in case of both the towns.The greater GEM value of Kokrajhar town divulges the fact thatwomen of Kokrajhar are more empowered than their counterpartof salakati town.
8. In case of educational qualification, though the total number ofhighly qualified women is more in Kokrajhar (MB) but the womenof Salakati (CT) are found as being more qualified than their malecounterparts in comparison to women of Kokrajhar (MB) town.
Acknowledgement
This paper is an outcome of the project work funded by ICSSR New Delhi vide F/NoF/NO 02/15/2017-18/RP/Major. The author is thankful to the funding agency forawarding and sponsoring the project and his institution Central Institute of TechnologyKokrajhar for providing necessary support while carrying out this project work.
References
Census of India (2011). Assam, District Census Hand Book, Kokrajhar Part A& Part B:Village & Town Directory (accessed through http://censusindia.gov.in/)

28 Pradip Brahmachary
Dolly Phukon, (2008). “Gender Development Approach and Social Protection:Understanding the Case of Assam”, The Indian Journal of Political Science, Vol. 69,No. 4, pp. 771-785.
G.M Antony and K. V. Rao (2007). “A Composite Index to Explain Variations in Poverty,Health, Nutritional Status and Standard of Living: Use of Multivariate StatisticalMethods”, Journal of Royal Institute of Public Health, Vol. 121, pp. 578-587.
K.C. Mandal (2013). “Concept and Types of Women Empowerment” International Forumof Teaching and Studies , Vol. 9 No. 2, 2013).
Kamla Gupta & P. PrincyYesudian (2006). “Evidence of women’s empowerment in India: astudy of socio-spatial disparities” Geo Journal 65: 365–380 Springer.
M. S. Bartlett (1954). “A note on the multiplying factors for various chi square approximations”Journal of the Royal Statistical Society, 16 (Series B), 296-8.
Nipan Haloi (2015). “Women Empowerment: A brief overview in the context of Assam”,International Journal of Humanities & Social Science Studies (IJHSSS) A Peer-Reviewed Bi-monthly Bi-lingual Research Journal ISSN: 2349-6959 (Online), ISSN:2349-6711 (Print) Volume-II, Issue-II, September Website: http://www.ijhsss.com)
Purusottam Nayak & Bidisha Mahanta (2009). “Women Empowerment inIndia”, MPRA Paper 12685, University Library of Munich, Germany.
Sabahat Akram, Imrab Shaheen, Safina Mansha Kiyyani (2015). “Socio-EconomicEmpowerment of Women through Micro Enterprises: a case study of Ajad Jammuand Kashmir” European Scientific Journal August 2015 edition vol.11, No.22 ISSN:1857 – 7881 (Print) e - ISSN 1857- 7431 accessed on 25th June 2018 from https://eujournal.org/index.php/esj/article/view/6054/5831)
Shiba Ram Narzary, (2014). ”Empowerment of Bodo Women in Kokrajhar District ofAssam” accessed from (http://www.academia.edu/27484960/Empowerment_of_Bodo_Women_in_Kokrajhar_District_of_Assam_India on 29th Aug, 2017)
Sunita Roy, (2014). “Women Empowerment towards achieving Gender Equality”, IndianJournal of Public Administration 580 / Vol. IX, no. 3, July-September 2014.
UNDP (2007). “Measuring Human Development – A Primer: Guidelines and Tools forstatistical Research, Analysis and Advocacy”, (accessed on 5 November 2009 http://hdr.undp.org/en/nhdr/support/primer/).
V. Antony (2006). Education and employment: The key to women’s empowerment.Kurukshetra, February, a Monthly Journal of Ministry.