socio economic overview - reef catchments
TRANSCRIPT
Socio Economic Overview
NATURALRESOURCE MANAGEMENTPLANMACKAY WHITSUNDAY ISAAC
MACKAY WHITSUNDAY ISAAC
SUPPORTED BY: AUSTRALIAN GOVERNMENT AND REEF CATCHMENTS
MACKAY WHITSUNDAY ISAAC SOCIO ECONOMIC OVERVIEW
Summ
ary 1DemographicOverview
22.1 Community Capacity
2.2 Employment
EconomicOverview
3Mining 3.1
Primary Industry 3.2
Sugar 3.2.1
Beef Grazing 3.2.2
Horticulture 3.2.3
Forestry 3.3
Tourism 3.4
Recreation 3.5
Economic Infrastructure 3.6
4.1 Increased Climatic Variability
4Drivers future change
5Implicationsfor planning
6
4.2 Population Growth
4.3 Income Growth
4.4 Energy Prospects and Risks
4.5 Food Consumption
4.5.1 Beef
4.5.2 Sugar
4.5.3 Horticulture
4.5.4 Tourism
References
NATURALRESOURCE MANAGEMENTPLANMACKAY WHITSUNDAY ISAAC
1. SummaryDemography:• Population (currently around 140,000) is expected to grow 47% by 2031. Focus areas will be coastal zone and
!ow-on growth attributable to major mining projects (largely located outside the actual region).• Analysis of socio-economic capacity indicates the major di"erence between the State and the region is
in education attainment where education in the region matches regional needs of economy (less tertiary educated, more trades).
Economy:• The local economy is dominated by the primary industry sector and the !ow-on impacts of mining in the
broader region (e.g. the provision of inputs and labour for the sector). But mining has signi#cant “leakage” of bene#ts out of region due to FIFO, DIDO, limited inputs from local businesses etc.
• High wages in mining and related sectors creating di$culties to attract labour into lower paying sectors (e.g. primary industries, tourism).
• Primary industry employment almost 1.5 times as important as State average, but relative importance declining.
• Tourism regionally signi#cant, particularly in coastal zone (Whitsundays).
Future Socio-Economic Drivers:• Signi#cant population growth will trigger more intensive land use in coastal zone (urban, peri-urban), and
intensive settlement.• Region will maintain international competitive advantage in services to mining in the broader region.
Expect more production growth (but at a slower rate), more ship movements, but less of a need for port infrastructure augmentation.
• Northern Australia has a competitive advantage in beef and international markets growing fast. Expect gradual intensi#cation of the sector.
• Sugar will struggle to capture a major share of world growth in production as region is relatively high cost on world standings. Expect negligible growth in the medium term.
• Horticulture is currently small, but region may grow as domestic market grows and counter-seasonal opportunities expand. Major processing and value adding unlikely in short-term as Australia is a very high cost processing region.
• Tourism will slowly recover, but major growth in international market in the short to medium-term unlikely due to global economy and high Australian dollar.
Socio-economic drivers also need to be considered within a broader context of physical drivers of change, particularly climate change.
NATURALRESOURCE MANAGEMENTPLANMACKAY WHITSUNDAY ISAAC
MACKAY WHITSUNDAY ISAAC SOCIO ECONOMIC OVERVIEW
SUPPORTED BY: AUSTRALIAN
GOVERNMENT AND REEF CATCHMENTS
Implications for the NRM Plan:• Land use change in coastal zone and mining hot spots. This will result in losses of biodiversity and new
sources of water pollutants.• Land use intensi#cation, particularly in beef production areas, and to a lesser extent in sugar and horticulture
areas. This will result in more erosion and chemical runo" unless well managed.• Population growth and tourism trigger greater demand for nature-based recreation and tourism. This
reinforces the need to manage tradeo"s between short-term development and long-term sustainability. • Regional growth may languish in a post mining boom era. Creates limitations of #nancial resources, but
reduces pressures on natural asset base.• Climate change may impact on some sectors, with the majority of impacts being negative.
Policy Responses - Critical Need For:• Biodiversity protection to mitigate losses from land use change (including o"sets).• Multiple actions to address waterway health and water quality.• Risk management in shipping movements.• Risk management and adaptation to climate change.
2. Demographic Overview
NATURALRESOURCE MANAGEMENTPLANMACKAY WHITSUNDAY ISAAC
MACKAY WHITSUNDAY ISAAC SOCIO ECONOMIC OVERVIEW
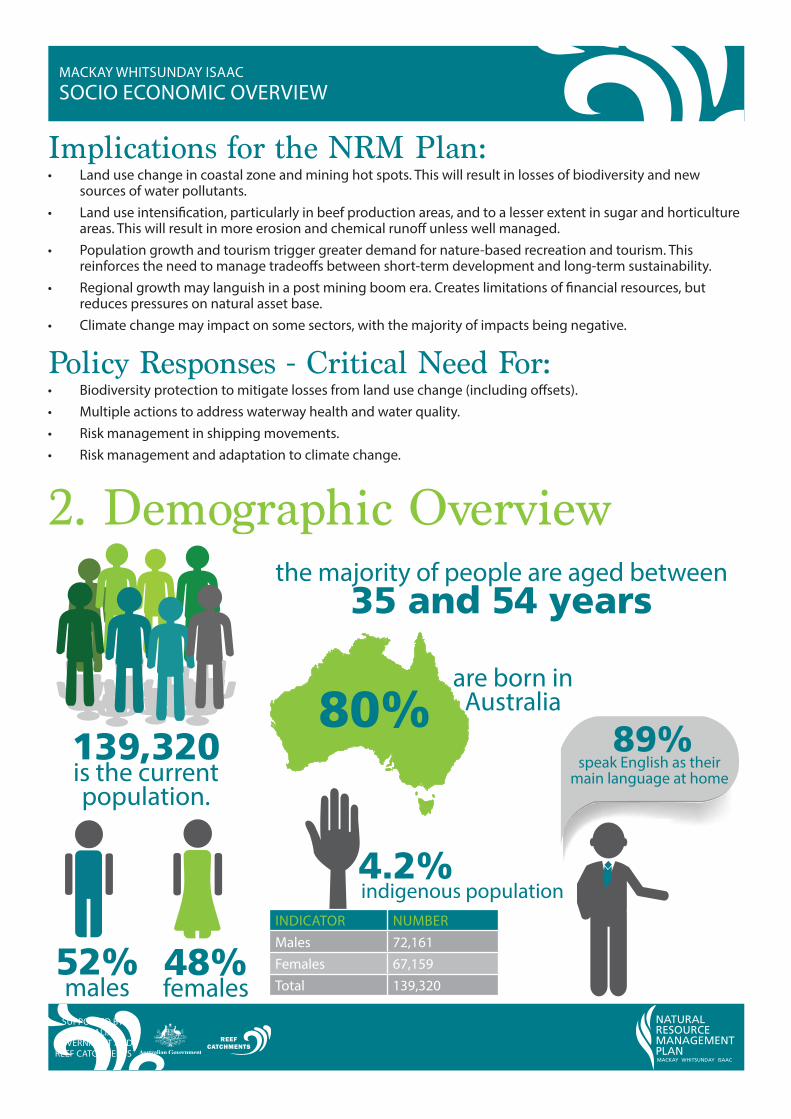
139,320is the current population.
52%males
INDICATOR NUMBERMales 72,161Females 67,159Total 139,320
48%females
the majority of people are aged between35 and 54 years
80%are born in
Australia
speak English as their main language at home
89%
indigenous population4.2%
SUPPORTED BY: AUSTRALIAN
GOVERNMENT AND REEF CATCHMENTS
2. Demographic Overview (cont.)
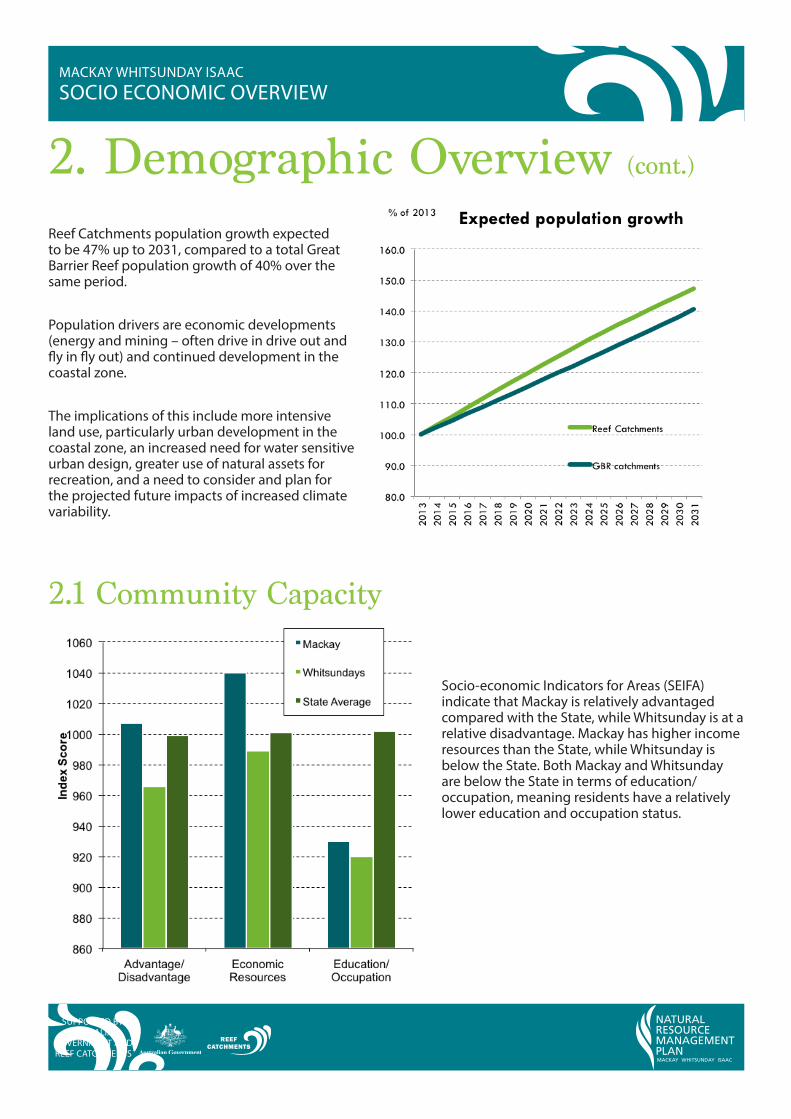
Reef Catchments population growth expected to be 47% up to 2031, compared to a total Great Barrier Reef population growth of 40% over the same period.
Population drivers are economic developments (energy and mining – often drive in drive out and !y in !y out) and continued development in the coastal zone.
The implications of this include more intensive land use, particularly urban development in the coastal zone, an increased need for water sensitive urban design, greater use of natural assets for recreation, and a need to consider and plan for the projected future impacts of increased climate variability.
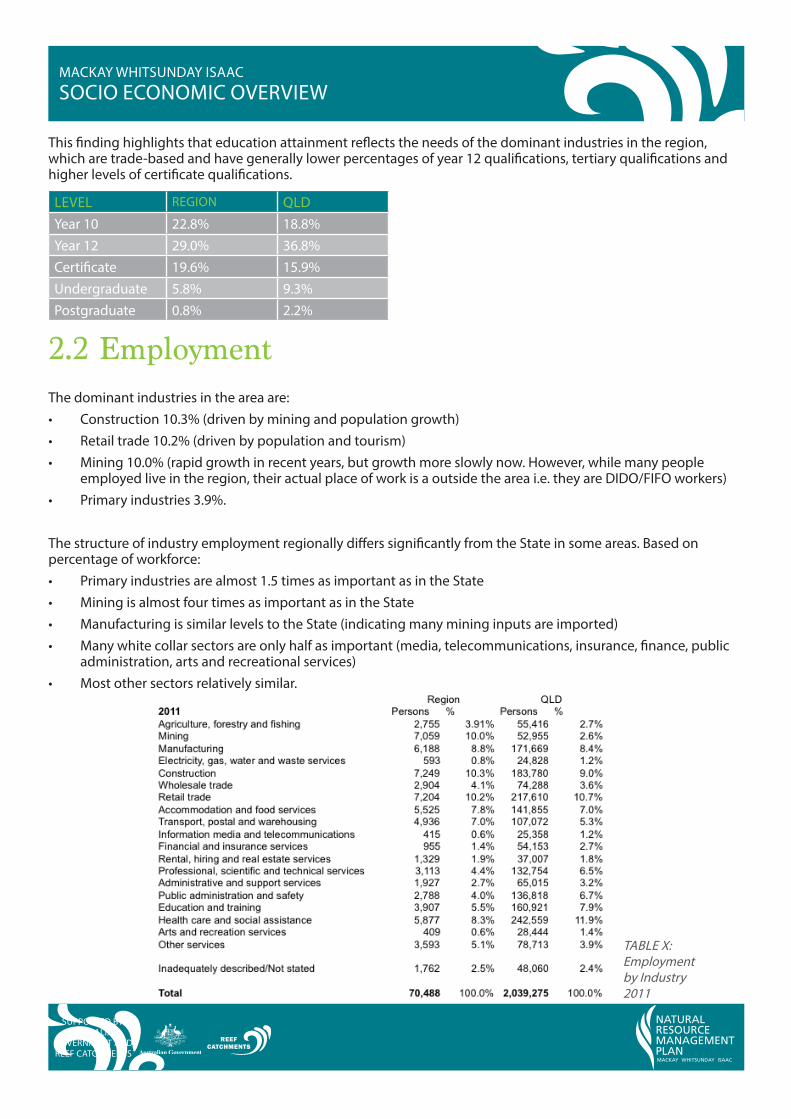
2.1 Community Capacity
Socio-economic Indicators for Areas (SEIFA) indicate that Mackay is relatively advantaged compared with the State, while Whitsunday is at a relative disadvantage. Mackay has higher income resources than the State, while Whitsunday is below the State. Both Mackay and Whitsunday are below the State in terms of education/occupation, meaning residents have a relatively lower education and occupation status.
NATURALRESOURCE MANAGEMENTPLANMACKAY WHITSUNDAY ISAAC
MACKAY WHITSUNDAY ISAAC SOCIO ECONOMIC OVERVIEW
SUPPORTED BY: AUSTRALIAN
GOVERNMENT AND REEF CATCHMENTS
This #nding highlights that education attainment re!ects the needs of the dominant industries in the region, which are trade-based and have generally lower percentages of year 12 quali#cations, tertiary quali#cations and higher levels of certi#cate quali#cations.
LEVEL REGION QLDYear 10 22.8% 18.8%Year 12 29.0% 36.8%Certi#cate 19.6% 15.9%Undergraduate 5.8% 9.3%Postgraduate 0.8% 2.2%
2.2 EmploymentThe dominant industries in the area are:• Construction 10.3% (driven by mining and population growth)• Retail trade 10.2% (driven by population and tourism)• Mining 10.0% (rapid growth in recent years, but growth more slowly now. However, while many people
employed live in the region, their actual place of work is a outside the area i.e. they are DIDO/FIFO workers)• Primary industries 3.9%.
The structure of industry employment regionally di"ers signi#cantly from the State in some areas. Based on percentage of workforce:• Primary industries are almost 1.5 times as important as in the State• Mining is almost four times as important as in the State• Manufacturing is similar levels to the State (indicating many mining inputs are imported)• Many white collar sectors are only half as important (media, telecommunications, insurance, #nance, public
administration, arts and recreational services)• Most other sectors relatively similar.
NATURALRESOURCE MANAGEMENTPLANMACKAY WHITSUNDAY ISAAC
MACKAY WHITSUNDAY ISAAC SOCIO ECONOMIC OVERVIEW
TABLE X: Employment by Industry 2011
SUPPORTED BY: AUSTRALIAN
GOVERNMENT AND REEF CATCHMENTS
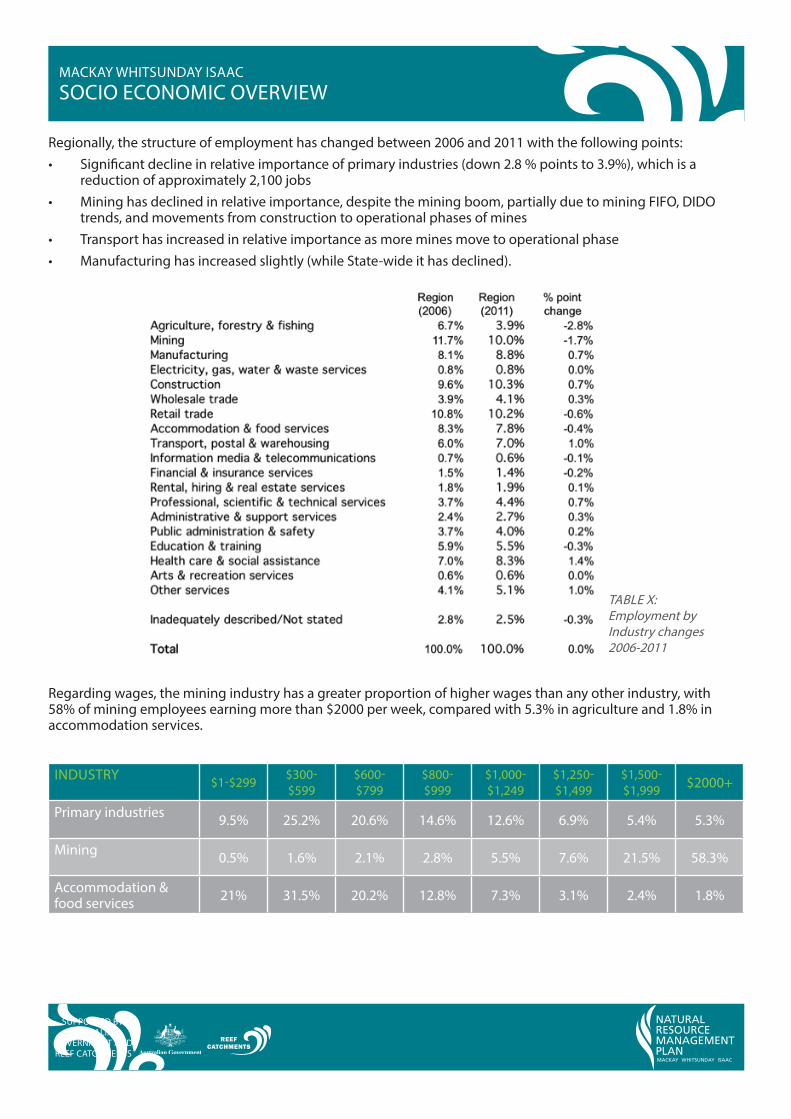
Regionally, the structure of employment has changed between 2006 and 2011 with the following points:• Signi#cant decline in relative importance of primary industries (down 2.8 % points to 3.9%), which is a
reduction of approximately 2,100 jobs• Mining has declined in relative importance, despite the mining boom, partially due to mining FIFO, DIDO
trends, and movements from construction to operational phases of mines• Transport has increased in relative importance as more mines move to operational phase• Manufacturing has increased slightly (while State-wide it has declined).
Regarding wages, the mining industry has a greater proportion of higher wages than any other industry, with 58% of mining employees earning more than $2000 per week, compared with 5.3% in agriculture and 1.8% in accommodation services.
INDUSTRY $1-$299 $300- $599
$600- $799
$800- $999
$1,000-$1,249
$1,250-$1,499
$1,500- $1,999 $2000+
Primary industries 9.5% 25.2% 20.6% 14.6% 12.6% 6.9% 5.4% 5.3%
Mining 0.5% 1.6% 2.1% 2.8% 5.5% 7.6% 21.5% 58.3%
Accommodation & food services 21% 31.5% 20.2% 12.8% 7.3% 3.1% 2.4% 1.8%
NATURALRESOURCE MANAGEMENTPLANMACKAY WHITSUNDAY ISAAC
MACKAY WHITSUNDAY ISAAC SOCIO ECONOMIC OVERVIEW
TABLE X: Employment by Industry changes 2006-2011
SUPPORTED BY: AUSTRALIAN
GOVERNMENT AND REEF CATCHMENTS
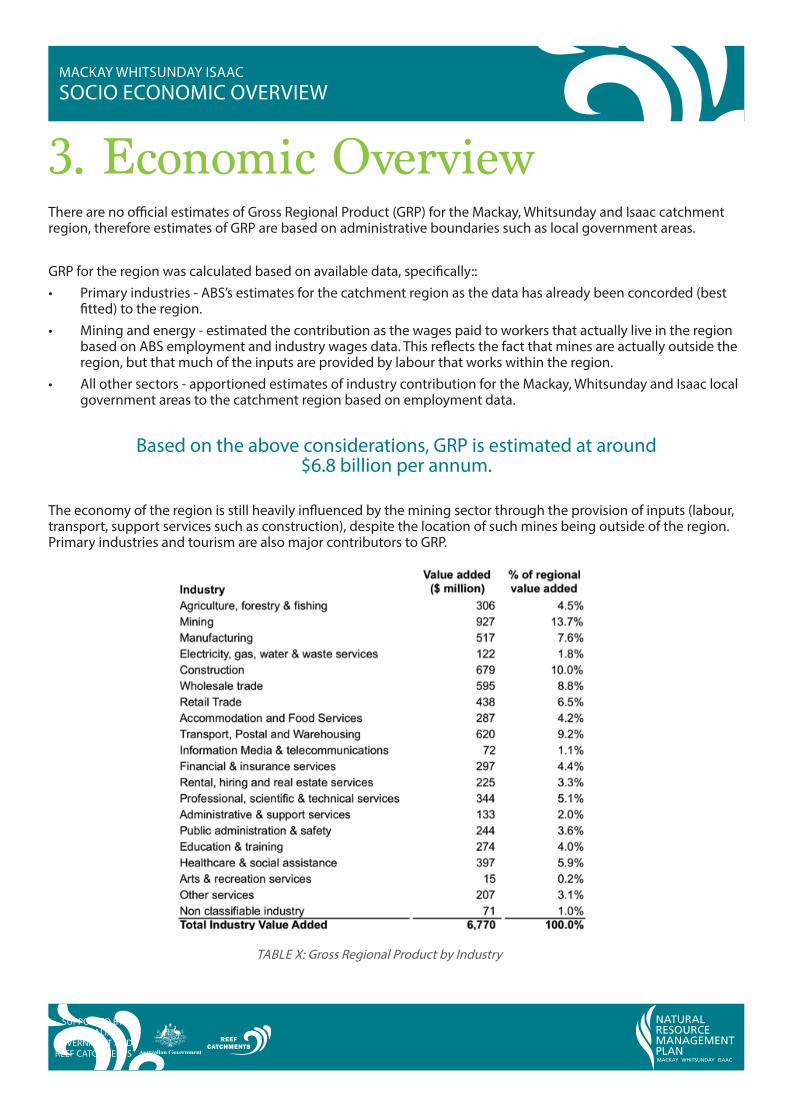
3. Economic OverviewThere are no o$cial estimates of Gross Regional Product (GRP) for the Mackay, Whitsunday and Isaac catchment region, therefore estimates of GRP are based on administrative boundaries such as local government areas.
GRP for the region was calculated based on available data, speci#cally::• Primary industries - ABS’s estimates for the catchment region as the data has already been concorded (best
#tted) to the region.• Mining and energy - estimated the contribution as the wages paid to workers that actually live in the region
based on ABS employment and industry wages data. This re!ects the fact that mines are actually outside the region, but that much of the inputs are provided by labour that works within the region.
• All other sectors - apportioned estimates of industry contribution for the Mackay, Whitsunday and Isaac local government areas to the catchment region based on employment data.
Based on the above considerations, GRP is estimated at around $6.8 billion per annum.
The economy of the region is still heavily in!uenced by the mining sector through the provision of inputs (labour, transport, support services such as construction), despite the location of such mines being outside of the region. Primary industries and tourism are also major contributors to GRP.
NATURALRESOURCE MANAGEMENTPLANMACKAY WHITSUNDAY ISAAC
MACKAY WHITSUNDAY ISAAC SOCIO ECONOMIC OVERVIEW
TABLE X: Gross Regional Product by Industry
SUPPORTED BY: AUSTRALIAN
GOVERNMENT AND REEF CATCHMENTS
3.1 MiningAlthough there is little mining undertaken directly within the NRM Plan boundary, mining activity in the broader region has a signi#cant impact on the economy of the area through:• Employment – many miners employed in the broader region actually live within the boundaries of the NRM
Plan region.• Signi#cant upstream and downstream economic activity (particularly relating to transport and logistics,
construction activity etc.).• While signi#cant economic value ascribed to mining, linkages with regional economy are often relatively
weak as many inputs are imported (including FIFO/DIDO labour) and product is exported with minimal value adding.
Coal mines in the broader region produced around 92,000,000 metric tonnes of coal in 2012, of which 80% of net production is coking coal. This coal is predominantly exported via the region and Hay Point and Dalrymple Bay Coal Terminals south of Mackay.
Several new mining and mining infrastructure projects are underway at various stages of development. The degree and pace to which these projects develop and a"ect the region will be dependent on domestic and international market conditions.
3.2 Primary IndustryPrimary industry businesses comprise the majority of land use in the NRM Plan region.
There are 1,521 agricultural businesses in the region. Of these, 1,014 are cropping businesses (primarily sugar), 27 are horticultural and 715 are grazing businesses.
The region accounts for approximately 5% of the State’s total agricultural businesses, approximately 8% of the State’s cropping businesses, approximately 3% of the State’s grazing businesses and less than 1% of horticultural businesses (although Bowen just north of the NRM Plan boundary comprises a large percentage of horticultural enterprises).
Agriculture in the region is clearly an integral component of Queensland’s agricultural production.
NATURALRESOURCE MANAGEMENTPLANMACKAY WHITSUNDAY ISAAC
MACKAY WHITSUNDAY ISAAC SOCIO ECONOMIC OVERVIEW
SUPPORTED BY: AUSTRALIAN
GOVERNMENT AND REEF CATCHMENTS
3.2.1 Sugar
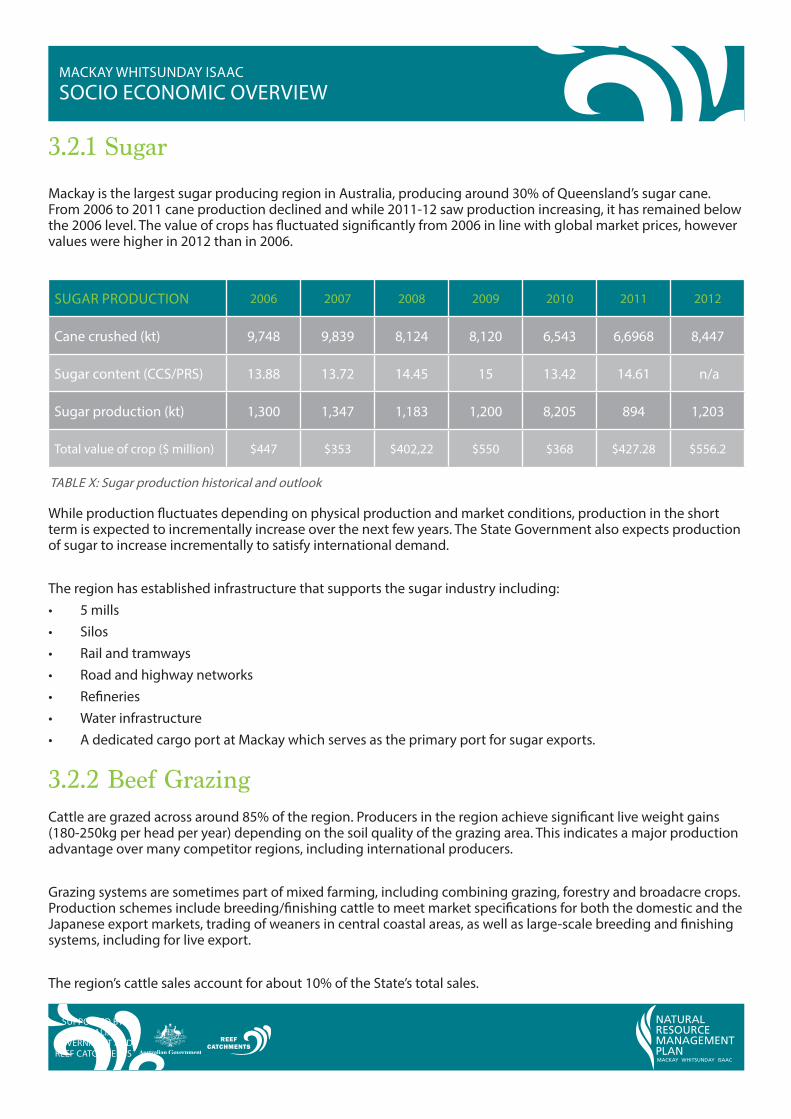
Mackay is the largest sugar producing region in Australia, producing around 30% of Queensland’s sugar cane. From 2006 to 2011 cane production declined and while 2011-12 saw production increasing, it has remained below the 2006 level. The value of crops has !uctuated signi#cantly from 2006 in line with global market prices, however values were higher in 2012 than in 2006.
SUGAR PRODUCTION 2006 2007 2008 2009 2010 2011 2012
Cane crushed (kt) 9,748 9,839 8,124 8,120 6,543 6,6968 8,447
Sugar content (CCS/PRS) 13.88 13.72 14.45 15 13.42 14.61 n/a
Sugar production (kt) 1,300 1,347 1,183 1,200 8,205 894 1,203
Total value of crop ($ million) $447 $353 $402,22 $550 $368 $427.28 $556.2
While production !uctuates depending on physical production and market conditions, production in the short term is expected to incrementally increase over the next few years. The State Government also expects production of sugar to increase incrementally to satisfy international demand.
The region has established infrastructure that supports the sugar industry including:• 5 mills• Silos• Rail and tramways• Road and highway networks• Re#neries• Water infrastructure• A dedicated cargo port at Mackay which serves as the primary port for sugar exports.
3.2.2 Beef GrazingCattle are grazed across around 85% of the region. Producers in the region achieve signi#cant live weight gains (180-250kg per head per year) depending on the soil quality of the grazing area. This indicates a major production advantage over many competitor regions, including international producers.
Grazing systems are sometimes part of mixed farming, including combining grazing, forestry and broadacre crops. Production schemes include breeding/#nishing cattle to meet market speci#cations for both the domestic and the Japanese export markets, trading of weaners in central coastal areas, as well as large-scale breeding and #nishing systems, including for live export.
The region’s cattle sales account for about 10% of the State’s total sales.
NATURALRESOURCE MANAGEMENTPLANMACKAY WHITSUNDAY ISAAC
MACKAY WHITSUNDAY ISAAC SOCIO ECONOMIC OVERVIEW
TABLE X: Sugar production historical and outlook
SUPPORTED BY: AUSTRALIAN
GOVERNMENT AND REEF CATCHMENTS
3.2.3 Horticulture
Whitsunday council region represents about 18% of Queensland’s annual horticultural production area, although the majority of production occurs around Bowen slightly north of the NRM Plan boundary. This intensively productive region produces approximately 58% of the State’s capsicum, 38% of tomatoes, and 41% of the State’s beans.
Within the region exist primarily perennial horticultural crops including mangoes, lychees, bananas, pineapples, macadamia nuts, lemon myrtle, co"ee and lime.
Approximately 75% of horticultural crops are transported to Brisbane for nationwide distribution, while 25% are transported to Townsville.
3.3 ForestryThere are approximately 0.5 million ha of national park and state forests across the region.
The Region produces less than 5% of Queensland’s hardwood and less than 1% of the State’s softwood timber and there are several small timber processing facilities in the region.
Damage from cyclones and disease have triggered land use change from coastal forestry plantations into sugar cane or grazing, although demand for timber is expected to remain strong in medium-long term.
3.4 TourismTourism is a regionally signi#cant sector that is highly reliant on the condition of natural assets to underpin the tourist experience.
In 2012/13 the region had approximately 1.45 million visitors that stayed around 6 million nights in the region, spending around $1.2 billion.
Tourism data is not collected or collated for the NRM Plan region speci#cally, but the Mackay and Whitsundays regions provide a good proxy indicator.
Domestic and international sectors are often signi#cantly di"erent in terms of drivers of visitation. Recent years have been di$cult for the sector as inbound international visitation has been slow moving as a result of the global #nancial crisis and a high Australian dollar pricing Australia out of many markets.
The domestic market has fared better, however much of the demand for overnight guests nights has been business related. Also, the high Australian dollar has meant many Australians are holidaying overseas, rather than taking domestic holidays in the GBR region.
NATURALRESOURCE MANAGEMENTPLANMACKAY WHITSUNDAY ISAAC
MACKAY WHITSUNDAY ISAAC SOCIO ECONOMIC OVERVIEW
SUPPORTED BY: AUSTRALIAN
GOVERNMENT AND REEF CATCHMENTS
Whitsunday council region represents about 18% of Queensland’s annual horticultural production area, although the majority of production occurs around Bowen slightly north of the NRM Plan boundary. This intensively productive region produces approximately 58% of the State’s capsicum, 38% of tomatoes, and 41% of the State’s beans.
REGION VISITORS NIGHTSLENGTH OF STAY (NIGHTS)
HOLIDAY (%)
VISIT FRIENDS & RELATIVES
(%)
BUSINESS (%)
EXPENDITURE ($ MILLION)
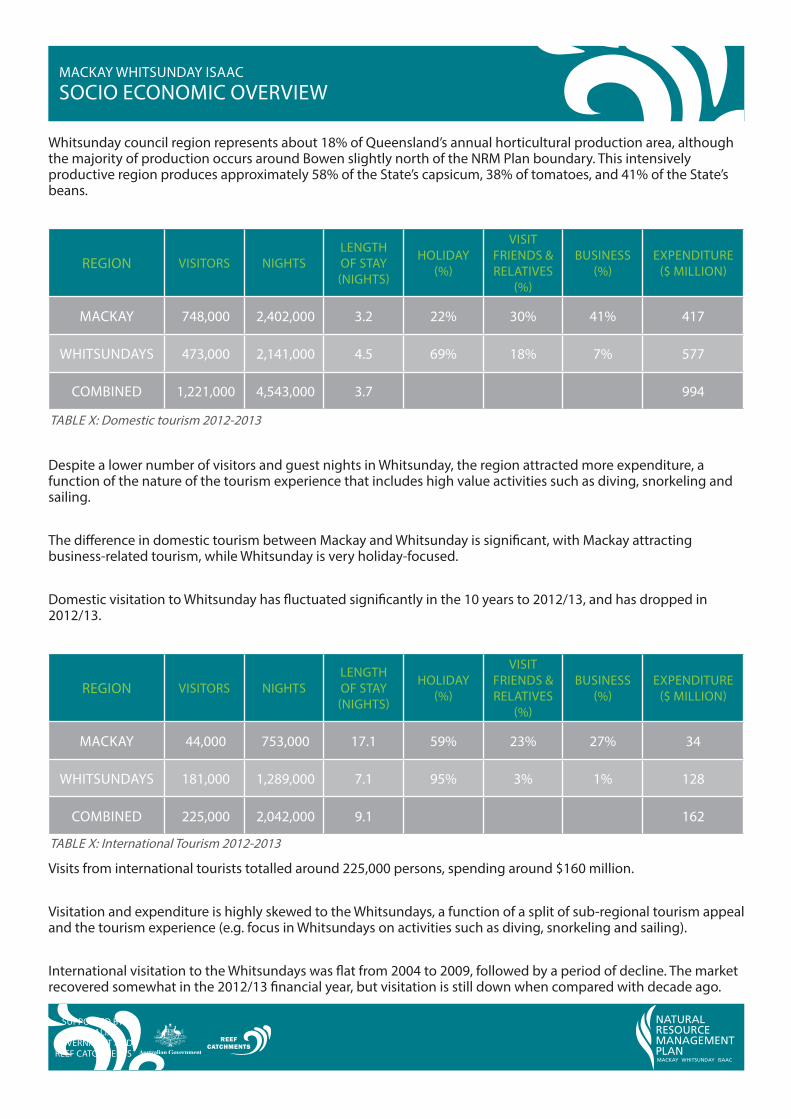
MACKAY 748,000 2,402,000 3.2 22% 30% 41% 417
WHITSUNDAYS 473,000 2,141,000 4.5 69% 18% 7% 577
COMBINED 1,221,000 4,543,000 3.7 994
Despite a lower number of visitors and guest nights in Whitsunday, the region attracted more expenditure, a function of the nature of the tourism experience that includes high value activities such as diving, snorkeling and sailing.
The di"erence in domestic tourism between Mackay and Whitsunday is signi#cant, with Mackay attracting business-related tourism, while Whitsunday is very holiday-focused.
Domestic visitation to Whitsunday has !uctuated signi#cantly in the 10 years to 2012/13, and has dropped in 2012/13.
REGION VISITORS NIGHTSLENGTH OF STAY (NIGHTS)
HOLIDAY (%)
VISIT FRIENDS & RELATIVES
(%)
BUSINESS (%)
EXPENDITURE ($ MILLION)
MACKAY 44,000 753,000 17.1 59% 23% 27% 34
WHITSUNDAYS 181,000 1,289,000 7.1 95% 3% 1% 128
COMBINED 225,000 2,042,000 9.1 162
Visits from international tourists totalled around 225,000 persons, spending around $160 million.
Visitation and expenditure is highly skewed to the Whitsundays, a function of a split of sub-regional tourism appeal and the tourism experience (e.g. focus in Whitsundays on activities such as diving, snorkeling and sailing).
International visitation to the Whitsundays was !at from 2004 to 2009, followed by a period of decline. The market recovered somewhat in the 2012/13 #nancial year, but visitation is still down when compared with decade ago.
NATURALRESOURCE MANAGEMENTPLANMACKAY WHITSUNDAY ISAAC
MACKAY WHITSUNDAY ISAAC SOCIO ECONOMIC OVERVIEW
TABLE X: Domestic tourism 2012-2013
TABLE X: International Tourism 2012-2013
SUPPORTED BY: AUSTRALIAN
GOVERNMENT AND REEF CATCHMENTS
A major survey of over 2,600 tourists undertaken for the Social and Economic Long-Term Monitoring Program found that:• Visiting the GBR and/or diving or snorkelling was the main reason for visitation across the GBR catchments
for 21% of all visitors. A further 58% of visitors state the reasons were for holidays and/or a combination of reasons that included holidays.
• The activities undertaken most by visitors include: snorkeling and scuba diving (37% of all visitors), relaxing (12%), walking (8%) and swimming (7%). Data indicates that activities that are highly reliant on the natural environment (snorkeling, diving, swimming, walking, #shing etc) for over two-thirds of the main reasons for visitation to the GBR catchments.
• Visitor surveys indicate the perceived quality of nature-based experiences in the GBR is very high.• Tourism operators are acutely aware of the importance of the condition of the GBR and other natural assets
to their long-term viability.
3.5 RecreationThe natural assets in the Region also provide signi#cant recreational bene#ts to residents. A major survey of residents undertaken for the Social and Economic Long-Term Monitoring Program found that for the Mackay Whitsunday region:• Major activities associated with the marine environment included visiting beaches (51% of visitors), going
beyond the beaches into the marine environment (70%), snorkeling/diving (24%), #shing (28%) boating or sailing (17%), non-motorised water sports such as kayaking (7%).
• Other activities included hiking/walking (40% of local visitors), camping (3%).• People are prepared to travel relatively long distances for recreational activates (e.g. 90km to the beach).
Recreational expenditure can make a signi#cant economic contribution (e.g. annual recreational #shing expenditure in Mackay Whitsundays is estimated at $38.8 million).
3.6 Economic InfrastructureThe Region is serviced by signi#cant economic infrastructure including:• Airports: Mackay airport, Whitsunday airport.• Extensive rail network servicing Brisbane to Cairns, Mackay Harbour, Marian Hill, North Mackay, Mackay
Hinterland. • Goonyella coal system servicing coal terminals at Hay Point and Dalrymple Bay.• Rail networks service both the agricultural sector (predominantly sugar industry) and the mining sector.• Extensive road and highway network servicing non-commercial and commercial uses. Road network is
subject to !ooding, and there are issues with agricultural transportation from limited watercourse crossings on some networks.
• Telecommunications in the region do not adequately service the population, with issues such as inconsistent mobile phone coverage in rural areas of the region.
NATURALRESOURCE MANAGEMENTPLANMACKAY WHITSUNDAY ISAAC
MACKAY WHITSUNDAY ISAAC SOCIO ECONOMIC OVERVIEW
SUPPORTED BY: AUSTRALIAN
GOVERNMENT AND REEF CATCHMENTS
4. Drivers of Future ChangeThe Region faces a number of signi#cant changes in the coming years including increased climatic variability and additional pressures on the natural resource base attributable to socio-economic factors.
The regional already has a number of dominant economic activities that rely on and potentially a"ect the extent and condition of key natural resources. This includes primary industries, urban development, and tourism.
Much of the change in land use is derived from demand attributable to other socio-economic factors (e.g. population growth, energy demand growth and food demand growth).
Based on such factors it is therefore important to understand the key demand drivers that may result in changes in resource use and the extent to which the Region could meet that demand growth within an internationally competitive economy.
4.1 Increased Climate VariabilityClimate change projections for the Region include:• Increased variability in key climate outcomes• Increasing temperatures (potentially up 4.2O C by 2070)• By 2070, Mackay may have 12 times the number of days over 35oC than is currently experienced• A range of rainfall changes from +17% to -35% by 2070• Annual potential evaporation could increase by 7-15% by 2070• More extreme weather events (rainfall, cyclones, storm surge, heatwaves, !ooding etc.)• The 1-in-100-year storm tide event is projected to increase by 36 cm in Mackay and 31 cm at Airlie Beach if
certain conditions eventuate. These conditions are a 30 cm sea-level rise, a 10 per cent increase in cyclone intensity and frequency, as well as a 130 km shift southwards in cyclone tracks
• Increased #re risk• Ocean acidityThese changes will have impacts on the biophysical base that underpins much of the economy of the region.
Climate change will also create a number of economic threats across the region, including:• Impacts on agricultural productivity due to extreme events. This will impact on farm incomes, debt levels,
land values and employment.• Impacts on resource condition (e.g. lower levels of groundcover) triggering further erosion and impacts on
downstream industries (e.g. higher water treatment costs).• Greater risks to private and public infrastructure (e.g. from !ooding) that will increase maintenance and
insurance costs and reduce asset values. • Negative impacts on biological diversity and the provision of ecosystems services (that have market and
non-market economic values). Furthermore, this may impact negatively on industries reliant on resource condition such as tourism, #shing, and recreation.
• Increased incidence of some diseases, increasing health costs and reducing labour productivity.
NATURALRESOURCE MANAGEMENTPLANMACKAY WHITSUNDAY ISAAC
MACKAY WHITSUNDAY ISAAC SOCIO ECONOMIC OVERVIEW
SUPPORTED BY: AUSTRALIAN
GOVERNMENT AND REEF CATCHMENTS
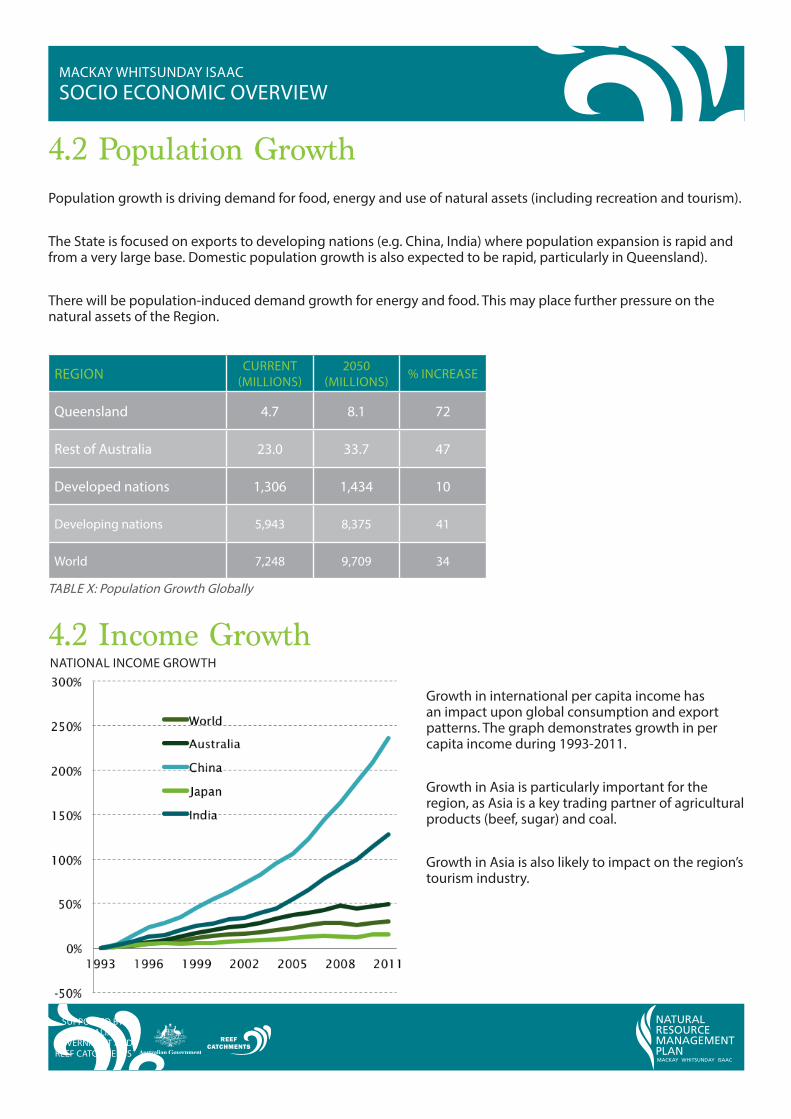
4.2 Population GrowthPopulation growth is driving demand for food, energy and use of natural assets (including recreation and tourism).
The State is focused on exports to developing nations (e.g. China, India) where population expansion is rapid and from a very large base. Domestic population growth is also expected to be rapid, particularly in Queensland).
There will be population-induced demand growth for energy and food. This may place further pressure on the natural assets of the Region.
REGION CURRENT (MILLIONS)
2050 (MILLIONS) % INCREASE
Queensland 4.7 8.1 72
Rest of Australia 23.0 33.7 47
Developed nations 1,306 1,434 10
Developing nations 5,943 8,375 41
World 7,248 9,709 34
4.2 Income Growth
Growth in international per capita income has an impact upon global consumption and export patterns. The graph demonstrates growth in per capita income during 1993-2011.
Growth in Asia is particularly important for the region, as Asia is a key trading partner of agricultural products (beef, sugar) and coal.
Growth in Asia is also likely to impact on the region’s tourism industry.
NATURALRESOURCE MANAGEMENTPLANMACKAY WHITSUNDAY ISAAC
MACKAY WHITSUNDAY ISAAC SOCIO ECONOMIC OVERVIEW
TABLE X: Population Growth Globally
NATIONAL INCOME GROWTH
SUPPORTED BY: AUSTRALIAN
GOVERNMENT AND REEF CATCHMENTS
4.4 Energy Prospects and RisksThe Region is already at the centre of the energy boom, and future focus of the region remains on export markets. The Region will be a major contributor to national growth including:• Black coal production increasing from 11,554 PJ to 18,390 PJ by 2035 and 17,973 PJ by 2050. Exports 97% of
production by 2050.• Gas production from 3,023 PJ to 8,595 PJ by 2050 (71% exports).
Developments to meet export demand will trigger signi#cant localised changes in land use from primarily grazing to infrastructure related to mines and energy.
NRM impacts include: increased vegetation clearing; increased erosion; increased runo" (sediments, nutrients and potentially other pollutants), and; increased transport (including shipping).
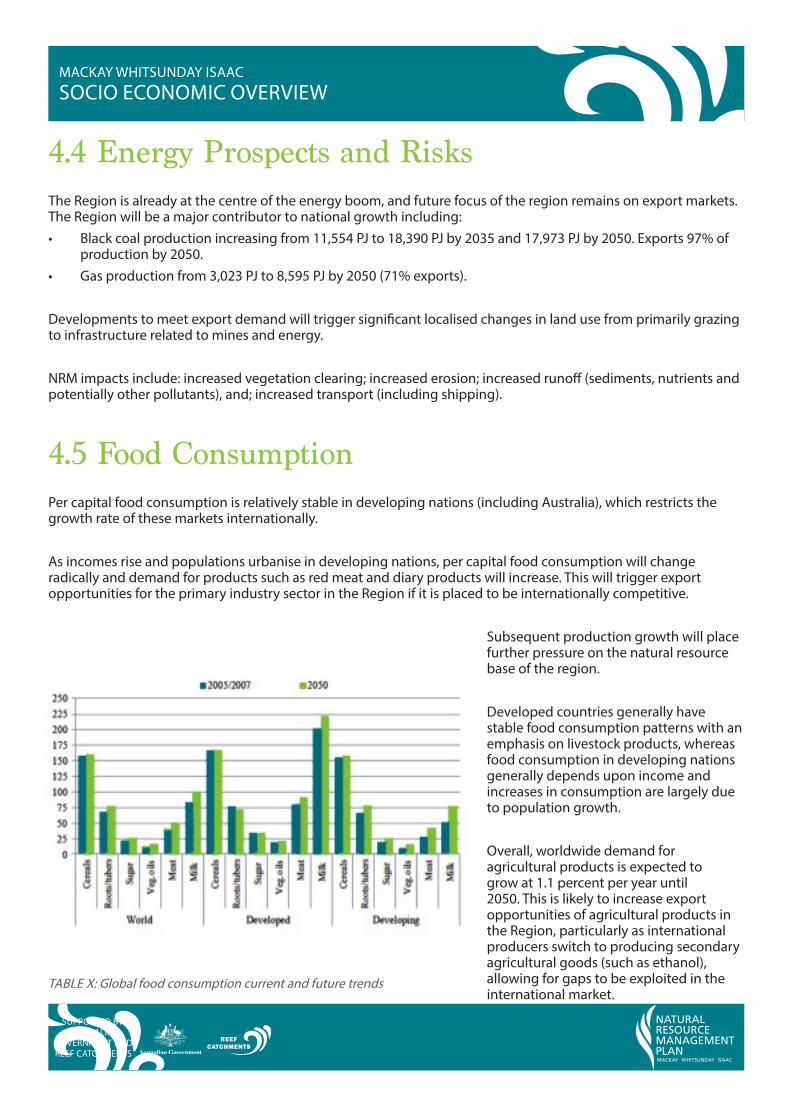
4.5 Food ConsumptionPer capital food consumption is relatively stable in developing nations (including Australia), which restricts the growth rate of these markets internationally.
As incomes rise and populations urbanise in developing nations, per capital food consumption will change radically and demand for products such as red meat and diary products will increase. This will trigger export opportunities for the primary industry sector in the Region if it is placed to be internationally competitive.
Subsequent production growth will place further pressure on the natural resource base of the region.
Developed countries generally have stable food consumption patterns with an emphasis on livestock products, whereas food consumption in developing nations generally depends upon income and increases in consumption are largely due to population growth.
Overall, worldwide demand for agricultural products is expected to grow at 1.1 percent per year until 2050. This is likely to increase export opportunities of agricultural products in the Region, particularly as international producers switch to producing secondary agricultural goods (such as ethanol), allowing for gaps to be exploited in the international market.
NATURALRESOURCE MANAGEMENTPLANMACKAY WHITSUNDAY ISAAC
SUPPORTED BY: AUSTRALIAN
GOVERNMENT AND REEF CATCHMENTS
MACKAY WHITSUNDAY ISAAC SOCIO ECONOMIC OVERVIEW
TABLE X: Global food consumption current and future trends
4.5.1 Beef
The north Queensland beef sector has a relatively signi#cant competitive advantage over many other exporting regions or countries.
Current competitiveness has been constrained by a high Australian dollar, but as the mining and energy sector boom slows the Australian dollar may weaken triggering further demand for beef exports.
Rapid growth in beef demand is expected, particularly in Asia, that will trigger trade.
Given the Region’s apparent competitive advantage in beef production, expansion of beef production for live exports should be expected. Such expansion will trigger expansion of current production areas, further intensi#cation of current land used for grazing and more fodder crops.
Associated NRM impacts may include increased vegetation clearing, increased erosion, increased runo" and increased transport (including shipping).
SOURCE OF DEMAND ESTIMATED CURRENT (‘000 TONNES)
ESTIMATED 2050 (‘000 TONNES) GROWTH RATE P.A.
World 67,343 106,600 1.2
Developing 36,435 74,585 1.9
4.5.2 Sugar
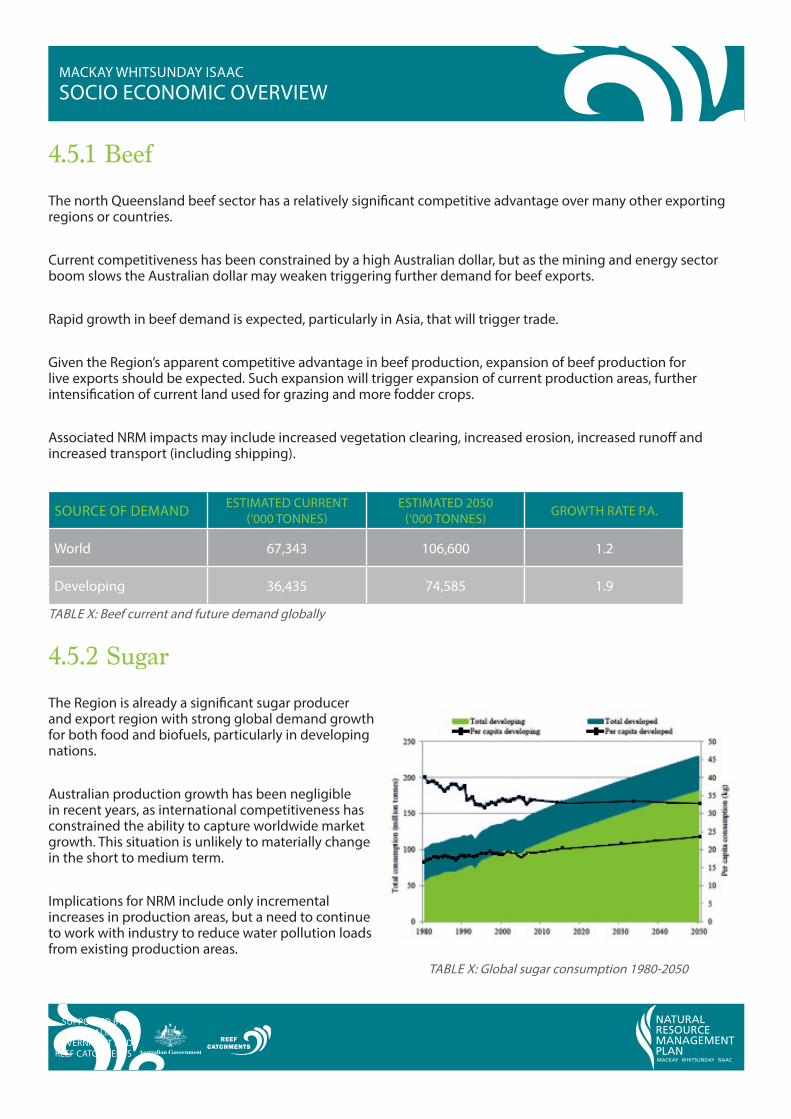
The Region is already a signi#cant sugar producer and export region with strong global demand growth for both food and biofuels, particularly in developing nations.
Australian production growth has been negligible in recent years, as international competitiveness has constrained the ability to capture worldwide market growth. This situation is unlikely to materially change in the short to medium term.
Implications for NRM include only incremental increases in production areas, but a need to continue to work with industry to reduce water pollution loads from existing production areas.
NATURALRESOURCE MANAGEMENTPLANMACKAY WHITSUNDAY ISAAC
MACKAY WHITSUNDAY ISAAC SOCIO ECONOMIC OVERVIEW
TABLE X: Beef current and future demand globally
TABLE X: Global sugar consumption 1980-2050
SUPPORTED BY: AUSTRALIAN
GOVERNMENT AND REEF CATCHMENTS
NATURALRESOURCE MANAGEMENTPLANMACKAY WHITSUNDAY ISAAC
MACKAY WHITSUNDAY ISAAC SOCIO ECONOMIC OVERVIEW
4.5.3 Horticulture
There is signi#cant interest in horticultural expansion in the Region, as the domestic market is growing with population. This constrains market growth prospects, but opportunities for counter seasonal production will slowly emerge.
The international market growing rapidly, but Australia lacks competitive advantage so signi#cant fresh product export growth is unlikely in short to medium term.
The food processing sector in Australia is actually declining due to lack of international competitiveness so there is no signi#cant processing occurring in the Region. The growth prospects in food processing is limited as the bulk of processing capacity is controlled by multinationals that choose production/processing locations based on world-wide production cost benchmarking.
Implications for NRM include maintaining/encouraging best practice and ensure best practice for any new developments (if any).
4.5.4 Tourism
Due to the aforementioned prevailing market pressures such as the global #nancial crisis and high Australian dollar, tourism has faced di$culty.
Although no regionally speci#c tourism forecasts are developed by tourism authorities, the Tourism Forecasting Committee forecasts domestic growth in activity of 0.8% p.a. until 2022 (roughly in line with population growth).
Prospects for international markets are better with fast growing international markets expected to be India (7.5% p.a.) and China (6.6% p.a.). However, the GBR and the NRM Plan region are not high-demand destinations for these international markets.
Implications for NRM include only limited growth in pressure on natural asset base directly from tourism activities, but importance of maintaining natural asset base to underpin tourism activity is paramount.
SUPPORTED BY: AUSTRALIAN
GOVERNMENT AND REEF CATCHMENTS
5. Implications for PlanningPhysical, economic and demographic drivers have implication for planning, and in using this review as a supporting document to the NRM Plan 2014-2024, the following should be considered:
• Planning should not be based on a ‘static’ understanding of the economy or community.• Planning should incorporate economic and demographic drivers of change in the region that exacerbate
threats to the regions natural assets (e.g. population-induced intensi#cation of coastal development increasing erosion).
• Industry structures and dynamics, demographics, and social attitudes all in!uence the willingness and ability of the region to adapt to climate change and other factors that may in!uence the long-term viability of the region.
Furthermore it is important to understand community and other stakeholders perception of drivers of change and access to accurate and up to date information, as their decisions will be based on these considerations (link to Stakeholder Engagement Document and Scenario Planning Workshop document).
NATURALRESOURCE MANAGEMENTPLANMACKAY WHITSUNDAY ISAAC
MACKAY WHITSUNDAY ISAAC SOCIO ECONOMIC OVERVIEW
SUPPORTED BY: AUSTRALIAN
GOVERNMENT AND REEF CATCHMENTS
6. References• Alexandratos, N. and J. Bruinsma. 2012. World agriculture towards 2030/2050: the 2012 revision. ESA Working
paper No. 12-03. Rome, FAO.
• Australian Bureau of Statistics (2012) 6306.0 - Employee Earnings and Hours, Australia, May 2012
• Australian Bureau of Statistics (2011) Basic Community Pro#le: Mackay-Whitsundays. Cat. No. 2001.0 from http://www.censusdata.abs.gov.au/census_services/getproduct/census/2011/communitypro#le/312?opendocument&navpos=230
• Australian Bureau of Statistics (2006) Basic Community Pro#le: Mackay-Whitsundays. Cat. No. 2001.0 from http://www.censusdata.abs.gov.au/ABSNavigation/prenav/ProductSearch?&areacode=340&producttype=Community%20Pro#les&action=401
• Australian Bureau of Statistics (2013) Socio-economic Indexes for Areas (SEIFA), 2011. Cat. No. 2033.0.55.001 from http://www.abs.gov.au/ausstats/[email protected]/mf/2033.0.55.001/
• Australian Bureau of Statistics (2012) Land Management and Farming in Australia, 2011-12. Cat. No. 4627.0 from http://www.abs.gov.au/ausstats/[email protected]/mf/4627.0
• Australian Bureau of Statistics (2011) National Regional Pro#le, 2007 to 2011. Cat. No. 1379.0.55.001 from http://www.abs.gov.au/ausstats/[email protected]/mf/1379.0.55.001
• Australian Government, Tourism Research Australia (2013) Forecast 2013 Issue 1. http://www.ret.gov.au/tourism/Documents/tra/Forecasts/2013/TFC_Forecast_2013_Issue_1_FINAL.pdf
• Australian Government, Tourism Research Australia (2013) Travel by Australians, March 2013. http://www.tra.gov.au/publications/publications-list-March-2013-Quarterly-Results-of-the-National-Visitor-Survey.html
• KPMG (2011) Australia’s Resources Boom: the Infrastructure Ripple E"ect. http://www.kpmg.com/AU/en/IssuesAndInsights/ArticlesPublications/Documents/australia-resources-boom-the-infrastructure-ripple-e"ect.pdf
• Mackay-Isaac-Whitsunday Regional Economic Development Corporation (2013) Economic Pro#le. https://www.mwredc.org.au/
• Mackay Conservation Group (2013) Coal Mining Expansion in CQ: A Dead End? www.mackayconservationgroup.org.au
• Mackay Regional Council (2013) Economic Development: Mining. http://www.mackay.qld.gov.au/business/economic_development/industries/mining
• North Queensland Bulk Ports Corporation (2013) Regional Developments: Impacts on Port of Mackay. http://www.mackay.qld.gov.au/__data/assets/pdf_#le/0012/98589/101028_Mackay_Freight_Summit_4_Mackay_Port_Norman.pdf
• North Queensland Bulk Ports Corporation (2013) Land Use Plan: Mackay Port. http://www.nqbp.com.au/wp-content/uploads/2012/04/PortofMackayLandUsePlan.pdf
• Queensland Government, Department of State Development, Infrastructure and Planning (2013) Queensland Ports Strategy: Draft for Consultation. http://www.dsdip.qld.gov.au/resources/plan/draft-qps-consultation.pdf
• Queensland Government, Department of Agriculture, Fisheries and Forestry (2013) Queensland Agricultural Land Audit: Mackay Whitsundays. http://www.da".qld.gov.au/environment/queensland-agricultural-land-audit
• Queensland Government, Department of Natural Resources and Mines (2013) Queensland’s Coal- Mines and
NATURALRESOURCE MANAGEMENTPLANMACKAY WHITSUNDAY ISAAC
MACKAY WHITSUNDAY ISAAC SOCIO ECONOMIC OVERVIEW
SUPPORTED BY: AUSTRALIAN
GOVERNMENT AND REEF CATCHMENTS
Advanced Projects. http://mines.industry.qld.gov.au/assets/coal-pdf/queensland-coal-mines-adv-projects-2013
• Queensland Treasury, o$ce of Economic and Statistical Research (2012) Population and Dwelling Pro#le: Mackay Regional Council. http://www.oesr.qld.gov.au/products/pro#les/pop-housing-pro#les-lga/pop-housing-pro#le-mackay.pdf
• Queensland Treasury, O$ce of Economic and Statistical Research (2011) Regional Pro#le: SA4 Mackay. http://statistics.oesr.qld.gov.au/qld-regional-pro#les
• Queensland Treasury, o$ce of Economic and Statistical Research (2011) Queensland Government Population Projections to 2031: Local Government Areas. http://www.oesr.qld.gov.au/products/publications/qld-govt-pop-proj-lga/index.php
• Queensland Government, Department of Transport and Main Roads (2013) Bruce Highway Upgrades from Bakers Creek to City Gates, Mackay. http://www.tmr.qld.gov.au/Projects/Name/B/Bruce-Highway-duplication-and-intersection-upgrades-from-Bakers-Creek-to-City-Gates-Mackay.aspx
• Queensland Government, Department of Transport and Main Roads (2008) Local Links In and Around the Mackay/Whitsunday Region. From http://webcache.googleusercontent.com/search?q=cache:DXzMrYJPvmkJ:www.tmr.qld.gov.au/~/media/communityandenvironment/Regional%2520information/Previous%2520regions/Region%2520local%2520links/Mackay%2520Whitsunday/mackaywhitsundayregionlocallinksapril2008v2.pdf+&cd=4&hl=en&ct=clnk
• Queensland Government, Department of Transport and Main Roads (2013), Mackay/Whitsunday Region. From http://www.tmr.qld.gov.au/Community-and-environment/Regional-information/Mackay-Whitsunday-Region.aspx
• Queensland Government, Department of Transport and Main Roads (2006) Mackay Area Integrated Transport Plan. From http://webcache.googleusercontent.com/search?q=cache:2sRjLoO65D0J:www.mackay.qld.gov.au/__data/assets/pdf_#le/0009/118638/DTMR_-_IRTP_Presentation.pdf+&cd=1&hl=en&ct=clnk
• Tourism Queensland (2013) Mackay Regional Snapshot. http://www.tq.com.au/research/destination-visitor-data/whitsundays-islands-of-great-barrier-reef-and-mackay/mackay/mackay_home.cfm
• Tourism Queensland (2013) Whitsundays Regional Snapshot. http://www.tq.com.au/research/destination-visitor-data/whitsundays-islands-of-great-barrier-reef-and-mackay/whitsundays/whitsundays_home.cfm
• Queensland Government, Department of Natural Resources and Mines (2013) Coal Statistics. From http://mines.industry.qld.gov.au/mining/coal-statistics.htm
• Reserve Bank of Australia (2013) Exchange Rate Data. From http://www.rba.gov.au/statistics/hist-exchange-rates/
• SELTMP (2013) Recreation
• SELTMP (2013) Tourism
• Woods, M. (2011) Coal Rail Project Delivers Jobs. From http://www.dailymercury.com.au/news/coal-rail-project-delivers-jobs/864710/
• World Bank (2013) Online Data: Incomes per Capita. http://search.worldbank.org/data?qterm=incomes+per+capita&language=EN&format=
• World Energy Council (2010) Survey of Energy Resources. http://www.worldenergy.org/documents/ser_2010_report_1.pdf
NATURALRESOURCE MANAGEMENTPLANMACKAY WHITSUNDAY ISAAC
MACKAY WHITSUNDAY ISAAC SOCIO ECONOMIC OVERVIEW
SUPPORTED BY: AUSTRALIAN
GOVERNMENT AND REEF CATCHMENTS