socio-economic impacts of forest industry change … · socio-economic impacts of forest industry...
TRANSCRIPT
Socio-economic impacts of forest industry change
Tasmanian forest industry employment and production, 2012-13
Phase 1 report
October 10 2014
Jacki Schirmer, Caroline Dunn, Edwina Loxton
University of Canberra

Contents
Executive Summary ............................................................................................................................................. i
1. Introduction ................................................................................................................................................ 1
2. Methods ...................................................................................................................................................... 2
3. Results ......................................................................................................................................................... 7
4. Employment and business numbers .......................................................................................................... 7
Overall trends..................................................................................................................................................... 7
Employment by industry sector ......................................................................................................................... 9
Employment by forest and plantation sector .................................................................................................. 12
Employment trends by local government area ............................................................................................... 15
5. Forest and plantation management and harvesting ................................................................................ 28
Area managed and harvested .......................................................................................................................... 28
Roundwood removals ...................................................................................................................................... 28
6. Wood and paper production .................................................................................................................... 31
Roundwood utilisation ..................................................................................................................................... 31
Production and markets .................................................................................................................................. 34
7. Harvest and haulage capacity and infrastructure .................................................................................... 39
8. Expenditure .............................................................................................................................................. 42
9. Business profitability ................................................................................................................................ 44
10. Changes in business structure and management ................................................................................. 45
Business expectations and investment intentions .......................................................................................... 45
Certification...................................................................................................................................................... 53
Adapting to change .......................................................................................................................................... 53
11. Conclusion ............................................................................................................................................. 56
12. References ............................................................................................................................................ 57
Appendix 2: Forest industry employment by local government area (more detailed information) .............. 58

Tables Table 1 Summary of participation in study by Tasmanian forest industry business type ................................. 5
Table 2 Survey response by business size class ................................................................................................. 6
Table 3 Forest industry employment dependent on native forest, softwood plantation and hardwood plantation, November 2013 ............................................................................................................................. 12
Table 4 Area of native forest and plantation managed in 2013, by Forestry Tasmania district (hectares) .... 28
Table 5 Number of processing sites by type and district, November 2013 .................................................... 31
Table 6 Number of processing sites by type of roundwood utilised, November 2013 ................................... 32
Table 7 Volume of roundwood used as inputs by processing sites in Tasmania, 2012-13, by roundwood type and district ....................................................................................................................................................... 33
Table 8 Number of Tasmania processing sites using different types of roundwood inputs, 2012-13, by roundwood type and district ........................................................................................................................... 33
Table 9 Volume of production by product and log type .................................................................................. 34
Table 10 Volume of production from native forest roundwood, by district ................................................... 34
Table 11 Production of woodchips and residues, by region, for all log types ................................................. 36
Table 12 Production of woodchips and residues, by log type ......................................................................... 36
Table 13 Production of native forest woodchips and residues, by region ...................................................... 37
Table 14 Estimated maximum volume of native forest and plantation able to be harvested and hauled to mill utilising current equipment and shift structures ...................................................................................... 41
Table 15 Estimated expenditure by the Tasmanian forest industry, 2005-06 to 2012-13 ............................. 42
Table 16 Estimated expenditure by the Tasmanian forest industry by region, 2005-06 and 2012-13 ........... 43
Table 17 Factors that would encourage investment by forest industry businesses ....................................... 50
Table 18 Factors that would trigger a business to downsize or close ............................................................. 51
Table 19 Factors that affect overall outlook of business ................................................................................. 52
Table 20 Certification held by growers and processors, and intention to certify in next 12 months ............. 53
Figures Figure 1 Forest industry sectors included and excluded from the survey ................................................... 3
Figure 2 Trends in Tasmanian forest industry employment and business numbers, 2006 to 2013 .......... 8
Figure 3 Change in forest industry employment by industry sector, 2006 to 2013 .................................... 9
Figure 4 Change in wood and paper processing employment, 2006 to 2013 ............................................ 10
Figure 5 Change in harvest and haulage contracting employment, 2006 to 2013 .................................... 11
Figure 6 Change in silvicultural contracting employment, 2006 to 2013 ................................................... 12
Figure 7 Change in employment dependent on native forest, hardwood plantation and softwood plantation, 2006 to 2013 ............................................................................................................................... 14
Figure 8 Number of people employed in the forest industry, November 2013, and change in forest industry jobs 2006-2013, by Local Government Area ................................................................................. 16
Figure 9 Change in forest industry jobs by Local Government Area, 2008-2011 and 2011-2013 ............ 17
Figure 10 Proportion of employed labour force working in the forest industry, by Local Government Area, 2008 and 2013 ...................................................................................................................................... 18
Figure 11 Change in proportion of the employed labour force employed in the forest industry by local government area, 2008-2011 and 2011-2013 ............................................................................................. 19
Figure 12 Total number of people employed in the forest industry, November 2013, by Local Government Area ........................................................................................................................................... 21
Figure 13 Change in number of forest industry jobs, August 2008 to November 2013, by Local Government Area ........................................................................................................................................... 22
Figure 14 Total number of people employed in jobs dependent on native forest timber, November 2013, by Local Government Area .................................................................................................................. 23
Figure 15 Total number of people employed in jobs dependent on softwood plantations, November 2013, by local government area ................................................................................................................................ 24
Figure 16 Total number of people employed in jobs dependent on hardwood plantations, November 2013, by Local Government Area .................................................................................................................. 25
Figure 17 Proportion of the employed labour force working in the forest industry, November 2013, by Local Government Area ................................................................................................................................. 26
Figure 18 Change in proportion of the employed labour force working in the forest industry, August 2008 to November 2013, by Local Government Area ................................................................................. 27
Figure 19 Volume of native forest, softwood plantation and hardwood plantation roundwood harvested in Tasmania, 2001-01 to 2012-13 ........................................................................................................................ 30
Figure 20 Reported uses of byproduct residues by Tasmanian wood and paper processors ......................... 38
Figure 21 Proportion of harvesting equipment being utilised by harvest contractors, Nov 2013 (where 100% is the maximum possible given the need for some downtime, maintenance etc) ......................................... 40
Figure 22 Proportion of haulage equipment being utilised by haulage contractors, Nov 2013 (where 100% is the maximum possible given the need for some downtime, maintenance etc)............................................. 40
Figure 23 Profitability reported by different types of forest industry business in 2012-13 ........................... 44
Figure 24 Response to question ‘How likely are you to do the following in the next year – Reduce your capital equipment’ ........................................................................................................................................... 46
Figure 25 Response to question ‘How likely are you to do the following in the next year – Invest in new capital equipment’ ........................................................................................................................................... 46
Figure 26 Response to question ‘How likely are you to do the following in the next year – Reduce the size of your workforce’ ................................................................................................................................................ 47
Figure 27 Response to question ‘How likely are you to do the following in the next year – Increase the size of your workforce’ ........................................................................................................................................... 47
Figure 28 Response to question ‘How likely are you to do the following in the next year – Make an overall loss in your business’ ....................................................................................................................................... 48
Figure 29 Response to question ‘How likely are you to do the following in the next year – Make an overall profit in your business’ .................................................................................................................................... 48
Figure 30 Views of native forest processors about effects of the TFA on log quantity, quality and cost in the next 1 to 2 years ............................................................................................................................................... 54
Figure 31 Native forest processor’s perceptions of the likelihood they will source logs from alternative sources to replace logs sourced from public native forest .............................................................................. 55

i
Executive Summary
Background
The Tasmanian forest industry is undergoing substantial change. Since 2008, downturn in industry activity has resulted in large job losses in the industry; between 2008 and 2011, employment in forest industry jobs declined by around 50%, or 3,500 jobs (Schirmer et al. 2011). This report provides information on trends in forest industry employment and production in Tasmania, to November 2013, and was commissioned by the Tasmanian Government.
Methods
The data included in the report are principally drawn from:
(i) a survey of Tasmanian forest industry businesses, conducted between November 2013 and February 2014, and
(ii) (publicly available historical data on the Tasmanian forest industry, drawn principally from surveys of the industry undertaken by the CRC for Forestry between 2006 and 2011.
For purposes of this survey, the forest industry is defined as people employed in businesses undertaking activities specific to the forest industry, to the point of secondary processing of wood products. It does not include retail sales of wood and paper products. Some practical limitations meant some parts of the industry were not included: specifically, firewood producers and craftwood producers.
The survey of businesses involved work to identify currently operating businesses; customisation of survey questions to individual businesses to reduce the burden required to complete the survey; and collection of data from businesses.
The overall response rate to the survey was 75% of the 210 businesses identified as operating in the industry as of November 2013. These 75% of businesses undertook the large majority of forest industry activity in the state, with information obtained for all large and medium-sized businesses, while non-respondents were all small businesses. A robust process was used to impute key data for non-responding businesses.
Employment and business numbers
Tasmanian forest industry employment has declined substantially from 6,963 people in 2008, to 2,715 people in November 2013. However, the rate of employment loss has slowed since 2011 when data were last reported in detail.
During 2013, employment stabilised to some extent for the first time since 2008, with the number of people employed in the industry falling by 40 between November 20121 and November 2013. During this same period, full-time equivalent employment grew slightly despite the loss of 40 jobs, a consequence of
1 November 2012 figures were calculated based on either specific employment at that point in time, or, for businesses who
could not recall or readily bring up records, the average employment during the financial year 2012-13. Where a business closed during 2012-13, their employment was only included in the November 2012 estimates if they were operating during November 2012.

ii
many part-time workers in the industry increasing their work hours during 2013, particularly in the harvest and haulage sector.
The number of businesses operating in the industry has fallen steadily over time, with the decline continuing in 2012 even as employment numbers stabilised. This ongoing fall in business numbers is largely due to a number of small firms exiting the industry completely after having undertaken relatively little work in the industry for several years.
Employment trends by industry sector
The rate of change in employment has varied in different parts of the forest industry. The largest proportion of employment is generated in the processing sector, with 1,259 jobs in November 2013. Job loss slowed in the processing sector between 2012-2013, with 31 jobs lost, compared to 332 jobs lost between May 2011 and November 2012. Most of these 31 jobs were likely attributable to employment reduction resulting from the Tasmanian Native Forest High Quality Sawlog Contract Voluntary Buyback Program. During the survey period, some sawmillers were in the process of exiting the industry as part of the Tasmanian Regional Sawmiller Structural Adjustment Grants Program; it is estimated that processing employment will fall by a further approx. 30-40 jobs by the completion of this program in 2015.
Harvest and haulage contracting employed 632 people in November 2013, an increase of 77 from a low of 565 people in November 2012. Prior to 2012, substantial employment decline had occurred in this sector, facilitated by two exit programs offered to contractors. Job growth during 2013 was not confined to any single part of the harvest and haulage sector, but was most common in harvest and haulage businesses who harvest and transport softwood plantation roundwood, with 33.8% of job growth recorded in this type of business. A further 31.7% of job growth was in businesses operating both in native forest and plantations, 20.1% in businesses harvesting native forest only, and 14.0% in businesses harvesting hardwood plantations only.
The number of people employed in silvicultural contracting – a sector largely dependent on plantations – fell rapidly between 2008 to 2011, and since 2011, there has been a small further decline in employment in this sector.
Employment trends in native forest and plantation sectors
Native forest dependent employment: Jobs dependent on native forests declined continuously from 2006 to 2011, and since 2011 this decline has continued, with a 31.2% decline in employment between 2011 and 2013 (compared to a decline of 8.3% between 2006 and 2008, and 35.9% between 2008 and 2010). The majority of forest industry jobs lost between 2011 to 2013 were jobs generated by native forest harvest, haulage and processing.
Hardwood plantation dependent employment: Employment remained relatively stable in the hardwood plantation sector during 2011 to 2013, after falling rapidly between 2008 and 2011. During 2011 to 2013, the majority of the hardwood plantation estate in Tasmania was in administration or receivership, with sale processes ongoing during the period this study was conducted.
Softwood plantation dependent employment: Employment grew slightly in the softwood plantation sector between 2011 and 2013, although the total number of jobs generated by softwood plantations remains substantially lower than in 2006 to 2008.
iii
Employment trends by region
This report contains detailed data on changes in forest industry employment for each local government area (LGA) in Tasmania since 2006. Employment loss has occurred in almost all LGAs since 2008, and in most (but not all) the rate of employment decline slowed during 2011 to 2013. As of November 2013, the LGAs with the greatest numbers of people employed in the forest industry were:
those around Hobart (Brighton, Clarence, Hobart, Glenorchy and Kingborough) - 542 people;
Launceston (461 people);
Dorset (234);
Circular Head (194);
Derwent Valley (184); and
Huon Valley (177).
The LGAs experiencing the largest absolute loss of jobs between 2008 to 2013 were Launceston (484 jobs lost), Dorset (365), Burnie (322), West Tamar (315), and Meander Valley (311).
Another way of measuring the impact on small communities is to examine the proportion of jobs lost: this was greatest between 2008 to 2013 in Glamorgan-Spring Bay, where forest industry job losses represented 9.4% of all jobs in the LGA, followed by Dorset (8.9% of jobs lost), Southern Midlands (7.4%), Central Highlands (6.2%) and Kentish (5.0%).
Forest industry jobs remain widely spread around Tasmania, with three key ‘clusters’ of employment:
the northern cluster of Launceston, Dorset, and Meander Valley, where jobs depend on native forest, softwood plantations and hardwood plantations;
the north-west cluster of Circular Head and Burnie, which are highly dependent on native forest timber and have little plantation-related employment except in Burnie; and
the southern cluster, comprised of the LGAs located around Hobart, together with Derwent Valley and Huon Valley. These jobs are largely dependent on native forests (particularly in Huon Valley) and softwood plantations (particularly Derwent Valley), with little hardwood plantation dependent employment.
While employment is clustered around Tasmania’s larger population centres, the LGAs that have experienced the greatest loss of employment opportunities as a result of decline in the forest industry since 2008 are rural LGAs with smaller population and employment bases: in particular, Dorset, Glamorgan-Spring Bay, and Southern Midlands.
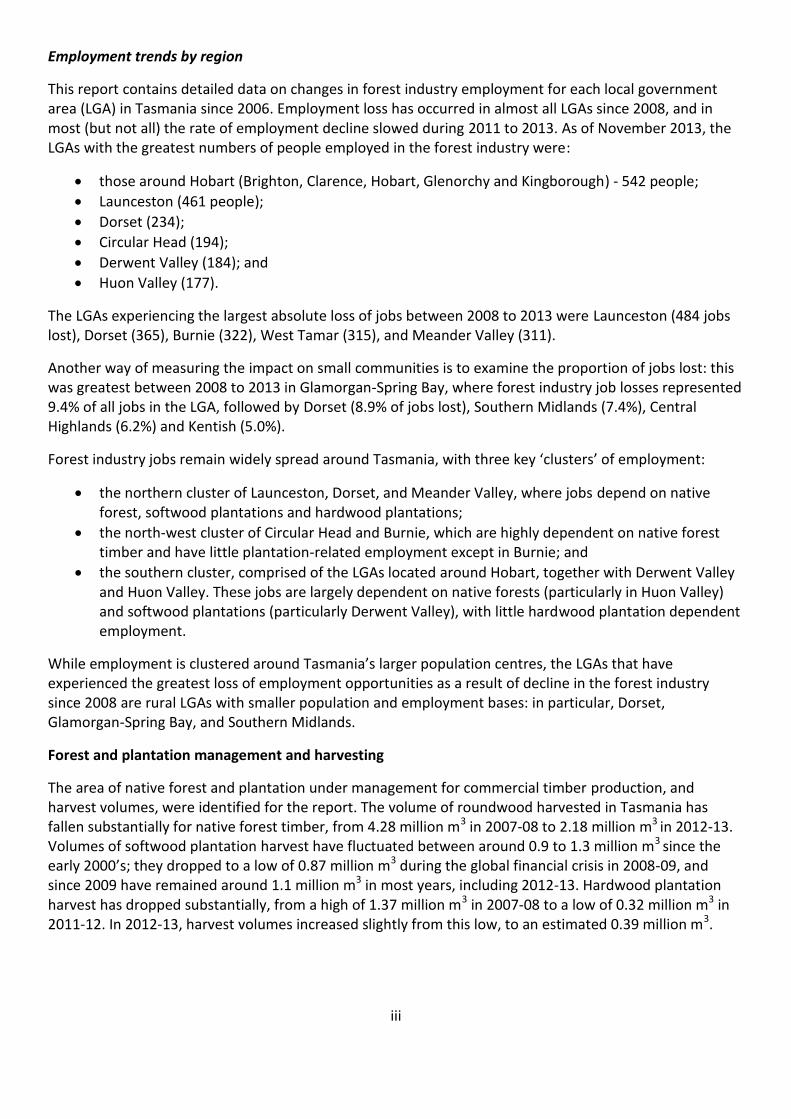
Forest and plantation management and harvesting
The area of native forest and plantation under management for commercial timber production, and harvest volumes, were identified for the report. The volume of roundwood harvested in Tasmania has fallen substantially for native forest timber, from 4.28 million m3 in 2007-08 to 2.18 million m3 in 2012-13. Volumes of softwood plantation harvest have fluctuated between around 0.9 to 1.3 million m3 since the early 2000’s; they dropped to a low of 0.87 million m3 during the global financial crisis in 2008-09, and since 2009 have remained around 1.1 million m3 in most years, including 2012-13. Hardwood plantation harvest has dropped substantially, from a high of 1.37 million m3 in 2007-08 to a low of 0.32 million m3 in 2011-12. In 2012-13, harvest volumes increased slightly from this low, to an estimated 0.39 million m3.

iv
Roundwood utilisation, production and markets
Timber harvested in Tasmania is processed at 66 processing sites, ranging from small ‘boutique’ mills that typically employed one to three people and process small volumes into diverse custom products such as furniture or flooring; to large scale mills producing high volumes of output. The largest number of processing sites (27) are located in the North East of Tasmania, followed by the Southern district (23), and the North West (16). Of these processing sites, 47 process native forest, 18 special species, four hardwood plantation and 12 softwood plantation (some process more than one type of roundwood). There is substantial interaction between many processing sites, for example through chains of processing activity.
A diversity of wood and paper products are produced, including sawntimber for structural purposes (e.g. construction), sawntimber for appearance uses (e.g. flooring, window frames), veneer, particleboard, pulp, paper and woodchips, as well as specialised craftwood and special species products. These products have different end-markets; a large proportion of production is sold outside Tasmania, into the domestic mainland markets. Products such as posts, poles, pallets, palings and structural timber made from eucalypt are predominantly sold within Tasmania. Others are sold predominantly into mainland Australia or export markets.
This report analyses production of residues (woodchips, sawdust, docking ends, shavings) by Tasmanian processors, as a lack of market for residues has been a critical challenge for the Tasmanian forest industry in recent years. The majority of residues produced as a byproduct of other processing (for example, as a byproduct of sawntimber production) are produced in the North East (Bass) region; however, when examined by log type (native forest or softwood plantation), the production of native forest residues is higher in the southern and north western parts of Tasmania than in the north east.
Mills were asked to describe the current market destinations for residues produced as a byproduct of wood processing. Woodchips – making up the largest volume of byproducts - were predominantly sold to businesses who exported them. However, several businesses reported they were either stockpiling woodchips, or had found alternative sale options for them within Tasmania, and a small number reported burning some woodchips on site as they were unable to find markets for them. Several businesses also commented that woodchips sold for export were sold at cost, with no return made on them.
The second largest volume of byproduct was in the form of sawdust and shavings, which together with a small proportion of woodchips, were sold to Tasmanian businesses that used them for a wide range of purposes, including garden/nursery/landscaping businesses for use as mulch or compost; livestock businesses such as chicken farms and horse stables; a diversity of businesses using these products as packing, lining or covering material when transporting and storing goods and waste.
The third largest end use of residues was burning to produce energy. This was predominantly done for onsite energy production by wood processors, but in some cases, processors reported selling residues to businesses outside the forest industry who then burned it for energy production. Sale of firewood was the fourth most common use. A small volume of residues were given away or burned onsite without producing energy.
Capacity and infrastructure
Harvest and haulage contractors are utilising a greater proportion of the capacity of their equipment than they were in 2011; some are reporting full or close to full utilisation, as well as difficulty obtaining labour for firms. Others report having some spare capacity.

v
Industry expenditure
Between 2005-06 and 2012-13, expenditure by the Tasmanian forest industry has fallen by approximately 70% in the industry, to an estimated $395 to 452 million in 2012-13, although it must be noted that this estimate is broad; estimates have not been adjusted for inflation.
Employment declined by 57.6% during the same period. Even considering the potential for error in estimation of expenditure, expenditure has declined at a greater rate than employment. Businesses in 2012-13 were investing significantly less in capital equipment than they were in 2005-06, and while other parts of this study identified that businesses are beginning to feel more positive about potential for future investment, this positive outlook is not yet translating into actual investment on a large scale.
Additionally, businesses have reduced running costs to a minimum in recent years, reducing expenditure. Expenditure has declined at a slower rate than the state-wide average in southern Tasmania, and at a higher rate in North West Tasmania.
Business profitability
In 2012-13, 57.4% of businesses reported making a profit, and 42.6% reported breaking even or making a loss. This was relatively similar to estimates from 2010-11.
Business expectations and investment intentions
Overall, forest industry businesses are reporting cautious optimism about their future. Very few believed they would reduce their capital equipment, workforce, or make a loss in their business in the next year. A majority believed it was likely they would invest in new capital equipment in the next year, and that their business would make an overall profit in the next 12 months. Fewer planned to expand the size of their workforce in the next 12 months, although a majority of harvest and haulage contractors, and almost 40% of processors considered it likely that they would increase their workforce.
When asked what factors would encourage them to invest more in their business, versus triggering them to downsize or close their business, different issues emerged in each part of the industry.
Harvest and haulage contractors focused on a need for more sustainable rates of pay for contracting services, and having more secure and longer-term contracts that guarantee a volume of work. Overall markets for wood products were a less commonly discussed issue for these contractors. Processors focused on a need for access to a stable, long-term wood supply of appropriate quality and type. Several emphasised that the need was not simply for access to a volume of supply, but to a quality of supply that met the requirements of their market, and to types of species relevant to their markets. Processors also identified, although to a lesser extent, a need for greater market confidence in the industry, and consistency of government policy or support for the industry.
Factors that would trigger business downsizing or closure were largely focused around markets for growers and contractors, and to a lesser extent processors (who more commonly described loss of suitable timber supply as the biggest trigger of closure or downsizing). The market need was most commonly described as a need to avoid any loss of market demand in order to stay viable. Increasing costs and competition in the market were also cited as factors that would trigger downsizing or closure.
Certification
There is growing use of certification in the Tasmanian forest industry. Many more businesses are Australian Forestry Standard (AFS) certified than Forest Stewardship Council (FSC) certified. All growers who answered this question had AFS certification; two had FSC certification, while the remainder were planning

vi
to apply for FSC certification in the next 12 months. Just under half of processors reported having AFS certification, while a further 10% planned to apply for AFS certification in the next 12 months. Fewer processors had FSC certification: in total approximately 30% either currently had some form of FSC certification or planned to apply for it within the next 12 months.
Adapting to changes in wood supply under the Tasmanian Forests Agreement
Under the Tasmanian Forests Agreement (TFA), there were some significant changes in wood supply from native forests. At the time the survey was undertaken, the TFA was in early stages of implementation, and businesses were asked a number of questions relating to the changes they anticipated would occur under the TFA. The views reported below are those held by businesses about the TFA prior to the Tasmanian state election in March 2014. Since the election and change of government, there have been many changes to government policy, which mean the views reported below do not apply to government policy or processes post the election.
Processors who utilised native forest timber were asked for their views on the likely effects of the TFA on the quantity, quality and cost of log supply to their business during the next 1-2 years. A majority of businesses (63%) believed these changes would reduce the quality of logs available to their business during that time, while 52% believed it would reduce quantity of logs available to their business. Only 24% believed it would resulted in greater growth in cost of logs compared to what would have happened in the absence of the TFA. None believed that changes in wood supply would have a positive impact on quantity or quality of available logs, but some (44%) believed it would lead to a decrease in cost of logs.
Those businesses that believed their log supply may be reduced in some way (quantity, quality etc) as a consequence of the TFA were asked the likelihood that they would source logs from either plantations or native forest. In total, 27% reported they would consider sourcing logs from plantations, and 54% from private native forest.
Conclusion The results of this survey show that the rapid decline in forest industry activity between 2008 to 2011 has slowed considerably; the industry in 2013 could best be described as in a moderately stable state in which there was relatively little employment loss, other than that associated with decline in native forest harvesting being implemented as part of the TFA.
While business confidence remains low for some, there is a cautious optimism for many, who did not believe they were facing further decline in the next year, but rather stabilisation and, for some, a possibility of investment. However, this confidence is fragile and substantial investment in the industry is unlikely unless key issues are resolved, particularly security of contracts for harvest and haulage contractors, security of supply for processors, and having access to stable markets that enable a profitable return across the industry.
Key issues that will affect this include the outcomes of sale processes for hardwood plantations; changes in government forest industry policy; and trends in market demand and production costs.

1
1. Introduction
The Tasmanian forest industry is undergoing substantial change. Since 2008, downturn in industry activity has resulted in large job losses in the industry; between 2008 and 2011, employment in forest industry jobs declined by around 50%, or 3,500 jobs (Schirmer et al. 2011).
Since the last survey in 2012, the Tasmanian Government implemented a number of changes to the forest industry under the Tasmanian Forests Agreement (TFA), including the reservation of areas of native forest in multiple stages and support for industry adjustment. These changes are expected to have led to further changes in the industry’s structure, and the Tasmanian Government commissioned this survey to provide an update on the industry’s current status, including information on trends in forest industry employment and production, and how industry is responding to changes in wood supply resulting from the TFA and other influences such as the high value of the Australia dollar and changing markets.
This report examines:
(i) current employment and roundwood utilisation in the Tasmanian forest industry and (ii) future industry trends, based on a survey of businesses conducted from November 2013 to
February 2014.
It updates data previously produced by the Cooperative Research Centre (CRC) for Forestry (see Schirmer 2008, 2010; Schirmer et al. 2011), and work produced as part of the Independent Verification Group process, in development of the Tasmanian Forests Agreement (see Schirmer 2012).
This report describes results of Phase 1 of the study, which focused on identifying employment and production trends, and key indicators of future trends in the Tasmanian forest industry.
Phase 2 of this work is currently being reviewed, and will be determined in consultation with the Tasmanian Government’s new forest industry consultation group.

2
2. Methods
The data included in this report are drawn from two sources:
Primary data: A survey of Tasmanian forest industry businesses, conducted between November 2013 and February 2014 as part of this project
Secondary data: → Publicly available historical data on the Tasmanian forest industry, drawn principally from
surveys of the industry undertaken by the CRC for Forestry between 2006 and 2011 → Census of Population and Housing (CPH) data produced by the Australian Bureau of
Statistics → Other sources of historical data drawn from various sources.
The methods used to collect primary data are described in this section. When historical data are presented, source references are provided; these sources should be referred to for details of the methods used to generate the data (see in particular Schirmer 2008, 2010, 2012; Schirmer et al. 2011).
The survey of forest industry businesses was conducted in the following stages:
Stage 1: Defining the forest industry
Stage 2: Identifying businesses operating in the industry as of November 2013
Stage 3: Contacting businesses
Stage 4: Survey of businesses
Ethics approval was given by the University of Canberra Human Research Ethics Committee for the project (protocol number HREC 13-156).
Stage 1: Defining the forest industry
First, the scope of the survey was identified. To enable comparison of the data collected in this study with historical data on the Tasmanian forest industry, the forest industry was defined in the same way as that used by Schirmer (2008, 2010) and Schirmer et al. (2011)2, as:
all businesses undertaking activities specific to the forest industry. All workers employed by these businesses were defined as being part of the forest industry, whether they undertook forest-industry-specific tasks or not. For example, businesses involved in managing plantations were included in the study; if a person worked as an accountant for such a business, they were considered part of the industry even though the specific work tasks they undertake are not unique to the forest industry’ (Schirmer et al. 2011, p. 5, italics in original).
However, practical limitations meant it was not possible to survey all parts of the forest industry falling within this definition. Available resources did not permit a survey of small-scale private forest growers, woodcraft producers, or of production of wood products beyond initial processing stages. Existing data on small-scale private forest growers in Tasmania, based on a survey of growers conducted in 2012 (see Dare and Eversole 2012; Private Forests Tasmania 2013), was drawn on where possible to provide some contextual information about this sector. However, it was not possible to identify current data for craftwood production beyond initial processing of special species timber; or for production beyond initial processing of wood and paper products, within the resources of this project. Additionally, some parts of the industry were not asked to complete a detailed survey. Consultants, researchers, forest industry
2 A detailed definition can be found in Schirmer et al. (2011), page 5-7.

3
representative organisations, and government agencies were asked only to provide estimates of the number of jobs dependent on the forest industry in their organisation. This reduced survey burden for these groups, to whom the majority of survey questions did not apply.
Figure 1 summarises the scope of businesses included and excluded from the survey.
Stage 2: Identifying businesses
Prior to conducting the survey, businesses operating in the industry were identified, using a consultation process with multiple industry groups. This was essential as rapid change in the industry, in part influenced by two government packages supporting exit of forest contractors from the industry, had led to substantial change in the businesses operating in the industry since 2011 when comprehensive data on the industry was last collected. It was necessary to identify both businesses that had exited the industry in recent years, as well as any new businesses operating in the industry.
The following groups provided advice on current activity within the industry: the Forest Industries Association of Tasmania; the Tasmanian Sawmillers Association; and the Australian Forest Contractors Association. Each of these provided lists of known operating businesses, as well as advice on others that were potentially operating in the industry.
Businesses dependent on the forest industry but not undertaking
industry specific
activities —not included in survey
Included in survey
Craftwood producers
Firewood collectors
Processing outside of Tasmania
Forest industry related activities
not included in survey
Forest/plantation growers and
managers
Secondary processors
Primary processors
(defined as those taking in
roundwood)
Nurseries, seed
suppliers
Contractors – harvest, haulage, silviculture,
roading, management
Other suppliers of goods/services to the forest industry
e.g. mechanics, fuel suppliers
Retail businesses dependent on
worker spending
Processors utilising both wood and
non-wood products
Consultants, researchers, industry
organisations, government agencies
Figure 1 Forest industry sectors included and excluded from the survey

4
Additionally, as surveys were conducted in Stage 4, businesses were asked to identify other forest industry businesses who were operating in their sector or region, enabling further identification of businesses operating in the industry. Additional businesses identified via this process were then contacted, and included in the survey if they met the criteria for inclusion shown in Figure 1.
Stage 3: Initial contact with businesses
Many Tasmanian forest industry businesses have experienced substantial stress in recent years. During the period of the survey some were exiting the industry, including a group of sawmillers who were in the process of, or preparing to, exit the industry after successfully applying for grants as part of the Tasmanian Regional Sawmiller Structural Adjustment Grants Program. A key ethical issue with conducting the survey was to ensure that the survey – which asked questions about business performance, and hence could reinforce negative experiences for business managers experiencing difficult times – did not present undue burden for participants.
To assist in reducing survey burden, managers of forest industry businesses were (where possible) contacted initially by a member of their industry representative group, who explained the study to them, and asked if they would be willing to participate in the survey. By doing this, businesses could initially discuss the survey with a person they trusted from within the industry, who could then advise researchers if that business was willing to be surveyed, and could also advise of any sensitivities or personal circumstances the researchers should be aware of. Approximately 65% of businesses were initially contacted in this way. The remaining 35% had no affiliation with specific industry groups, or had no linkages to them, and were directly contacted by the researchers. In the first contact, the researchers explained the study and what would be involved, and asked the business manager if they were willing to participate. If they were, the researcher would proceed to collect data about that business.
Stage 4: Survey of businesses
Following initial contact, businesses were surveyed. The business survey was designed using an iterative process. First, previous similar surveys were reviewed, and draft questions designed based on these. Consultation with members of the Special Council subcommittee (see Appendix 1) was used to identify new topics that should be included in the survey. A full draft survey was then discussed in detail with representatives of contractors and sawmillers, and reviewed based on this discussion. The revised survey was then pilot tested with four businesses, and final revisions made based on their feedback.
Once they had agreed to take part in the study (i.e., after the initial contact described in Stage 3), businesses were surveyed using the following process:
1. Researchers called businesses, and asked a series of preliminary questions by phone. These preliminary questions enabled the researcher to customise the survey for each business, removing questions that did not apply in order to reduce the difficulty involved in completing the survey. For example, if this preliminary discussion identified that the business utilised plantation roundwood and no native forest roundwood, the questionnaire was customised so it included no questions about native forest roundwood.
2. The customised survey was then either completed in a face to face meeting with the business or, if the business manager indicated that they were willing to complete the survey form without a meeting, was emailed or posted to the business manager.
3. Reminders were given to the business about the survey approximately once every fortnight after the survey was emailed/mailed to them, unless a business indicated it would not be appropriate to contact them this often.

5
4. In some cases, businesses were unable or unwilling to complete the full survey, but were willing to provide some information by phone. These businesses were interviewed by phone, and asked to provide information on their employment, and volume of work (e.g., volume of roundwood used as inputs if they were a sawmill, or volume of harvest activity if they were a harvest contractor).
5. Some businesses chose not to participate in the survey. A separate process was used to estimate likely activity in these businesses, and hence to estimate total employment and business activity currently occurring in the Tasmanian forest industry (see the next section ‘imputation of values for non-responding businesses’).
Table 1 summarises the businesses operating in different sectors of the Tasmanian forest industry, and the proportion who participated in Phase 1 of the study by either (i) completing the full survey, or (ii) providing basic information by phone. Survey data were analysed using Microsoft Excel and IBM SPSS Statistics.
The overall response rate to the survey was 75% of 210 businesses (Table 1). These 75% of businesses undertook the large majority of forest industry activity in the state, with information obtained for all large and medium-sized businesses, while non-respondents were all small businesses (Table 2).
Table 1 Summary of participation in study by Tasmanian forest industry business type
Type of business Est. number of businesses operating in the Tasmanian forest industry, Nov 2013
% who completed full survey
% who provided basic information
Total response rate (%)
Forest grower/manager (including businesses managing plantations on a contract basis on behalf of the owner of the plantation estate)
10 80% 10% 90%
Silvicultural contractors, nurseries and seed collectors2
38 11% 42% 53%
Harvest, haulage and roading contractors 54 56% 26% 82%
Roading contractors 16 44% 19% 63%
Other (associations, agencies, consultants, researchers)
31 NA1 71% 71%
Processors operating at November 2013 66 processing sites managed by 61 processors3
69% 18% 87%
Total 210 46% 29% 75% 1 These businesses were only asked to complete an abbreviated survey identifying their level of employment.
2 Employment for non-responding businesses in this category was able to be estimated based on analysing data provided by
growers on their spending on silvicultural contracting, nursery and seed collection activities 3
A further eight businesses were no longer operating but had operated at some time during the period asked about in the survey. These businesses were contacted and asked to provide basic information enabling identification of their operations prior to closure; in three cases information was provided through consultation due to difficulty contacting the business. Of the 66 sites included as operating, two were in a period of temporary shutdown at the time of the survey (defined as a shutdown lasting less than two months and intended to be temporary).

6
Table 2 Survey response by business size class
Est. number of businesses operating in the Tasmanian forest industry, Nov 2013
% who completed full survey
% who provided basic information
Total response rate (%)
Small businesses1 - traditional 137 49% 25% 74%
Small businesses and organisations - other (includes consultants, industry representative organisations, government regulators) 39 NA2 59% 59%
Medium1 businesses 30 87% 13% 100%
Large1 businesses 4 100% 0% 100%
Total 210 46% 29% 75% 1
Small businesses were defined as those employing less than 20 people; medium businesses as those employing 20-99 people; and large businesses as those employing 100 or more people, consisting with previous studies of the Tasmanian forest industry 2
These businesses were only asked to complete an abbreviated survey identifying their level of employment.
Imputation of values for non-responding businesses
A key goal of this study was to provide estimates of total activity in the Tasmanian forest industry. This required estimating the activity undertaken by businesses who did not participate in the study. This estimation was undertaken through the following steps for all businesses:
1. Identifying publicly available information about each non-responding business. 2. Consulting with forest industry organisations and asking for advice on the size of the business, the
activities it participates in, and estimates of the extent of employment and activity. This was done not only for non-responding businesses: it was done for all businesses during Stage 2 and 3 of the project. Asking industry organisations to provide estimates of business size, employment, nature of activity, and volume of activity for all businesses achieved two goals. First, it enabled researchers to assess the accuracy of estimates made by industry organisations, as their initial estimates could be compared to actual data for those businesses that did respond to the survey. Second, it meant researchers could meet their ethical obligation of not revealing to others in the industry which businesses had chosen not to participate in the survey.
3. Using the advice provided by industry organisations, together with data from businesses participating in the survey that had similar characteristics to non-participating businesses, to estimate the employment and activity occurring for non-responding businesses. This estimation was undertaken on a business-by-business basis, based on all available contextual information about that business, and about businesses with similar characteristics.
For contractors, additional methods were used to impute employment for non-responding businesses. Growers were asked to report the total amount they spent on harvest and haulage, silvicultural, roading, nursery and seed collecting contractors. The amount reported was compared to the expenditure reported by the contractors who responded to the survey. Missing employment was then imputed by identifying (i) the gap between reported spend by growers and that reported by surveyed contractors, and (ii) estimating employment based on average expenditure per worker employed for each type of contractor. The location of imputed employment was estimated based on information provided by growers, who were asked to name the locations in which the contracting businesses they worked with were based.

7
3. Results
The following sections describe results of the study. These have been generated using the survey conducted for Phase 1 of this study unless otherwise specified. Historical forest industry data are drawn from Schirmer (2008, 2010, 2012) and Schirmer et al. (2011), unless otherwise specified.
4. Employment and business numbers
Overall trends
Tasmanian forest industry employment has declined substantially since 2008, but the rate of employment loss slowed during 2013.
Based on data collected in the Forest Industry Survey (FIS), employment grew in the industry between 2006 and 2008 to reach 6,963 people (Schirmer et al. 2011). Since that time the number of people working in the industry has fallen by 61.0%, falling to 2,715 people in November 2013 (Figure 2).
In 2013, employment stabilised to some extent for the first time since 2008, with the number of people employed in the industry falling by 40 between November 20123 and November 2013, a small number compared to the large declines recorded between 2008 and 2012. During this same period, full-time equivalent employment grew slightly despite the loss of 40 jobs, a consequence of many part-time workers in the industry increasing their work hours during 2013, particularly in the harvest and haulage sector. However, during December 2013 to January 2014, job reductions in the forest grower/manager sector are likely to have resulted in a further decline in employment.
The number of businesses operating in the industry has fallen steadily over time, with the decline continuing in 2012 even as employment numbers stabilised. This ongoing fall in business number is largely due to a number of small firms that have undertaken relatively little work in the industry for several years exiting the industry completely. In particular, several silvicultural contractors contacted for the 2013 survey stated that the proportion of their work involving forest industry activities had been very small for several years, and was now at negligible levels. These businesses were subsequently removed from the list of businesses considered to be actively operating in the industry.
3 November 2012 figures were calculated based on either specific employment at that point in time, or, for businesses who
could not recall or readily bring up records, the average employment during the financial year 2012-13. Where a business closed during 2012-13, their employment was only included in the November 2012 estimates if they were operating during November 2012.

8
Figure 2 Trends in Tasmanian forest industry employment and business numbers, 2006 to 2013

9
Employment by industry sector
The rate of change in employment has varied in different parts of the forest industry. Figure 3 compares employment in key industry sectors over time. Employment has fallen across the industry since 2008. Changes in wood and paper processing, harvest and haulage contracting, and silvicultural contracting are shown below.
Figure 3 Change in forest industry employment by industry sector, 2006 to 20134
Wood and paper processing
The employment generated by the processing of wood and paper products has declined since 2008, with less rapid decline since 2012 (Figure 4). During 2013, employment loss occurred principally for businesses participating in the Tasmanian Native Forest High Quality Sawlog Contract Voluntary Buyback Program, with very little job loss recorded for any other processors in 2013. Under this program, four native forest wood processors retired 26,400 cubic metres (m3) of contractual supply of high quality sawlog. During the period in which the 2013 survey of businesses was conducted, some sawmilling businesses were in the process of being approved for grants to support them to exit native forest sawmilling as part of the Tasmanian Regional Sawmiller Structural Adjustment Grants Program.
4 This table does not include jobs in roading contracting, or in other parts of the industry such as consulting, research, industry
representative bodies, or government agencies engaged in policy development and regulation.

10
Figure 4 Change in wood and paper processing employment, 2006 to 2013
Harvest and haulage contracting
The number of people employed in harvest and haulage contracting fell rapidly between 2008 and 2012 (Figure 5), with a large number of contractors exiting the industry during this period. In 2011 and 2012, many of those exiting did so with the support of one of two exit assistance programs offered to contractors (the 2010-11 Tasmanian Forest Contractors Exit Assistance Program and the 2011-12 Tasmanian Forests Intergovernmental Agreement - Contractors Voluntary Exit Grants Program).
Since the completion of the second of the exit programs, there has been growth in employment in this sector: between November 2012 and November 2013, the number of people employed in harvest and haulage grew by 11.8%. Several contractors indicated that this job growth had largely occurred since June 2013. Of the 34 businesses who provided detailed information (including all medium and large sized harvested and haulage contractors), only four had reduced the number of people they employed during this period, while employment remained unchanged for 15, and grew for 15.
Job growth during 2013 was not confined to any single part of the harvest and haulage sector, but was most common in harvest and haulage businesses who harvest and transport softwood plantation roundwood, with 33.8% of job growth was recorded in this type of business. A further 31.7% of job growth was in businesses operating both in native forest and plantations, 20.1% in businesses harvesting native forest only, and 14.0% in businesses harvesting hardwood plantations only.

11
Figure 5 Change in harvest and haulage contracting employment, 2006 to 2013
Silvicultural contracting
Silvicultural contracting refers to contractors who engage in activities such as ground preparation, planting of seedlings, pruning, weed and pest control, firebreak maintenance, and fence maintenance. The number of people employed in silvicultural contracting – a sector largely dependent on plantations – fell rapidly between 2008 to 2011. This was principally due to the significant expansion of the sector with growth in managed investment schemes and the subsequent collapse of these schemes, as discussed in Schirmer et al. (2011). Since 2011, there has been a small further decline in employment in this sector (Figure 6). Silvicultural contractors participating in the 2013-14 survey reported a lack of recovery in demand for their services, with a large proportion of the hardwood plantation estate being in administration or receivership between 2011 and 2013.

12
Figure 6 Change in silvicultural contracting employment, 2006 to 2013
Employment by forest and plantation sector
The number of forest industry jobs dependent as of November 2013 on native forest, softwood plantations, hardwood plantations, and mixed or unknown sources, is shown in Table 3.
Table 3 Forest industry employment dependent on native forest, softwood plantation and hardwood
plantation, November 2013
Native forest-dependent employment
Softwood plantation-dependent employment
Hardwood plantation-dependent employment
Employment dependent on mixed or unknown wood sources
Grower 257 28 156 0
Harvest/haulage contractor 198 218 213 4
Processor 647 585 25 2
Roading contractors, silvicultural contractors and nurseries1 53 56 91 9
Other
173 1These groups have been combined to ensure confidentiality of individual businesses when reporting data.
During 2008 to 2011, employment declined across the forest industry, including in the native forest, softwood plantation and hardwood plantation sectors. Since 2011, trends in job numbers have been different for each of these sectors, as shown in Figure 7.
Native forest-dependent employment
The number of jobs dependent on native forests has declined since 2006, unlike other parts of the industry where decline occurred later, from 2008. Like other parts of the industry, the largest job losses since 2006 occurred during the 2008 to 2010 period. Since 2011, the number of jobs dependent on native forest

13
timber has continued to decline rapidly. The majority of jobs lost between 2011 and 2013 were jobs generated by native forest harvest, haulage and processing. This job decline resulted in large part from the exit of the key industry business, Gunns Ltd, from native forest timber processing in 2011, particularly reflected in the exit of harvest and haulage contractors from the industry; and more recently from the two contractor exit programs and sawmiller exit and sawlog retirement programs referred to earlier. Market trends have contributed job loss, with the ongoing high value of the Australian dollar reducing market competitiveness and access for those dependent on exports, and for those competing with imported timber products in domestic marketplaces.
Hardwood plantation-dependent employment
Employment has remained relatively stable in the hardwood plantation sector during 2011 to 2013, after falling rapidly between 2008 and 2011. During 2011 to 2013, the majority of the hardwood plantation estate in Tasmania was in administration or receivership. Plantations in administration/receivership have continued to be harvested and managed, but with lower investment in silvicultural contracting activities than occurred prior to the entry of most large hardwood plantation management companies into administration and receivership between 2010 and 2011.
Softwood plantation-dependent employment
Employment grew slightly in the softwood plantation sector between 2011 and 2013, although the total number of jobs generated by softwood plantations remains substantially lower than in 2006 to 2008.

14
Figure 7 Change in employment dependent on native forest, hardwood plantation and softwood plantation, 2006 to 2013 5
5 The decline in the number of people in the ‘unknown’ category is due to two factors: fewer businesses reporting working across multiple types of forest/plantation, and improved
classification of businesses by the type of native forest/plantation they depend on.

15
Employment trends by local government area
As of November 2013, shown in Figure 8, the Tasmanian LGAs with the greatest numbers of people employed in the forest industry were the councils in and around Hobart (Brighton, Clarence, Hobart, Glenorchy and Kingborough together having a total of 542 people working in the industry), Launceston (461 people), Dorset (234), Circular Head (194), Derwent Valley (184), and Huon Valley (177). Figure 8 also shows the change in the number of people working in the forest industry between 2008 to 2013 (more detailed information can also be found in Appendix 2). The majority of LGAs experienced large losses of forest industry jobs during this period, with the greatest losses in terms of number of jobs being in Launceston (484), Dorset (365), Burnie (322), West Tamar (315), and Meander Valley (311).
Figure 9 compares job losses between 2008-2011, and 2011-2013, showing the substantial slowing in job loss in the second period compared to the first. During the latter period (2011-2013), job losses were highest in Sorell & Tasmania (80 jobs lost), Southern Midlands (80), Waratah-Wynyard (80), West Tamar (73), Meander Valley (58), Devonport (57), Glamorgan-Spring Bay (53), and Kentish (53). In all of these LGAs except Meander Valley and Devonport, this represented a loss of more than 50% of forest industry jobs during 2011 to 2013. In the four LGAs where the number of jobs grew during 2011 to 2013, there were relatively small numbers of jobs involved (15 or fewer jobs in all cases).
The consequences of job loss for individuals are always substantial. At a community scale, however, the flow-on effects of job loss depend in part on what proportion of the economy is affected by a given job loss. The loss of 40 forest industry jobs in Hobart will likely have little impact on spending in the retail sector in that city, for example, whereas a similar size loss in a small town, with its associated loss of spending by workers, can mean the difference between profitability and closure for local retailers.
Figure 10 shows, for each LGA, the proportion of the employed labour force working in the forest industry in 2008, and in 2013, while Figure 11 shows the change in the proportion of the labour force working in the industry between 2008-2011, and 2011-2013. As of November 2013, the LGAs with the highest proportion of their workers employed in the forest industry were Dorset (8.7%), Central Highlands (7.3%), Circular Head (5.3%), Derwent Valley (4.7%), and Huon Valley (2.9%). In all these communities (as well as others in Tasmania), additional jobs would be generated beyond the direct jobs reported here, as a result of spending on goods and services by forest industry businesses and workers.
Forest industry jobs losses since 2008 have represented a significant proportion of the workforce in several LGAs. Those experiencing the greatest loss of workforce are Glamorgan-Spring Bay, where job losses in the forest industry totalled 9.4% of all jobs in the LGA between 2008 to 2013, with forest industry working falling from 9.8% of the workforce in 2008 to just 0.4% in 2013. These figures underrepresent the true impact on the local economy as they do not include the jobs that are in turn affected by the loss of direct employment in the forest industry. Four other LGAs have lost more than 5% of their local jobs as a consequence of loss of forest industry jobs: Dorset, where forest industry employment losses from 2008 to 2011 represented 8.9% of all workers in the LGA lost; Southern Midlands (7.4%); Central Highlands (6.2%); and Kentish (5.0%).
Between 2011 and 2013, decline in the proportion of the labour force employed in the forest industry was generally lower than it was during 2008 to 2011 (Figure 11). During this period, the greatest decline as a proportion of the labour force employed in the forest industry occurred in Glamorgan-Spring Bay, where the job losses represented 3.3% of all employed people, followed by Southern Midlands (3.2%), Central Highlands (2.9%), Kentish (2.1%), George Town (1.7%), Waratah-Wynyard (1.4%) and Sorell and Tasman (1.2%).

16
Figure 8 Number of people employed in the forest industry, November 2013, and change in forest industry jobs 2008-2013, by local government area

17
Figure 9 Change in forest industry jobs by local government area, 2008-2011 and 2011-20136
6 There are small discrepancies between the numbers in Figures 8 and 9 due to rounding of numbers

18
Figure 10 Proportion of employed labour force working in the forest industry, by local government area, 2008 and 2013

19
Figure 11 Change in proportion of the employed labour force employed in the forest industry by local government area, 2008-2011 and 2011-2013

20
To further identify the spatial patterns in change in forest industry jobs, the number of forest industry jobs in Tasmania in November 2013 was mapped by LGA for:
all forest industry workers (Figure 12); and change in total number of jobs between 2008 to 2013 (Figure 13)
workers whose jobs are dependent on native forests (Figure 14)
workers whose jobs are dependent on softwood plantations (Figure 15)
workers whose jobs are dependent on hardwood plantations (Figure 16)
Additionally, the proportion of the employed labour force working in the forest industry was mapped (Figure 17), and change in the proportion of the labour force employed between 2008 to 2013 (Figure 18).
Forest industry jobs remain widely spread throughout Tasmania, with three key ‘clusters’ of employment:
the northern cluster of Launceston, Dorset, and Meander Valley, where jobs depend on native forest, softwood plantations and hardwood plantations;
the north-west cluster of Circular Head and Burnie, which are highly dependent on native forest timber and have little plantation-related employment except in Burnie; and
the southern cluster, comprised of the LGAs located in the city of Hobart, together with Derwent Valley and Huon Valley. These jobs are largely dependent on native forests (particularly in Huon Valley) and softwood plantations (particularly Derwent Valley), with little hardwood plantation dependent employment.
While employment is clustered around Tasmania’s larger population centres, the LGAs that have experienced the greatest loss of employment opportunities as a result of decline in the forest industry in recent years are more rural LGAs with smaller population and employment bases.

21
Figure 12 Total number of people employed in the forest industry, November 2013, by local government area

22
Figure 13 Change in number of forest industry jobs, August 2008 to November 2013, by local government area

23
Figure 14 Total number of people employed in jobs dependent on native forest timber, November 2013, by local government area

24
Figure 15 Total number of people employed in jobs dependent on softwood plantations, November 2013, by local government area

25
Figure 16 Total number of people employed in jobs dependent on hardwood plantations, November 2013, by local government area

26
Figure 17 Proportion of the employed labour force working in the forest industry, November 2013, by local government area

27
Figure 18 Change in proportion of the employed labour force working in the forest industry, August 2008 to November 2013, by local government area

28
5. Forest and plantation management and harvesting
Area managed and harvested
The area of native forest and plantation being managed for commercial timber production was identified as part of the report, as of June 2013 for native forest and publicly owned plantations, and November 2013 for privately owned plantations. Areas were estimated using data supplied by survey participants, and cross-checked against other publicly available information, in particular Private Forests Tasmania (2013) and Ferguson (2013). Table 4 shows these areas for Tasmania as a whole, and for three wood supply regions within Tasmania (Northern, Southern and North West). The largest area of native forest managed for commercial timber production is located in the southern region; the largest area of softwood plantation in the northern region; and relatively large areas of hardwood plantations are located in both the northern and north-west regions.
Table 4 Area of native forest and plantation managed in 2013, by Forestry Tasmania district (hectares)
Native forest managed for commercial timber harvest Softwood plantation Hardwood plantation
Privately owned
1
Publicly owned
2 Total
Privately or jointly owned
3 Publicly managed
4 Total
Privately or jointly owned
3 Publicly managed
4 Total
Tasmania 177149 374870 393512 74276 4834 7911
0 177149 39203 216352
North East (Bass) Unable to be
estimated1
117370 Unable to be
estimated
1
Not reported by region to preserve
confidentiality
47638 70401 16775 87176
Southern (Derwent/ Huon) 174460
21107 42817 13460 56277
North West (Murchison) 83040
10365 63931 8969 72900
1Figure sourced from Private Forests Tasmania Annual Report 2012-13. Figures are not available by region.
2Data on publicly owned native forest are as of June 2013.
3Data for privately owned plantations are as of November 2013. Some of these plantations are established on land that is publically
owned, but the plantations are managed by private entities. 4Some of the area of plantation is partly owned by private entities; the plantations are managed by Forestry Tasmania.
Roundwood removals
The volume of roundwood harvested in Tasmania was estimated using survey data. Volumes were estimated using a cross-check system in which (i) harvest and haulage contractors were asked to report on volumes harvested and hauled, and (ii) growers and processors were asked to report on volumes of logs exported and volume of roundwood inputs used in processing. Having both sources of data enabled cross-checking for errors. Data were further checked against Private Forest Tasmania’s (2013) historical time series estimates of volumes harvested from private forests, and against ABARES (2013) estimates in the Australian Forest and Wood Products Statistics series.
Figure 19 shows the volume of roundwood removals over time in Tasmania, including historical data from ABARES (2013) and data for 2012-13 drawn from this study. There has been substantial decline in native forest harvest volumes since 2008, with this decline continuing during 2012-13, partly due to the buyback of some high quality sawlog quotas, as well as other aspects of implementation of the TFA. The volume of hardwood plantation harvested declined substantially during 2010-11 to 2011-12; the 2012-13 data suggest some growth in harvest volumes, but overall harvest volumes remained well below the average for

29
the latter half of the 2000s. Softwood plantation harvest has been more stable over time than harvest of native forest and hardwood plantation.

30
Figure 19 Volume of native forest, softwood plantation and hardwood plantation roundwood harvested in Tasmania, 2001-01 to 2012-13

31
6. Wood and paper production
Roundwood utilisation
The volumes of roundwood used as inputs by wood and paper processors operating in Tasmania were identified as part of the study. First, the number of processing sites that utilised different types of inputs was identified, shown in Table 5. There are a large number of types of wood and paper processors operating in Tasmania. The largest number are located in the ‘Bass’ (Northern) wood supply region, followed by the Southern region. Mills range from ‘boutique’ mills, defined as small mills that provide customised milling of products and typically process small volumes, to large scale sawmills using high volumes of throughput and creating a small number of products in large volumes.
Table 6 shows the type of roundwood inputs used by different types of mills. As some mills used multiple types of roundwood (for example, they might use logs from publicly owned native forest, privately owned native forest, and softwood plantation), the numbers add up to a greater total than the total number of processing sites in Tasmania.
Table 5 Number of processing sites by type and FT district, November 2013
North East (Bass)
North West (Murchison)
Southern (Derwent/ Huon)
Total number of processing sites
Boutique mills 2 1 4 7
Drying and secondary processing processors that do not process roundwood 3 1 4 8
Green sawmills 12 2 7 21
Green and dry sawmills 7 5 4 16
Other (particleboard, pulp and paper, veneer, post and pole production) 0 6 4 10
Woodchip 3 1 0 4
Total number processing sites 27 16 23 66
Includes three mobile sawmilling operations; some of these sawmills also undertake secondary processing (but have not been counted in the 'secondary processing' category as well)
32
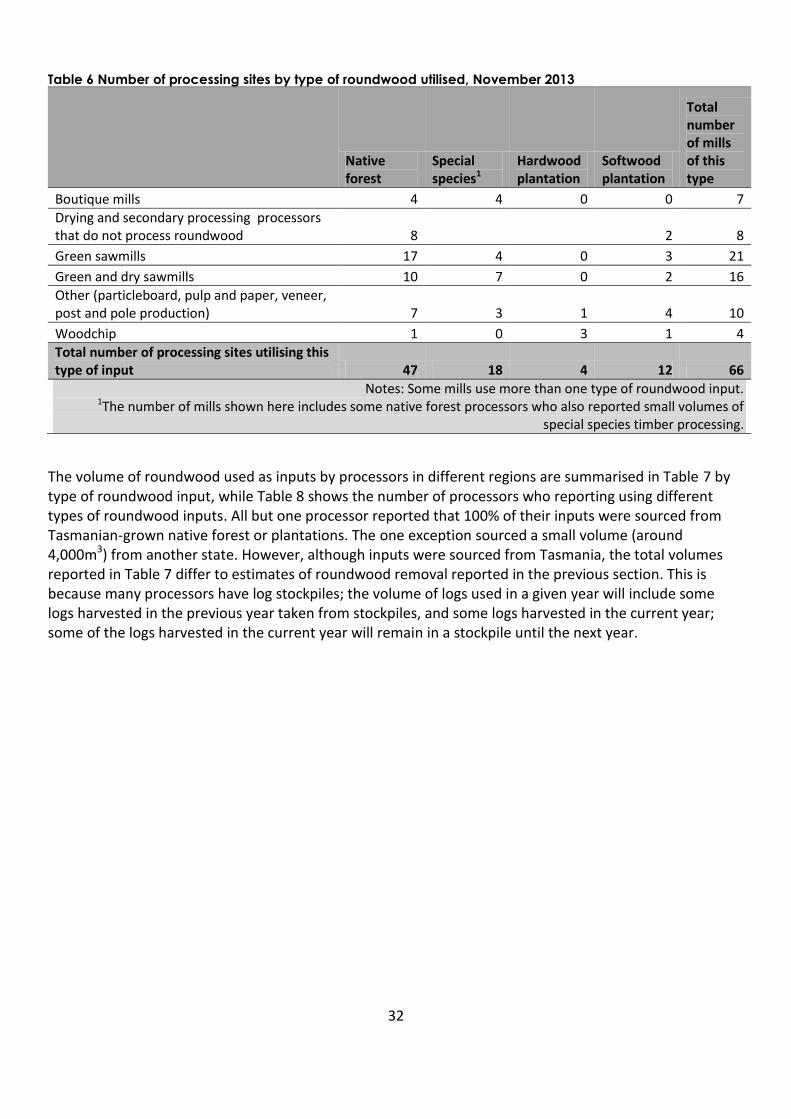
Table 6 Number of processing sites by type of roundwood utilised, November 2013
Native forest
Special species1
Hardwood plantation
Softwood plantation
Total number of mills of this type
Boutique mills 4 4 0 0 7
Drying and secondary processing processors that do not process roundwood 8
2 8
Green sawmills 17 4 0 3 21
Green and dry sawmills 10 7 0 2 16
Other (particleboard, pulp and paper, veneer, post and pole production) 7 3 1 4 10
Woodchip 1 0 3 1 4
Total number of processing sites utilising this type of input 47 18 4 12 66
Notes: Some mills use more than one type of roundwood input. 1The number of mills shown here includes some native forest processors who also reported small volumes of
special species timber processing.
The volume of roundwood used as inputs by processors in different regions are summarised in Table 7 by type of roundwood input, while Table 8 shows the number of processors who reporting using different types of roundwood inputs. All but one processor reported that 100% of their inputs were sourced from Tasmanian-grown native forest or plantations. The one exception sourced a small volume (around 4,000m3) from another state. However, although inputs were sourced from Tasmania, the total volumes reported in Table 7 differ to estimates of roundwood removal reported in the previous section. This is because many processors have log stockpiles; the volume of logs used in a given year will include some logs harvested in the previous year taken from stockpiles, and some logs harvested in the current year; some of the logs harvested in the current year will remain in a stockpile until the next year.

33
Table 7 Volume of roundwood used as inputs by processing sites in Tasmania, 2012-13, by roundwood type and FT district
Region
Volume of roundwood used as inputs by primary processors, 2012-13 (m3)
Public native forest - Cat 1/3 sawlog
Public native forest - Cat 2/8 sawlog
Public native forest - pulp log, peeler log, posts, poles and veneer
Private native forest - sawlogs
Private native forest - pulp log, peeler log, posts, poles and veneer
Special species timber
1
Eucalypt plantation - pulp logs
Eucalypt plantation - peeler log, posts, poles and veneer
Softwood plantation - sawlogs
Softwood plantation - pulp log, peeler log, posts, poles and veneer
North East 26991 15160
5950 64000 1904
377200 12646
North West 10600 19852
3035 11404
0 7664
Southern 86143 11914
1527 1817
0 560600
Tasmania 123734 46926 585385 10512 64450 15125 246920 550 377200 580910 1These figures include special species timber sourced from both public and private native forests. These two groups are not reported separately as too few
processors reported using inputs sourced from privately owned native forest to be able to report them as a separate group. In total, four mills reported using special species timbers sourced from privately owned native forests, and the total volume they reported sourcing in 2012-13 from these privately owned
forests was 470m3, making it a small proportion of overall special species inputs used.
Note: Some cells have been left blank to preserve confidentiality of individual businesses; these have been shaded grey. Where a business reported their input use in tonnes rather than cubic metres, the volume was converted to cubic metres.
Table 8 Number of Tasmania processing sites using different types of roundwood inputs, 2012-13, by roundwood type and FT district
Region
Number of processing sites reporting using this type of input, 2012-13
Public native forest - Cat 1/3 sawlog
Public native forest - Cat 2/8 sawlog
Public native forest - pulp log, peeler log, posts, poles and veneer
Private native forest - sawlogs
Private native forest - pulp log, peeler log, posts, poles and veneer
Special species timber
Eucalypt plantation - pulp logs
Eucalypt plantation - pulp log, peeler log, posts, poles and veneer
Softwood plantation - sawlogs
Softwood plantation - pulp log, peeler log, posts, poles and veneer
North East 8 12 1 9 3 5 2 1 6 2
North West 2 4 2 5 3 10 1 1 0 3
Southern 11 7 3 7 3 7 1 1 0 3
Tasmania 21 23 6 21 9 22 4 3 6 8
Note: Several processing sites used more than one type of log input; therefore totals add up to greater than the total number of processing sites in Tasmania.

34
Production and markets
Sawntimber and other wood and paper production
The volume of primary outputs produced by wood and paper processors in 2012-13 is reported in this section. Primary outputs here refers to the higher value products that are the primary purpose of production for each type of processor. The secondary outputs produced – residues of production that are lower in value and, while sold, are not the primary purpose of production – are described in the next section, as is woodchip production more broadly.
Production of sawntimber is reported by type in Table 9. However, the number of businesses producing posts and poles, particleboard, veneer, pulp and paper is too small to enable separate reporting of the volume of production in each of these categories, or reporting by region. They are therefore reported as a single group, to avoid identification of individual businesses. Table 10 reports volume of production from native forest roundwood (the same data could not be reported for hardwood plantation and softwood plantation roundwood, due to the small number of processors involved).
Table 9 Volume of production by product and log type
Sawntimber production
Veneer, pulp, paper, posts, poles
Woodchips (produced from pulplogs or as milling byproducts from other logs)
Green structural
Green appearance
Green other (e.g. palings, pallets, specialty products)
Dry - non-appearance
Dry appearance - select
Dry appearance - standard
Hardwood plantation 0 0 0 0 0 0 0 244654
Native forest 15422 34885 5365 7292 15939 8326 559242
Special species timbers 215 3571 1306 123 2412 499 4229
Softwood plantation 199470 30 335 120100 0 3000 103900
All 215107 38486 7006 127515 18351 11825 354073 912025
Table 10 Volume of production from native forest roundwood, by district
Green sawntimber (all types)
Dry sawntimber (all types)
Veneer, pulp, paper, posts, poles
Woodchips (produced from pulplogs or as milling byproducts from other logs)
Bass 8543 8450
Derwent East 2301 871
Derwent West 9398 13463
Huon 15200 2380
Mersey 10487 4412
Murchison 9044 1981
Unknown 700 0
Total 55672 31557 113060 559242
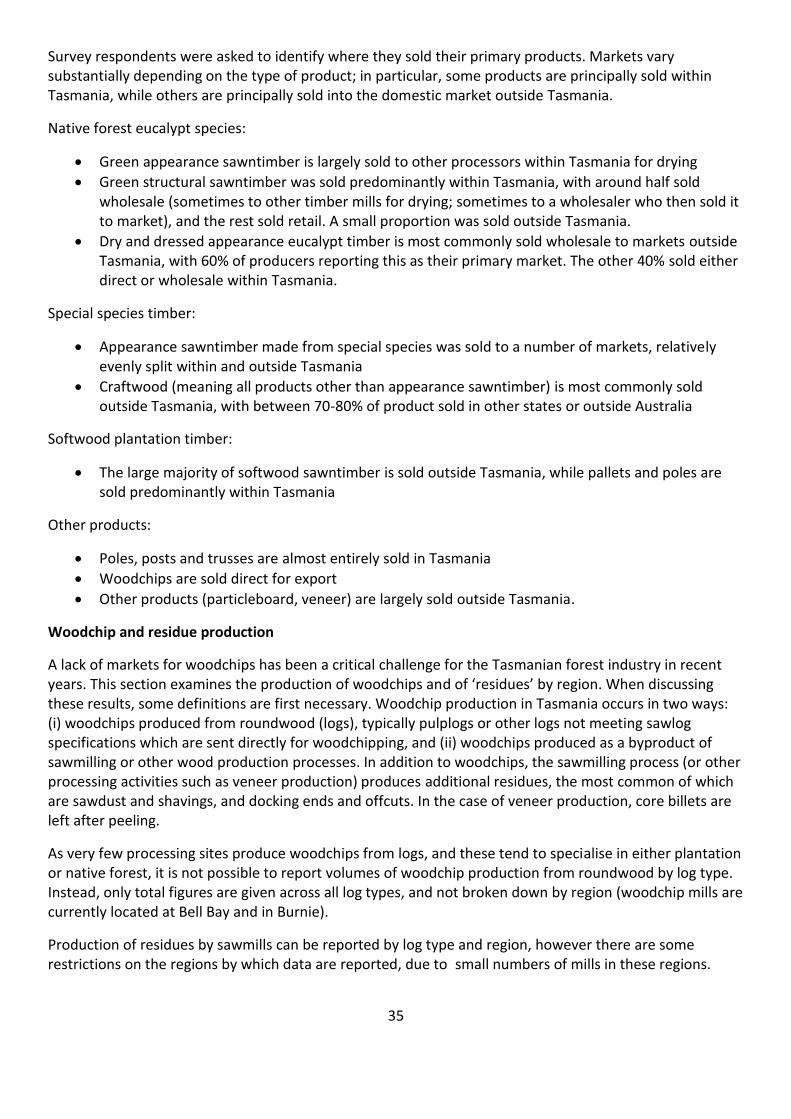
35
Survey respondents were asked to identify where they sold their primary products. Markets vary substantially depending on the type of product; in particular, some products are principally sold within Tasmania, while others are principally sold into the domestic market outside Tasmania.
Native forest eucalypt species:
Green appearance sawntimber is largely sold to other processors within Tasmania for drying
Green structural sawntimber was sold predominantly within Tasmania, with around half sold wholesale (sometimes to other timber mills for drying; sometimes to a wholesaler who then sold it to market), and the rest sold retail. A small proportion was sold outside Tasmania.
Dry and dressed appearance eucalypt timber is most commonly sold wholesale to markets outside Tasmania, with 60% of producers reporting this as their primary market. The other 40% sold either direct or wholesale within Tasmania.
Special species timber:
Appearance sawntimber made from special species was sold to a number of markets, relatively evenly split within and outside Tasmania
Craftwood (meaning all products other than appearance sawntimber) is most commonly sold outside Tasmania, with between 70-80% of product sold in other states or outside Australia
Softwood plantation timber:
The large majority of softwood sawntimber is sold outside Tasmania, while pallets and poles are sold predominantly within Tasmania
Other products:
Poles, posts and trusses are almost entirely sold in Tasmania
Woodchips are sold direct for export
Other products (particleboard, veneer) are largely sold outside Tasmania.
Woodchip and residue production
A lack of markets for woodchips has been a critical challenge for the Tasmanian forest industry in recent years. This section examines the production of woodchips and of ‘residues’ by region. When discussing these results, some definitions are first necessary. Woodchip production in Tasmania occurs in two ways: (i) woodchips produced from roundwood (logs), typically pulplogs or other logs not meeting sawlog specifications which are sent directly for woodchipping, and (ii) woodchips produced as a byproduct of sawmilling or other wood production processes. In addition to woodchips, the sawmilling process (or other processing activities such as veneer production) produces additional residues, the most common of which are sawdust and shavings, and docking ends and offcuts. In the case of veneer production, core billets are left after peeling.
As very few processing sites produce woodchips from logs, and these tend to specialise in either plantation or native forest, it is not possible to report volumes of woodchip production from roundwood by log type. Instead, only total figures are given across all log types, and not broken down by region (woodchip mills are currently located at Bell Bay and in Burnie).
Production of residues by sawmills can be reported by log type and region, however there are some restrictions on the regions by which data are reported, due to small numbers of mills in these regions.

36
Table 11 summarises production of all types of woodchips and residues, by region, irrespective of whether the residues are produced from native forest (including both eucalypt and special species), softwood plantation or hardwood plantation.
Table 11 Production of woodchips and residues, by region, for all log types
Woodchip production from roundwood
Woodchips and other residues produced as byproduct of wood processing (eg sawmilling, veneer production)
Woodchips Sawdust & shavings
Other & unspecified (includes fuelwood, firewood)
Total byproduct residue production
Huon
19300 8400 12060 39760
Derwent West 13960 6400 55300 75660
Derwent East 7570 4580 190 12340
Bass 103650 38000 52620 194270
Mersey 13260 6460 870 20590
Murchison 18080 8350 15800 42230
Total 736000 175900 72340 137040 385280
Regions were defined by grouping local government areas. Huon = Huon Valley and Kingborough LGAs; Derwent West = Derwent Valley and all Hobart LGAs; Derwent East = Southern Midlands, Sorell and Tasman; Bass = Break O’Day, Dorset, Launceston, George Town; Mersey = Northern Midlands, West
Tamar, Meander Valley, Latrobe, Devonport, Central Coast; Murchison = Burnie, Circular Head, Waratah-Wynyard, West Coast
Table 12 shows the proportion of residues produced as mill byproducts that are sourced from native forest, softwood plantation and hardwood plantation logs. This is not shown by region, as softwood plantation and hardwood plantation residue production occurs at too few mills to report data by individual region. Native forest residue byproduction, however, can be shown for several regions, and this is shown in Table 13.
Table 12 Production of woodchips and residues, by log type
Woodchips and other residues produced as byproduct of wood processing (eg sawmilling, veneer production)
Woodchips Sawdust & shavings
Other & unspecified (includes fuelwood, firewood)
Total byproduct residue production
Native forest (includes eucalypt and special species timbers)
82920 50720 39300 172950
Softwood plantation
92990 21170 96100 210250
Hardwood plantation
- 460 1640 2100
Total 175900 72340 137040 385280
In addition to the residue production described in this table, there are small additional volumes produced by some small mills who could not report accurate residue volumes. These volumes would represent <2%
of the volumes reported here.

37
Table 13 Production of native forest woodchips and residues, by region
Woodchips and other residues produced as byproduct of wood processing (eg sawmilling, veneer production)
Woodchips Sawdust & shavings
Other & unspecified (includes fuelwood, firewood)
Total byproduct residue production
Huon 19300 8400 12060 39760
Derwent West 13960 6400 300 20660
Derwent East 7570 4580 190 12330
Bass 11500 17250 11200 39950
Mersey 12430 5990 590 19010
Murchison West 18080 7940 14770 40780
Total 82920 50720 39300 172950
Regions were defined by grouping local government areas. Huon = Huon Valley and Kingborough LGAs; Derwent West = Derwent Valley and all Hobart LGAs; Derwent East = Southern Midlands, Sorell and Tasman; Bass = Break O’Day, Dorset, Launceston, George Town; Mersey = Northern Midlands, West
Tamar, Meander Valley, Latrobe, Devonport, Central Coast; Murchison = Burnie, Circular Head, Waratah-Wynyard, West Coast
Figures include production from both eucalypt species and special species
Mills were asked to describe the current market destinations for residues produced as a byproduct of wood processing. Figure 20 summarises the reported market destinations by volume. A known limitation of these data is that not all businesses provided information on the volume stockpiled versus sold. This was because some businesses with stockpiled residues could not estimate the extent to which volume of residues produced in the last year was sold versus stockpiled (with some stockpiled containing materials from more than one year).
Woodchips were predominantly sold to businesses who exported them (these businesses typically also produced woodchips from roundwood). However, several businesses reported they were either stockpiling woodchips, or had found alternative sale options for them within Tasmania, and a small number reported burning some woodchips on site as they were unable to find markets for them. Several businesses also commented that woodchips sold for export were sold at cost, with no return made on them.
The next most common use was the sale of sawdust, shavings, and less commonly woodchips, to Tasmanian businesses that used them for a wide range of purposes. This was most commonly reported as being done through sale, although some mills producing small volumes reported they gave away residues for these purposes (with the user transporting the product from the processing site). The most commonly listed uses were:
Sale to garden/nursery/landscaping businesses for use as mulch or compost,
Sale to businesses who keep animals, particularly chicken farms and horse stables,
Packing material, with residues used to provide padding or packing for other goods, and
Lining and covering material, for example lining bins or trucks being used to transport waste, or covering landfill.
The third most common was burning of residues to produce energy. This was predominantly done for onsite energy production by wood processors, but in some cases processors reported selling residues to businesses outside the forest industry who then burned it for energy production.

38
Sale of firewood was the fourth most common use. However, some businesses who sell residues for firewood reported that the available market was only able to absorb a limited proportion of the total amount of firewood they could produce.
A small number of businesses – predominantly those producing smaller volumes – reported that they gave away residues rather than selling them, or that they burned excess residues on site to get rid of them (without using this burning to produce energy).
Figure 20 Reported uses of byproduct residues by Tasmanian wood and paper processors

39
7. Harvest and haulage capacity and infrastructure
The capacity of industry infrastructure was assessed as part of the survey. Infrastructure here refers principally to the equipment used by contractors, and built infrastructure in the form of processing plants. This was in response to anecdotal reports that, since the contractor exit packages were implemented, there has been some shortage of harvest and haulage capacity in the industry. To assess capacity, harvest and haulage contractors were asked to identify what proportion of their equipment capacity they were operating at; and also asked questions about their labour use policies.
Figure 21 shows the utilisation of harvest equipment reported by harvest and haulage contractors, while Figure 22 shows utilisation of haulage equipment. Utilisation is shown for three groups: contractors operating (i) solely in native forest; (ii) solely in plantations; and (iii) in both plantations and in native forest. In the latter group, the proportion of work undertaken in plantations versus native forest varied by business. Across all the businesses who worked in plantations and in native forest, a total of 56.9% of their work was harvest/haulage of native forest timber, and 43.1% was harvest/haulage of plantation timber.
The large majority of harvest contractors – greater than 80% - were utilising 80% or more of the capacity of their equipment in November 2013 (Figure 21). Less than one in ten was utilising below 60% of their equipment’s capacity. Haulage equipment was less fully utilised (Figure 22), although three-quarters of respondents reported utilising 80% or more of their current haulage capacity. Those operating solely in plantations reported using a higher proportion of their equipment’s capacity compared to those working solely in native forests, or in a mix of native forest and plantation areas.
The majority of contractors utilise equipment on a single shift basis, with 90% of harvest and haulage contractors reporting they do not double shift (n=30).
This suggests a substantial increase in the utilisation of equipment since Schirmer et al. (2011) identified substantial underemployment in harvest and haulage contracting (meaning that many workers were not employed at full capacity, working fewer hours than they desired or than they had a few years previously). However, the exact level of change cannot be estimated as questions quantifying utilisation were not asked by Schirmer et al (2011).

40
Figure 21 Proportion of harvesting equipment being utilised by harvest contractors, Nov 2013 (where 100% is
the maximum possible given the need for some downtime, maintenance etc)
Figure 22 Proportion of haulage equipment being utilised by haulage contractors, Nov 2013 (where 100% is
the maximum possible given the need for some downtime, maintenance etc)
To further examine industry capacity, harvest and haulage contractors were asked to estimate the maximum volume they could harvest in the sectors they currently operate in (native forest, softwood

41
plantation, and hardwood plantation). This information was used to estimate the maximum volumes able to be harvested and hauled utilising current harvest and haulage equipment in Tasmania, utilising the single shift system that most operators employ. Table 14 shows the estimated capacities. However, the estimates can be considered accurate to within ±15% at best, with most contractors finding it difficult to estimate maximum harvest and haulage capacity given the large number of factors that influence harvest and haulage capacity – including haulage distance, level of difficulty involved in harvesting a given coupe, and equipment maintenance needs. Variance in any of these factors leads to large differences in the maximum amount that can be harvested and hauled in a given period of time, making it difficult to estimate a ‘maximum’ capacity.
The estimates suggest there is currently capacity somewhere between four and six million tonnes of logs, which according to ABARES figures on roundwood removals in Tasmania, is very broadly equivalent to actual harvest levels in 2009-10 and 2010-11 (ABARES 2013), during which 4.77 million cubic metres and 4.90 million m3 were harvested respectively; but substantially higher than the volume harvested during 2011-12 (2.61 million m3), or 2012-13 (2.18 million m3). However, this may be an overestimate of capacity, as several contractors estimated maximum capacity based on optimal conditions (coupes that are easy to harvest; short transport distances; etc).
Additionally, several contractors reporting that difficulty obtaining skilled labour to operate equipment was the principal constraint they faced, rather than difficulty with equipment capacity.
Table 14 Estimated maximum volume of native forest and plantation able to be harvested and hauled to mill
utilising current equipment and shift structures
Native forest (tonnes) Softwood & hardwood plantation (tonnes)
Maximum volume of roundwood able to be harvested1
1,064,000 (±15%) 4,015,000 (±15%)
Maximum volume of roundwood able to be hauled from harvest coupe to mill1 977,000 (±15%) 3,961,000 (±15%)
1 These estimates assume the following: that businesses utilise only existing equipment; that they maintain their current use of
single shifts; that the average distance for haulage remains stable; and that logging conditions do not change substantially, meaning that the proportion of coupes with difficult versus easy harvesting conditions does not change. Change in any of these factors would result in change in the volume able to be harvested and hauled. Estimates were generated based on (i) identifying the volumes reported by survey respondents, and (ii) estimating volumes for non-respondents based on the ratio of estimated employment generated by respondents versus non-respondents. Survey respondents who provided data for this question employed an estimated 85.6% of the total number of people employed harvesting and hauling roundwood from native forest, 75.8% of those employed harvesting and hauling softwood plantation, and 74.0% of those employed in harvesting and hauling hardwood plantation volumes. This means the estimates are based on data from businesses representing a large proportion of current roundwood harvest and haulage activity in Tasmania.

42
8. Expenditure
Estimating forest industry expenditure is typically challenging, largely due to (i) low response rates to expenditure questions on forest industry surveys, and (ii) some businesses finding it difficult to accurately estimate expenditure. For these reasons, previous estimates of expenditure in the Tasmanian forest industry have been presented as a range rather than a single figure, to ensure the uncertainty in expenditure estimates is appropriately represented and understood.
In the survey conducted for this report, 40% of all forest industry businesses provided data on their expenditure. The businesses that responded employed 56.2% of all people working in the forest industry. Confidence intervals were calculated based on the number of businesses that responded by sector. Overall, the estimates could be considered accurate to 95% confidence at a range of ±6.74%, and this interval was used to estimate the range of possible expenditure by the industry.
Table 15 summarises expenditure by different sectors, and the total estimated expenditure after removing transfers within the industry (for example, when calculating the total, amounts that processors had paid to growers for log inputs were removed, as these are already counted as part of grower’s expenditure and hence would generate double counting if retained).
Between 2005-06 and 2012-13, expenditure has fallen by approximately 70% in the industry (although given the difficulty of estimating expenditure, this is better considered as a broad estimate). Employment has declined by 57.6% during the same period. Even considering the potential for error in estimation of expenditure, expenditure has declined more than employment.
Three potential reasons for this were identified. First, businesses in 2012-13 were investing significantly less in capital equipment than they were in 2005-06, and while businesses are beginning to feel more positive about potential for future investment (see Section 10), this positive outlook is not yet translating into actual investment on a large scale. In 2005-06, in contrast, many businesses were investing in capital equipment. Second, Schirmer et al. (2011) reported that many businesses had substantially reduced running costs to cope with the downturn in the forest industry during 2008 to 2011, and this is likely to have reduced expenditure per employee. Third, internal transfers within the industry have increased: growers are reporting a greater percentage of expenditure going to contractors, while processors are reporting a higher average percentage of expenditure going to log inputs.
Table 15 Estimated expenditure by the Tasmanian forest industry, 2005-06 to 2012-13
Forest industry sector
Estimated expenditure Approx. change, 2005-06 to 2012-13 2005-06 2007-08 2012-13
Growers and processors
$940-1020 million
Not identified
$460-526 million ($360-$436 excluding transfers)
-57 to -61%
Contractors and others
$480-580 million $147-168 million -69 to -71%
Total Excludes transfers between sectors
$1420-1600 million $1490-1730 million
$395-452 million -68 to -72%
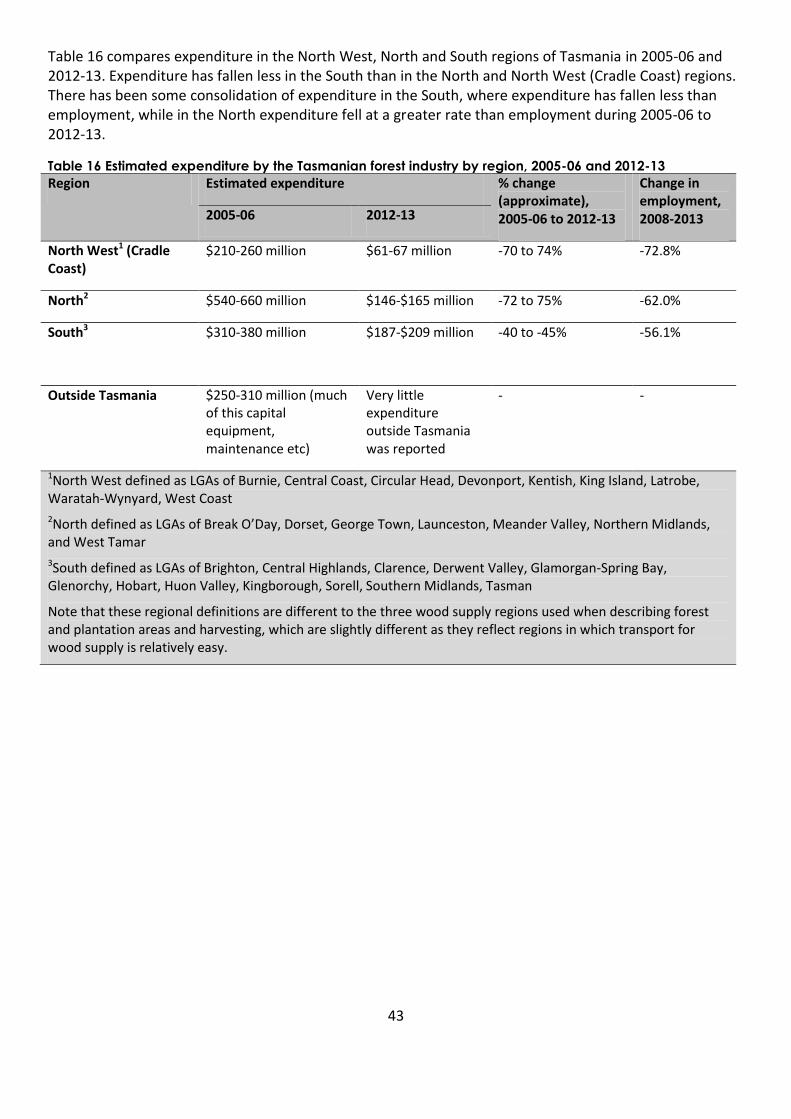
43
Table 16 compares expenditure in the North West, North and South regions of Tasmania in 2005-06 and 2012-13. Expenditure has fallen less in the South than in the North and North West (Cradle Coast) regions. There has been some consolidation of expenditure in the South, where expenditure has fallen less than employment, while in the North expenditure fell at a greater rate than employment during 2005-06 to 2012-13.
Table 16 Estimated expenditure by the Tasmanian forest industry by region, 2005-06 and 2012-13
Region Estimated expenditure % change (approximate), 2005-06 to 2012-13
Change in employment, 2008-2013 2005-06 2012-13
North West1 (Cradle Coast)
$210-260 million $61-67 million -70 to 74% -72.8%
North2 $540-660 million $146-$165 million -72 to 75% -62.0%
South3
$310-380 million $187-$209 million -40 to -45% -56.1%
Outside Tasmania $250-310 million (much of this capital equipment, maintenance etc)
Very little expenditure outside Tasmania was reported
- -
1North West defined as LGAs of Burnie, Central Coast, Circular Head, Devonport, Kentish, King Island, Latrobe, Waratah-Wynyard, West Coast
2North defined as LGAs of Break O’Day, Dorset, George Town, Launceston, Meander Valley, Northern Midlands, and West Tamar
3South defined as LGAs of Brighton, Central Highlands, Clarence, Derwent Valley, Glamorgan-Spring Bay, Glenorchy, Hobart, Huon Valley, Kingborough, Sorell, Southern Midlands, Tasman
Note that these regional definitions are different to the three wood supply regions used when describing forest and plantation areas and harvesting, which are slightly different as they reflect regions in which transport for wood supply is relatively easy.

44
9. Business profitability
The average profitability of different types of businesses was explored based on survey responses. Figure 23 summarises the profitability of businesses that provided information on revenue and expenditure for the survey. Businesses that had maintained or grown business activity in recent years were slightly more likely to provide revenue data compared to those who had experienced decline in recent years (more businesses provided expenditure than revenue data, with little bias identified in the expenditure information provided). Thus there is a bias towards businesses that are performing well in the profitability data. As can be seen in Figure 22, the majority of the 54 businesses who provided data reported that they made a profit, although some of these did not include a value for owner’s salaries in their reporting, so would have made a lower profit than suggested in Figure 23.
This is relatively similar to figures reported by Schirmer et al. (2011), who reported profitability data based on a sample of 30 businesses:
In 2012-13, 57.4% of businesses reported making a profit, compared to 63% in 2010-11
In 2013-13, 42.6% of businesses reported breaking even or making a loss, compared to 37% in 2010-11.
The differences between 2012-13 and 2010-11 findings may be a result of small sample sizes, rather than actual changes, and overall do not suggest a substantial change in profitability between the two periods.
Figure 23 Profitability reported by different types of forest industry business in 2012-13
45
10. Changes in business structure and management
Business expectations and investment intentions
Businesses in the industry were asked how likely it was that, during the year following the survey (in other words, during November 2013 to December 2014), they would:
Invest in new capital equipment or reduce their capital equipment (e.g. by selling or otherwise offloading equipment)
Increase or decrease the size of their workforce
Make an overall profit or loss in their business.
These questions were answered by the majority of businesses who completed the full survey. They were answered in late 2013, and as such reflect expectations at that time, which may have changed since that point. As not all respondents chose to answer questions, an analysis of any potential for response bias was undertaken. Those who did not answer the questions were typically sawmillers who were negotiating to exit the industry as part of the Tasmanian Regional Sawmiller Structural Adjustment Grants Program, with those who planned to leave the industry altogether typically choosing not to answer the questions, as they felt the questions did not apply to them given they were committed to exiting the industry. Non-respondents who were not exiting sawmillers showed no particular pattern: some had expanded their employment in recent years while other had decreased it, suggesting there is no strong response bias in answers to the questions.
Two groups have low numbers of responses – growers, silvicultural contractors and nurseries; and roading contractors. For these two groups it is not possible to be confident that the opinions of those who responded represent the entire sector. For other groups – processors, and harvest and haulage contractors – there is strong confidence that the results are representative.
Overall, businesses reported some confidence in the future for the 12 months from November 2013. Very few reported that in that 12 months they expected to reduce their capital equipment (Figure 24), reduce the size of their workforce (Figure 26), or make an overall loss in their business (Figure 28). A majority believed it was likely they would invest in new capital equipment in the next year (Figure 25), and that their business would make an overall profit in the next 12 months (Figure 27). Fewer planned to expand the size of their workforce in the next 12 months, although a majority of harvest and haulage contractors, and almost 40% of processors considered it likely that they would increase their workforce (Figure 29).

46
Figure 24 Response to question ‘How likely are you to do the following in the next year – Reduce your capital
equipment’
Figure 25 Response to question ‘How likely are you to do the following in the next year – Invest in new
capital equipment’

47
Figure 26 Response to question ‘How likely are you to do the following in the next year – Reduce the size of
your workforce’
Figure 27 Response to question ‘How likely are you to do the following in the next year – Increase the size of
your workforce’

48
Figure 28 Response to question ‘How likely are you to do the following in the next year – Make an overall
loss in your business’
Figure 29 Response to question ‘How likely are you to do the following in the next year – Make an overall
profit in your business’
Businesses were then asked (i) what would encourage them to invest more in their business, and (ii) what factors would trigger them to downsize or close their business. Those involved in growing and processing were also asked what factors most affected their future outlook in general. These were asked as open-ended questions, and the responses of businesses were then analysed to identify the most and least common themes in responses. Tables 17 and 18 summarise the most common responses from different types of forest industry business.

49
The factors needed to encourage investment in businesses were different depending on the part of the industry.
Harvest and haulage contractors focused on a need for more sustainable rates of pay for contracting services, and having more secure and longer-term contracts that guarantee a volume of work. Overall markets for wood products were a less commonly discussed issue for these contractors.
Processors focused on a need for access to a stable, long-term wood supply of appropriate quality and type. Several emphasised that the need was not simply for access to a volume of supply, but to a quality of supply that met the requirements of their market, and to types of species relevant to their markets. Processors also identified, although to a lesser extent, a need for greater market confidence in the industry, and consistency of government policy or support for the industry.
Factors that would trigger business downsizing or closure were largely focused around markets for growers and contractors, and to a lesser extent processors (who more commonly described loss of suitable timber supply as the biggest trigger of closure or downsizing). The market need was most commonly described as a need to avoid any loss of market demand in order to stay viable. Increasing costs and competition in the market were also cited as factors that would trigger downsizing or closure.
When asked about more general outlook, there was a similar focus on achieving suitable quality and quantity of wood supply, but a greater focus on the need to be able to access markets, and for stable and supportive government policy for the industry (Table 19).

50
Table 17 Factors that would encourage investment by forest industry businesses
Growers (n=4) Additional work, e.g. new forest or plantations areas to manage (n=2)
Greater consistency in government policy (n=1)
Grants to assist investment in equipment (n=1)
Harvest and haulage contractors (n=30)
Greater security and certainty of contracts, and related guarantees of work and pay: (n=28) o More sustainable pay rates for work (n=14) o Greater contract security, and longer-term contracts (n=9) o Fairer contract terms e.g. take or pay clauses (n=6) o Less fluctuation in available work (n=5) o Being paid on time (n=2)
Greater certainty and security in the industry overall (n=15) o Greater overall security of forest industry markets (n=5) o Greater political certainty for the industry (n=4) o Stable and consistent markets for wood products (n=3) o Greater government support for the industry (n=3)
Increased ability to invest (n=10) o Greater access to finance (often described as something that requires longer-term
contracts that can support financing) (n=7) o Increased ability to invest in replacing equipment (n=3)
Other factors (n=5): o ‘A more level playing field’. This was associated with concern about reports that some
who received exit grants are still involved in the industry) (n=4) o Improved workplace safety (n=1)
Processors (n=30) Wood supply (n=15) o Increased access to wood supply of suitable quality (n=12) o Secure wood supply into the future (n=9)
Markets (n=8) o Improved residue markets (n=3) o Greater consumer confidence in, and support of, industry - specifically through purchase
of Tasmanian wood and paper products (n=2) o Increased market demand (n=2) o More certainty of market e.g. long term supply contracts with customers (n=1)
Greater certainty and security in the industry overall (n=5) o Government support via grants or assistance with accessing investment funds (n=2) o Stable government support for industry (n=2) o Access to finance (n=1)
Reduction in business cost pressures (n=5) o Fall in value of Australian dollar (n=2) o Increased business profitability (n=2) o Reduced freight costs to get product to market (n=1)
Other (n=1) o Improved forest management (n=1)
Roading contractors (n=6)
More confidence and investment in forest industry (n=4) Greater security of government support for industry (n=3) Greater access to skilled labour (n=2)
Silvicultural contractors (n=3)
Upturn in industry (n=2) More stable government support for industry (n=1)
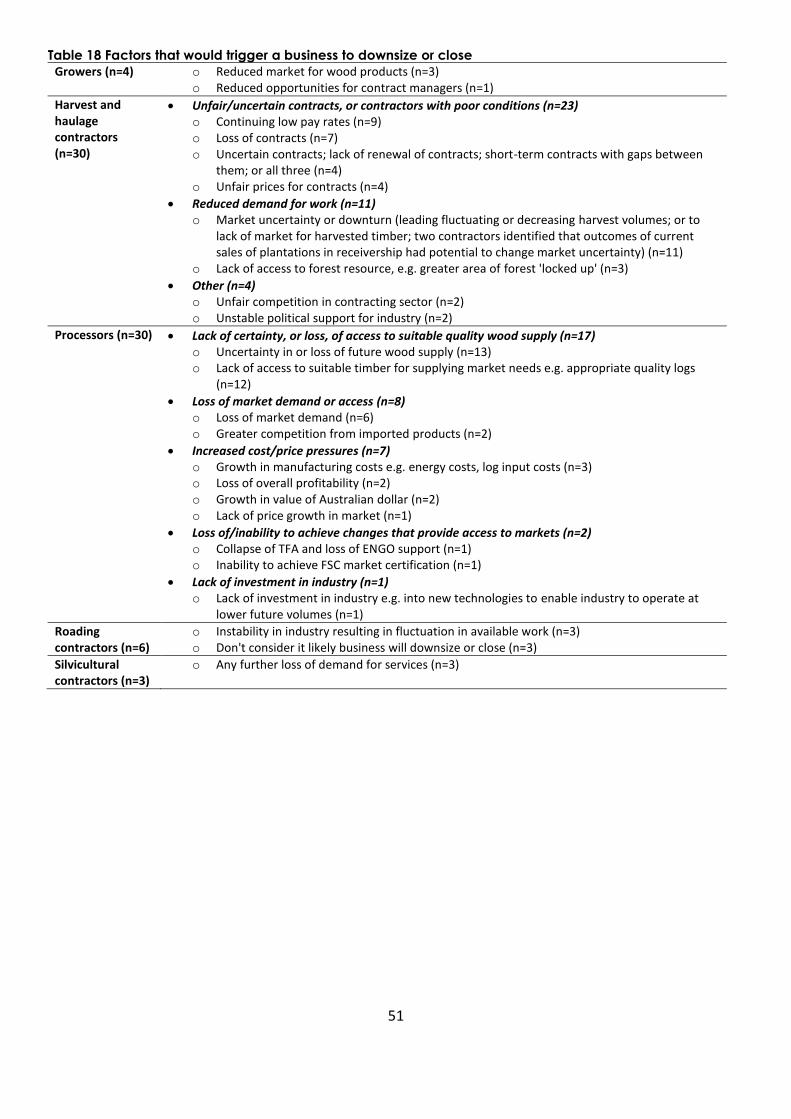
51
Table 18 Factors that would trigger a business to downsize or close
Growers (n=4) o Reduced market for wood products (n=3) o Reduced opportunities for contract managers (n=1)
Harvest and haulage contractors (n=30)
Unfair/uncertain contracts, or contractors with poor conditions (n=23) o Continuing low pay rates (n=9) o Loss of contracts (n=7) o Uncertain contracts; lack of renewal of contracts; short-term contracts with gaps between
them; or all three (n=4) o Unfair prices for contracts (n=4)
Reduced demand for work (n=11) o Market uncertainty or downturn (leading fluctuating or decreasing harvest volumes; or to
lack of market for harvested timber; two contractors identified that outcomes of current sales of plantations in receivership had potential to change market uncertainty) (n=11)
o Lack of access to forest resource, e.g. greater area of forest 'locked up' (n=3)
Other (n=4) o Unfair competition in contracting sector (n=2) o Unstable political support for industry (n=2)
Processors (n=30) Lack of certainty, or loss, of access to suitable quality wood supply (n=17) o Uncertainty in or loss of future wood supply (n=13) o Lack of access to suitable timber for supplying market needs e.g. appropriate quality logs
(n=12)
Loss of market demand or access (n=8) o Loss of market demand (n=6) o Greater competition from imported products (n=2)
Increased cost/price pressures (n=7) o Growth in manufacturing costs e.g. energy costs, log input costs (n=3) o Loss of overall profitability (n=2) o Growth in value of Australian dollar (n=2) o Lack of price growth in market (n=1)
Loss of/inability to achieve changes that provide access to markets (n=2) o Collapse of TFA and loss of ENGO support (n=1) o Inability to achieve FSC market certification (n=1)
Lack of investment in industry (n=1) o Lack of investment in industry e.g. into new technologies to enable industry to operate at
lower future volumes (n=1)
Roading contractors (n=6)
o Instability in industry resulting in fluctuation in available work (n=3) o Don't consider it likely business will downsize or close (n=3)
Silvicultural contractors (n=3)
o Any further loss of demand for services (n=3)

52
Table 19 Factors that affect overall outlook of business
Growers (n=4) o Lack of availability of skilled labour, and difficulty retaining skilled labour, specifically harvest and haulage contractors, and professional foresters (n=3)
o Outcomes of current plantation sales processes (n=2)
Processors (n=33) Ability to access wood supply of adequate quality, quantity and affordability (n=16)
Availability of market demand (n=11) o Residue markets (n=6) o Markets in general (n=8)
Supportive and stable government policy (n=10) o Need for stability of support (n=6) o Need for greater support (n=5)
Ability to compete against other suppliers (n=9) o Difficulty competing with imports (n=3) o High Australian dollar changing competitiveness of exports (n=3) o Difficulty maintaining low business costs (n=3)
Peace agreement (n=5) o Need to invest in ensuring peace agreement succeeds in order to improve future outlook
(n=3) o Opposition to peace agreement (n=2)
Forest Stewardship Certification (n=1) o Need to support achievement of FSC by Forestry Tasmania (n=1)

53
Certification
Growers and processors were asked whether they were (i) currently certified under the Australian Forestry Standard (AFS) or one of the Forest Stewardship Council (FSC) interim certification standards, or (ii) if they were not currently certified, were planning to apply for certification in the next 12 months. Table 20 shows responses. Some businesses indicated confusion about what certification they held; for a small number this was due to lack of awareness that Fine Timber Tasmania certification was part of the AFS certification system. Responses were therefore checked against registered businesses to ensure all certified businesses were included in estimates.
Many more businesses are AFS certified than FSC certified currently. All growers who answered this question had AFS certification; two had FSC certification, while the remainder were planning to apply for FSC certification in the next 12 months.
Just under half of processors reported having AFS certification, while a further 10% planned to apply for AFS certification in the next 12 months. Fewer had FSC certification: in total approximately 30% either currently had some form of FSC certification or planned to apply for it within the next 12 months. Three processors indicated they would consider FSC certification if FSC certified wood supply became a possibility for their business, something dependent on more growers achieving FSC certification.
Table 20 Certification held by growers and processors, and intention to certify in next 12 months
Growers (n=5) Note: Some growers also have processing activities and have certification relevant to these
Processors (n=42)
Currently certified
Currently applying or planning to apply for certification in next 12 months
Currently certified
Currently applying or planning to apply for certification in next 12 months
Australian Forestry Standard (AFS) certification
100% 0% 43% 10%
AFS chain of custody certification
80% 0% 49% 10%
Forest Stewardship Council (FSC) certification
2 FM: 40% Controlled wood: 20%
FM: 60% Controlled wood: 40%
10% 19%
FSC chain of custody certification
80% 0% 14% 14%
ISO140011
60% 0% 0% 0% 1Estimates of ISO14001 certification are likely an underestimation, as businesses were not asked directly if they had
this certification, but instead entered it under ‘other certification schemes’. It is likely some ISO14001 certified businesses did not list this certification in the ‘other’ category. 2Controlled wood has been identified as produced from ‘FSC acceptable sources’ but is not FSC certified. It can be
mixed with certified materials as part of products labelled as ‘FSC mix’. FM refers to ‘forest management certification’ and means the plantation or forest has been forest management certified as being managed in line with FSC principles and criteria.
Adapting to change
The Tasmanian Forests Agreement (TFA) included measures likely to result in change for processors of native forest timber, and had already resulted in some change in the forest industry at the time the survey was conducted. At the time the survey was undertaken, the TFA was in early stages of implementation, and businesses were asked a number of questions relating to the changes they anticipated would occur under the TFA. The views reported below are those held by businesses about the TFA prior to the Tasmanian state election in March 2014. Since the election and change of government, there have been
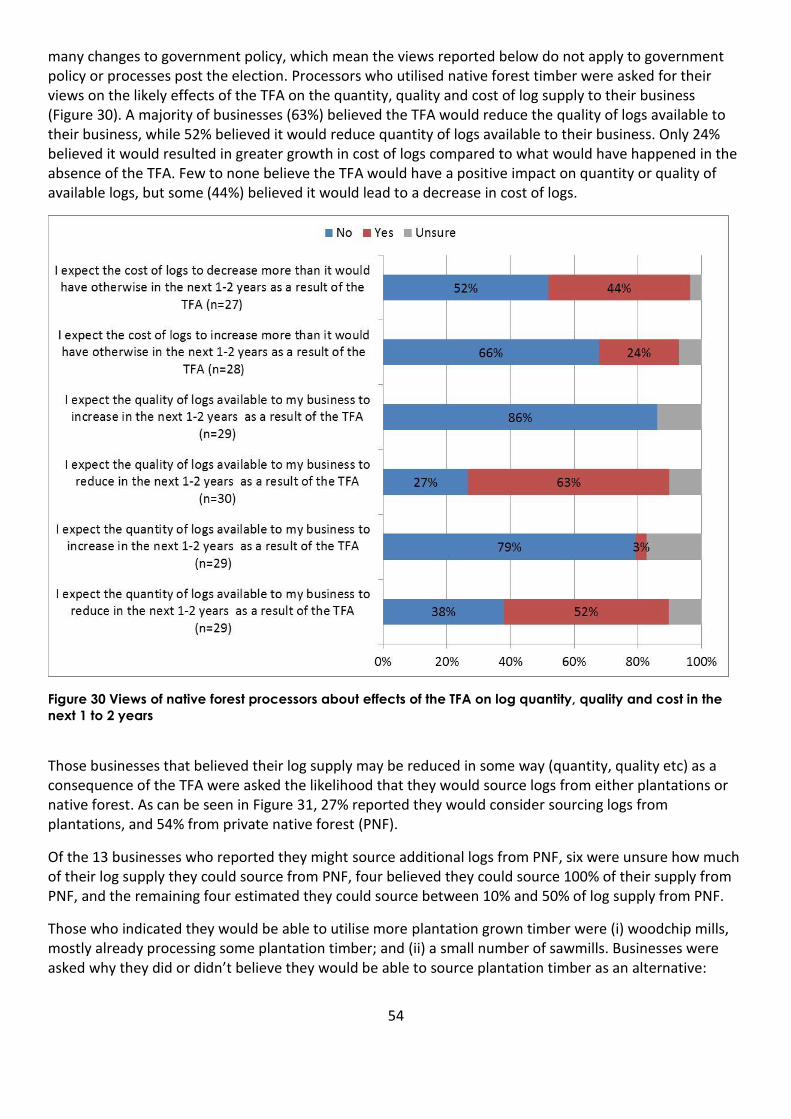
54
many changes to government policy, which mean the views reported below do not apply to government policy or processes post the election. Processors who utilised native forest timber were asked for their views on the likely effects of the TFA on the quantity, quality and cost of log supply to their business (Figure 30). A majority of businesses (63%) believed the TFA would reduce the quality of logs available to their business, while 52% believed it would reduce quantity of logs available to their business. Only 24% believed it would resulted in greater growth in cost of logs compared to what would have happened in the absence of the TFA. Few to none believe the TFA would have a positive impact on quantity or quality of available logs, but some (44%) believed it would lead to a decrease in cost of logs.
Figure 30 Views of native forest processors about effects of the TFA on log quantity, quality and cost in the
next 1 to 2 years
Those businesses that believed their log supply may be reduced in some way (quantity, quality etc) as a consequence of the TFA were asked the likelihood that they would source logs from either plantations or native forest. As can be seen in Figure 31, 27% reported they would consider sourcing logs from plantations, and 54% from private native forest (PNF).
Of the 13 businesses who reported they might source additional logs from PNF, six were unsure how much of their log supply they could source from PNF, four believed they could source 100% of their supply from PNF, and the remaining four estimated they could source between 10% and 50% of log supply from PNF.
Those who indicated they would be able to utilise more plantation grown timber were (i) woodchip mills, mostly already processing some plantation timber; and (ii) a small number of sawmills. Businesses were asked why they did or didn’t believe they would be able to source plantation timber as an alternative:

55
Those who believed they could utilise plantation logs in future to replace current use of native forest logs believed that current research and trials would lead to development of methods enabling them to use plantation timber (4), already utilised some plantation logs (2), or reported they ‘had no other option’ (1)
Those who believed they could not utilise plantation logs in future to replace current use of native forest logs mostly reported that plantation logs were not capable of being used for the type or quality of product they currently produce (13). Most of these (9) reported that plantation timber was not suitable for the markets they sell into, for example craftwood markets rely on special species timber that cannot be replaced with plantation; as do some markets for native forest eucalypt timber. Some (4) reported that milling technology was the main barrier to utilising plantation logs, rather than market barriers. A further two felt they would not be able to access plantation supply.
Figure 31 Native forest processor’s perceptions of the likelihood they will source logs from alternative
sources to replace logs sourced from public native forest

56
11. Conclusion
The result of the survey show that the rapid decline in forest industry activity between 2008 to 2011 has slowed considerably; the industry in 2013 could best be described as in a moderately stable state in which there was relatively little employment loss other than that associated with decline in native forest harvesting being implemented as part of the TFA. While business confidence remains low for some, there is a cautious optimism for many, who did not believe they were facing further decline in the next year, but rather stabilisation and, for some, a possibility of investment. However, this confidence is fragile and substantial investment in the industry is unlikely unless key issues are resolved, particularly security of contracts for harvest and haulage contractors, security of supply for processors, and having access to stable markets that enable a profitable return across the industry. Key issues that will affect this include the outcomes of sale processes for hardwood plantations; changes in government forest industry policy; and trends in market demand and production costs.

57
12. References
ABARES. 2013. Australian Forest and Wood Product Statistics March and June quarters 2013. Australian Bureau of Agricultural and Resource Economics and Sciences, Canberra.
Dare, L. and Eversole, R. 2012. Forest certification of Tasmania’s private forests: exploring the understanding and intent of Tasmanian non-industrial private forest growers towards the adoption of forest certification. Report prepared for Private Forests Tasmania. November 2012. Institute for Regional Development, University of Tasmania, Burnie
Ferguson, M. 2013 Review of the Tasmanian private hardwood plantation estate. Report available from http://www.pft.tas.gov.au/images/Review_of_the_Tasmanian_Private_Hardwood_Plantation_Estate_2013.pdf
Private Forests Tasmania. 2013. Annual Report. PFT, Hobart.
Schirmer, J. 2012. Assessment of the employment and economic consequences of change in access to Tasmania’s publicly owned native forests: overview of methodology. Appendix 2 to Socio-economic report of the Tasmanian Independent Verification Group. February 26th 2012. URL: http://www.environment.gov.au/land/forests/independent-verification/pubs/ivg_socioeconomic_appendix2r.pdf
Schirmer, J., Dunn, C., Loxton, E., and Dare, M. 2011. Socioeconomic impacts of forest industry change: a baseline study of the Tasmanian forest industry. CRC for Forestry Technical Report 214: Interim report. CRC for Forestry, Hobart. http://www.crcforestry.com.au/publications/downloads/TR214_Schirmer_Socioeconomic-impacts-interim-compiled.pdf
Loxton, E., Schirmer. J, and Dare, M. 2011. Structural adjustment assistance in the Australian forest industry: A review of recent experience and recommendations for best practice design of future structural adjustment packages. CRC for Forestry Technical Report 208. CRC for Forestry, Hobart. http://www.crcforestry.com.au/publications/downloads/TR208-compiled-for-online.pdf
Schirmer, J. 2010. Tasmania’s forest industry: trends in forest industry employment and turnover, 2006 to 2010. CRC for Forestry Technical Report 206. November 2010. CRC for Forestry, Hobart. http://www.crcforestry.com.au/research/programme-four/communities/socio-economic.html
Schirmer, J., Loxton, E. and Campbell-Wilson, A. 2008. Monitoring the social and economic impacts of forestry: A case study of North East Tasmania. Department of Agriculture, Fisheries and Forestry, Canberra. URL: http://www.daff.gov.au/forestry/national/monitoring_the_social_and_economic_impacts_of_forestry
Schirmer, J. 2008. Forestry, jobs and spending: forest industry employment and expenditure in Tasmania, 2005-06. CRC for Forestry Technical Report 184, June 2008. CRC for Forestry, Hobart. URL: http://www.crcforestry.com.au/research/programme-four/communities/socio-economic.html

58
Appendix 2: Forest industry employment by local government area (more detailed information)
This Appendix provides more detailed data on forest industry employment by local government area, and how this employment has changed over time. Table A2.1 shows the number of people employed in the industry over time by local government area and the percentage change over time for two periods – 2008 to 2011, and 2011 to 2013. These two periods are shown as (i) employment in the industry reached its most recent peak in 2008, and has declined since, and (ii) the most recent data produced prior to this report were for 2011, so it was considered useful to show trends since that time separately to trends occurring prior to 2011. Table A2.2 shows the proportion of employed people who worked directly in the forest industry by local government area, and also shows change over time.
Table A2.1 Trends in forest industry employment by local government area, 2006 to 2013
Local government area
Total number of forest industry workers living in local government area
% change in forest industry jobs, 2008-2011
% change in forest industry jobs, 2011-13 Aug 2006 Aug 2008 Sep 2010 May 2011 Nov 2013
Break O'Day 51 61 54 35 39 -42.4% 10.7%
Brighton 197 212 193 230 216 8.2% -6.0%
Burnie 455 461 206 124 139 -73.1% 11.9%
Central Coast 249 271 248 64 54 -76.4% -15.7%
Central Highlands 222 133 101 86 61 -35.4% -28.7%
Circular Head 270 282 256 223 194 -20.9% -13.0%
Clarence 130 143 90 68 63 -52.8% -7.0%
Derwent Valley 325 329 203 188 184 -42.9% -2.1%
Devonport 273 300 240 160 54 -46.9% -66.1%
Dorset 584 599 357 215 234 -64.2% 9.1%
George Town 116 86 82 71 29 -17.7% -59.0%
Glamorgan-Spring Bay 184 193 123 60 7 -68.7% -88.4%
Glenorchy 242 265 152 127 118 -52.1% -6.9%
Hobart 200 176 154 126 118 -28.4% -6.6%
Huon Valley 237 316 262 212 177 -33.0% -16.4%
Kentish 112 139 87 63 10 -54.5% -84.2%
Kingborough 56 60 24 25 28 -58.1% 10.7%
Latrobe 135 135 10 6 7 -95.8% 24.4%
Launceston 919 945 642 466 461 -50.7% -1.1%
Meander Valley 386 449 266 196 138 -56.3% -29.5%
Northern Midlands 150 152 118 100 57 -34.6% -42.8%
Sorell & Tasman 232 260 203 111 31 -57.3% -72.1%
Southern Midlands 128 207 95 84 4 -59.2% -95.3%
Waratah-Wynyard 309 321 193 135 55 -58.0% -59.2%
West Coast 21 25 22 17 14 -30.3% -18.3%
West Tamar 270 367 173 125 52 -65.9% -58.5%
Note: In each year, a small number of jobs could not be allocated to a specific local government area (typically around 140-170 jobs in total). Thus the total for all LGAs is slightly smaller than the total estimated employment in the forest industry.

59
Table A2.2 Proportion of employed labour force working in forest industry, by local government area, 2006
to 2013
Local government area
% employed labour force working in forest industry % change in forest industry jobs, 2008-2011
Change in % of labour force employed in forest industry, 2011-2013 Aug 2006 Aug 2008 Sep 2010 May 2011 Nov 2013
Break O'Day 2.4 2.6 2.3 1.7% 1.9% -0.9% 0.2%
Brighton 3.4 3.6 3.2 3.8% 3.6% 0.2% -0.2%
Burnie 5.6 5.5 2.3 1.6% 1.7% -3.9% 0.2%
Central Coast 2.8 2.9 2.5 0.7% 0.6% -2.2% -0.1%
Central Highlands 24.2 13.5 10.1 10.3% 7.3% -3.2% -2.9%
Circular Head 6.8 6.8 5.9 6.1% 5.3% -0.7% -0.8%
Clarence 0.5 0.6 0.4 0.3% 0.3% -0.3% 0.0%
Derwent Valley 8.4 7.9 4.8 4.8% 4.7% -3.1% -0.1%
Devonport 2.7 2.8 2.2 1.6% 0.5% -1.2% -1.1%
Dorset 19 17.6 10.6 8.0% 8.7% -9.6% 0.7%
George Town 4.7 3.1 2.9 2.9% 1.2% -0.2% -1.7%
Glamorgan-Spring Bay 9.9 9.8 6.1 3.7% 0.4% -6.1% -3.3%
Glenorchy 1.2 1.3 0.7 0.7% 0.6% -0.6% 0.0%
Hobart 0.8 0.7 0.6 0.5% 0.5% -0.2% 0.0%
Huon Valley 4.1 4.9 4 3.4% 2.9% -1.5% -0.6%
Kentish 4.5 5.4 3.2 2.5% 0.4% -2.9% -2.1%
Kingborough 0.4 0.4 0.1 0.2% 0.2% -0.2% 0.0%
Latrobe 3.4 3.2 0.2 0.1% 0.2% -3.1% 0.0%
Launceston 3.2 3 2 1.6% 1.6% -1.4% 0.0%
Meander Valley 4.4 4.6 2.8 2.3% 1.6% -2.3% -0.7%
Northern Midlands 2.7 2.5 2 1.8% 1.1% -0.7% -0.8%
Sorell & Tasman 3.6 3.8 2.9 1.6% 0.5% -2.2% -1.2%
Southern Midlands 5 7.6 3.4 3.3% 0.2% -4.3% -3.2%
Waratah-Wynyard 5.6 5.5 3.1 2.4% 1.0% -3.1% -1.4%
West Coast 1 1.1 0.9 0.9% 0.7% -0.2% -0.2%
West Tamar 2.8 3.4 1.6 1.3% 0.5% -2.1% -0.7%